1. Introduction
Maintenance of ventilatory function in young adults is important to reduce the risk of its excessive decline later in life [
1]. Ventilatory function, measured by forced expiratory volume in one second (FEV
1) or forced vital capacity (FVC), is a strong predictor of all-cause [
2] and cardiovascular mortality [
3,
4]. Similarly, poor ventilatory function in adults has been related to the development of chronic obstructive pulmonary disease (COPD), which currently represents the third cause of mortality worldwide [
5].
Dietary intake might contribute to the preservation of ventilatory function in adults. Observational studies suggest that a higher dietary intake of antioxidants, or a diet rich in fresh vegetables and fruits, is associated with better lung function in the general population [
6,
7,
8,
9,
10]. Epidemiological studies looking at the effect of the whole diet (dietary patterns) have shown that intake of a diet rich in fruit, vegetable, fish, and wholemeal cereal (referred to by some as a “prudent diet”) is related to a better ventilatory function [
11]. Most studies however, have explored either the association with single nutrients, small food groups or dietary patterns, which can limit the scope of interpretation of the effect of diet on lung health.
Chile is a country where the prevalence of chronic respiratory diseases is similar to that observed in more developed nations [
12], but that like other South American countries, dietary customs and the availability of food may differ from those of Europe and the United States. To date no evidence has been obtained on the possible association between dietary antioxidants and measures of ventilatory function in adults from Latin America. Investigating the possible protective effect of dietary antioxidants on lung health in young adults might provide evidence on early prevention of rapid ventilatory function decline later in life.
This study investigates the association between ventilatory function (spirometry) and dietary intake of antioxidant nutrients in a representative sample of young adults from Central Chile. We explored this association at nutrient, food and whole diet level. For the latter, using Principal Component Analysis (PCA) we aimed to investigate two established hypothesis in the field of diet and lung function: an a priori approach of an association of dietary antioxidants with lung function, as well as a posterior approach in terms of an association of dietary patterns with lung function.
3. Results
Of the 1232 participants, 1187 (96.3%) produced a satisfactory manoeuvre for FEV
1 and FVC, and had complete FFQ data. The mean BMI was 24.6 kg/m
2 and 24.7 kg/m
2 in men and women, respectively. Smoking was common, with over two thirds of males and half of females reporting being current smokers (
Table 1).
The average TEI was above the estimated average recommendation (EAR) per day. Carbohydrates were the main source of energy, accounting for nearly 60% of TEI in both men and women (
Table 2). Total lipid intake represented a quarter of the TEI. The intake ratio of omega 6 to omega 3 was 33:1. The average intake of total fruits and vegetables was equivalent to 2 and 4 portions per day, respectively. Intake of antioxidant vitamins and minerals was within recommended values. Intake of vitamins and minerals met the daily recommended nutritional intake (RNI) with the exception of selenium that was 82% and 50% of the RNI in men and women, respectively.
The association between outcomes of ventilatory function and intake of flavonoids, antioxidant nutrients and polyunsaturated fatty acids (omega 3 and omega 6) is shown in
Table 3. A better FEV
1 and FVC were positively associated with intake of omega 3 fatty acids (β-coefficient for highest
vs. lowest quintile of omega 3 intake 0.08 (L); 95% confidence interval 0.005 to 0.15; and β-coefficient 0.08 (L), 95% confidence interval 0.001 to 0.16), respectively. An 80 mL higher FVC was observed in those in the highest
vs. the lowest quintile of total flavonols, whilst a 70 mL higher FVC was observed in those in the highest quintile of catechin intake compared to the lowest (adjusted
p per trend 0.006). There was no clear association between the spirometric outcomes studied and antioxidant vitamins or minerals.
Table 4 shows the association between ventilatory function and intake of fruits and vegetables. We found a statistically significantly positive relationship between FVC and total intake of fruits (β-coefficient 0.08; 95% confidence interval 0.003 to 0.15). No associations were observed between spirometric outcomes and total intake of vegetables. After controlling for multiple testing (Simes’ procedure) only the associations between FVC with total fruit intake, and with catechins remained statistically significant.
Table 1.
General and respiratory characteristics of participants.
Table 1.
General and respiratory characteristics of participants.
| Variable | Males (n = 542) | Females (n = 645) |
|---|
| Age and anthropometric variables |
| Age (years) Mean (SD) | 24.6 (1.4) | 24.7 (1.5) |
| Adult weight (kg) Median (IQR) | 70.1 (63.0 to 77.9) | 61.5 (54.9 to 70.0) |
| Adult height (cm) Mean (SD) | 168.1 (6.1) | 156.3 (5.5) |
| BMI (kg/m2) Median (IQR) | 24.7 (22.6 to 27.2) | 25.1 (22.6 to 28.6) |
| Weight at birth (g) Mean (SD) | 3184 (488.2) | 3192 (508.0) |
| Measurements of lung function (Mean (SD)) |
| FEV1 (L) † | 4.12 (0.53) | 3.09 (0.38) |
| FEV1 as % of predicted value for age, height and sex | 105.2 (10.91) | 105.3 (10.69) |
| FVC (L) | 4.78 (0.63) | 3.53 (0.44) |
| FVC as % of predicted value for age, height and sex | 104.9 (7.3) | 103.2 (8.5) |
| FEV1/FVC | 0.86 (0.047) | 0.88 (0.048) |
| Bronchial hyper-responsiveness (BHR) as positive response to methacholine challenge (16 mg/mL) % | 6.3 | 15.5 |
| Wheeze in the last 12 months (%) | 26.3 | 28.4 |
| Ever had asthma (%) | 3.1 | 5.9 |
| Dr diagnosed asthma (%) | 2.6 | 5.4 |
| 12 years of full time education (%) | 50.0 | 50.0 |
| Number of household belongings (as estimation of SES) (N (%)) |
| 0 or 1 | 75 (13.8) | 93 (14.3) |
| 2 | 164 (30.2) | 223 (34.4) |
| 3 | 173 (31.9) | 211 (32.5) |
| 4 or 5 | 131 (24.1) | 122 (18.8) |
Table 2.
Daily average dietary intake of foods and antioxidants.
Table 2.
Daily average dietary intake of foods and antioxidants.
| Energy and Nutrients | Males | % TEI | % EAR | % RNI | Females | % TEI | % EAR | % RNI |
|---|
| Median [IQR] | Median [IQR] |
|---|
| Total Fruits (g) | 182.5 [92.0–210.8] | | | | 175.3 [87.4–205.2] | | | |
| Total vegetables (g) | 432.4 [390.8–462.0] | | | | 345.2 [294.8–401.6] | | | |
| Total energy intake (TEI) (kcal) | 3439 [2665.0–4415.0] | | 134.9 | | 2279 [1170.0–2844.0] | | 117.5 | |
| Proteins (g) | 129.6 [98.4–163.3] | 18.2 | 292 | | 92.1 [71.0–118.1] | 15.4 | 256 | |
| Carbohydrates (g) | 502.6 [385.1–625.2] | 58.5 | 136.0 | | 328.8 [254.4–427.8] | 57.7 | 138.0 | |
| Total lipids (g) | 97.9 [71.1–137.6] | 23.3 | 73.1 | | 66.1 [48.2–91.9] | 26.9 | 74.6 | |
| PUFA (g) | 26.2 [18.3–36.1] | 6.9 | 106.2 | | 18.7 [13.3–25.5] | 7.4 | 113.8 | |
| MUFA (g) | 36.6 [25.5–55.1] | 9.6 | 73.8 | | 23.3 [16.7–35.5] | 9.2 | 70.8 | |
| SFA (g) | 26.1 [18.9–38.1] | 6.8 | 61.8 | | 17.1 [11.7–25.1] | 6.8 | 61.8 | |
| Omega 3 (g) | 0.24 [0.1–0.5] | 0.06 | 1.2 | | 0.2 [0.1–0.4] | 0.08 | 4.0 | |
| Omega 6 (g) | 11.9 [7.7–17.0] | 3.1 | 310 | | 8.5 [5.8–13.1] | 3.4 | 340 | |
| Carotene (µg) | 1027.0 [585.6–1707.0] | | | 98 | 1107.1 [681.2–1876.8] | | | 96 |
| Total vitamin A (µg) | 1412.3 [854.4–2121.7] | | | 155 | 1374.5 [891.7–2328.9] | | | 250 |
| Vitamin C (mg) | 133.3 [84.9–235.1] | | | 221 | 138.7 [81.7–229.2] | | | 230 |
| Vitamin E (mg) | 19.6 [14.2–26.3] | | | 131 | 15.2 [10.9–19.7] | | | 100 |
| Selenium (μg) | 163.8 [119.9–203.2] | | | 82 | 100.6 [77.5–129.7] | | | 50 |
| Zinc (mg) | 11.8 [9.2–14.7] | | | 100 | 9.5 [7.2–10.9] | | | 119 |
| Total catechins (mg) | 17.1 [7.8–64.4] | | | NA | 21.2 [9.3–68.5] | | | NA |
| Flavonols (mg) | 26.2 [15.7–44.3] | | | NA | 24.7 [12.7–41.3] | | | NA |
| Flavones (mg) | 0.1 [0.04–0.2] | | | NA | 0.1 [0.03–0.2] | | | NA |
Table 3.
The association between components of ventilatory function and estimated daily nutrient and antioxidant intake *.
Table 3.
The association between components of ventilatory function and estimated daily nutrient and antioxidant intake *.
| Nutrient | Quintiles | FEV1 (L) | FVC (L) | FEV1/FVC |
|---|
| Difference of Means (95% CI) |
|---|
| Vitamin C (mg) | 1 | 0 | 0 | 0 |
| 2 | −0.05 (−0.12 to 0.01) | −0.10 (−0.14 to 0.014) | −0.0002 (−0.01 to 0.01) |
| 3 | −0.002 (−0.07 to 0.07) | 0.04 (−0.04 to 0.12) | −0.01 (−0.02 to −0.0005) |
| 4 | 0.004 (−0.06 to 0.07) | 0.02 (−0.10 to 0.10) | −0.002 (−0.01 to 0.007) |
| 5 | −0.02 (−0.09 to 0.06) | −0.01 (−0.09 to 0.07) | −0.003 (−0.01 to 0.007) |
| p for trend | 0.75 | 0.47 | 0.44 |
| Vitamin E (mg) | 1 | 0 | 0 | 0 |
| 2 | −0.06 (−0.13 to 0.01) | −0.07 (−0.15 to 0.01) | 0.002 (−0.006 to 0.01) |
| 3 | −0.004 (−0.08 to 0.07) | 0.02 (−0.06 to 0.10) | −0.004 (−0.01 to 0.005) |
| 4 | −0.02 (−0.09 to 0.06) | −0.01 (−0.10 to 0.07) | −0.0002 (−0.01 to 0.01) |
| 5 | 0.01 (−0.08 to 0.09) | 0.04 (−0.05 to 0.14) | −0.01 (−0.02 to 0.01) |
| p for trend | 0.61 | 0.23 | 0.32 |
| Total vitamin A (μg) | 1 | 0 | 0 | 0 |
| 2 | 0.06 (−0.004 to 0.13) | 0.05 (−0.03 to 0.13) | 0.006 (−0.003 to 0.015) |
| 3 | 0.04 (−0.03 to 0.11) | 0.06 (−0.02 to 0.14) | −0.004 (−0.013 to 0.004) |
| 4 | 0.01 (−0.06 to 0.08) | 0.04 (−0.04 to 0.11) | −0.004 (−0.013 to 0.005) |
| 5 | 0.02 (−0.06 to 0.09) | 0.03 (−0.05 to 0.11) | −0.001 (−0.01 to 0.008) |
| p for trend | 0.78 | 0.65 | 0.19 |
| Selenium (μg) | 1 | 0 | 0 | 0 |
| 2 | −0.01 (−0.08 to 0.06) | 0.01 (−0.07 to 0.09) | −0.003 (−0.01 to 0.01) |
| 3 | −0.04 (−0.11 to 0.03) | −0.04 (−0.12 to 0.05) | −0.001 (−0.01 to 0.01) |
| 4 | −0.06 (−0.14 to 0.03) | −0.02 (−0.012 to 0.07 | −0.01 (−0.02 to 0.003) |
| 5 | −0.02 (−0.13 to 0.09) | 0.06 (−0.06 to 0.18) | −0.01 (−0.03 to 0.0001) |
| p for trend | 0.30 | 0.90 | 0.09 |
| Zinc (mg) | 1 | 0 | 0 | 0 |
| 2 | 0.02 (−0.05 to 0.09) | −0.001 (−0.08 to 0.08) | 0.01 (−0.003 to 0.01) |
| 3 | −0.05 (−0.12 to 0.03) | −0.04 (−0.12 to 0.04) | −0.002 (−0.01 to 0.01) |
| 4 | −0.01 (−0.09 to 0.07) | 0.05 (−0.09 to 0.13) | −0.01 (−0.02 to 0.0001) |
| 5 | 0.01 (−0.09 to 0.11) | 0.02 (−0.09 to 0.13) | −0.001 (−0.01 to 0.01) |
| p for trend | 0.82 | 0.48 | 0.14 |
| Omega 3 fatty acids (mg) | 1 | 0 | 0 | 0 |
| 2 | 0.04 (−0.03 to 0.11) | 0.05 (−0.02 to 0.13) | −0.003 (−0.01 to 0.01) |
| 3 | 0.05 (−0.02 to 0.11) | 0.04 (−0.04 to 0.12) | 0.002 (−0.001 to 0.01) |
| 4 | 0.08 (0.01 to 0.14) | 0.08 (0.003 to 0.16) | 0.002 (−0.01 to 0.01) |
| 5 | 0.08 (0.005 to 0.15) | 0.08 (0.001 to 0.16) | 0.001 (−0.01 to 0.01) |
| p for trend | 0.02 | 0.04 | 0.52 |
| Omega 6 fatty acids (mg) | 1 | 0 | 0 | 0 |
| 2 | −0.08 (−0.14 to −0.01) | −0.08 (−0.15 to 0.001) | −0.002 (−0.1 to 0.01) |
| 3 | −0.03 (−0.10 to 0.04) | −0.28 (−0.11 to 0.05) | −0.003 (−0.01 to 0.01) |
| 4 | −0.01 (−0.08 to 0.10) | −0.001 (−0.08 to 0.08) | −0.002 (−0.01 to 0.007) |
| 5 | −0.005 (−0.08 to 0.07) | 0.01 (−0.07 to 0.09) | −0.002 (−0.01 to 0.007) |
| p for trend | 0.51 | 0.41 | 0.73 |
| Flavones (mg) | 1 | 0 | 0 | 0 |
| 2 | 0.01 (−0.05 to 0.08) | 0.01 (−0.06 to 0.09) | −0.001 (−0.01 to 0.01) |
| 3 | 0.02 (−0.05 to 0.09) | 0.004 (−0.07 to 0.08) | 0.002 (−0.01 to 0.01) |
| 4 | −0.002 (−0.07 to 0.07) | 0.003 (−0.07 to 0.08) | −0.002 (−0.01 to 0.01) |
| 5 | 0.01 (−0.06 to 0.07) | 0.01 (−0.06 to 0.09) | −0.001 (−0.01 to 0.01) |
| p per trend | 0.96 | 0.85 | 0.77 |
| Flavonols (mg) | 1 | 0 | 0 | |
| 2 | 0.07 (0.003 to 0.14) | 0.09 (0.01 to 0.16) | 0.001 (−0.01 to 0.01) |
| 3 | 0.05 (−0.02 to 0.12) | 0.06 (−0.01 to 0.14) | −0.001 (−0.01 to 0.01) |
| 4 | 0.05 (−0.02 to 0.12) | 0.07 (−0.004 to 0.15) | −0.002 (−0.01 to 0.01) |
| 5 | 0.08 (0.01 to 0.16) | 0.10 (0.02 to 0.18) | 0.002 (−0.01 to 0.01) |
| p for trend | 0.08 | 0.05 | 0.99 |
| Total catechins (mg) | 1 | 0 | 0 | 0 |
| 2 | −0.04 (−0.11 to 0.03) | −0.04 (−0.13 to 0.03) | 0.0003 (−0.01 to 0.01) |
| 3 | 0.03 (−0.03 to 0.11) | 0.06 (−0.02 to 0.13) | −0.01 (−0.02 to 0.003) |
| 4 | 0.04 (−0.03 to 0.11) | 0.08 (0.003 to 0.16) | −0.01 (−0.02 to 0.002) |
| 5 | 0.04 (−0.03 to 0.11) | 0.07 (0.01 to 0.15) | −0.01 (−0.01 to 0.004) |
| p for trend | 0.06 | 0.006 | 0.09 |
Table 4.
The association between ventilatory function and estimated daily intake of fruits and vegetables rich in antioxidants *.
Table 4.
The association between ventilatory function and estimated daily intake of fruits and vegetables rich in antioxidants *.
| Food Group | Quintiles | FEV1 (L) | FVC (L) | FEV1/FVC |
|---|
| Difference of Means (95% CI) |
|---|
| Total fruits (g) | 1 | 0 | | 0 |
| 2 | −0.02 (−0.09 to 0.05) | −0.01 (−0.09 to 0.06) | −0.004 (−0.01 to 0.01) |
| 3 | 0.03 (−0.04 to 0.10) | 0.04 (−0.04 to 0.11) | −0.002 (−0.01 to 0.004) |
| 4 | 0.02 (−0.05 to 0.09) | 0.05 (−0.03 to 0.12) | −0.005 (−0.01 to 0.004) |
| 5 | 0.05 (−0.02 to 0.12) | 0.08 (0.003 to 0.15) | −0.005 (−0.01 to 0.003) |
| p for trend | 0.09 | 0.02 | 0.23 |
| Total vegetables (g) | 1 | 0 | 0 | 0 |
| 2 | 0.03 (−0.04 to 0.10) | 0.02 (−0.06 to 0.09) | 0.004 (−0.01 to 0.01) |
| 3 | 0.01 (−0.06 to 0.08) | 0.05 (−0.03 to 0.13) | −0.01 (−0.02 to 0.002) |
| 4 | 0.01 (−0.06 to 0.08) | 0.05 (−0.03 to 0.13) | −0.01 (−0.02 to 0.0002) |
| 5 | 0.03 (−0.05 to 0.10) | 0.05 (−0.04 to 0.13) | −0.002 (−0.01 to 0.007) |
| p for trend | 0.74 | 0.17 | 0.10 |
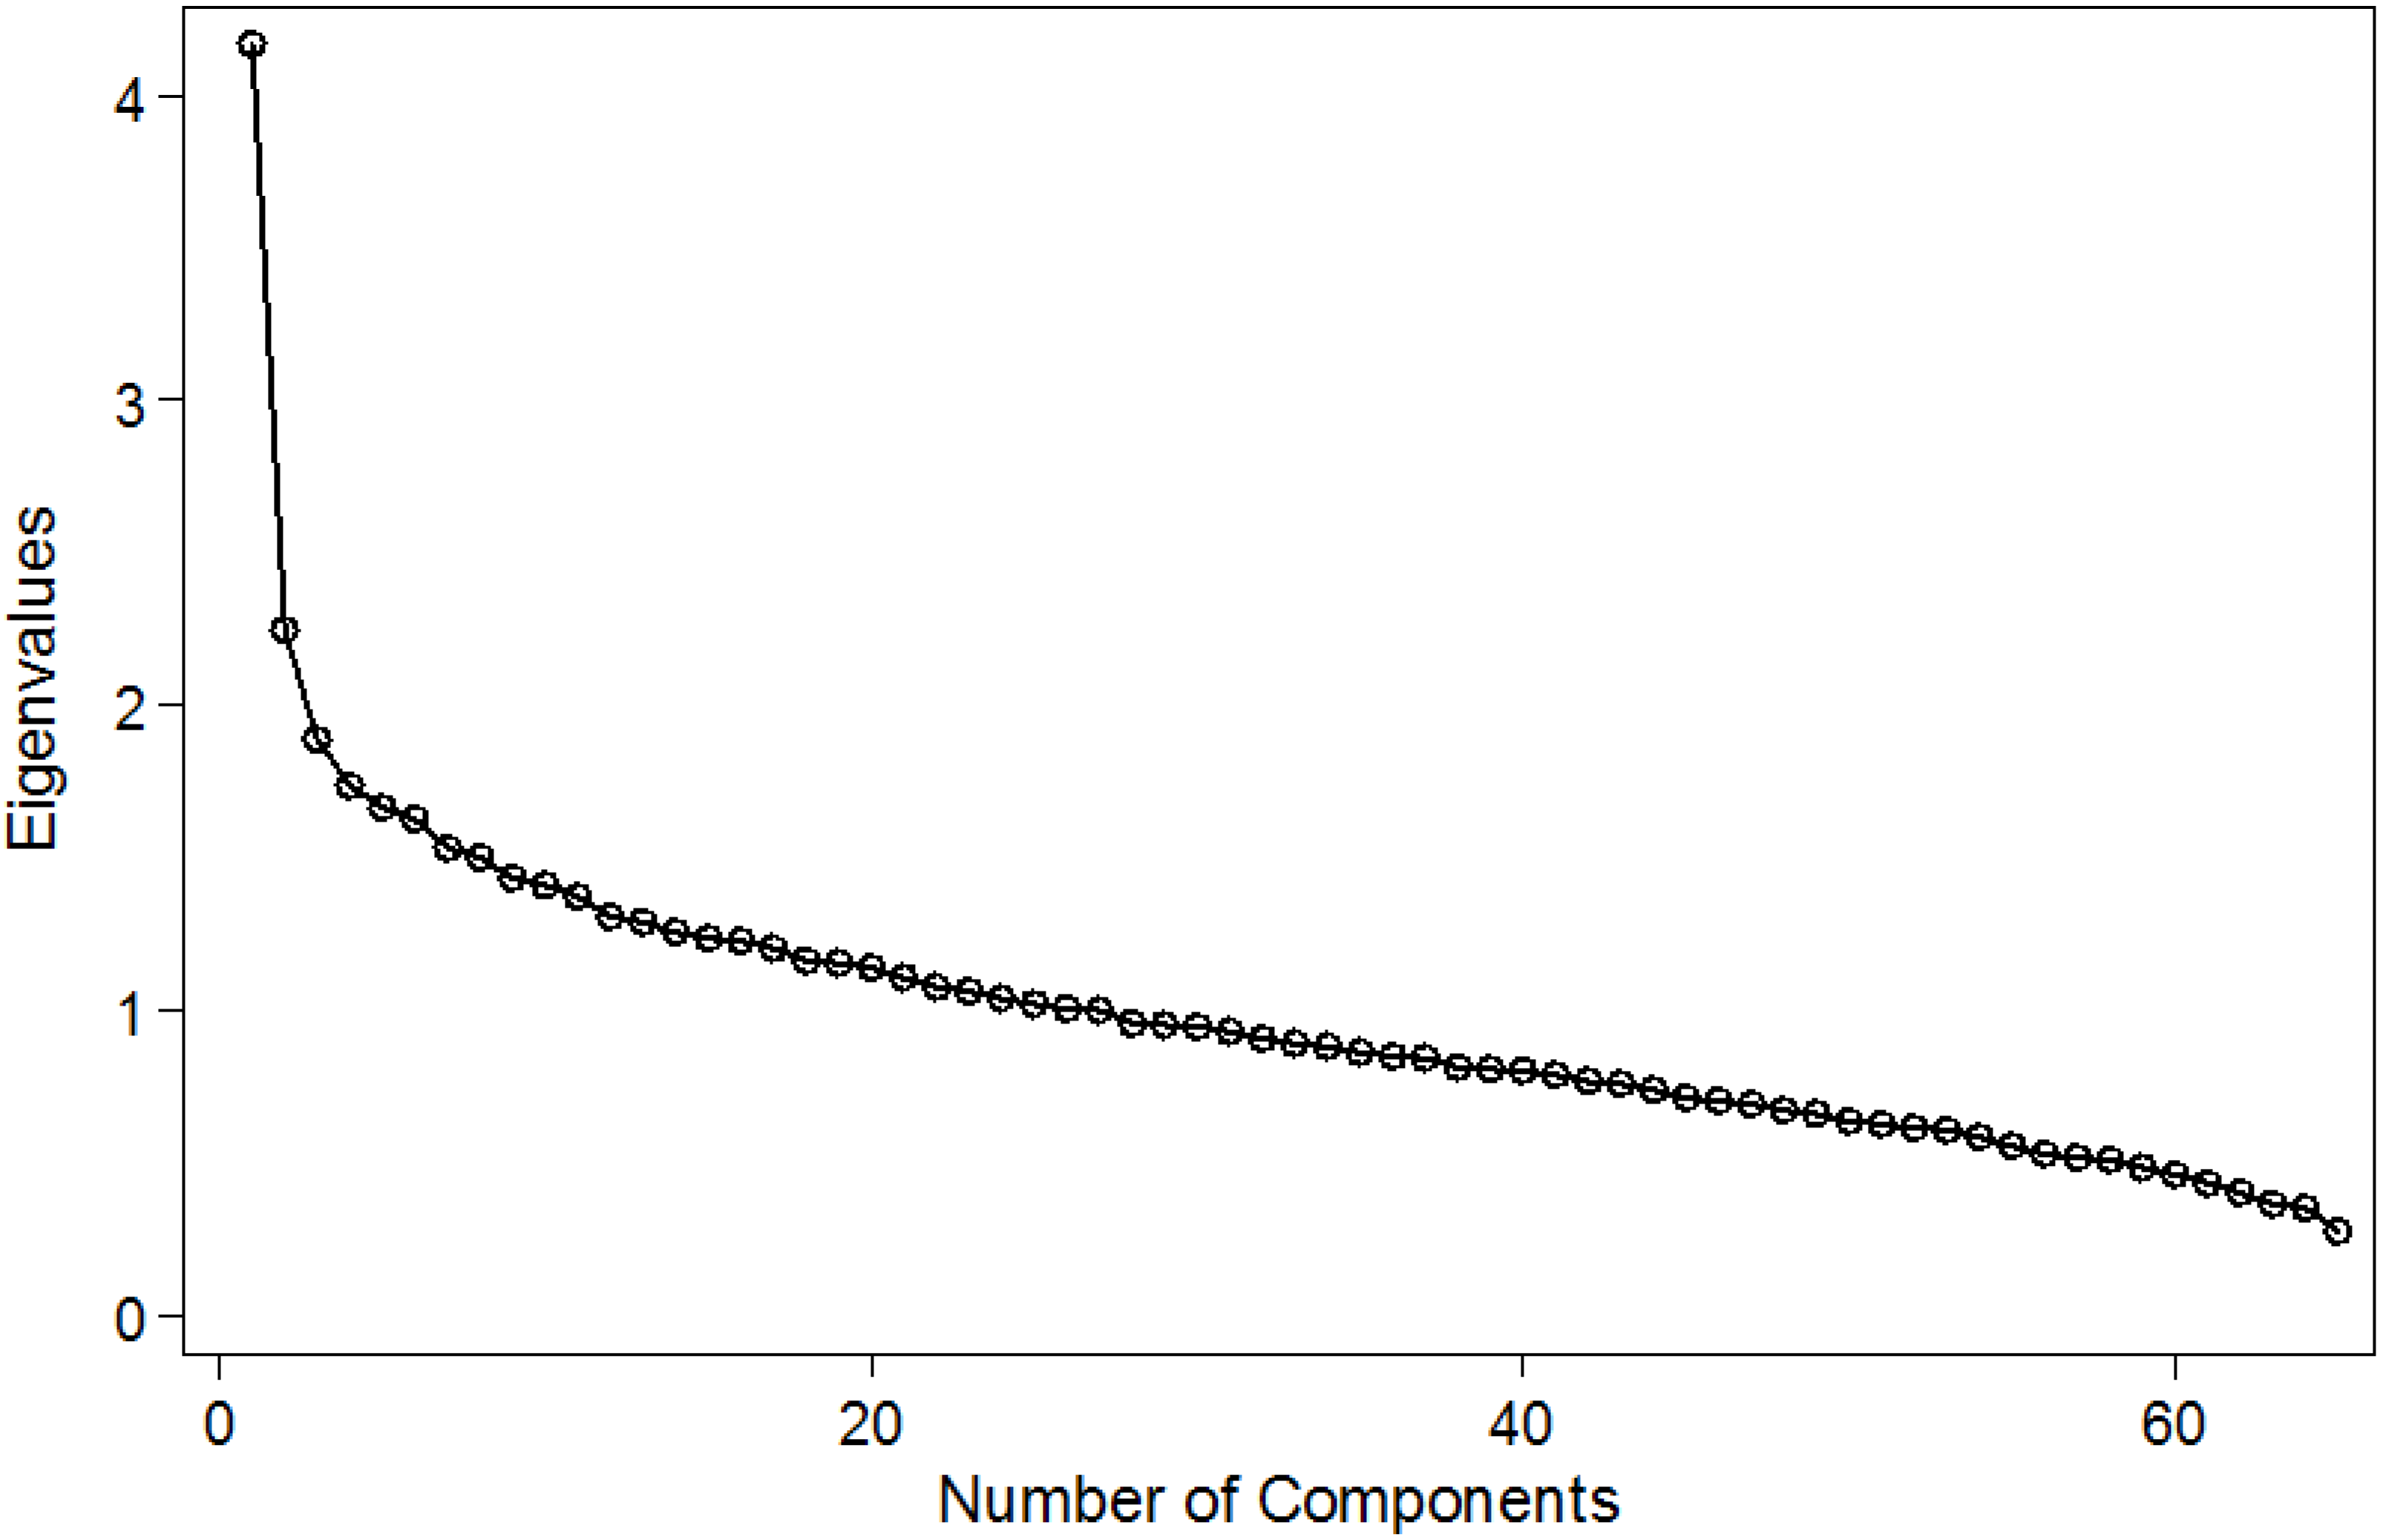
PCA identified two patterns in these adults, which explained 24.7% of the variance in the original 65 food items (
Figure A1 in Appendix). One dietary pattern was highly correlated with animal proteins and starchy food, and the second was characterised by fruits and vegetables (data not shown but available from the authors). The logistic regressions between each pattern and the three respiratory outcomes showed no association (
Table 5).
Table 5.
Association between quintiles of dietary patterns and ventilatory capacity *.
Table 5.
Association between quintiles of dietary patterns and ventilatory capacity *.
| Lung Function | Quintiles of Dietary Patterns | Unadjusted Odds Ratio (SE) | Adjusted Odds Ratio (SE) |
|---|
| FEV1 | “Animal proteins and starchy foods” | | |
| 1 | 0 | 0 |
| 2 | 0.10 (0.06) | −0.05 (0.04) |
| 3 | 0.30 (0.06) | −0.02 (0.04) |
| 4 | 0.62 (0.06) | −0.01 (0.04) |
| 5 | 0.75 (0.05) | −0.04 (0.05) |
| p for trend | <0.0001 | 0.78 |
| “Fruits and vegetables” | | |
| 1 | 0 | 0 |
| 2 | −0.0001 (0.06) | 0.03 (0.04) |
| 3 | −0.12 (0.06) | −0.03 (0.04) |
| 4 | −0.04 (0.06) | 0.03 (0.04) |
| 5 | −0.09 (0.01) | 0.03 (0.04) |
| p for trend | 0.11 | 0.48 |
| FVC | “Animal proteins and starchy foods” | | |
| 1 | 0 | 0 |
| 2 | 0.14 (0.07) | −0.05 (0.04) |
| 3 | 0.37 (0.07) | −0.008 (0.04) |
| 4 | 0.79 (0.07) | 0.01 (0.05) |
| 5 | 0.94 (0.07) | −0.03 (0.06) |
| p for trend | <0.0001 | 0.93 |
| “Fruits and vegetables” | | |
| 1 | 0 | 0 |
| 2 | −0.008 (0.07) | 0.03 (0.04) |
| 3 | −0.12 (0.07) | −0.008 (0.85) |
| 4 | −0.01 (0.07) | 0.07 (0.04) |
| 5 | −0.10 (0.07) | 0.05 (0.04) |
| p for trend | 0.21 | 0.14 |
| FEV1/FVC | “Animal proteins and starchy foods” | | |
| 1 | 0 | 0 |
| 2 | −0.05 (0.004) | −0.003 (0.004) |
| 3 | −0.008 (0.004) | −0.003 (0.005) |
| 4 | −0.02 (0.004) | −0.005 (0.005) |
| 5 | −0.02 (0.005) | −0.002 (0.007) |
| p for trend | <0.0001 | 0.54 |
| Ratio FEV1/FVC | “Fruits and vegetables” | | |
| 1 | 0 | 0 |
| 2 | 0.003 (0.004) | 0.002 (0.004) |
| 3 | −0.002 (0.004) | −0.004 (0.004) |
| 4 | −0.005 (0.005) | −0.006 (0.005) |
| 5 | 0.002 (0.005) | −0.001 (0.005) |
| p for trend | <0.0001 | 0.37 |
4. Discussion
In this population-based study of young adults, we have found that a better FVC was positively associated with a higher intake of total catechins and of fresh fruits. There was also a positive association between ventilatory function and omega 3 fatty acids but it lost statistical significance after adjustment for multiple comparisons.
Nutrient estimates were obtained from the Chilean Food Composition Table, as an attempt to ascertain local nutrient composition data. Although we used a software based on values from the USDA Food Composition Table, we also used nutrient data calculated from Chilean foods, particularly on fresh vegetables and fruits. Most studies in developing countries rely on larger nutrient datasets from the USA or the UK. We found that level of agreement between the Chilean and British Food Composition Tables were very high [
19].
Studies on the relationship between ventilatory function and dietary exposures in Latin American adults (or children) are still lacking. This is a public health challenge as the burden of COPD in these countries appears to be similar to that observed in developed countries [
23], and yet, the evidence on environmental risk factors is scant. Observational studies from countries with more advanced economies support our findings of a positive association between lung function and intake of fresh fruit. Strachan
et al. [
10] suggested in the early 90s that a lower intake of fresh fruit was related to a lower lung function (estimated as FEV
1) in adults, with the effect being observed in both smokers and life-long non-smokers. In a random sample from Scottish adults, Kelly and colleagues [
7] found that a higher intake of fresh fruits was related to a higher FEV
1. A recent case-control study showed that FEV
1 was statistically significantly lower as the dietary inflammatory index (DII) increased. A higher DII is a reflection of a reduced intake of fresh fruit and vegetables [
24].
Prospective studies in adults investigating how fruit intake might be related to lung function show that such an effect would appear to be more evident with changes in consumption of fruits rather than with a regular intake sustained in time [
9]. In a seven year follow-up of British adults, Carey and colleagues [
9] reported that a reduction in fruit intake was related to a more significant decline of lung function, measured as FEV
1. A more recent prospective study found that a higher intake of fresh fruit and some of the antioxidants commonly found in these foods would favour a slower decline in lung function (measured as FEV
1) in adults, the effect being considerable higher in smokers or ex-smokers [
25]. Contrary to these findings, Butland and colleagues [
8] showed that changes in apple intake were unrelated to FEV
1 after 10 years of follow-up in adults.
In spite of the growing molecular evidence of the benefits of flavonoids on lung structure [
26], epidemiological studies on the association between flavonoids and lung function is still scant. Our results of a positive association between catechins and lung function confirm those reported by Tabak and colleagues [
27], who reported a 130 mL higher FEV
1 in Dutch adults who had the highest
vs. lowest intakes of catechins. Evidence from molecular studies suggests these flavonoids may have a pivotal role in the pathogenesis of COPD, and to have multiple functions including antioxidant and anti-inflammatory properties [
28]. Catechins have been shown to directly stimulate the activity of the nuclear protein Sirtuin 1 (SIRT 1), which regulates a variety of physio-pathological processes in the lung epithelial cells including delaying cellular aging, resistance to oxidative stress, and anti-inflammation [
29]. Improving our understanding on the regulation of flavonoid metabolism and its regulation by genes would be a step closer to understanding the mechanisms by which flavonoids are involved in poor lung function and in the aetiology of COPD.
In our study population, the estimated daily intake of fish averaged 10 g per day, which is 30% less than the per capita intake of 5.1 kg/year described for the Chilean population [
30]. We found a positive association between FEV
1 and omega 3 fatty acid intake. We are cautious in the interpretation of this result as after controlling multiple testing, the association was no longer significant. However other observational studies have shown that individuals with a higher intake of omega 6 fatty acids and of isoflavonoids have a reduced risk of COPD [
31]. There is evidence that a higher intake of docosahexaenoic acid increases lung function in smokers, but this protective effect is not seen in heavy smokers [
32]. This raises the question of whether a higher intake of food sources rich in these compounds could ameliorate or delay the development of COPD by maintaining good lung function.
The use of dietary patterns to assess the relationship between diet and disease has been found on the theoretical conception that foods are not consumed in isolation but as meals, which form a dietary pattern. This observation has prompted several epidemiological studies to look at dietary patterns and respiratory diseases. The evidence on whole diet and lung function is still emerging. McKeever
et al. [
33] found a statistically significant reduction in FEV
1 in adults eating a “traditional” dietary pattern comprised mainly of potatoes and meat, whilst Shaheen and colleagues [
11] found that a “prudent” pattern, comprised of fruit, vegetables, fish and wholemeal cereals, was associated with an improved FEV
1 in adults.
In contrast to these studies we found no association between measures of ventilatory function and dietary patterns. One possibility for the discrepancy between the PCA analyses is that the patterns of the three studies did not include the same foods, and what researchers choose to define as “prudent” or “Western”, or “traditional” or “animal proteins and starchy food” might imply different food components. It is also possible that dietary patterns from adults in South America may not align with those of European countries, as dietary habits are known to be different between these populations.
The assessment of lung function in our study followed a rigorous standardised protocol, providing reliable data on spirometric values. The response rate was high and participants were representative of the area where the research took place. Whilst FFQs are known to have measurement errors, which usually lead to overestimations of the net dietary intake, the FFQ used in this population was designed a priori to take into account the hypothesis we were testing on effect of dietary intake of antioxidants and poor lung function in young adults. Therefore, the list of 65 food items included was mainly concerned with foods with known antioxidant content of vitamins or flavonoids available in this region, as well as foods that are part of the usual diet of Chilean adults.
This is a cross-sectional study with limited ability to infer causality. The dietary intake was self-reported and this might lead to under- or over-reporting of actual intake. In spite of these limitations, the consistency of our findings with recent findings from prospective observational [
25] and long term intervention studies [
34] showing a protective effect of a higher intake of fresh fruits on adult lung function, would lend support to a possible causal interpretation. We believe that the weak association reported between vegetable intake, omega 3 fatty acids, and lung function outcomes deserves further exploration. We have erred in the side of caution in the analysis because the FFQ has a margin of measurement error and our adjustment for several potential confounders and for multiple comparisons, greatly reduced the chance to find significant associations.


