Vitamin B12 in Obese Adolescents with Clinical Features of Insulin Resistance


Abstract
:1. Introduction
2. Experimental Section
2.1. Subjects
2.2. Assessment
2.3. Statistics
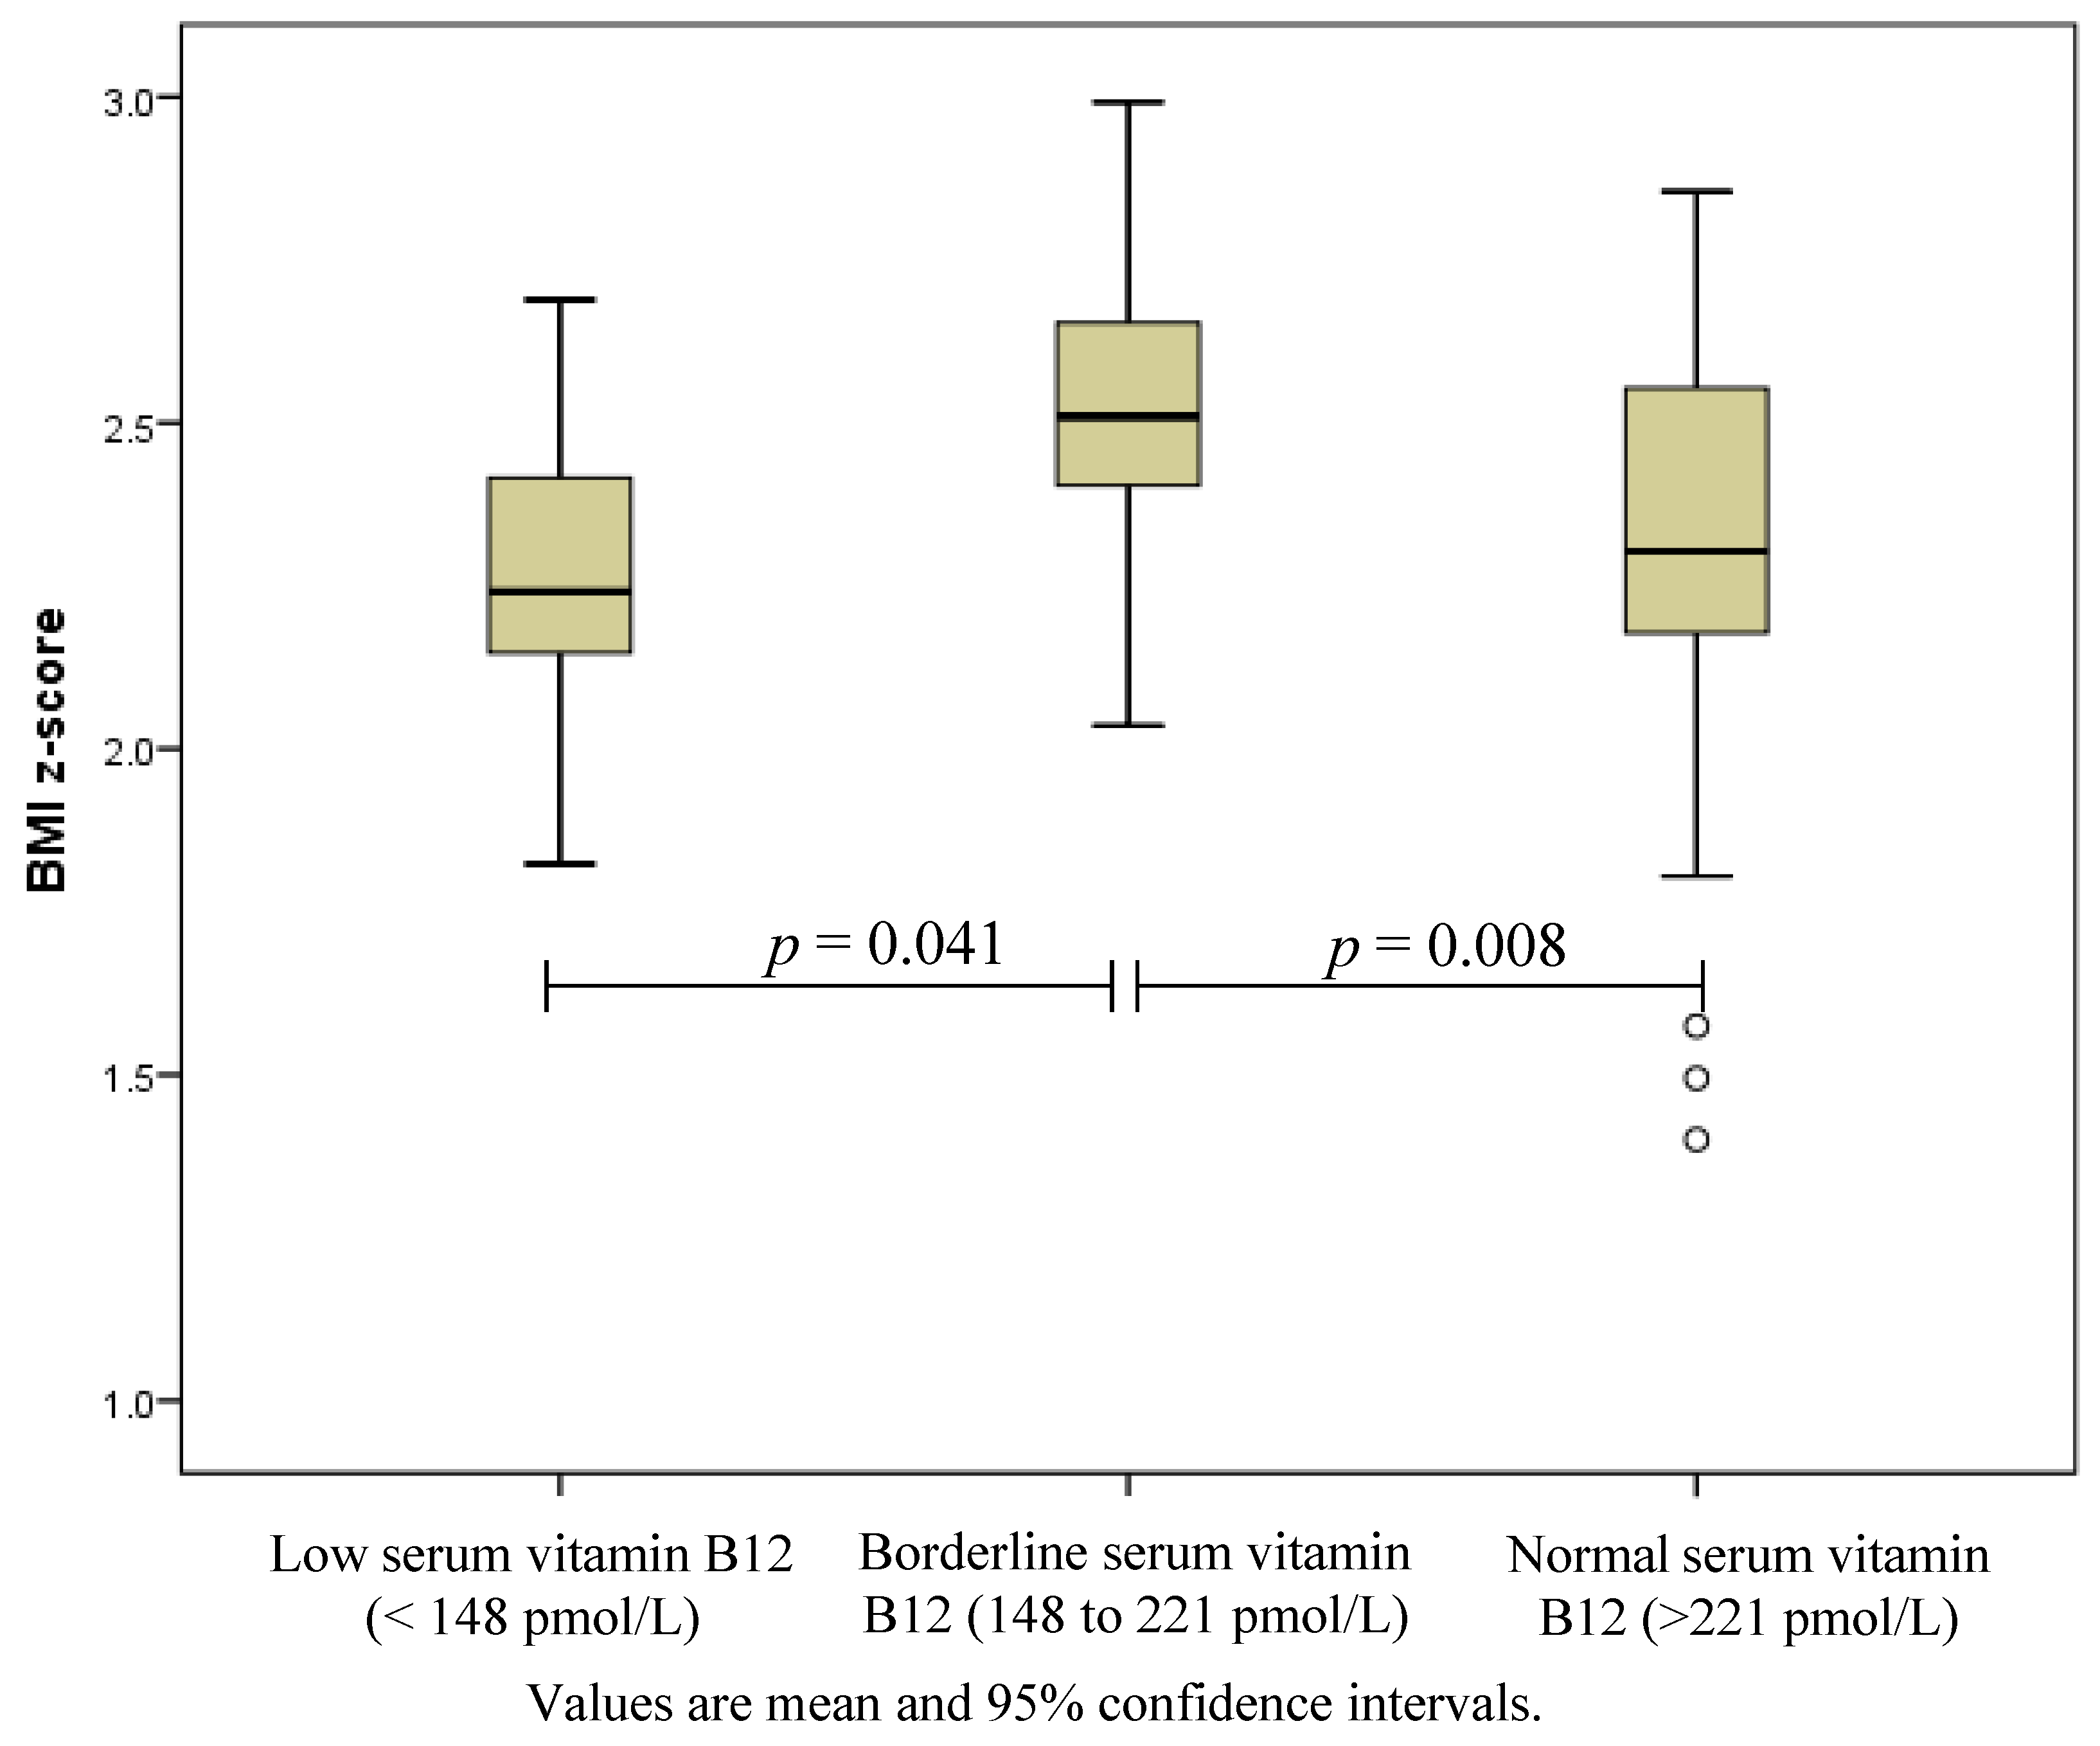
3. Results

| Low B12 < 148 pmol/L n = 8 | Borderline B12 148 to 221 pmol/L n = 25 | Normal B12 > 221 pmol/L n = 70 | P-Value * | |
|---|---|---|---|---|
| Age (years) | 12.7 ± 1.6 | 13.2 ± 1.8 | 13.4 ± 1.9 | 0.610 |
| Overweight/obese † | 0/8 | 0/25 | 4/66 | 0.198 |
| Male n (%) | 2 (25) | 9 (36) | 32 (46) | 0.260 |
| Weight (kg) | 84.2 ± 18.0 | 99.3 ± 18.3 | 90.7 ± 20.0 | 0.083 |
| BMI | 31.8 ± 5.8 | 37.1 ± 5. | 33.7 ± 5.0 | 0.008 |
| BMI z-score | 2.27 ± 0.26 | 2.50 ± 0.22 | 2.32 ± 0.30 | 0.017 |
| Fat mass % ‡ | 50.4 ± 5.3 | 50.1 ± 4.8 | 48.2 ± 5.9 | 0.296 |
| Insulin sensitivity index § | 1.18 (0.53 to 3.38) | 1.37 (0.27 to 3.03) | 1.34 (0.30 to 3.34) | 0.853 |
| Pre-diabetes ¶ n (%) | 2 (25) | 4 (16) | 8 (11) | 0.563 |
| B12 pmol/L median (range) | 120 (102 to 140) | 196 (151 to 218) | 296 (222 to 606) | <0.001 |
| Serum folate nmol/L median (range) | 23.4 (15.9 to 45.3) | 28.9 (4.6 to 45.3) | 29.9 (6.3 to 45.3) | 0.583 |
| RBC folate nmol/L median (range) †† | 596 (465 to 1150) | 811 (429 to 1240) | 860 (466 to 2000) | 0.036 |
| Haemoglobin g/L # | 130 ± 13 | 136 ± 10 | 135 ± 10 | 0.352 |
| Low haemoglobin <95 g/L n | 0 | 0 | 0 | |
| Hematocrit % # | 38 ± 3 | 40 ± 2 | 40 ± 3 | 0.238 |
| <28% n | 0 | 0 | 0 | |
| Mean corpuscular volume fL # >85 fL n (%) | 82 ± 4 1 (13) | 82 ± 4 6 (24) | 81 ± 4 8 (11) | 0.658 0.306 |
4. Discussion
5. Conclusions
Acknowledgments
Author Contributions
Conflicts of Interest
References
- Stabler, S.P. Vitamin B12 deficiency. N. Engl. J. Med. 2013, 368, 149–160. [Google Scholar] [CrossRef] [PubMed]
- Reinstatler, L.; Qi, Y.P.; Williamson, R.S.; Garn, J.V.; Oakley, G.P., Jr. Association of biochemical B12 deficiency with metformin therapy and vitamin B12 supplements: The national health and nutrition examination survey, 1999–2006. Diabetes Care 2012, 35, 327–333. [Google Scholar] [CrossRef] [PubMed]
- Laing, S.; Swerdlow, A.; Slater, S.; Burden, A.; Morris, A.; Waugh, N.; Gatling, W.; Bingley, P.; Patterson, C. Mortality from heart disease in a cohort of 23,000 patients with insulin-treated diabetes. Diabetologia 2003, 46, 760–765. [Google Scholar] [CrossRef] [PubMed] [Green Version]
- MacFarlane, A.J.; Greene-Finestone, L.S.; Shi, Y. Vitamin B12 and homocysteine status in a folate-replete population: Results from the canadian health measures survey. Am. J. Clin. Nutr. 2011, 94, 1079–1087. [Google Scholar] [CrossRef] [PubMed]
- Pinhas-Hamiel, O.; Doron-Panush, N.; Reichman, B.; Nitzan-Kaluski, D.; Shalitin, S.; Geva-Lerner, L. Obese children and adolescents: A risk group for low vitamin B12 concentration. Arch. Pediatr. Adolesc. Med. 2006, 160, 933–936. [Google Scholar] [PubMed]
- Skrivarhaug, T.; Bangstad, H.-J.; Stene, L.; Sandvik, L.; Hanssen, K.; Joner, G. Long-term mortality in a nationwide cohort of childhood-onset type 1 diabetic patients in norway. Diabetologia 2006, 49, 298–305. [Google Scholar] [CrossRef] [PubMed]
- Garnett, S.P.; Baur, L.A.; Noakes, M.; Steinbeck, K.; Woodhead, H.J.; Burrell, S.; Chisholm, K.; Broderick, C.R.; Parker, R.; De, S.; et al. Researching effective strategies to improve insulin sensitivity in children and teenagers—Resist. A randomised control trial investigating the effects of two different diets on insulin sensitivity in young people with insulin resistance and/or pre-diabetes. BMC Public Health 2010, 10, 575–584. [Google Scholar] [CrossRef] [PubMed]
- Garnett, S.P.; Gow, M.; Ho, M.; Baur, L.A.; Noakes, M.; Woodhead, H.J.; Broderick, C.R.; Burrell, S.; Chisholm, K.; Halim, J.; et al. Optimal macronutrient content of the diet for adolescents with prediabetes; resist a randomised control trial. J. Clin. Endocrinol. Metab. 2013, 98, 2116–2125. [Google Scholar] [CrossRef] [PubMed]
- Matsuda, M.; DeFronzo, R.A. Insulin sensitivity indices obtained from oral glucose tolerance testing: Comparison with the euglycemic insulin clamp. Diabetes Care 1999, 22, 1462–1470. [Google Scholar] [CrossRef] [PubMed]
- National High Blood Pressure Education Program Working Group on High Blood Pressure in Children Adolescents. The fourth report on the diagnosis, evaluation, and treatment of high blood pressure in children and adolescents. Pediatrics 2004, 114, 555–576. [Google Scholar]
- Cole, T.J.; Bellizzi, M.C.; Flegal, K.M.; Dietz, W.H. Establishing a standard definition for child overweight and obesity worldwide: International survey. BMJ (Clin. Res. Ed.) 2000, 320, 1240–1243. [Google Scholar] [CrossRef]
- Altman, D.G. Practical Statistics for Medical Research; Chapman & Hall: London, UK, 1996. [Google Scholar]
- Mazokopakis, E.E.; Starakis, I.K. Recommendations for diagnosis and management of metformin-induced vitamin B12 (Cbl) deficiency. Diabetes Res. Clin. Pract. 2012, 97, 359–367. [Google Scholar] [CrossRef] [PubMed]
- Dick, K.J.; Nelson, C.P.; Tsaprouni, L.; Sandling, J.K.; Aïssi, D.; Wahl, S.; Meduri, E.; Morange, P.-E.; Gagnon, F.; Grallert, H. DNA methylation and body-mass index: A genome-wide analysis. Lancet 2014, 383, 1990–1998. [Google Scholar] [CrossRef] [PubMed]
- Willis, C.D.; Metz, M.P.; Hiller, J.E.; Elshaug, A.G. Vitamin B12 and folate tests: The ongoing need to determine appropriate use and public funding. Med. J. Aust. 2013, 198, 586–588. [Google Scholar] [CrossRef] [PubMed]
- Grzybowski, A. Low serum vitamin B12 level does not mean vitamin B12 deficiency—Problems related to the diagnosis of vitamin B12 deficiency. Curr. Eye Res. 2013, 18. [Google Scholar] [CrossRef]
© 2014 by the authors; licensee MDPI, Basel, Switzerland. This article is an open access article distributed under the terms and conditions of the Creative Commons Attribution license (http://creativecommons.org/licenses/by/4.0/).
Share and Cite
Ho, M.; Halim, J.H.; Gow, M.L.; El-Haddad, N.; Marzulli, T.; Baur, L.A.; Cowell, C.T.; Garnett, S.P. Vitamin B12 in Obese Adolescents with Clinical Features of Insulin Resistance. Nutrients 2014, 6, 5611-5618. https://doi.org/10.3390/nu6125611
Ho M, Halim JH, Gow ML, El-Haddad N, Marzulli T, Baur LA, Cowell CT, Garnett SP. Vitamin B12 in Obese Adolescents with Clinical Features of Insulin Resistance. Nutrients. 2014; 6(12):5611-5618. https://doi.org/10.3390/nu6125611
Chicago/Turabian StyleHo, Mandy, Jocelyn H. Halim, Megan L. Gow, Nouhad El-Haddad, Teresa Marzulli, Louise A. Baur, Chris T. Cowell, and Sarah P. Garnett. 2014. "Vitamin B12 in Obese Adolescents with Clinical Features of Insulin Resistance" Nutrients 6, no. 12: 5611-5618. https://doi.org/10.3390/nu6125611
APA StyleHo, M., Halim, J. H., Gow, M. L., El-Haddad, N., Marzulli, T., Baur, L. A., Cowell, C. T., & Garnett, S. P. (2014). Vitamin B12 in Obese Adolescents with Clinical Features of Insulin Resistance. Nutrients, 6(12), 5611-5618. https://doi.org/10.3390/nu6125611