
Untargeted Metabolome Analysis of Alcohol-Exposed Pregnancies Reveals Metabolite Differences That Are Associated with Infant Birth Outcomes
 , and
, and
Abstract
:1. Introduction
2. Materials and Methods
2.1. Sample
2.2. Metabolomic Analysis
2.3. Data Analysis
3. Results
3.1. Maternal Characteristics
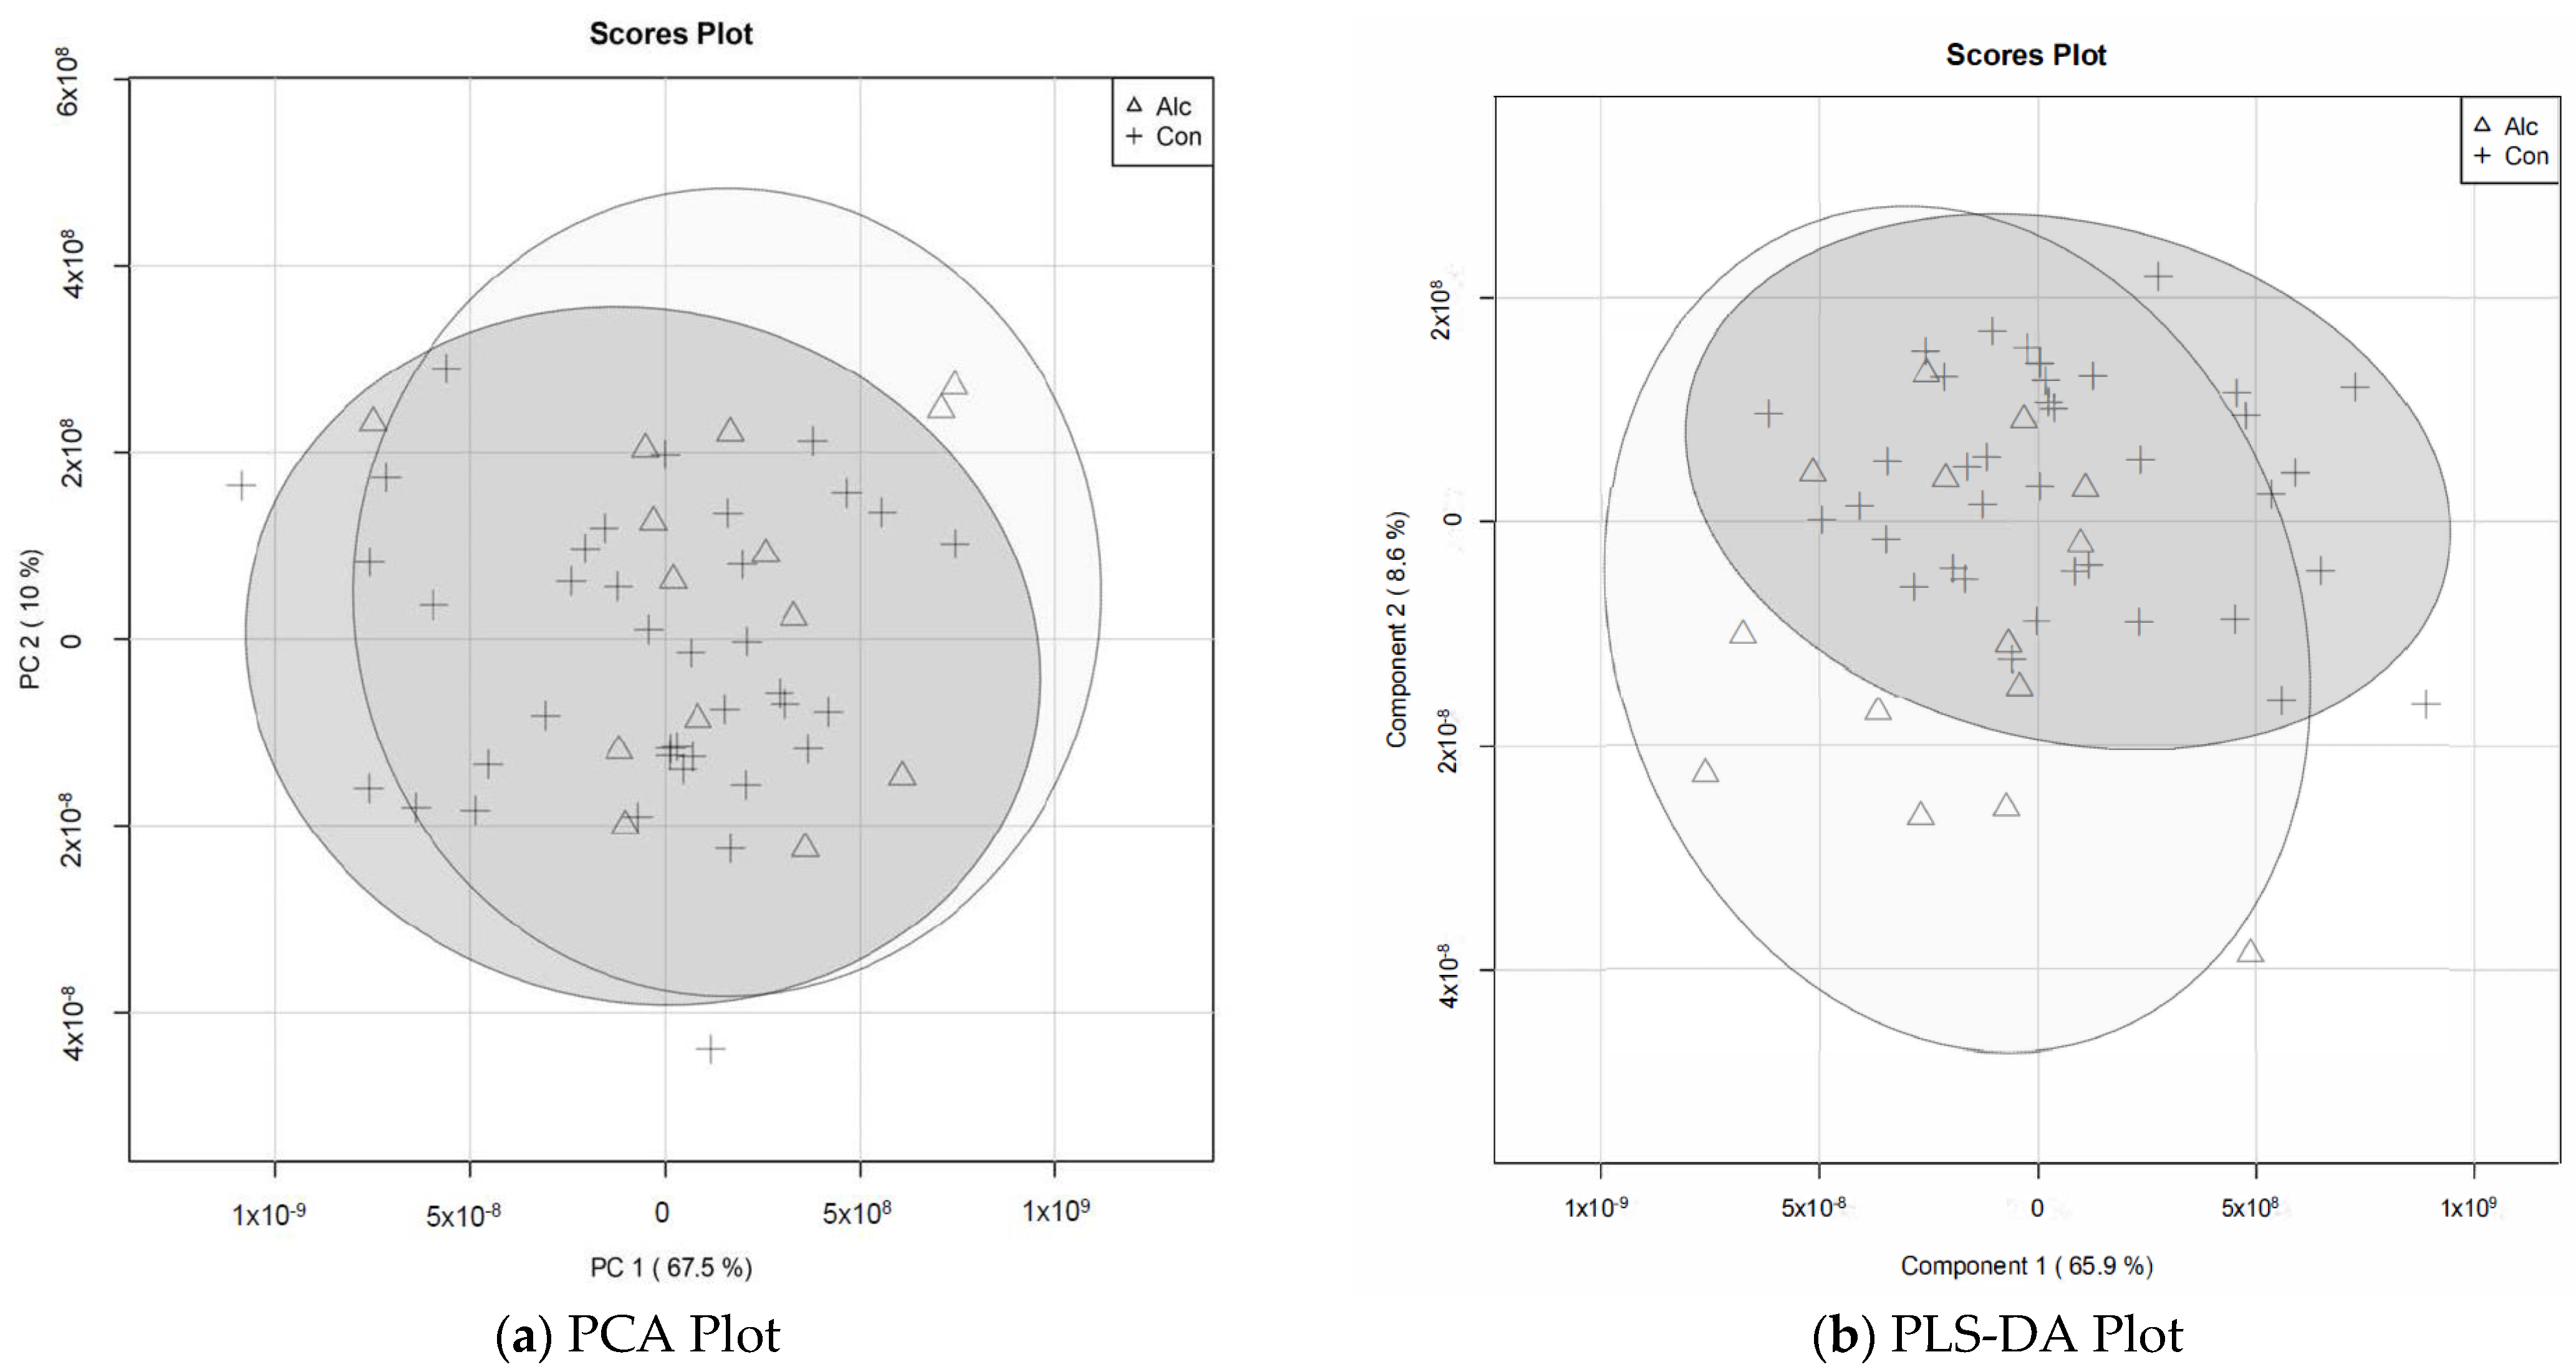
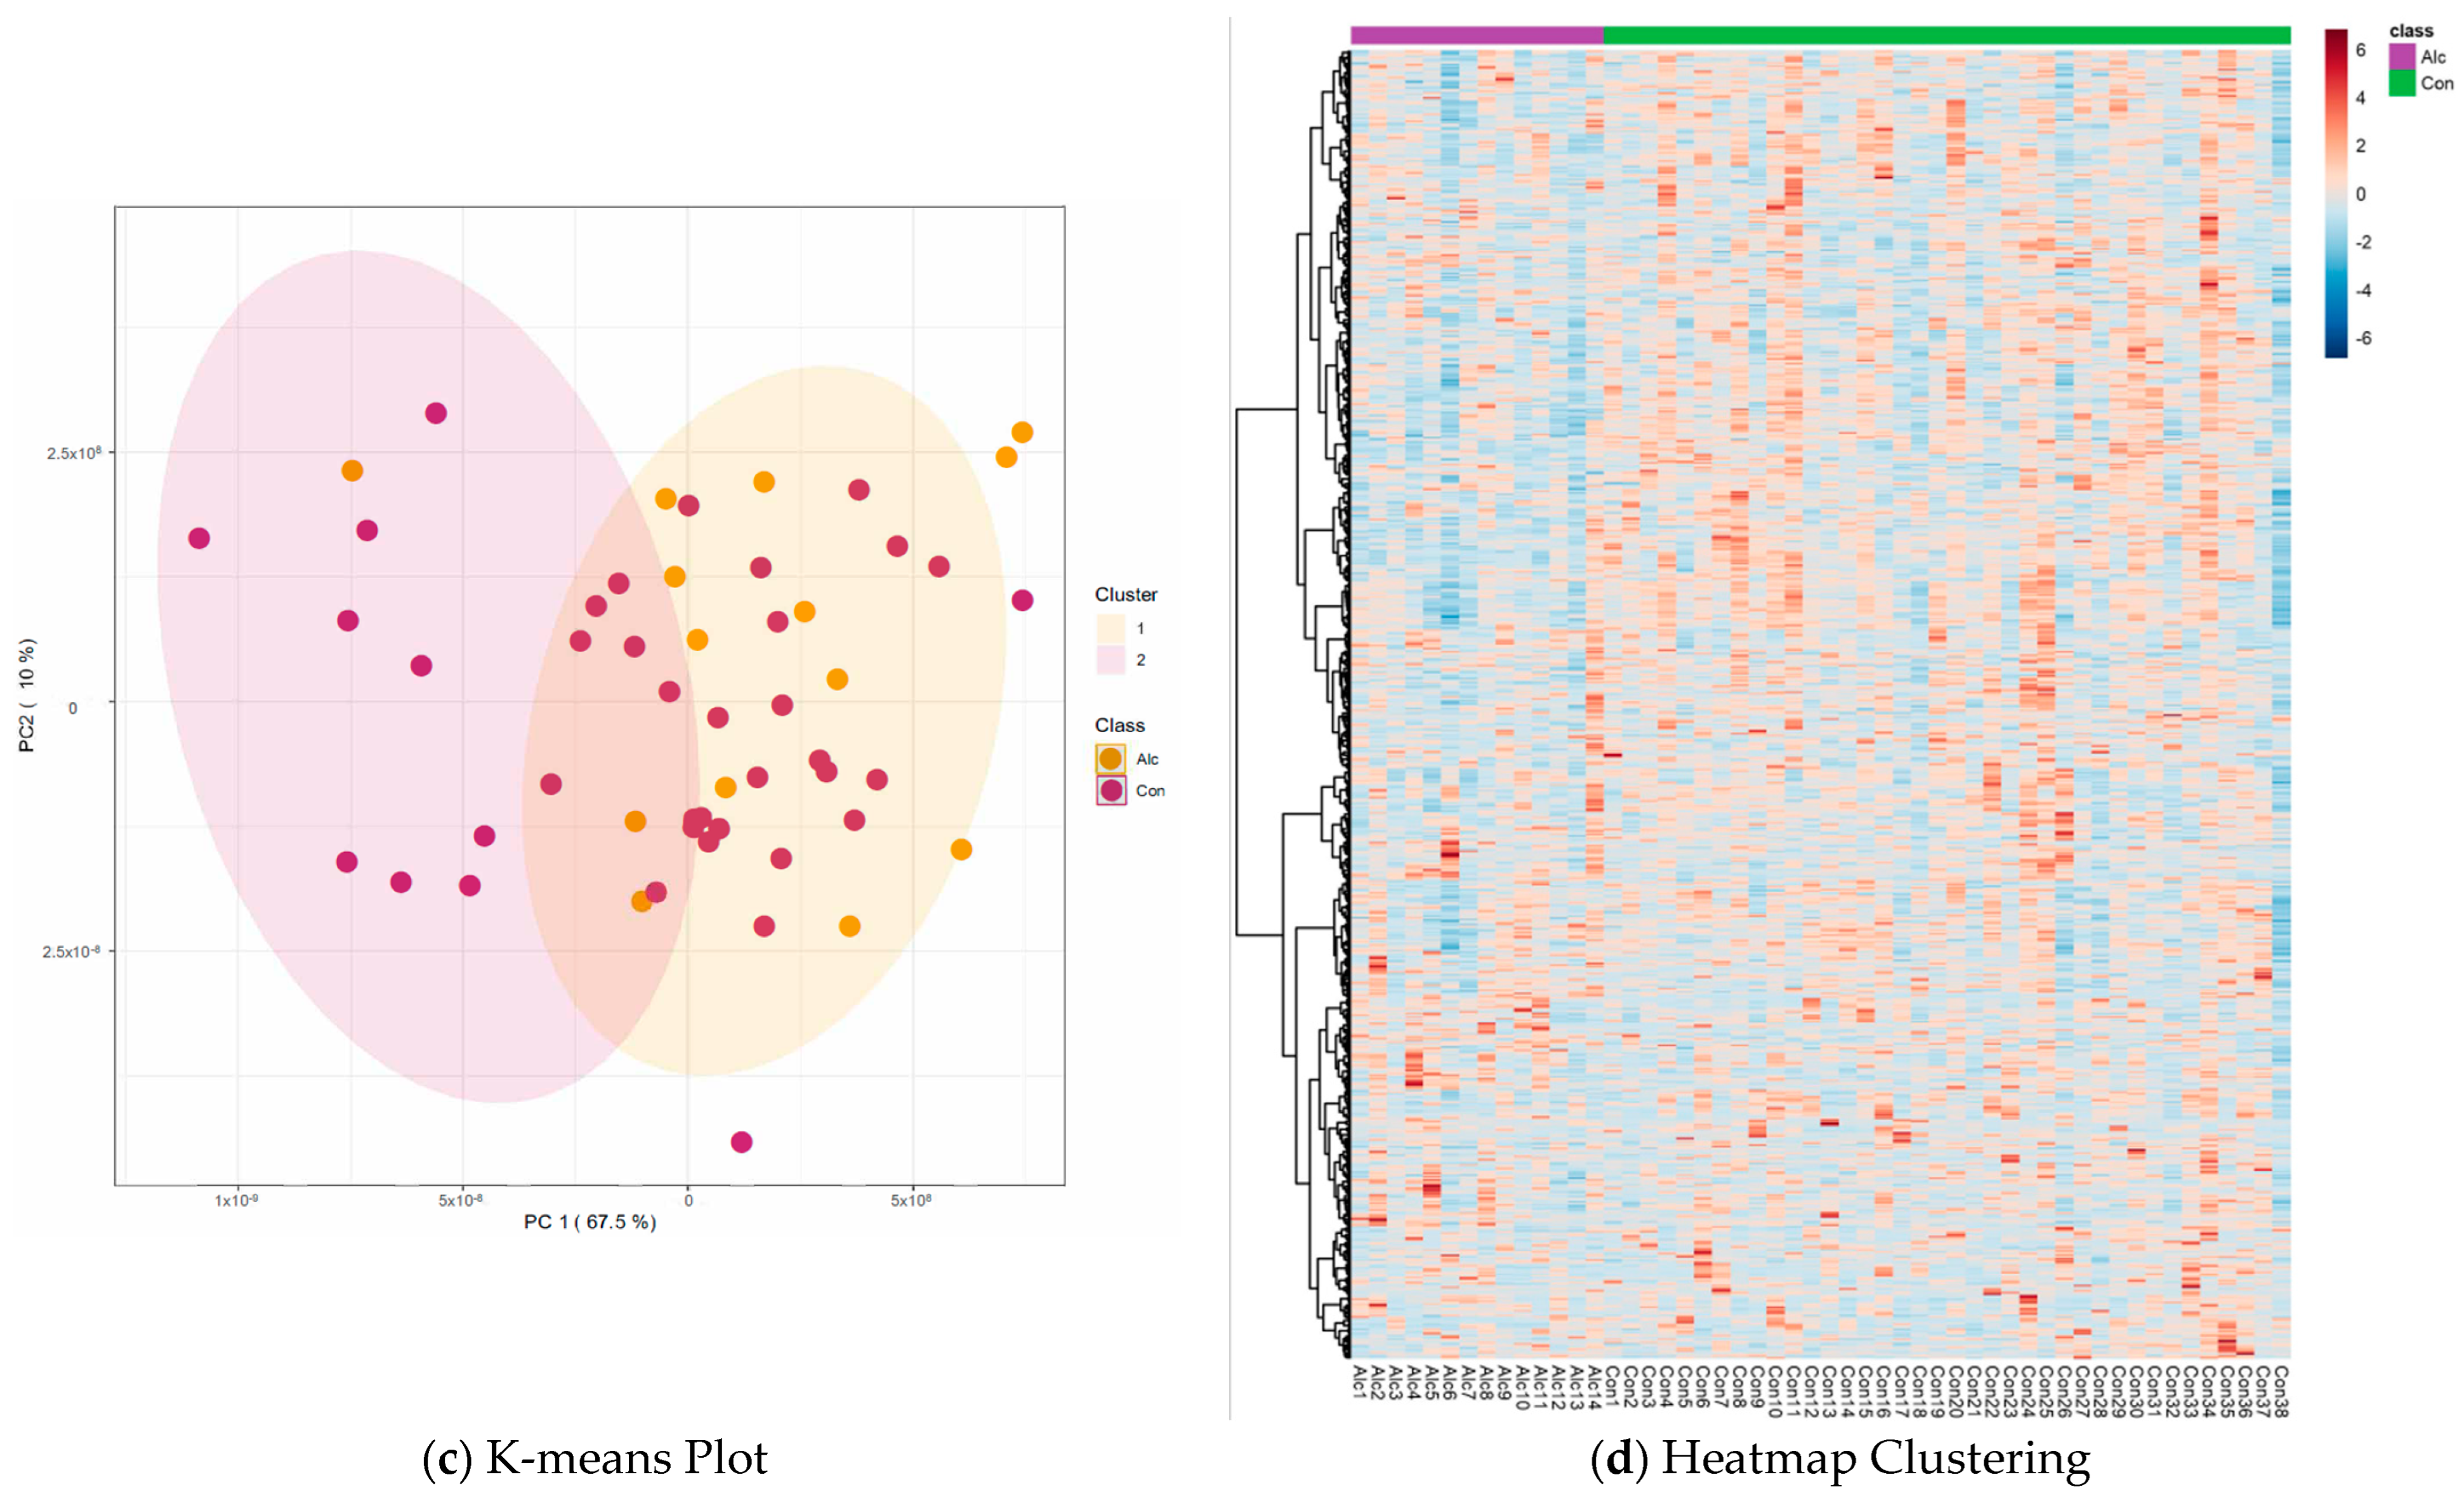
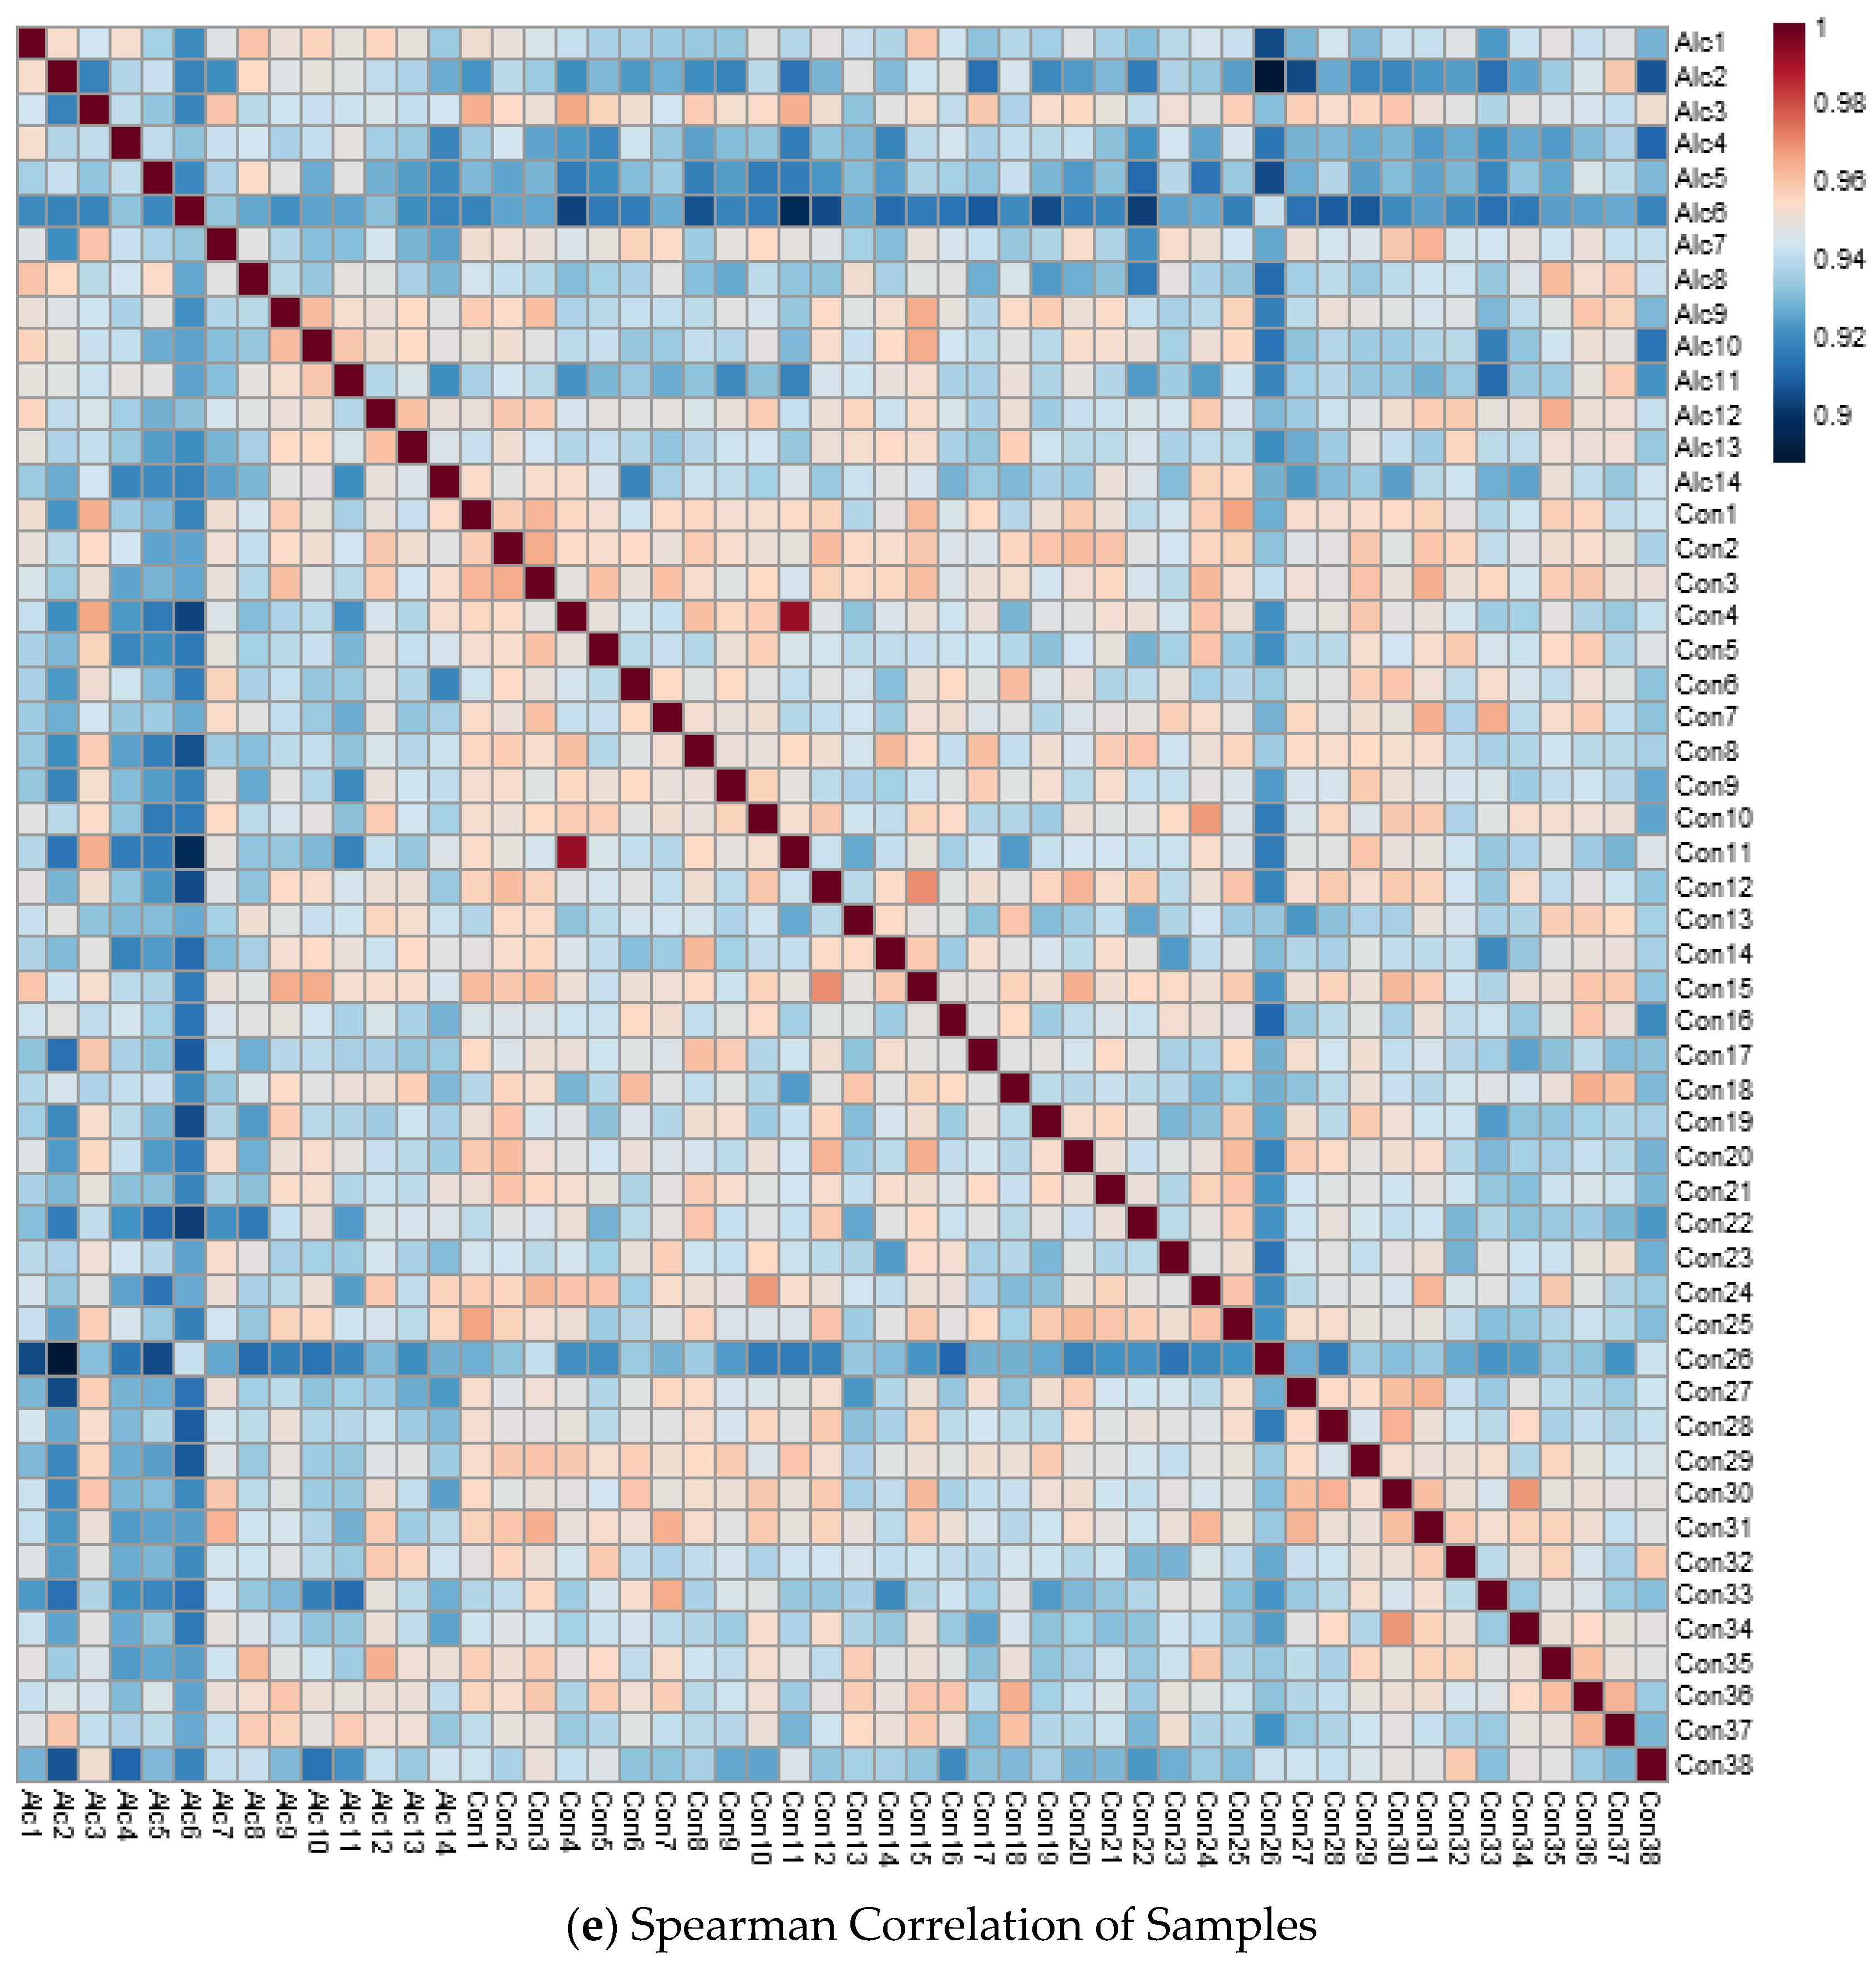
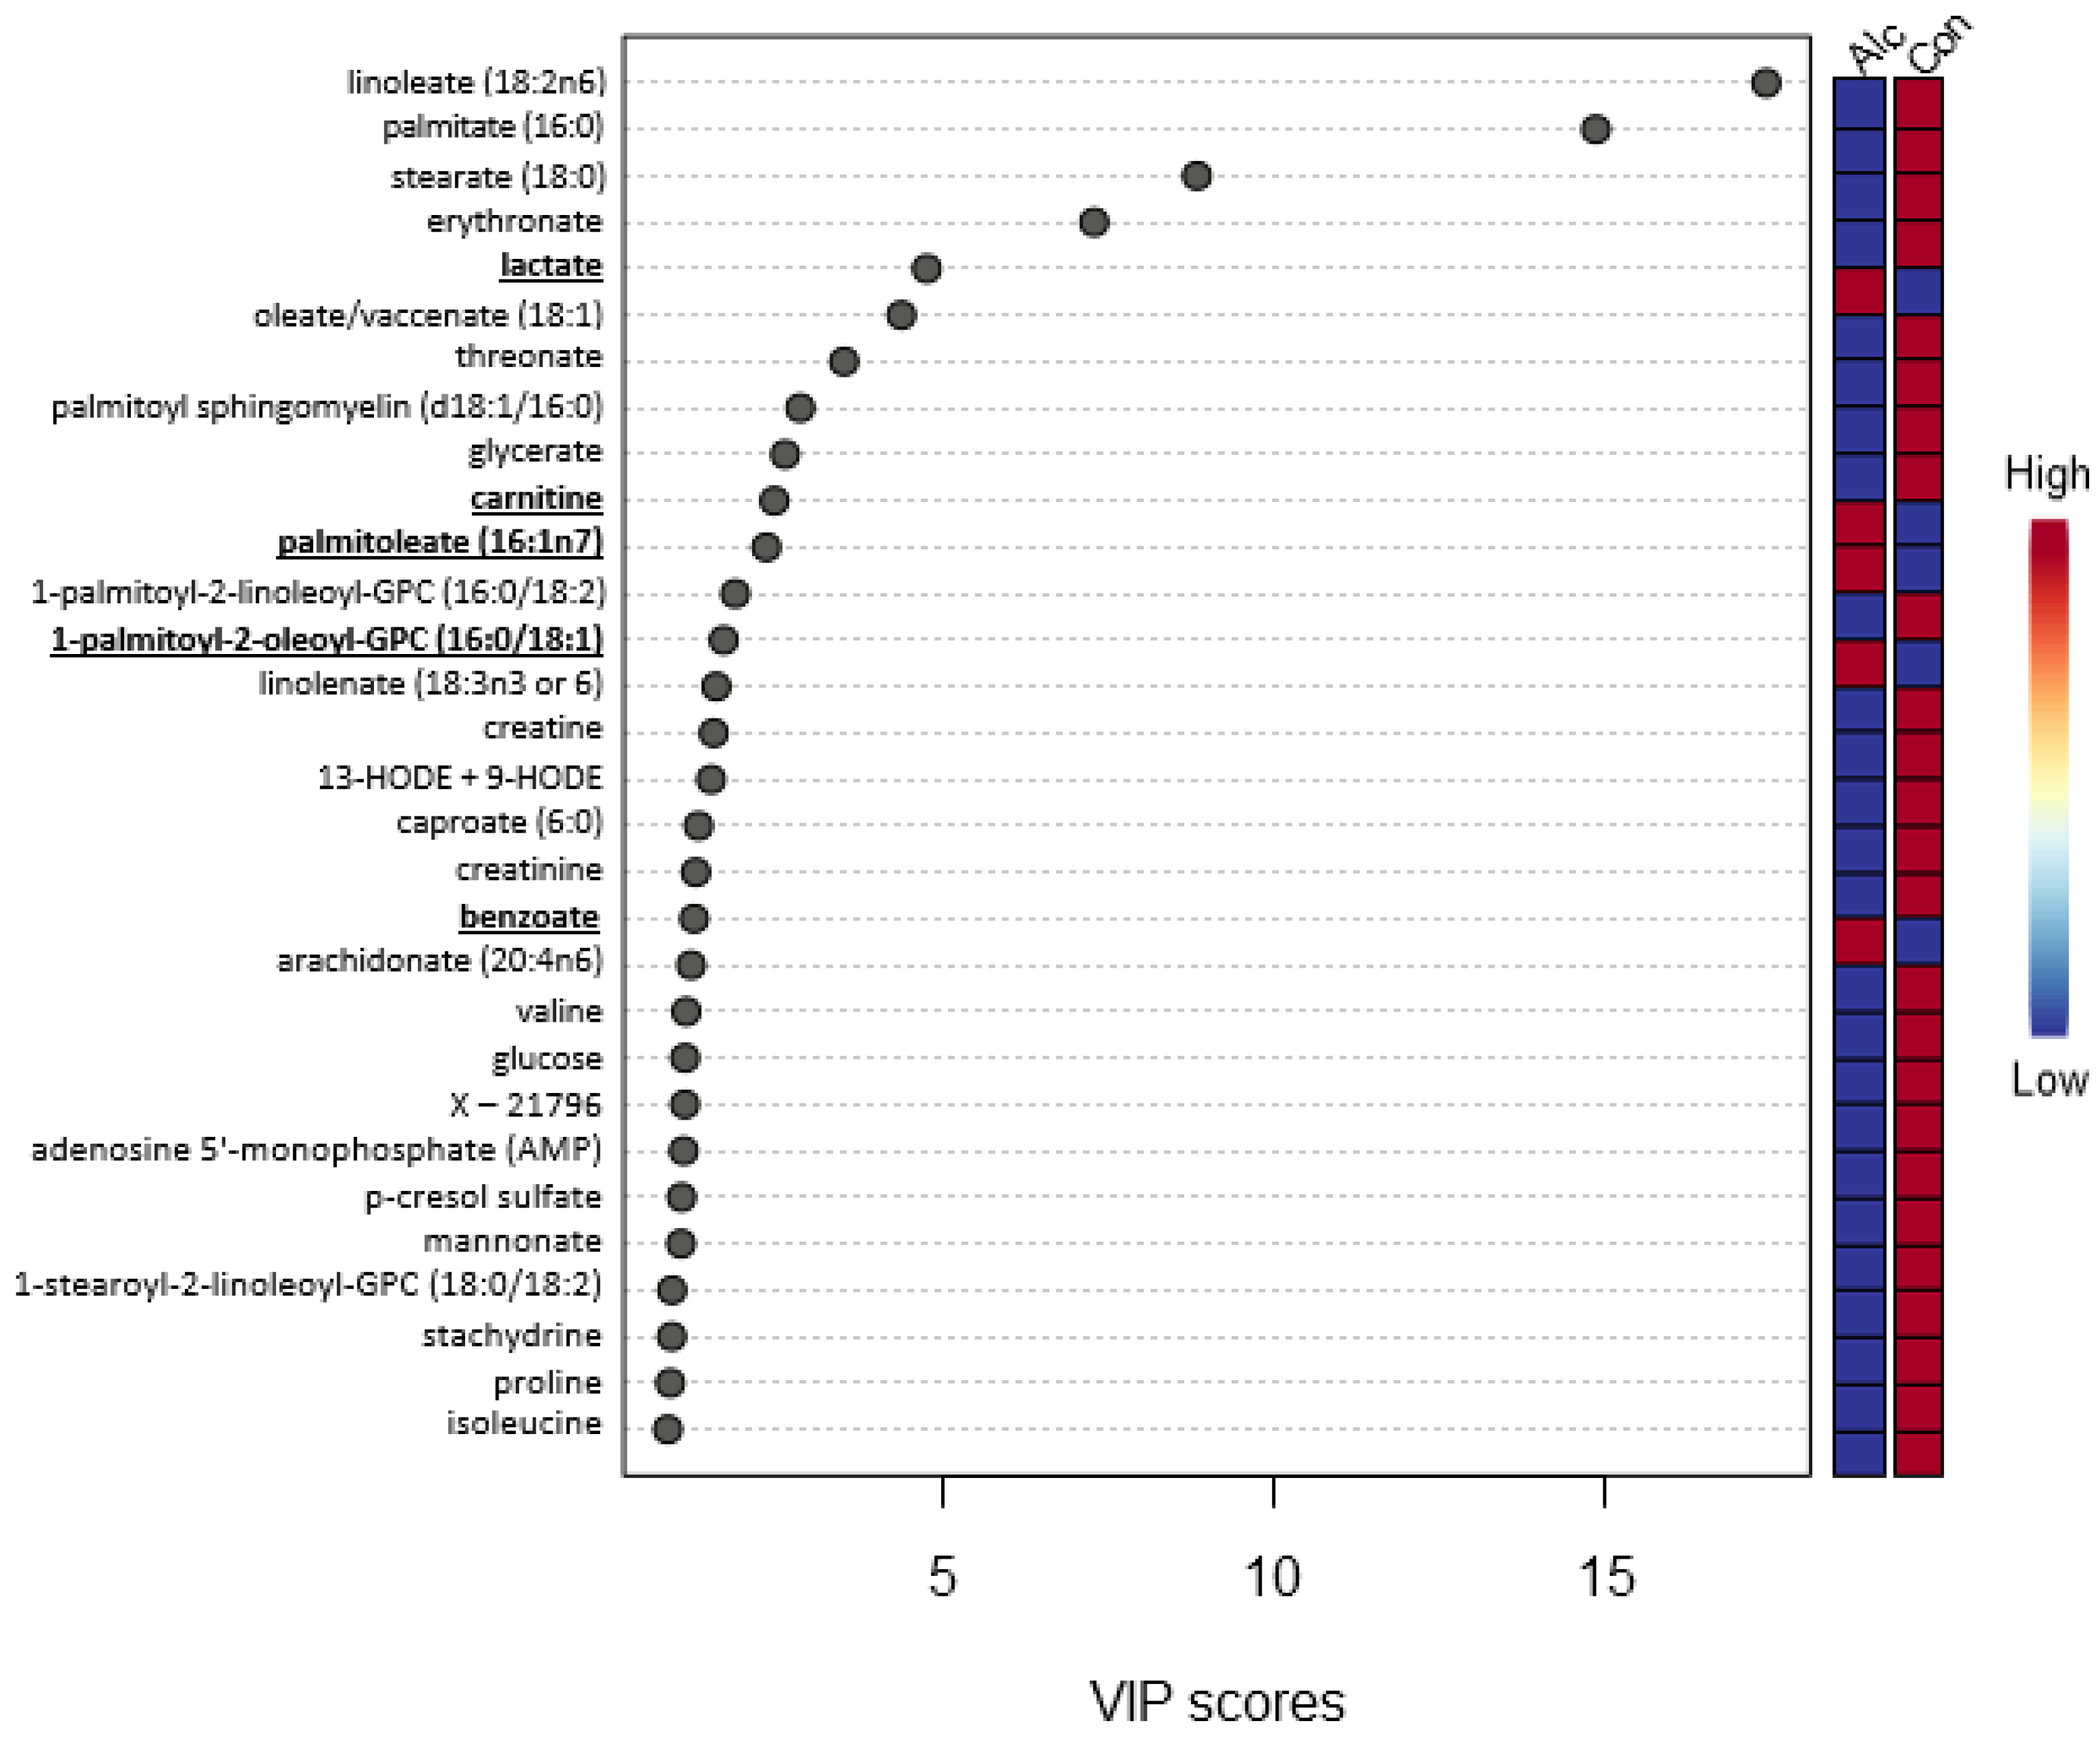
3.2. Metabolite Profiles
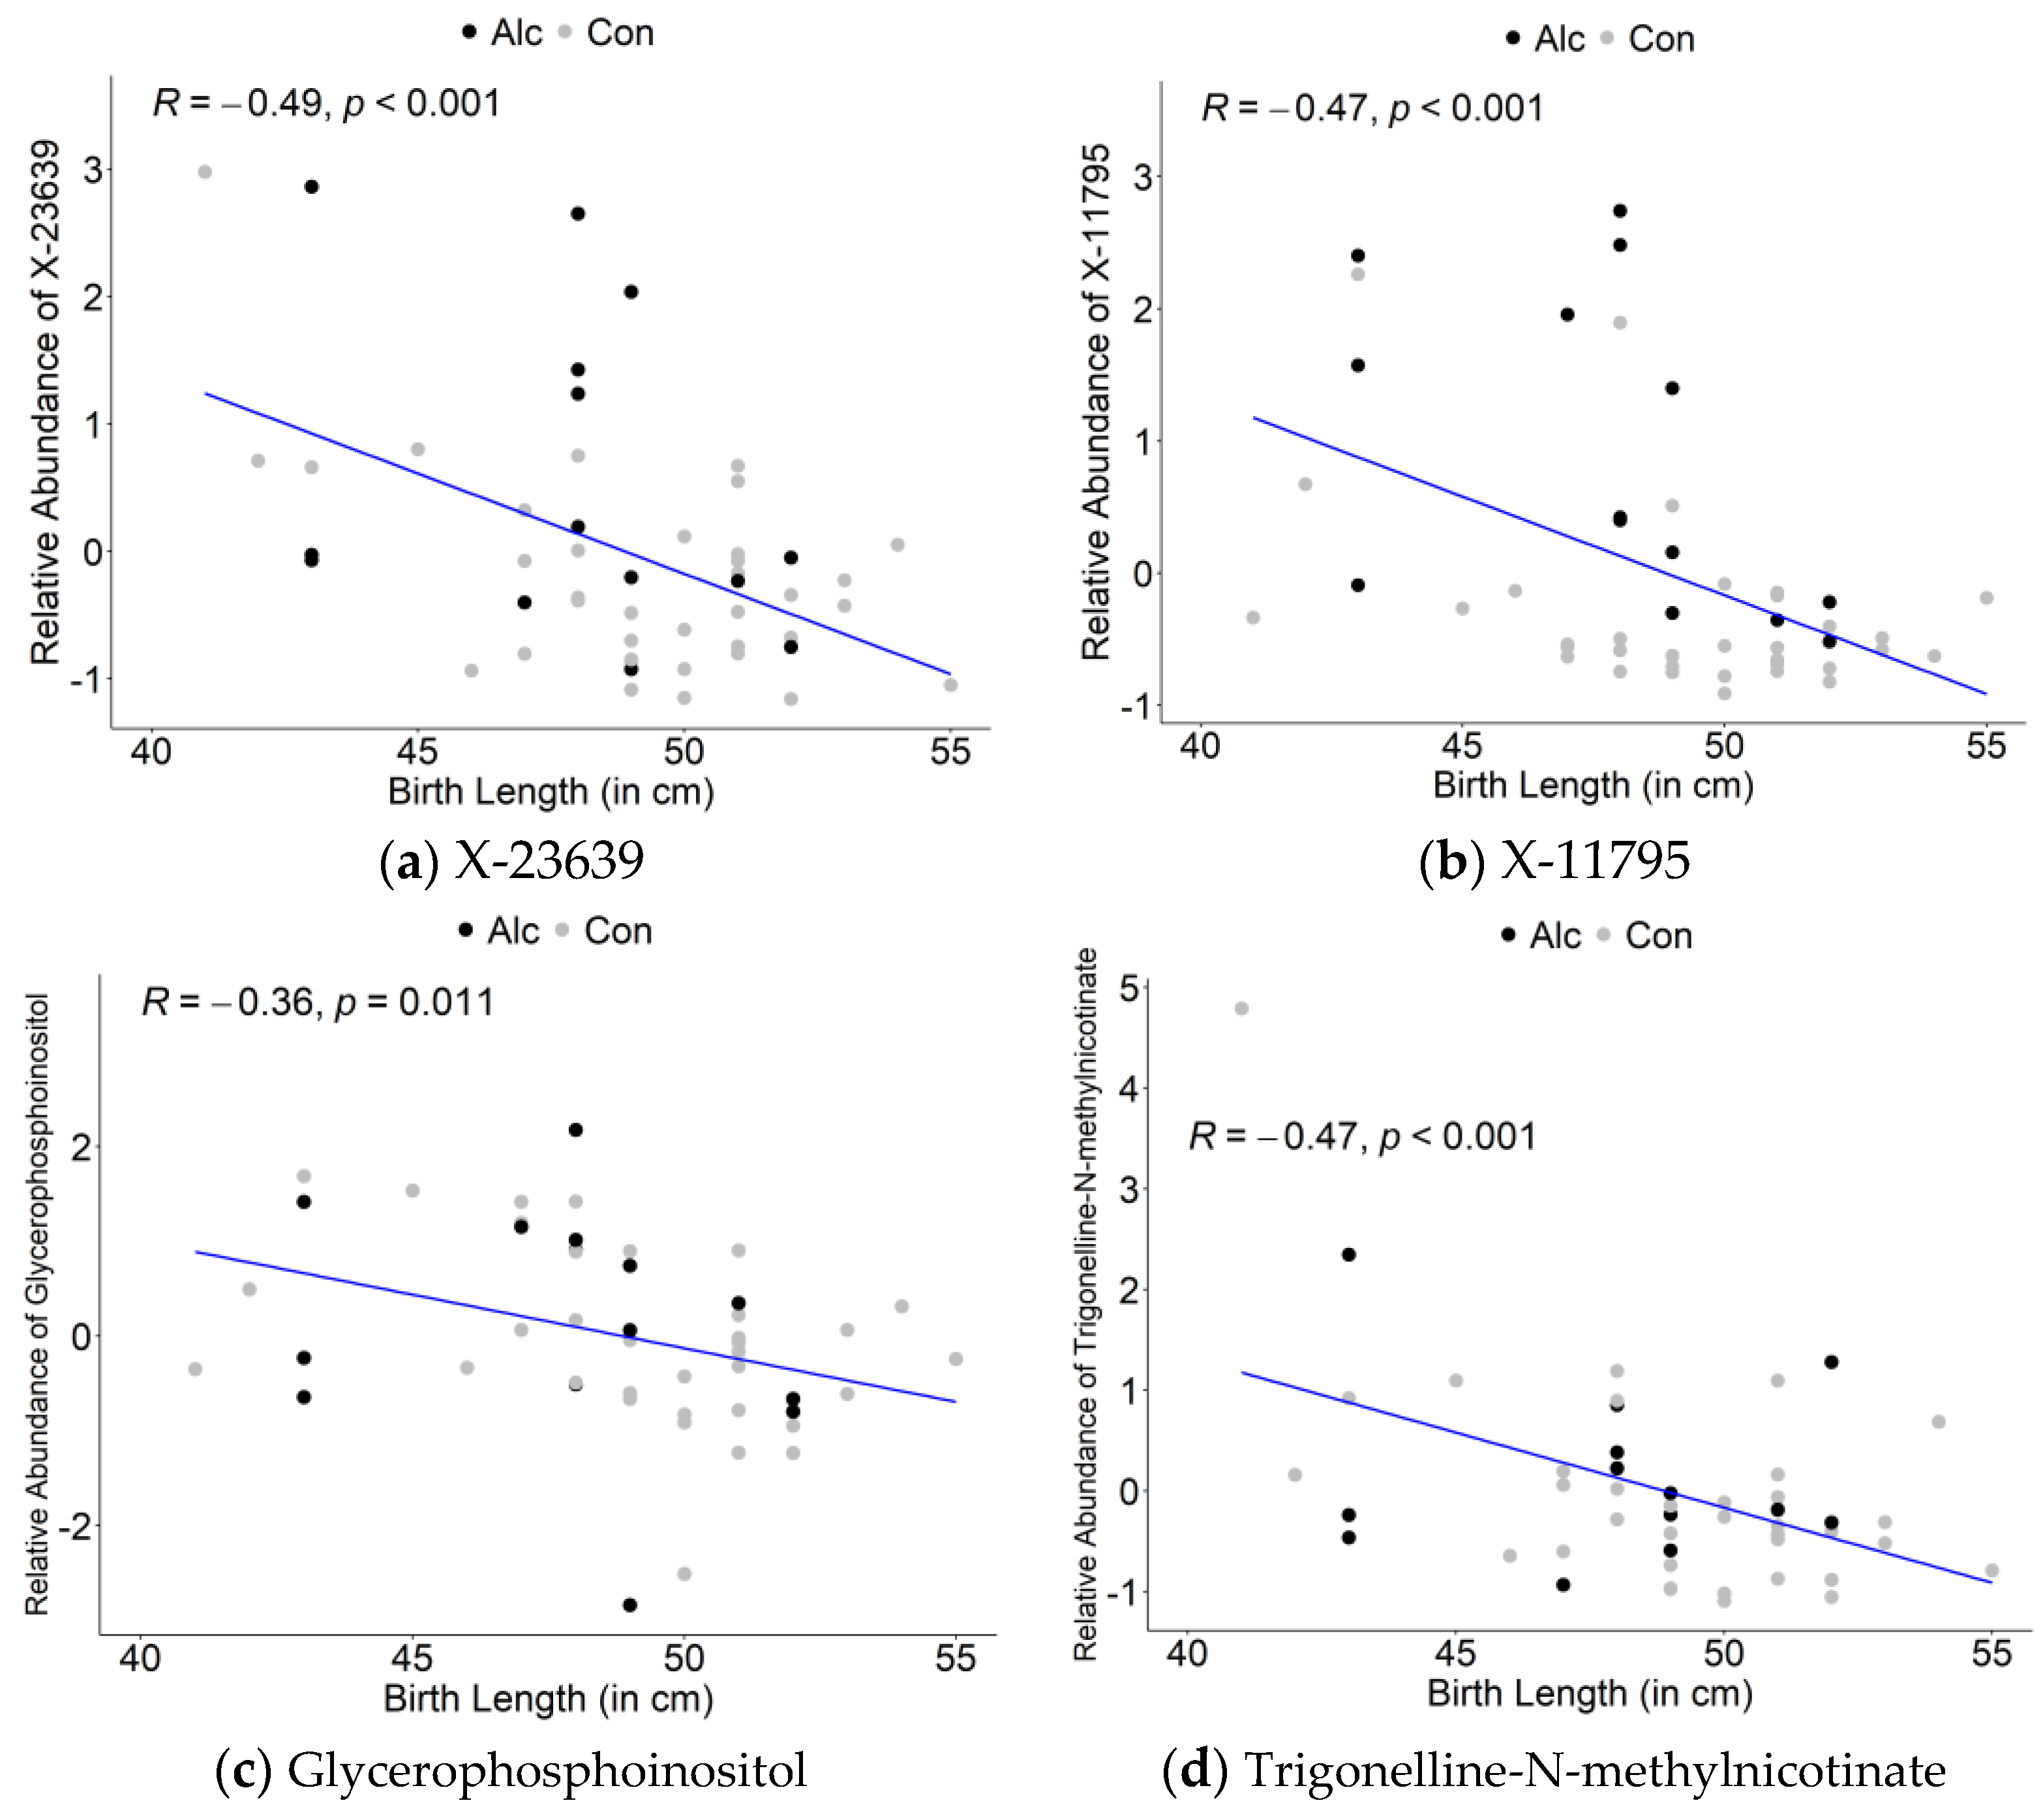
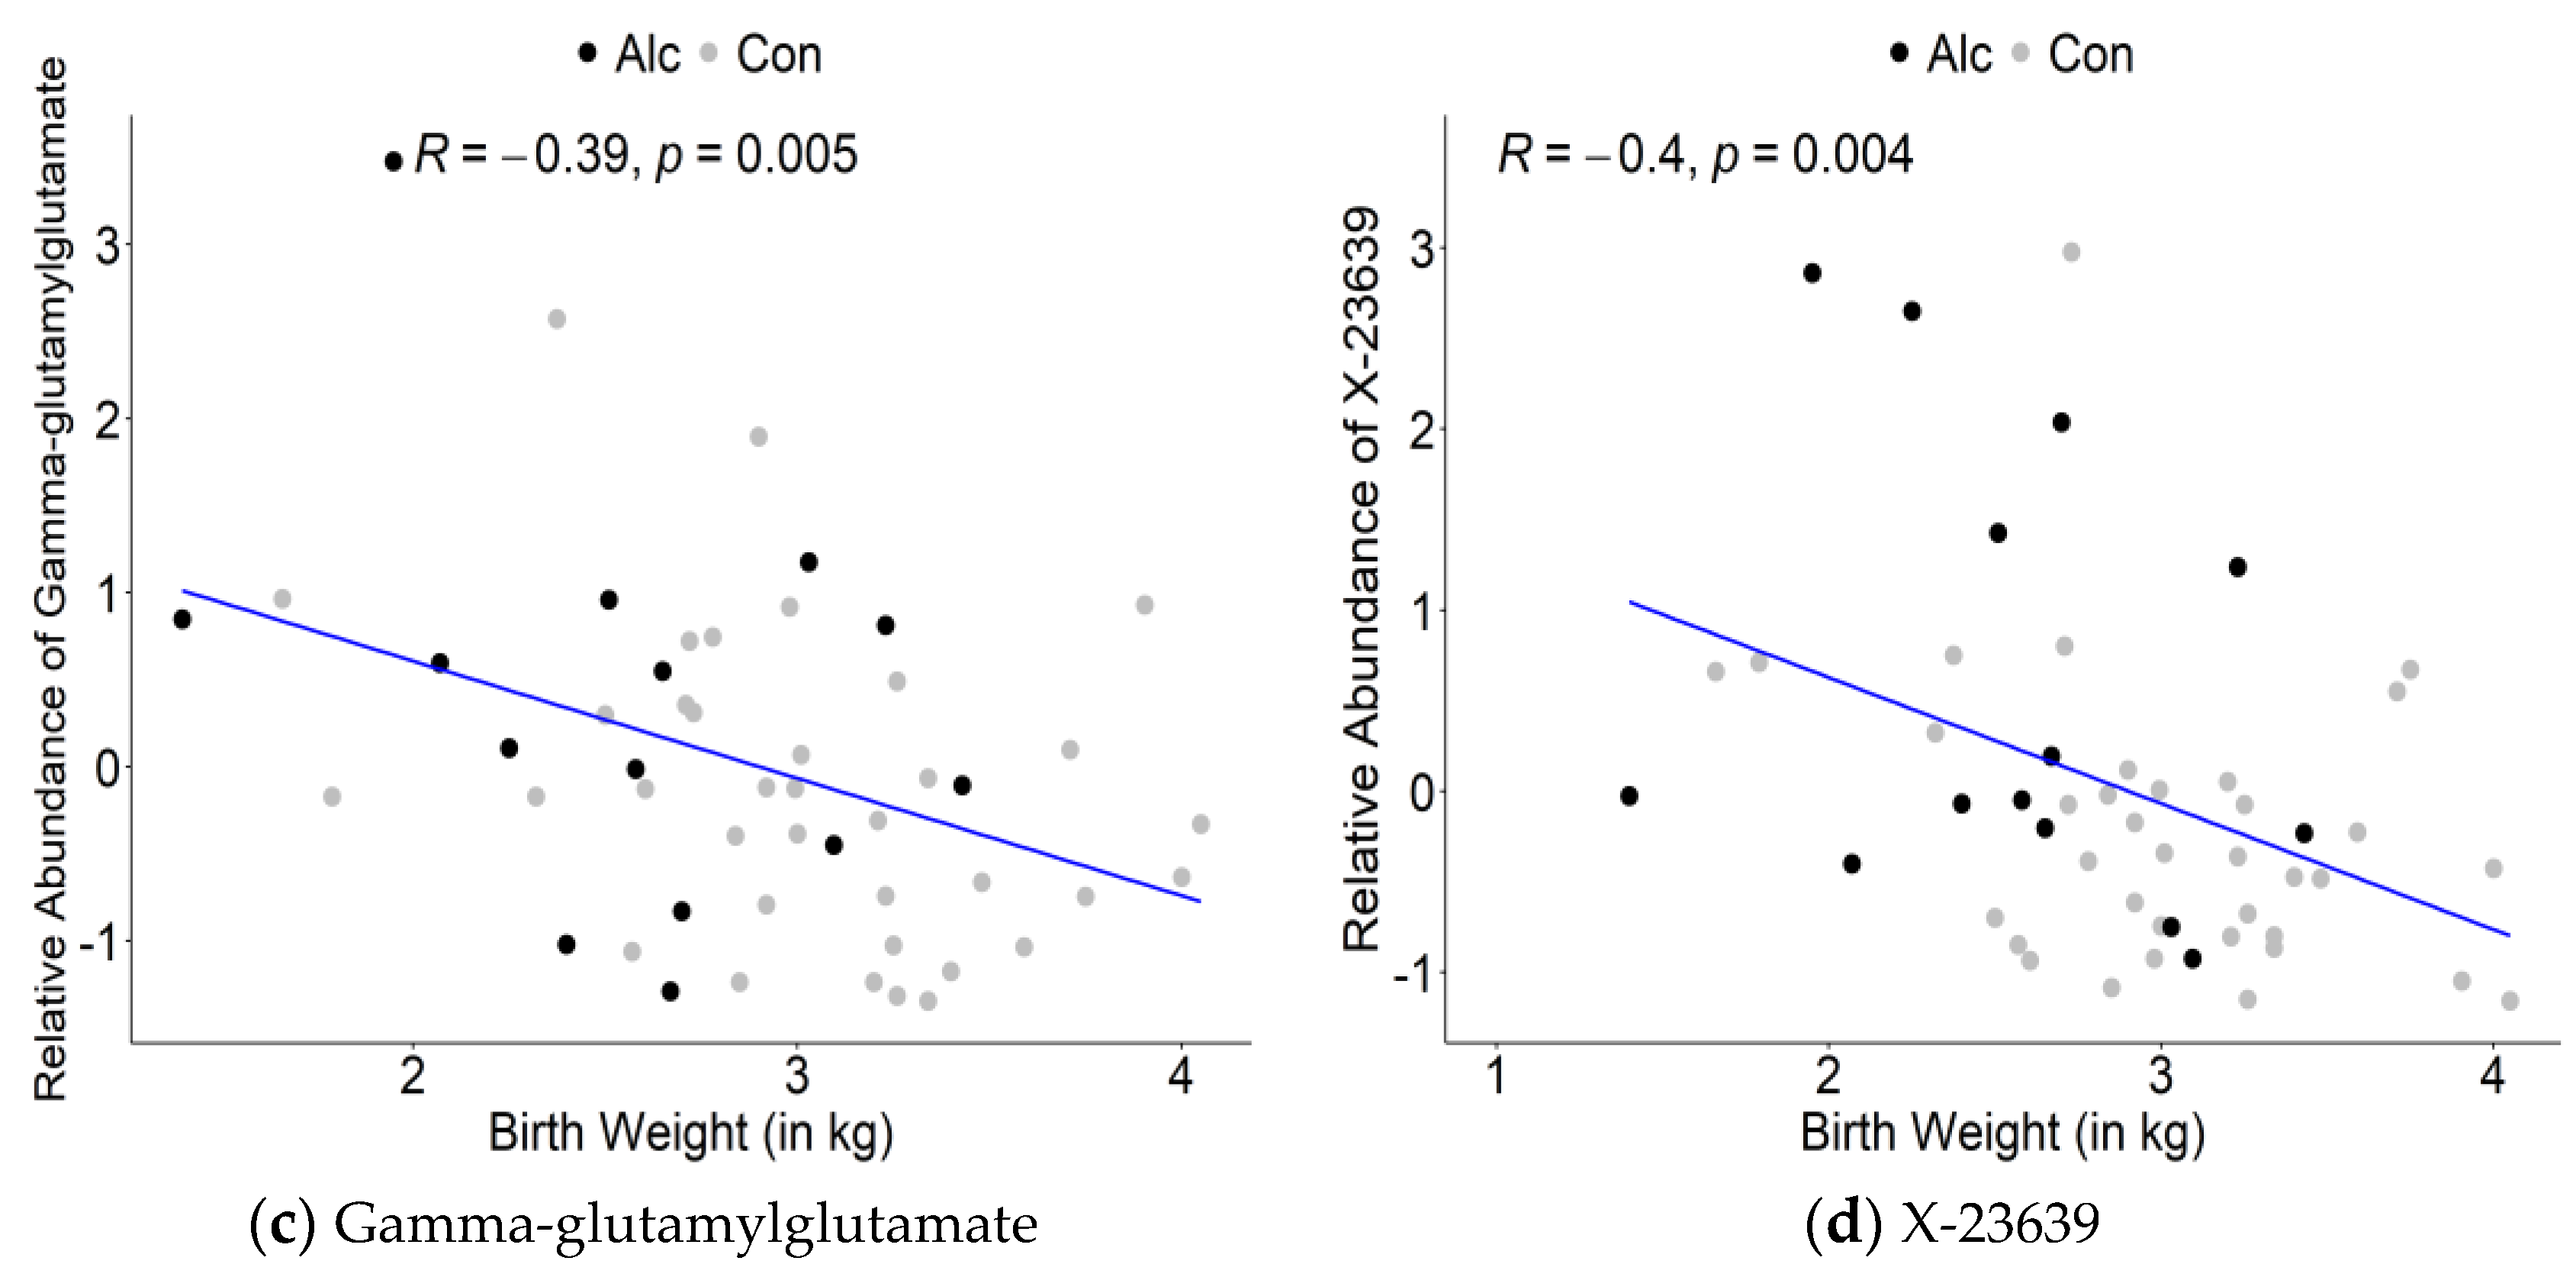
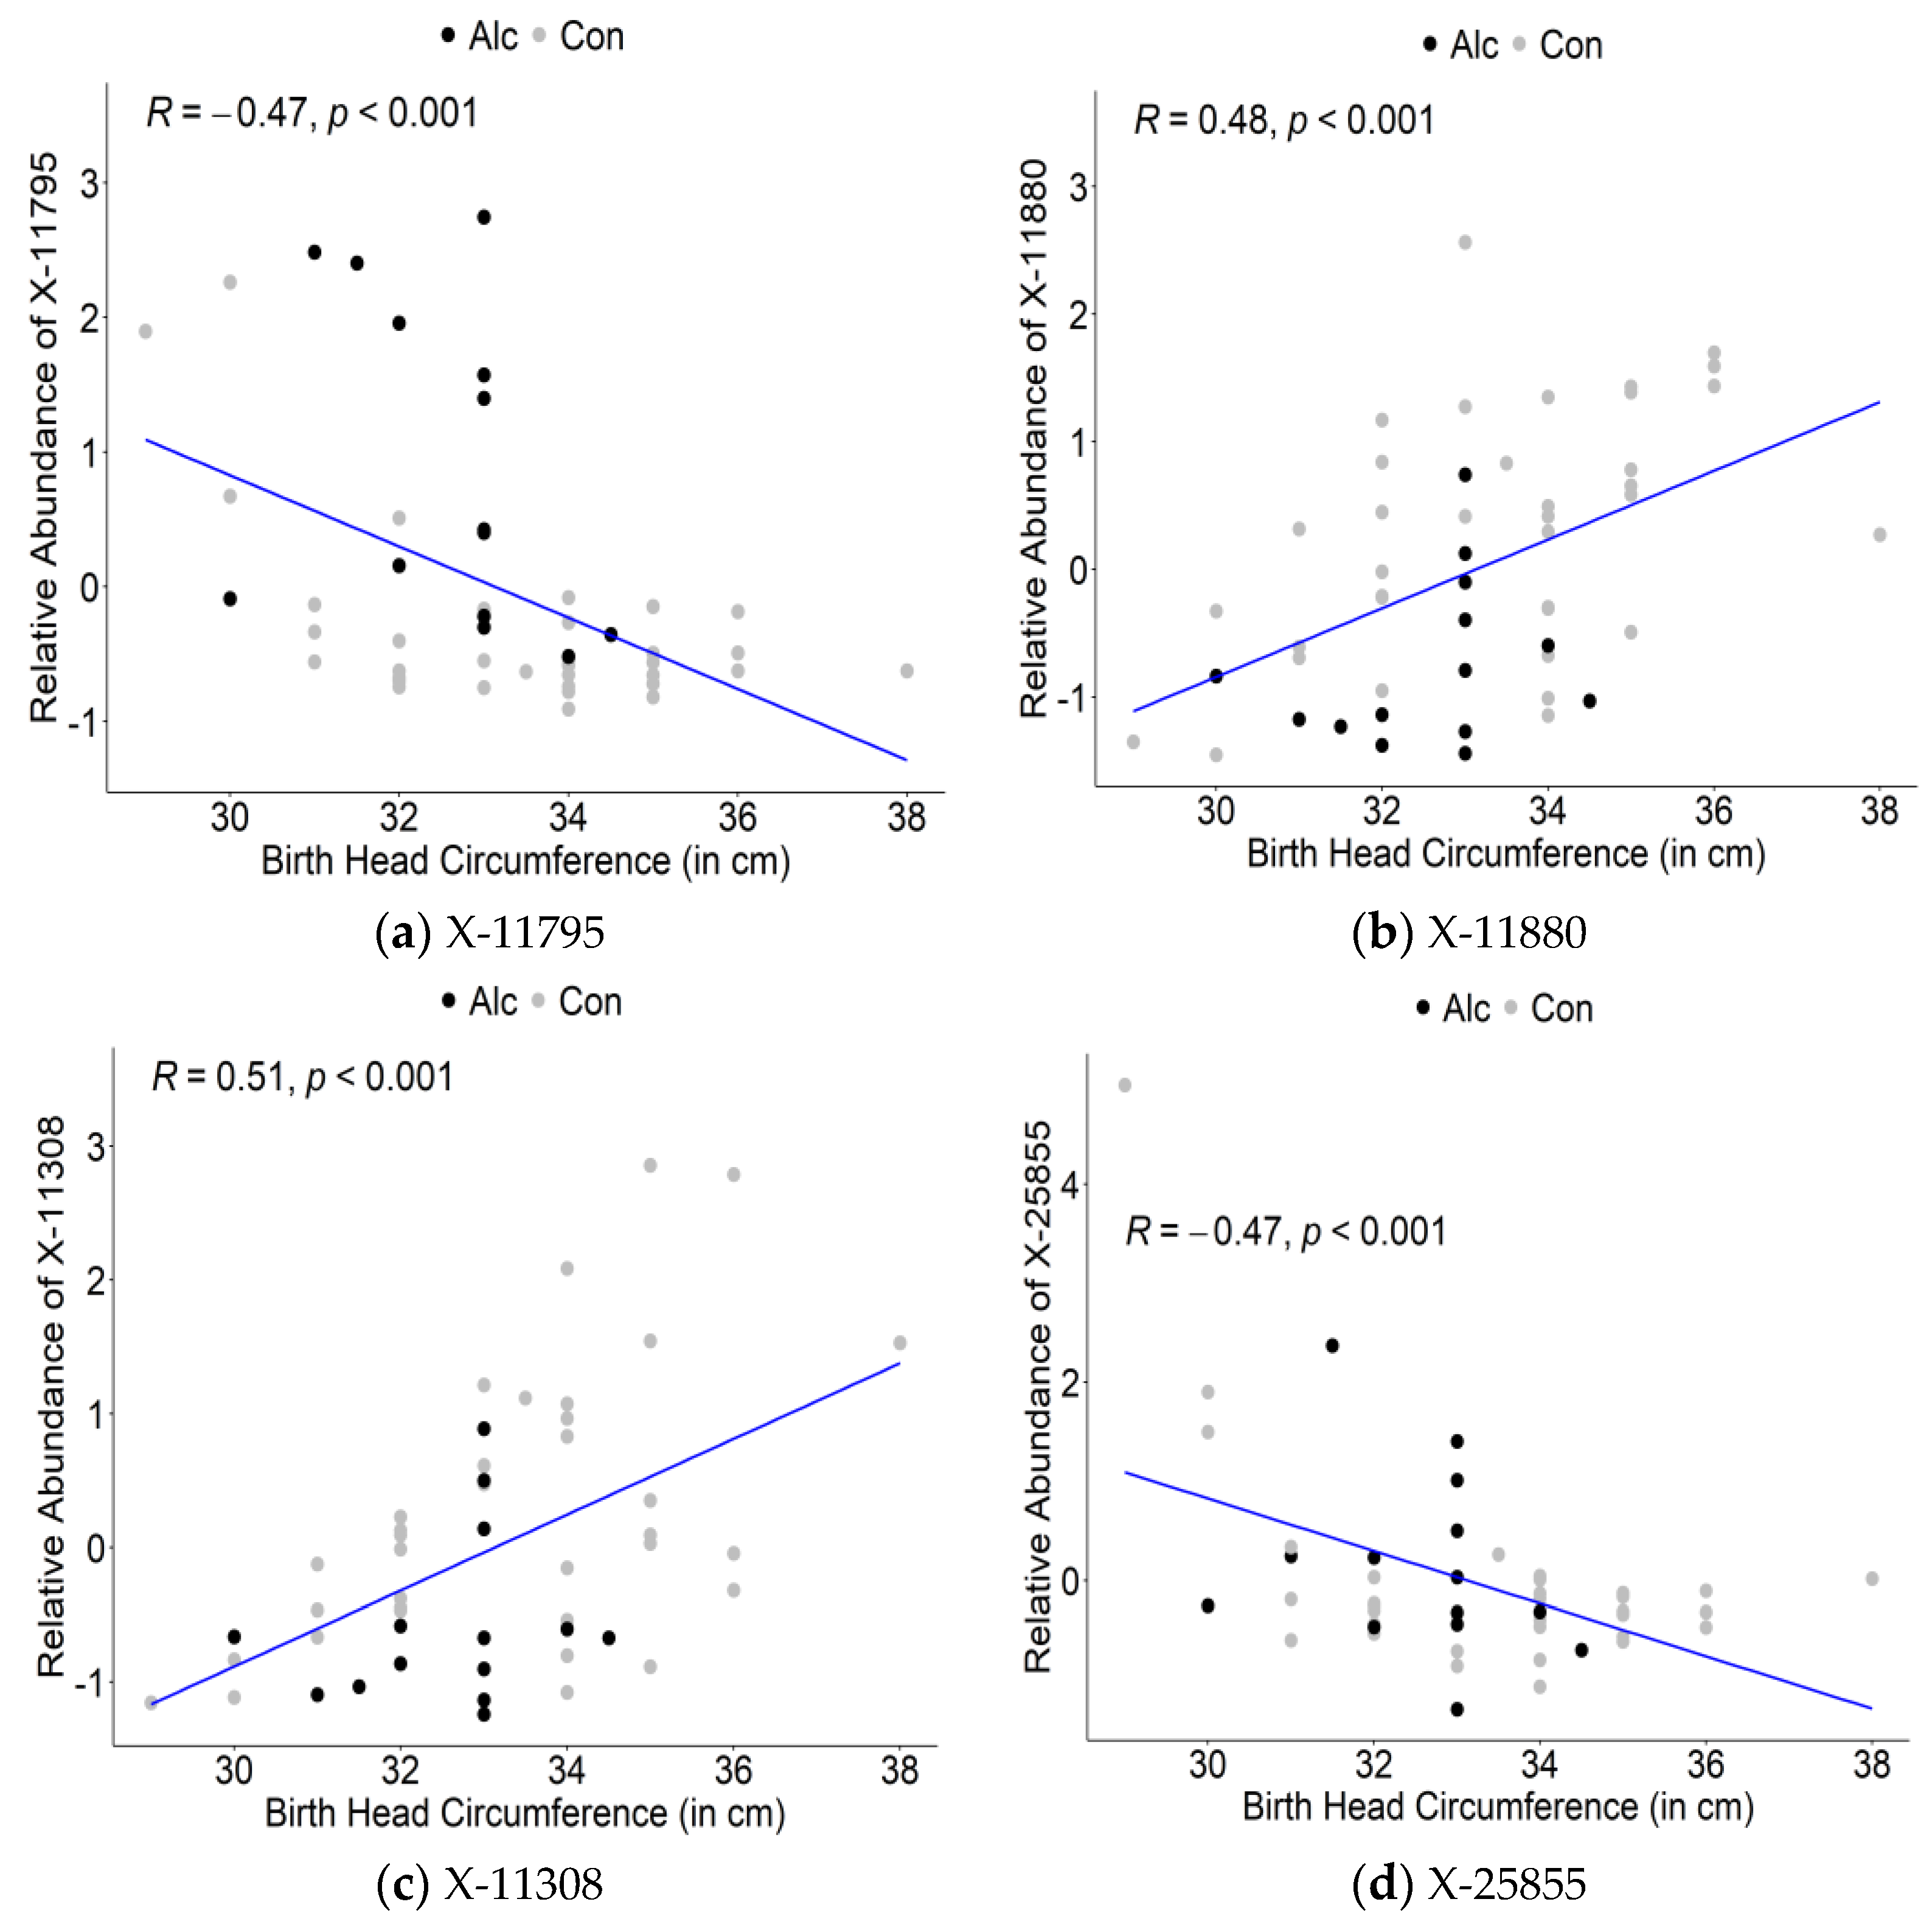
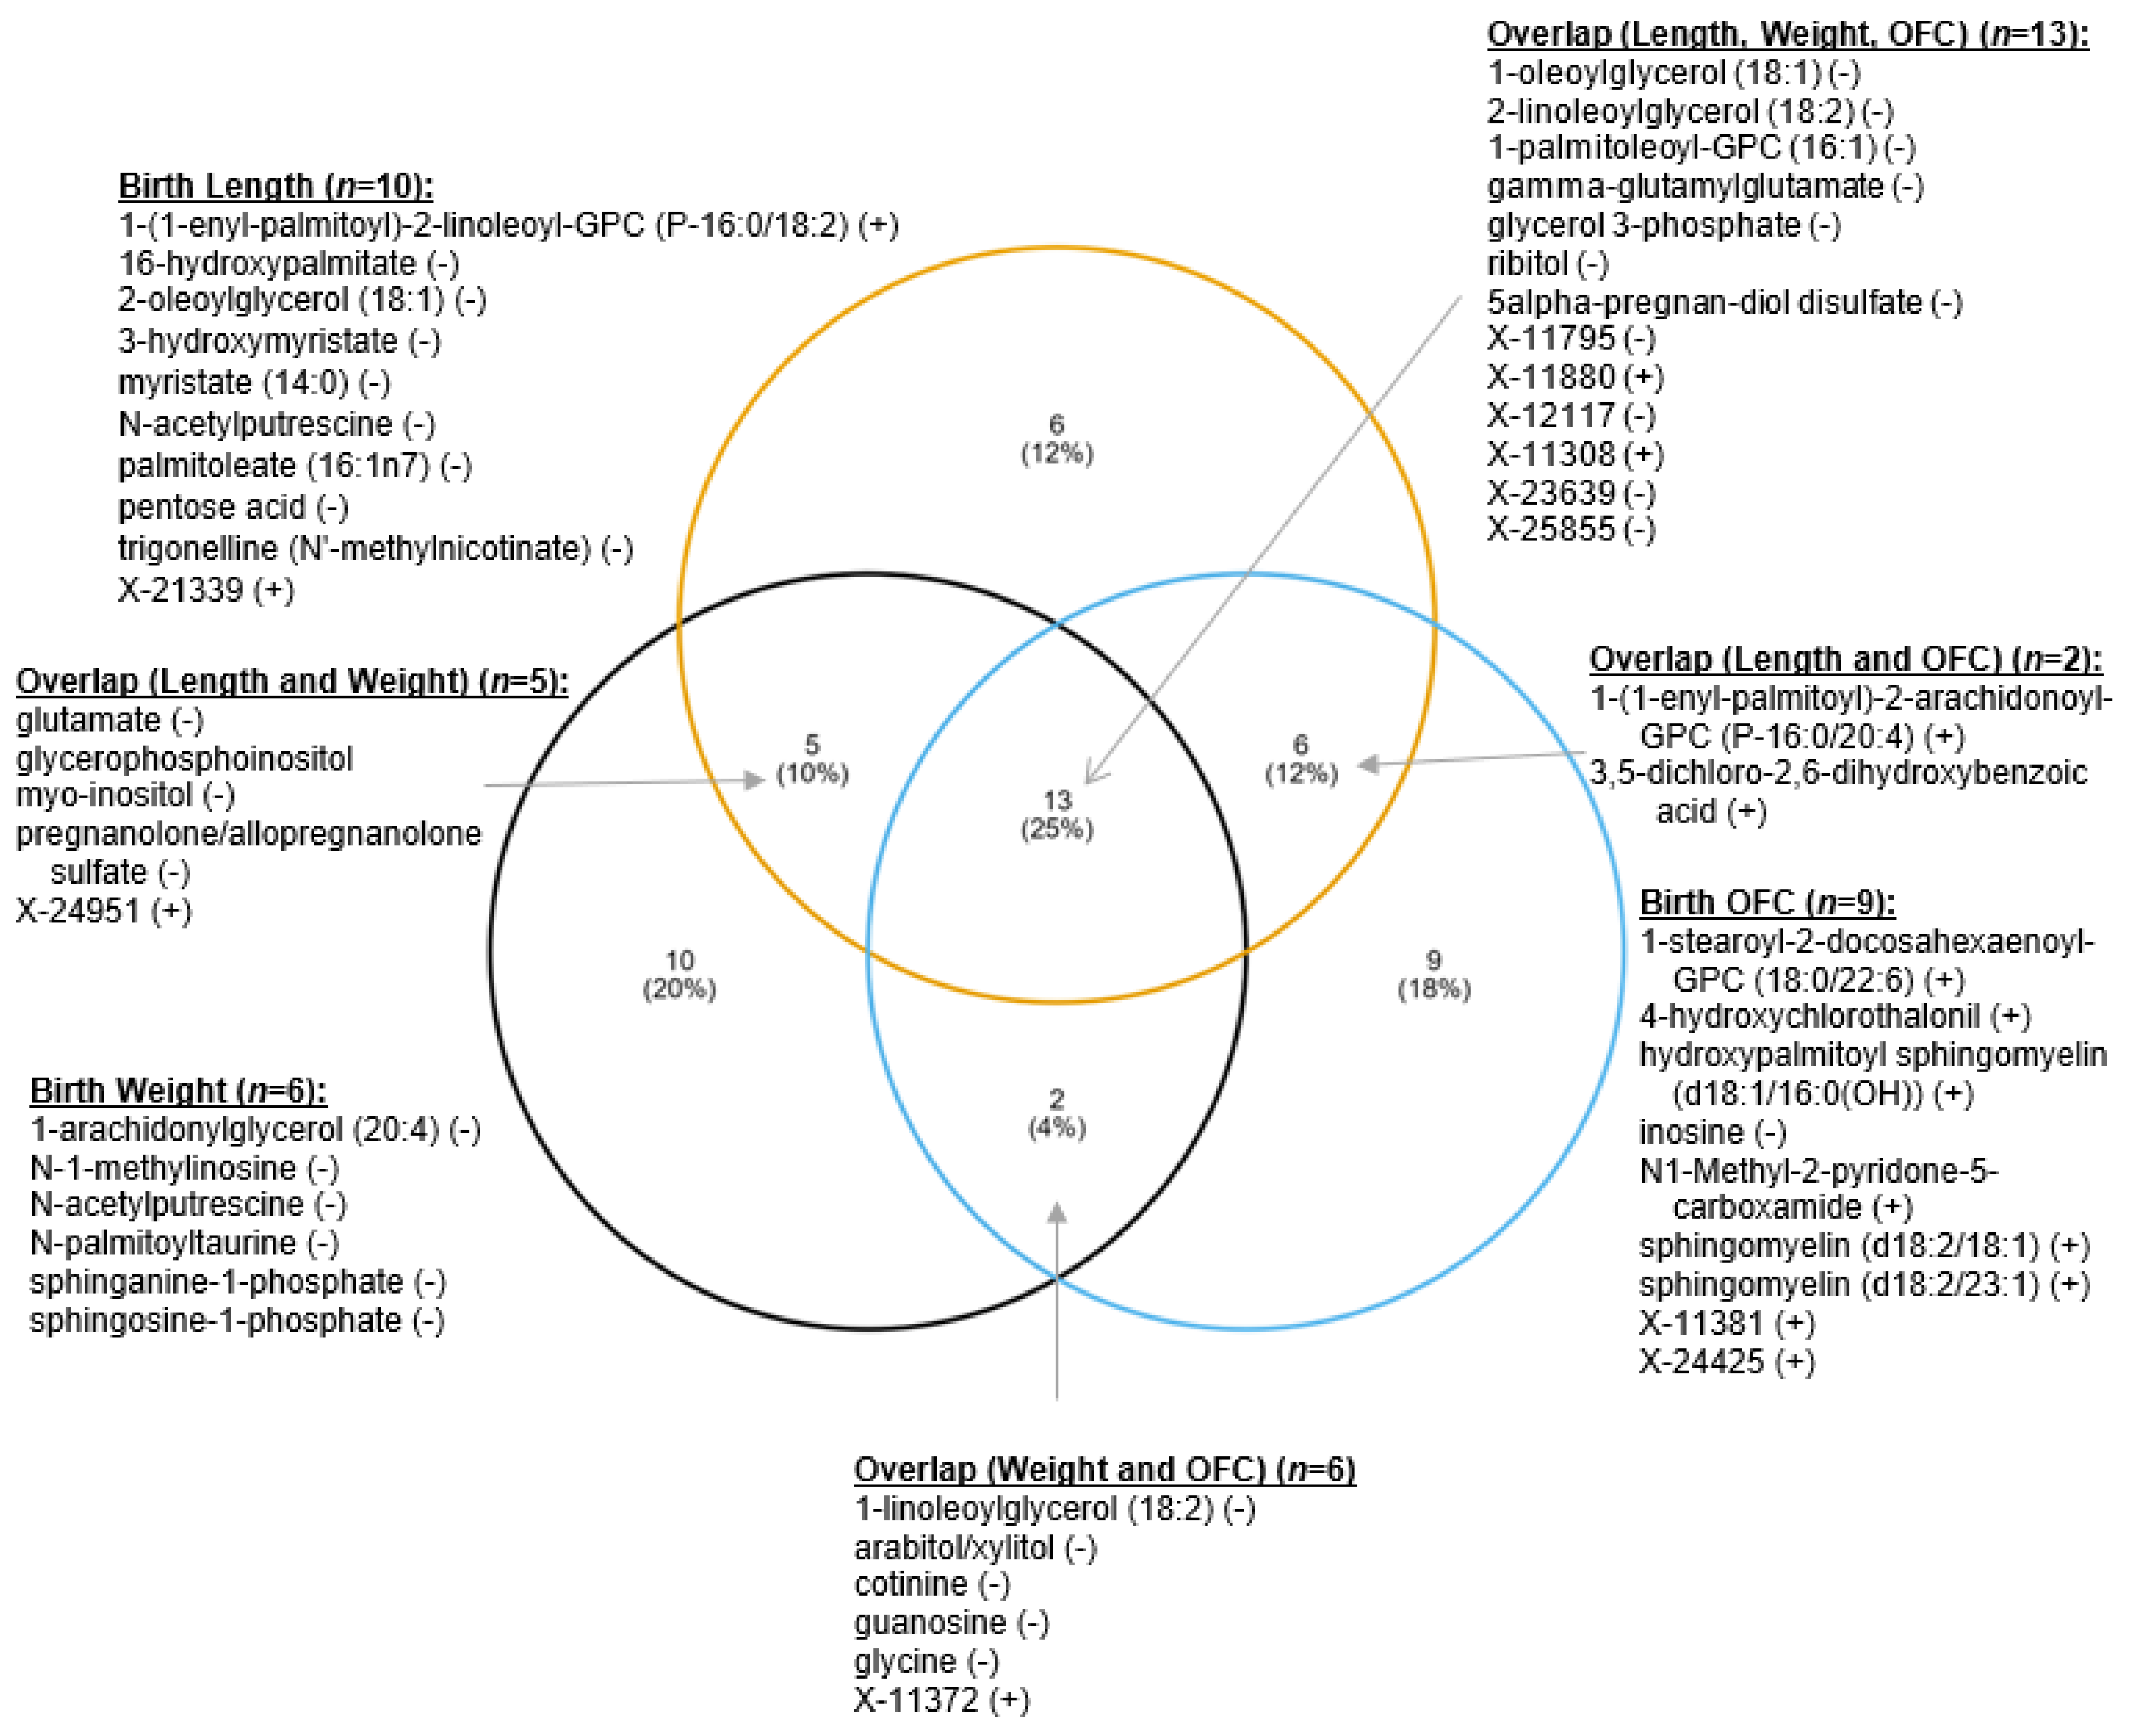
3.3. Maternal Metabolite Profiles Associated with Infant Birth Measurements
4. Discussion
4.1. Energy Utilization Alterations: Amino Acid Catabolites and Acyl Carnitines
4.2. Lipid-Derived Alterations
4.3. Other Metabolic Alternations: Phytochemicals, Microbial Products, and Other Metabolites
4.4. Maternal Metabolites Influence Infant Birth Outcomes
4.5. Limitations
5. Conclusions
Supplementary Materials
Author Contributions
Funding
Institutional Review Board Statement
Informed Consent Statement
Data Availability Statement
Acknowledgments
Conflicts of Interest
Abbreviations
References
- Lindsay, K.L.; Hellmuth, C.; Uhl, O.; Buss, C.; Wadhwa, P.D.; Koletzko, B.; Entringer, S. Longitudinal metabolomic profiling of amino acids and lipids across healthy pregnancy. PLoS ONE 2015, 10, e0145794. [Google Scholar] [CrossRef]
- Luan, H.; Meng, N.; Liu, P.; Feng, Q.; Lin, S.; Fu, J.; Davidson, R.; Chen, X.; Rao, W.; Chen, F.; et al. Pregnancy-induced metabolic phenotype variations in maternal plasma. J. Proteome Res. 2014, 13, 1527–1536. [Google Scholar] [CrossRef] [PubMed]
- Fowden, A.L.; Forehead, A.J. Endocrine mechanisms of intrauterine programming. Reproduction. 2004, 127, 515–526. [Google Scholar] [CrossRef]
- Kwon, E.J.; Kim, Y.J. What is fetal programming? A lifetime health is under the control of in utero health. Obstet. Gynecol. Sci. 2017, 60, 506–519. [Google Scholar] [CrossRef]
- Dessì, A.; Marincola, F.C.; Fanos, V. Metabolomics and the great obstetrical syndromes—GDM, PET, and IUGR. Best. Pract. Res. Clin. Obstet. Gynaecol. 2015, 29, 156–164. [Google Scholar] [CrossRef] [PubMed]
- Bahado-Singh, R.O.; Akolekar, R.; Mandal, R.; Dong, E.; Xia, J.; Kruger, M.; Wishart, D.S.; Nicolaides, K. Metabolomics and first-trimester prediction of early-onset preeclampsia. J. Matern. Neonatal. Med. 2012, 25, 1840–1847. [Google Scholar] [CrossRef]
- Youssef, L.; Simões, R.V.; Miranda, J.; García-Martín, M.L.; Paules, C.; Crovetto, F.; Amigó, N.; Cañellas, N.; Gratacos, E.; Crispi, F. Paired maternal and fetal metabolomics reveal a differential fingerprint in preeclampsia versus fetal growth restriction. Sci. Rep. 2021, 11, 14422. [Google Scholar] [CrossRef]
- Jehan, F.; Sazawal, S.; Baqui, A.H.; Nisar, M.I.; Dhingra, U.; Khanam, R.; Ilyas, M.; Dutta, A.; Mitra, D.K.; Mehmood, U.; et al. Multiomics Characterization of Preterm Birth in Low-and Middle-Income Countries. JAMA Netw. Open 2020, 3, e2029655. [Google Scholar] [CrossRef]
- Lizewska, B.; Teul, J.; Kuc, P.; Lemancewicz, A.; Charkiewicz, K.; Goscik, J.; Kacerovsky, M.; Menon, R.; Miltyk, W.; Laudanski, P. Maternal plasma metabolomic profiles in spontaneous preterm birth: Preliminary results. Mediators Inflamm. 2018, 2018, 9362820. [Google Scholar] [CrossRef] [Green Version]
- Morillon, A.C.; Yakkundi, S.; Thomas, G.; Gethings, L.A.; Langridge, J.I.; Baker, P.N.; Kenny, L.C.; English, J.A.; McCarthy, F.P. Association between phospholipid metabolism in plasma and spontaneous preterm birth: A discovery lipidomic analysis in the cork pregnancy cohort. Metabolomics 2020, 16, 19. [Google Scholar] [CrossRef]
- Saini, N.; Virdee, M.S.; Helfrich, K.K.; Kwan, S.T.C.; Mooney, S.M.; Smith, S.M. Untargeted metabolome analysis reveals reductions in maternal hepatic glucose and amino acid content that correlate with fetal organ weights in a mouse model of Fetal Alcohol Spectrum Disorders. Nutrients 2022, 14, 1096. [Google Scholar] [CrossRef]
- Virdee, M.S.; Saini, N.; Kay, C.D.; Neilson, A.P.; Kwan, S.T.C.; Helfrich, K.K.; Mooney, S.M.; Smith, S.M. An enriched biosignature of gut microbiota-dependent metabolites characterizes maternal plasma in a mouse model of fetal alcohol spectrum disorder. Sci. Rep. 2021, 11, 248. [Google Scholar] [CrossRef]
- May, P.A.; Chambers, C.D.; Kalberg, W.O.; Zellner, J.; Feldman, H.; Buckley, D.; Kopald, D.; Hasken, J.M.; Xu, R.; Honerkamp-Smith, G.; et al. Prevalence of Fetal Alcohol Spectrum Disorders in 4 US Communities. J. Am. Med. Assoc. 2018, 319, 474–482. [Google Scholar] [CrossRef] [PubMed] [Green Version]
- Lange, S.; Probst, C.; Gmel, G.; Rehm, J.; Burd, L.; Popova, S. Global prevalence of fetal alcohol spectrum disorder among children and youth: A systematic review and meta-analysis. JAMA Pediatr. 2017, 171, 948–956. [Google Scholar] [CrossRef]
- May, P.A.; Blankenship, J.; Marais, A.-S.; Gossage, J.P.; Kalberg, W.O.; Barnard, R.; De Vries, M.; Robinson, L.K.; Adnams, C.M.; Buckley, D.; et al. Approaching the Prevalence of the Full Spectrum of Fetal Alcohol Spectrum Disorders in a South African Population-Based Study. Alcohol Clin. Exp. Res. 2013, 37, 818–830. [Google Scholar] [CrossRef] [Green Version]
- May, P.A.; De Vries, M.; Marais, A.-S.; Kalberg, W.; Buckley, D.; Adnams, C.; Hasken, J.; Tabachnick, B.; Robinson, L.; Manning, M.; et al. Replication of High Fetal Alcohol Spectrum Disorders Prevalence Rates, Child Characteristics, and Maternal Risk Factors in a Second Sample of Rural Communities in South Africa. Int. J. Environ. Res. Public Health 2017, 14, 522. [Google Scholar] [CrossRef] [Green Version]
- May, P.A.; Marais, A.S.; De Vries, M.M.; Buckley, D.; Kalberg, W.O.; Hasken, J.M.; Stegall, J.M.; Hedrick, D.M.; Robinson, L.K.; Manning, M.A.; et al. The Prevalence, Child Characteristics, and Maternal Risk Factors for the Continuum of Fetal Alcohol Spectrum Disorders: A sixth Population-Based Study in the Same South African Community. Drug Alcohol Depend. 2021, 218, 108408. [Google Scholar] [CrossRef] [PubMed]
- May, P.A.; Marais, A.S.; De Vries, M.M.; Kalberg, W.O.; Buckley, D.; Hasken, J.M.; Adnams, C.M.; Barnard, R.; Joubert, B.; Cloete, M.; et al. The Continuum of Fetal Alcohol Spectrum Disorders in a Community in South Africa: Prevalence and Characteristics in a Fifth Sample. Drug Alcohol Depend. 2016, 168, 274–286. [Google Scholar] [CrossRef] [PubMed] [Green Version]
- Hoyme, H.E.; Kalberg, W.O.; Elliott, A.J.; Blankenship, J.; Buckley, D.; Marais, A.-S.; Manning, M.A.; Robinson, L.K.; Adam, M.P.; Abdul-Rahman, O.; et al. Updated Clinical Guidelines for Diagnosing Fetal Alcohol Spectrum Disorders. Pediatrics 2016, 138, e20154256. [Google Scholar] [CrossRef] [Green Version]
- Hoyme, H.E.; May, P.A.; Kalberg, W.O.; Kodituwakku, P.W.; Gossage, J.P.; Trujillo, P.M.; Buckley, D.G.; Miller, J.H.; Aragon, A.S.; Khaole, N.; et al. A Practical Clinical Approach to Diagnosis of Fetal Alcohol Spectrum Disorders: Clarification of the Institute of Medicine Criteria. Pediatrics 2005, 115, 39–47. [Google Scholar] [CrossRef] [PubMed]
- Stratton, K.; Howe, C.; Battaglia, F. Fetal Alcohol Syndrome: Diagnosis, Epidemiology, Prevention, and Treatment; National Academies Press: Washington, DC, USA, 1996. [Google Scholar]
- May, P.A.; Blankenship, J.; Marais, A.S.; Gossage, J.P.; Kalberg, W.O.; Joubert, B.; Cloete, M.; Barnard, R.; De Vries, M.; Hasken, J.; et al. Maternal Alcohol Consumption Producing Fetal Alcohol Spectrum Disorders (FASD): Quantity, Frequency, and Timing of Drinking. Drug Alcohol Depend. 2013, 133, 502–512. [Google Scholar] [CrossRef] [Green Version]
- Gemma, S.; Vichi, S.; Testai, E. Metabolic and genetic factors contributing to alcohol induced effects and fetal alcohol syndrome. Neurosci. Biobehav. Rev. 2007, 31, 221–229. [Google Scholar] [CrossRef]
- May, P.A.; Hamrick, K.J.; Corbin, K.D.; Hasken, J.M.; Marais, A.S.; Blankenship, J.; Hoyme, H.E.; Gossage, J.P. Maternal Nutritional Status as a Contributing Factor for the Risk of Fetal Alcohol Spectrum Disorders. Reprod. Toxicol. 2016, 59, 101–108. [Google Scholar] [CrossRef] [Green Version]
- May, P.A.; Hamrick, K.J.; Corbin, K.D.; Hasken, J.M.; Marais, A.S.; Brooke, L.E.; Blankenship, J.; Hoyme, H.E.; Gossage, J.P. Dietary Intake, Nutrition, and Fetal Alcohol Spectrum Disorders in the Western Cape Province of South Africa. Reprod. Toxicol. 2014, 46, 31–39. [Google Scholar] [CrossRef] [Green Version]
- Zeisel, S.H. What choline metabolism can tell us about the underlying mechanisms of fetal alcohol spectrum disorders. Mol. Neurobiol. 2011, 44, 185–191. [Google Scholar] [CrossRef] [Green Version]
- Carter, R.C.; Dodge, N.C.; Molteno, C.D.; Meintjes, E.M.; Jacobson, J.L.; Jacobson, S.W. Mediating and Moderating Effects of Iron Homeostasis Alterations on Fetal Alcohol-Related Growth and Neurobehavioral Deficits. Nutrients 2022, 14, 4432. [Google Scholar] [CrossRef]
- Helfrich, K.K.; Saini, N.; Kling, P.J.; Smith, S.M. Maternal iron nutriture as a critical modulator of fetal alcohol spectrum disorder risk in alcohol-exposed pregnancies. Biochem. Cell. Biol. 2018, 96, 204–212. [Google Scholar] [CrossRef] [Green Version]
- Huebner, S.M.; Blohowiak, S.E.; Kling, P.J.; Smith, S.M. Prenatal Alcohol Exposure Alters Fetal Iron Distribution and Elevates Hepatic Hepcidin in a Rat Model of Fetal Alcohol Spectrum Disorders. J. Nutr. 2016, 146, 1180–1188. [Google Scholar] [CrossRef] [Green Version]
- Keen, C.L.; Uriu-Adams, J.Y.; Skalny, A.; Grabeklis, A.; Grabeklis, S.; Green, K.; Yevtushok, L.; Wertelecki, W.W.; Chambers, C.D. The plausibility of maternal nutritional status being a contributing factor to the risk for fetal alcohol spectrum disorders: The potential influence of zinc status as an example. BioFactors 2010, 36, 125–135. [Google Scholar] [CrossRef] [Green Version]
- Haggarty, P.; Abramovich, D.R.; Page, K. The effect of maternal smoking and ethanol on fatty acid transport by the human placenta. Br. J. Nutr. 2002, 87, 247–252. [Google Scholar] [CrossRef]
- Palmer, J.A.; Poenitzsch, A.M.; Smith, S.M.; Conard, K.R.; West, P.R.; Cezar, G.G. Metabolic Biomarkers of Prenatal Alcohol Exposure in Human Embryonic Stem Cell-Derived Neural Lineages. Alcohol Clin. Exp. Res. 2012, 36, 1314–1324. [Google Scholar] [CrossRef] [Green Version]
- Jaremek, M.; Yu, Z.; Mangino, M.; Mittelstrass, K.; Prehn, C.; Singmann, P.; Xu, T.; Dahmen, N.; Weinberger, K.M.; Suhre, K.; et al. Alcohol-induced metabolomic differences in humans. Transl. Psychiatry 2013, 3, e276. [Google Scholar] [CrossRef] [Green Version]
- Saini, N.; Virdee, M.; Helfrich, K.K.; Kwan, S.T.C.; Smith, S.M. Global metabolomic profiling reveals hepatic biosignatures that reflect the unique metabolic needs of late-term mother and fetus. Metabolomics 2021, 17, 23. [Google Scholar] [CrossRef]
- Evans, A.M.; DeHaven, C.D.; Barrett, T.; Mitchell, M.; Milgram, E. Integrated, nontargeted ultrahigh performance liquid chromatography/ electrospray ionization tandem mass spectrometry platform for the identification and relative quantification of the small-molecule complement of biological systems. Anal. Chem. 2009, 81, 6656–6667. [Google Scholar] [CrossRef]
- Dehaven, C.D.; Evans, A.M.; Dai, H.; Lawton, K.A. Organization of GC/MS and LC/MS metabolomics data into chemical libraries. J. Cheminform. 2010, 2, 9. [Google Scholar] [CrossRef] [Green Version]
- RStudio Team. RStudio: Integrated Development Environment for R. RStudio, PBC, Boston, MA. 2022. Available online: http://www.rstudio.com/ (accessed on 7 November 2022).
- Pang, Z.; Chong, J.; Li, S.; Xia, J. MetaboAnalystR 3.0: Toward an Optimized Workflow for Global Metabolomics. Metabolites 2020, 10, 186. [Google Scholar] [CrossRef]
- Thevenot, E.A.; Roux, A.; Xu, Y.; Ezan, E.; Junot, C. Analysis of the human adult urinary metabolome variations with age, body mass index and gender by implementing a comprehensive workflow for univariate and OPLS statistical analyses. J. Proteome Res. 2015, 14, 3322–3335. [Google Scholar] [CrossRef]
- Kassambara, A. Rstatix: Pipe-Friendly Framework for Basic Statistical Tests. R Package Version 0.7.0. 2021. Available online: https://CRAN.R-project.org/package=rstatix (accessed on 7 November 2022).
- Kassambara, A. ggpubr: ’ggplot2’ Based Publication Ready Plots. R Package Version 0.4.0. 2020. Available online: https://CRAN.R-project.org/package=ggpubr (accessed on 7 November 2022).
- Langenau, J.; Oluwagbemigun, K.; Brachem, C.; Lieb, W.; Giuseppe, R.d.; Artati, A.; Kastenmüller, G.; Weinhold, L.; Schmid, M.; Nöthlings, U. Blood Metabolomic Profiling Confirms and Identifies Biomarkers of Food Intake. Metabolites 2020, 10, 468. [Google Scholar] [CrossRef]
- Jeon, S.; Carr, R. Alcohol effects on hepatic lipid metabolism. J. Lipid Res. 2020, 61, 470–479. [Google Scholar] [CrossRef] [Green Version]
- Henderson, G.; Patwardhan, R.; McLeroy, S.; Schenker, S. Inhibition of placental amino acid uptake in rats following acute and chronic ethanol exposure. Alcohol. Clin. Exp. Res. 1982, 6, 495–505. [Google Scholar] [CrossRef]
- Naik, V.S.; Lee, H.; Wu, G.; Washburn, S.; Ramadoss, J. Effects of nutrition and gestional alcohol consumption on fetal growth and development. Nutr. Rev. 2022, 80, 1568–1579. [Google Scholar] [CrossRef] [PubMed]
- Young, J.K.; Giesbrecht, H.E.; Eskin, M.N.; Aliani, M.; Suh, M. Nutrition Implications for Fetal Alcohol Spectrum Disorder. Adv. Nutr. An. Int. Rev. J. 2014, 5, 675–692. [Google Scholar] [CrossRef] [Green Version]
- Signorelli, P.; Conte, C.; Albi, E. The multiple roles of sphingomyelin in parkinson’s disease. Biomolecules 2021, 11, 1311. [Google Scholar] [CrossRef]
- Slotte, J.P. Biological functions of sphingomyelins. Prog. Lipid. Res. 2013, 52, 424–437. [Google Scholar] [CrossRef]
- Gautam, P.; Lebel, C.; Narr, K.L.; Mattson, S.N.; May, P.A.; Adnams, C.M.; Riley, E.P.; Jones, K.L.; Kan, E.C.; Sowell, E.R. Volume Changes and Brain-Behavior Relationships in White Matter and Subcortical Gray Matter in Children with Prenatal Alcohol Exposure. Hum. Brain. Mapp. 2015, 36, 2318–2329. [Google Scholar] [CrossRef] [Green Version]
- Wozniak, J.R.; Mueller, B.A.; Bell, C.J.; Muetzel, R.L.; Hoecker, H.L.; Boys, C.J.; Lim, K.O. Global Functional Connectivity Abnormalities in Children with Fetal Alcohol Spectrum Disorders. Alcohol Clin. Exp. Res. 2013, 37, 748–756. [Google Scholar] [CrossRef] [Green Version]
- Guertin, K.A.; Moore, S.C.; Sampson, J.N.; Huang, W.Y.; Xiao, Q.; Stolzenberg-Solomon, R.Z.; Sinha, R.; Cross, A.J. Metabolomics in nutritional epidemiology: Identifying metabolites associated with diet and quantifying their potential to uncover diet-disease relations in populations. Am. J. Clin. Nutr. 2014, 100, 208–217. [Google Scholar] [CrossRef] [Green Version]
- Playdon, M.C.; Ziegler, R.G.; Sampson, J.N.; Stolzenberg-Solomon, R.; Thompson, H.J.; Irwin, M.L.; Mayne, S.T.; Hoover, R.N.; Moore, S.C. Nutritional metabolomics and breast cancer risk in a prospective study. Am. J. Clin. Nutr. 2017, 106, 637–649. [Google Scholar] [CrossRef] [PubMed] [Green Version]
- Valenzuela, C.F.; Partridge, L.D.; Mameli, M.; Meyer, D.A. Modulation of glutamatergic transmission by sulfated steroids: Role in fetal alcohol spectrum disorder. Brain Res. Rev. 2008, 57, 506–519. [Google Scholar] [CrossRef] [Green Version]
- Engen, P.A.; Green, S.J.; Voigt, R.M.; Forsyth, C.B.; Keshavarzian, A. The gastrointestinal microbiome: Alcohol effects on the composition of intestinal microbiota. Alcohol. Res. 2015, 37, 223–236. [Google Scholar]
- Bodnar, T.S.; Lee, C.; Wong, A.; Rubin, I.; Parfrey, L.W.; Weinberg, J. Evidence for long-lasting alterations in the fecal microbiota following prenatal alcohol exposure. Alcohol. Clin. Exp. Res. 2022, 46, 542–555. [Google Scholar] [CrossRef] [PubMed]
- Wozniak, J.R.; Fink, B.A.; Fuglestad, A.J.; Eckerle, J.K.; Boys, C.J.; Sandness, K.E.; Radke, J.P.; Miller, N.C.; Lindgren, C.; Brearley, A.M.; et al. Four-year follow-up of a randomized controlled trial of choline for neurodevelopment in fetal alcohol spectrum disorder. J. Neurodev. Disord. 2020, 12, 9. [Google Scholar] [CrossRef] [PubMed]
- Morell, P.; Quarles, R.H. Myelin Formation, Structure and Biochemistry. In Basic Neurochemistry: Molecular, Cellular and Medical Aspects; Siegel, G.J., Albers, R.W., Brady, S.T., Price, D.L., Eds.; Elsevier Academic Press: Burlington, MA, USA, 2006; pp. 51–57. [Google Scholar]
- Wozniak, J.R.; Mueller, B.A.; Mattson, S.N.; Coles, C.D.; Kable, J.A.; Jones, K.L.; Boys, C.J.; Lim, K.O.; Riley, E.P.; Sowell, E.R. Functional Connectivity Abnormalities and Associated Cognitive Deficits in Fetal Alcohol Spectrum Disorders (FASD). Brain Imaging Behav. 2017, 11, 1432–1445. [Google Scholar] [CrossRef] [PubMed]
- Wozniak, J.R.; Muetzel, R.L. What does diffusion tensor imaging reveal about the brain and cognition in fetal alcohol spectrum disorders? Neuropsychol. Rev. 2011, 21, 133–147. [Google Scholar] [CrossRef]
- Yousri, N.A.; Suhre, K.; Yassin, E.; Al-Shakaki, A.; Robay, A.; Elshafei, M.; Chidiac, O.; Hunt, S.C.; Crystal, R.G.; Fakhro, K.A. Metabolic and Metabo-Clinical Signatures of Type 2 Diabetes, Obesity, Retinopathy, and Dyslipidemia. Diabetes 2022, 71, 184–205. [Google Scholar] [CrossRef] [PubMed]
- Pallister, T.; Jennings, A.; Mohney, R.P.; Yarand, D.; Mangino, M.; Cassidy, A.; MacGregor, A.; Spector, T.D.; Menni, C. Characterizing blood metabolomics profiles associated with self-reported food intakes in female twins. PLoS ONE 2016, 11, e0158568. [Google Scholar] [CrossRef] [Green Version]
- Playdon, M.C.; Sampson, J.N.; Cross, A.J.; Sinha, R.; Guertin, K.A.; Moy, K.A.; Rothman, N.; Irwin, M.L.; Mayne, S.T.; Stolzenberg-Solomon, R.; et al. Comparing metabolite profiles of habitual diet in serum and urine. Am. J. Clin. Nutr. 2016, 104, 776–789. [Google Scholar] [CrossRef] [Green Version]
- Zheng, Y.; Yu, B.; Alexander, D.; Manolio, T.A.; Aguilar, D.; Coresh, J.; Heiss, G.; Boerwinkle, E.; Nettleton, J.A. Associations between metabolomic compounds and incident heart failure among African Americans: The ARIC study. Am. J. Epidemiol. 2013, 178, 534–542. [Google Scholar] [CrossRef] [PubMed]


| All Women 1 (n = 52) | Alcohol-Exposed (Past 7 Days) (n = 14) | No Alcohol Consumption in Past 7 Days (n = 38) | p 1 | ||||
|---|---|---|---|---|---|---|---|
| Demographics | Mean | (SD) | Mean | (SD) | Mean | (SD) | |
| Height (in cm) | 156.7 | (7.0) | 156.9 | (6.1) | 156.6 | (7.3) | 0.890 |
| Weight (in kg) | 65.7 | (19.4) | 62.4 | (18.8) | 67.0 | (19.6) | 0.450 |
| Body Mass Index (BMI) | 26.8 | (7.9) | 25.4 | (7.8) | 27.4 | (8.0) | 0.438 |
| OFC (in cm) | 53.8 | (1.9) | 53.5 | (1.8) | 53.8 | (2.0) | 0.696 |
| Left Upper Arm (in cm) | 26.5 | (5.4) | 24.9 | (3.8) | 27.1 | (5.8) | 0.197 |
| Age at Interview | 27.2 | (6.5) | 30.3 | (5.5) | 26.1 | (6.5) | 0.036 |
| Gravidity | 2.8 | (1.3) | 3.5 | (1.5) | 2.5 | (1.2) | 0.013 |
| Parity | 1.6 | (1.2) | 2.3 | (1.3) | 1.4 | (1.1) | 0.015 |
| Self-Reported Alcohol & Other Drugs | |||||||
| Drank Before Pregnancy (% Yes) | 71.2 | 100.0 | 60.5 | 0.005 | |||
| Avg. DDD—before pregnancy 2 | 6.1 | (2.8) | 6.1 | (2.8) | 6.1 | (2.9) | 0.877 |
| Number of drinking days—before pregnancy 2 | 1.8 | (0.9) | 2.2 | (1.1) | 1.6 | (0.8) | 0.061 |
| Drank in 1st trimester (% Yes) | 69.2 | 100.0 | 57.9 | 0.004 | |||
| Avg. DDD—in 1st trimester 2 | 5.8 | (2.9) | 5.6 | (3.0) | 2.9 | (3.0) | 0.799 |
| Number of drinking days—in 1st trimester 2 | 1.8 | (1.0) | 2.2 | (1.2) | 1.6 | (0.8) | 0.067 |
| Drank recently (in the previous 7 days) during pregnancy (% Yes) | 26.9 | 100.0 | 0.0 | <0.001 | |||
| Avg. DDD—previous 7 days 2 | 4.0 | (2.1) | 4.0 | (2.1) | -- | -- | -- |
| Number of drinking days—previous 7 days 2 | 1.9 | (0.9) | 1.9 | (0.9) | -- | -- | -- |
| Used tobacco during pregnancy (% Yes) | 53.8 | 85.7 | 57.9 | 0.005 | |||
| Used other drugs during pregnancy (% Yes) | 0.0 | 0.0 | 0.0 | -- | |||
| Alcohol Biomarker: Relative Abundance | |||||||
| Ethyl alpha glucopyranoside | 130,957.1 (248,451.9) | 283,790.6 (429,289.4) | 68,025.62 (36,433.28) | 0.245 | |||
| Ethyl beta glucopyranoside 3 | 288,558.4 (638,093.5) | 574,988.8 (943,709.4) | 92,579.74 (87,786.57) | 0.020 | |||
| Biochemical Name | Relative Abundance Mean | Fold Change 1 | log2(FC) | FDR 2 | |
|---|---|---|---|---|---|
| Alc | Con | ||||
| Acyl Carnitines | |||||
| carnitine | 118,352,430 | 96,072,262 | 1.23 | 0.30 | 0.07914 |
| acetylcarnitine (C2) | 9,728,562 | 5,937,530 | 1.64 | 0.71 | 0.084043 |
| isobutyrylcarnitine (C4) | 900,579 | 594,692 | 1.51 | 0.60 | 0.037839 |
| (R)-3-hydroxybutyrylcarnitine (C4) | 91,719 | 50,728 | 1.81 | 0.85 | 0.021685 |
| (S)-3-hydroxybutyrylcarnitine (C4) | 82,182 | 46,777 | 1.76 | 0.81 | 0.015661 |
| 2-methylbutyrylcarnitine (C5) | 174,872 | 94,909 | 1.84 | 0.88 | 0.035527 |
| isovalerylcarnitine (C5) | 624,704 | 450,542 | 1.39 | 0.47 | 0.057764 |
| beta-hydroxyisovaleroylcarnitine | 1,902,421 | 1,294,463 | 1.47 | 0.56 | 0.025134 |
| hexanoylcarnitine (C6) | 263,025 | 185,087 | 1.42 | 0.51 | 0.057764 |
| myristoleoylcarnitine (C14:1) | 238,415 | 144,643 | 1.65 | 0.72 | 0.021757 |
| palmitoleoylcarnitine (C16:1) | 834,256 | 499,204 | 1.67 | 0.74 | 0.015661 |
| Amino Acid Catabolites | |||||
| indole-3-carboxylate | 513,556 | 630,299 | 0.81 | −0.30 | 0.057764 |
| kynurenate | 197,290 | 235,324 | 0.84 | −0.25 | 0.082970 |
| 4-guanidinobutanoate | 7,039,465 | 8,259,819 | 0.85 | −0.23 | 0.085952 |
| Sphingomyelins | |||||
| sphingomyelin (d17:1/16:0, d18:1/15:0, d16:1/17:0) | 4,083,609 | 5,660,430 | 0.72 | −0.47 | 0.02645 |
| sphingomyelin (d18:1/17:0, d17:1/18:0, d19:1/16:0) | 2,344,136 | 3,179,638 | 0.74 | −0.44 | 0.02501 |
| sphingomyelin (d18:1/19:0, d19:1/18:0) | 547,267 | 786,114 | 0.70 | −0.52 | 0.04540 |
| sphingomyelin (d18:1/20:0, d16:1/22:0) | 7,422,894 | 8,847,552 | 0.84 | −0.25 | 0.04937 |
| sphingomyelin (d18:1/20:1, d18:2/20:0) | 4,128,434 | 5,413,863 | 0.76 | −0.39 | 0.02176 |
| sphingomyelin (d18:1/21:0, d17:1/22:0, d16:1/23:0) | 1,086,342 | 1,557,715 | 0.70 | −0.52 | 0.02501 |
| sphingomyelin (d18:1/22:1, d18:2/22:0, d16:1/24:1) | 12,137,149 | 14,773,882 | 0.82 | −0.28 | 0.05163 |
| sphingomyelin (d18:1/22:2, d18:2/22:1, d16:1/24:2) | 1,283,423 | 1,626,160 | 0.79 | −0.34 | 0.021757 |
| sphingomyelin (d18:2/16:0, d18:1/16:1) | 13,534,533 | 17,191,969 | 0.79 | −0.35 | 0.062328 |
| sphingomyelin (d18:2/18:1) | 223,567 | 354,266 | 0.63 | −0.66 | 0.049366 |
| sphingomyelin (d18:2/21:0, d16:2/23:0) | 248,474 | 439,680 | 0.57 | −0.82 | 0.021685 |
| sphingomyelin (d18:2/23:0, d18:1/23:1, d17:1/24:1) | 3,435,091 | 4,537,665 | 0.76 | −0.40 | 0.021757 |
| sphingomyelin (d18:2/23:1) | 391,078 | 551,118 | 0.71 | −0.49 | 0.026446 |
| sphingomyelin (d18:2/24:2) | 1,557,823 | 2,113,087 | 0.74 | −0.44 | 0.021757 |
| tricosanoyl sphingomyelin (d18:1/23:0) | 2,795,976 | 3,461,568 | 0.81 | −0.31 | 0.025013 |
| hydroxypalmitoyl sphingomyelin (d18:1/16:0(OH)) | 572,980 | 760,311 | 0.75 | −0.41 | 0.021757 |
| palmitoyl dihydrosphingomyelin (d18:0/16:0) | 7,312,117 | 8,336,650 | 0.88 | −0.19 | 0.084043 |
| Steroids | |||||
| cholesterol | 10,923,644 | 12,495,807 | 0.87 | −0.19 | 0.021757 |
| cortisol | 145,659 | 76,815 | 1.90 | 0.92 | 0.084043 |
| 5alpha-androstan-3beta,17beta-diol disulfate | 159,481 | 75,476 | 2.11 | 1.08 | 0.025134 |
| 5alpha-pregnan-3beta,20alpha-diol monosulfate (2) | 670,377 | 1,170,702 | 0.57 | −0.80 | 0.059394 |
| pregnenediol sulfate (C21H34O5S) | 245,883 | 411,828 | 0.60 | −0.74 | 0.057764 |
| pregnenetriol sulfate | 56,527 | 90,669 | 0.62 | −0.68 | 0.085952 |
| androstenediol (3beta,17beta) disulfate (1) | 3,485,474 | 1,000,067 | 3.49 | 1.80 | 0.046245 |
| Specialized Lipids | |||||
| (2 or 3)-decenoate (10:1n7 or n8) | 111,491 | 140,550 | 0.79 | −0.33 | 0.084043 |
| pentadecanoate (15:0) | 40,396,503 | 480,519,34 | 0.84 | −0.25 | 0.059394 |
| N-palmitoylserine | 245,875 | 308,316 | 0.80 | −0.33 | 0.059394 |
| palmitoyl ethanolamide | 175,718,599 | 201,504,407 | 0.87 | −0.20 | 0.021757 |
| linoleoyl ethanolamide | 52,234 | 95,443 | 0.55 | −0.87 | 0.037839 |
| glycochenodeoxycholate 3-sulfate | 218,818 | 87,130 | 2.51 | 1.33 | 0.084043 |
| 1-linoleoyl-GPA (18:2) | 396,446 | 581,860 | 0.68 | −0.55 | 0.076617 |
| 1-linoleoyl-GPC (18:2) | 5,782,388 | 7,670,952 | 0.75 | −0.41 | 0.025013 |
| 1-oleoyl-GPS (18:1) | 825,394 | 1,271,934 | 0.65 | −0.62 | 0.049366 |
| 1-(1-enyl-palmitoyl)-2-linoleoyl-GPC (P-16:0/18:2) | 1,166,995 | 1,594,375 | 0.73 | −0.45 | 0.026446 |
| 2-hydroxyheptanoate | 3,152,157 | 3,776,354 | 0.83 | −0.26 | 0.056498 |
| alpha-hydroxycaproate | 413,348 | 494,072 | 0.84 | −0.26 | 0.096824 |
| 9,10-DiHOME | 1,241,335 | 1,655,580 | 0.75 | −0.42 | 0.057764 |
| 15-HETE | 2,851,244 | 3,968,058 | 0.72 | −0.48 | 0.098106 |
| 2-hydroxysebacate | 323,393 | 389,143 | 0.83 | −0.27 | 0.098106 |
| 3-carboxy-4-methyl-5-pentyl-2-furanpropionate (3-CMPFP) | 338,493 | 578,390 | 0.59 | −0.78 | 0.046245 |
| eicosenedioate (C20:1-DC) | 109,938 | 188,788 | 0.58 | −0.78 | 0.057764 |
| 2-aminoheptanoate | 134,956 | 209,995 | 0.64 | −0.64 | 0.021685 |
| Phytochemicals / Microbial Products | |||||
| p-hydroxybenzaldehyde | 7,560,374 | 9,289,475 | 0.81 | −0.30 | 0.037236 |
| 4-hydroxybenzoate | 1,444,142 | 1,837,542 | 0.79 | −0.35 | 0.057764 |
| 2-oxindole-3-acetate | 51,328 | 66,566 | 0.77 | −0.38 | 0.090168 |
| 3-formylindole | 6,900,965 | 8,152,590 | 0.85 | −0.24 | 0.021757 |
| 3-phenylpropionate (hydrocinnamate) | 53,859 | 95,887 | 0.56 | −0.83 | 0.079140 |
| 3-methyl catechol sulfate (1) | 188,585 | 110,852 | 1.70 | 0.77 | 0.070938 |
| o-cresol sulfate | 93,537 | 55,448 | 1.69 | 0.75 | 0.057764 |
| piperine | 25,012 | 251,263 | 0.10 | −3.33 | 0.025349 |
| pyrraline | 24,706 | 36,774 | 0.67 | −0.57 | 0.059394 |
| Other Metabolites | |||||
| citrate | 14,310,699 | 17,171,422 | 0.83 | −0.26 | 0.084043 |
| oxalate (ethanedioate) | 15,630,699 | 18,204,085 | 0.86 | −0.22 | 0.059394 |
| 3-aminoisobutyrate | 538,044 | 355,236 | 1.51 | 0.60 | 0.084043 |
| 6-phosphogluconate | 502,951 | 580,785 | 0.87 | −0.21 | 0.096824 |
| acetylphosphate | 10,654,105 | 15,392,171 | 0.69 | −0.53 | 0.096824 |
| phenylacetylglutamine | 645,354 | 1,128,644 | 0.57 | −0.81 | 0.098106 |
| Fibrinopeptide B (1–13) | 773,890 | 1,038,347 | 0.75 | −0.42 | 0.054009 |
| Others | |||||
| cotinine | 1,738,769 | 620,542 | 2.80 | 1.49 | 0.025013 |
| ethyl beta-glucopyranoside | 535,423 | 56,820 | 9.42 | 3.24 | 0.021685 |
| (2-butoxyethoxy)acetic acid | 2,144,519 | 2,598,232 | 0.83 | −0.28 | 0.026446 |
| N-formylanthranilic acid | 2,005,367 | 2,407,944 | 0.83 | −0.26 | 0.059394 |
| 4-hydroxychlorothalonil | 148,112 | 244,884 | 0.60 | −0.73 | 0.084043 |
| succinimide | 131,745 | 208,990 | 0.63 | −0.67 | 0.096824 |
| X-11308 | 346,764 | 541,090 | 0.64 | −0.64 | 0.057764 |
| X-11372 | 1,035,122 | 1,735,238 | 0.60 | −0.75 | 0.021757 |
| X-11795 | 724,612 | 291,990 | 2.48 | 1.31 | 0.015661 |
| X-11880 | 491,137 | 848,065 | 0.58 | −0.79 | 0.021757 |
| X-16935 | 33,165 | 54,359 | 0.61 | −0.71 | 0.070938 |
| X-18059 | 2,566,792 | 3,184,326 | 0.81 | −0.31 | 0.025013 |
| X-21286 | 420,340 | 556,471 | 0.76 | −0.40 | 0.025013 |
| X-21628 | 384,031 | 605,092 | 0.63 | −0.66 | 0.015909 |
| X-23481 | 646,716 | 761,238 | 0.85 | −0.24 | 0.098106 |
| X-23482 | 3,108,264 | 4,128,471 | 0.75 | −0.41 | 0.085952 |
| X-24951 | 127,673 | 209,085 | 0.61 | −0.71 | 0.033020 |
| Pearson’s Correlation | |||||
|---|---|---|---|---|---|
| VIP score | Fold Change (Alc/Con) | q-Value | r-Value | p-Value | |
| X-23639 | 2.968 | 1.38 | 0.1642 | −0.49 | 0.0003 |
| X-11795 | 2.756 | 2.48 | 0.0157 | −0.47 | 0.0006 |
| glycerophosphoinositol | 2.505 | 1.06 | 0.6227 | −0.36 | 0.0113 |
| trigonelline (N′-methylnicotinate) | 2.424 | 1.22 | 0.3079 | −0.47 | 0.0006 |
| 1-palmitoleoyl-GPC (16:1) | 2.418 | 1.36 | 0.2538 | −0.38 | 0.0072 |
| X-11880 | 2.389 | 0.58 | 0.0218 | 0.45 | 0.0010 |
| 1-oleoylglycerol (18:1) | 2.377 | 1.14 | 0.5397 | −0.37 | 0.0081 |
| 1-(1-enyl-palmitoyl)-2-arachidonoyl-GPC (P-16:0/20:4) | 2.330 | 0.86 | 0.2669 | 0.43 | 0.0019 |
| X-12117 | 2.313 | 0.92 | 0.7353 | −0.31 | 0.0266 |
| gamma-glutamylglutamate | 2.303 | 1.30 | 0.2818 | −0.28 | 0.0463 |
| X−25855 | 2.287 | 1.13 | 0.5264 | −0.29 | 0.0415 |
| pregnanolone/allopregnanolone sulfate | 2.279 | 1.03 | 0.9834 | −0.31 | 0.0290 |
| myristate (14:0) | 2.275 | 0.97 | 0.9188 | −0.32 | 0.0232 |
| myo-inositol | 2.275 | 1.05 | 0.8201 | −0.33 | 0.0196 |
| palmitoleate (16:1n7) | 2.249 | 1.29 | 0.4536 | −0.27 | 0.0581 |
| glycerol 3-phosphate | 2.235 | 1.13 | 0.6319 | −0.38 | 0.0063 |
| 5alpha-pregnan-diol disulfate | 2.205 | 1.02 | 0.7277 | −0.33 | 0.0212 |
| 16-hydroxypalmitate | 2.155 | 0.94 | 0.6319 | −0.21 | 0.1450 |
| 2-linoleoylglycerol (18:2) | 2.139 | 0.70 | 0.3825 | −0.34 | 0.0144 |
| 3,5-dichloro-2,6-dihydroxybenzoic acid | 2.137 | 0.94 | 0.9000 | 0.48 | 0.0004 |
| 3-hydroxymyristate | 2.135 | 1.01 | 0.9188 | −0.20 | 0.1640 |
| pentose acid | 2.104 | 1.21 | 0.7181 | −0.32 | 0.0247 |
| glutamate | 2.089 | 1.03 | 0.7008 | −0.33 | 0.0177 |
| N-acetylputrescine | 2.080 | 1.10 | 0.6438 | −0.21 | 0.1410 |
| ribitol | 2.066 | 1.08 | 0.6654 | −0.27 | 0.0596 |
| X-21339 | 2.061 | 0.61 | 0.1244 | 0.36 | 0.0100 |
| 2-oleoylglycerol (18:1) | 2.058 | 1.09 | 0.4511 | −0.36 | 0.0104 |
| 1-(1-enyl-palmitoyl)-2-linoleoyl-GPC (P-16:0/18:2) | 2.054 | 0.73 | 0.0264 | 0.38 | 0.0068 |
| X-24951 | 2.041 | 0.61 | 0.0330 | 0.27 | 0.0565 |
| X-11308 | 2.033 | 0.64 | 0.0578 | 0.31 | 0.0295 |
| Pearson’s Correlation | |||||
|---|---|---|---|---|---|
| VIP Score | Fold Change (Alc/Con) | q-Value | r-Value | p-Value | |
| X-11795 | 2.859 | 2.48 | 0.0157 | −0.53 | 0.0001 |
| X-25855 | 2.744 | 1.13 | 0.5264 | −0.44 | 0.0014 |
| gamma-glutamylglutamate | 2.724 | 1.30 | 0.2818 | −0.39 | 0.0052 |
| X-23639 | 2.606 | 1.38 | 0.1642 | −0.40 | 0.0038 |
| glycerol 3-phosphate | 2.590 | 1.13 | 0.6319 | −0.41 | 0.0032 |
| 1-oleoylglycerol (18:1) | 2.563 | 1.14 | 0.5397 | −0.44 | 0.0014 |
| X-11880 | 2.550 | 0.58 | 0.0218 | 0.51 | 0.0001 |
| X-11308 | 2.466 | 0.64 | 0.0578 | 0.48 | 0.0004 |
| 1-linoleoylglycerol (18:2) | 2.406 | 0.69 | 0.3943 | −0.41 | 0.0032 |
| glycerophosphoinositol | 2.394 | 1.06 | 0.6227 | −0.39 | 0.0046 |
| 2-linoleoylglycerol (18:2) | 2.368 | 0.70 | 0.3825 | −0.42 | 0.0021 |
| X-12117 | 2.355 | 0.92 | 0.7353 | −0.34 | 0.0147 |
| arabitol/xylitol | 2.345 | 1.17 | 0.7973 | −0.27 | 0.0555 |
| glutamate | 2.327 | 0.88 | 0.3825 | −0.43 | 0.0019 |
| 5alpha-pregnan-diol disulfate | 2.306 | 1.02 | 0.7277 | −0.36 | 0.0104 |
| 1-palmitoleoyl-GPC (16:1) | 2.261 | 1.36 | 0.2538 | −0.33 | 0.0202 |
| sphinganine-1-phosphate | 2.254 | 1.21 | 0.9834 | −0.34 | 0.0171 |
| N-acetylputrescine | 2.237 | 1.10 | 0.6438 | −0.29 | 0.0421 |
| glycine | 2.221 | 1.04 | 0.6572 | −0.29 | 0.0393 |
| myo-inositol | 2.218 | 1.05 | 0.8201 | −0.33 | 0.0189 |
| sphingosine-1-phosphate | 2.204 | 1.08 | 0.8362 | −0.26 | 0.0644 |
| guanosine | 2.191 | 1.07 | 0.8873 | −0.22 | 0.1240 |
| cotinine | 2.179 | 2.80 | 0.0250 | −0.50 | 0.0003 |
| X-24951 | 2.168 | 0.61 | 0.0330 | 0.35 | 0.0125 |
| N-1-methylinosine | 2.163 | 1.02 | 0.9689 | −0.30 | 0.0357 |
| pregnanolone/allopregnanolone sulfate | 2.161 | 1.03 | 0.9834 | −0.28 | 0.0475 |
| ribitol | 2.159 | 1.08 | 0.6654 | −0.27 | 0.0626 |
| N-palmitoyltaurine | 2.156 | 0.94 | 0.6572 | −0.24 | 0.0946 |
| 1-arachidonylglycerol (20:4) | 2.151 | 0.75 | 0.4413 | −0.32 | 0.0214 |
| X-11372 | 2.137 | 0.60 | 0.0218 | 0.40 | 0.0042 |
| Pearson’s Correlation | |||||
|---|---|---|---|---|---|
| VIP Score | Fold Change (Alc/Con) | q-Value | r-Value | p-Value | |
| X-11795 | 2.898 | 2.48 | 0.0157 | −0.47 | 0.0005 |
| X-11880 | 2.647 | 0.58 | 0.0218 | 0.48 | 0.0004 |
| X-11308 | 2.630 | 0.64 | 0.0578 | 0.51 | 0.0002 |
| X-25855 | 2.569 | 1.13 | 0.5264 | −0.47 | 0.0005 |
| X-23639 | 2.560 | 1.38 | 0.1642 | −0.37 | 0.0091 |
| 1-oleoylglycerol (18:1) | 2.541 | 1.14 | 0.5397 | −0.47 | 0.0006 |
| 1-palmitoleoyl-GPC (16:1) | 2.472 | 1.36 | 0.2538 | −0.41 | 0.0029 |
| X-12117 | 2.431 | 0.92 | 0.7353 | −0.49 | 0.0003 |
| X-11372 | 2.382 | 0.60 | 0.0218 | 0.43 | 0.0017 |
| X-24425 | 2.373 | 0.88 | 0.5130 | 0.55 | 0.0000 |
| 5alpha-pregnan-diol disulfate | 2.308 | 1.02 | 0.7277 | −0.38 | 0.0065 |
| hydroxypalmitoyl sphingomyelin (d18:1/16:0(OH)) | 2.305 | 0.75 | 0.0218 | 0.35 | 0.0114 |
| glycerol 3-phosphate | 2.301 | 1.13 | 0.6319 | −0.43 | 0.0018 |
| gamma-glutamylglutamate | 2.290 | 1.30 | 0.2818 | −0.29 | 0.0415 |
| N1-Methyl-2-pyridone-5-carboxamide | 2.186 | 0.92 | 0.4536 | 0.35 | 0.0134 |
| 1-(1-enyl-palmitoyl)-2-arachidonoyl-GPC (P-16:0/20:4) | 2.169 | 0.86 | 0.2669 | 0.38 | 0.0068 |
| inosine | 2.164 | 0.96 | 0.9621 | −0.31 | 0.0305 |
| 2-linoleoylglycerol (18:2) | 2.155 | 0.70 | 0.3825 | −0.45 | 0.0011 |
| arabitol/xylitol | 2.148 | 1.17 | 0.7973 | −0.28 | 0.0522 |
| ribitol | 2.140 | 1.08 | 0.6654 | −0.35 | 0.0130 |
| 1-linoleoylglycerol (18:2) | 2.134 | 0.69 | 0.3943 | −0.42 | 0.0023 |
| X-11381 | 2.132 | 0.86 | 0.6531 | 0.48 | 0.0004 |
| cotinine | 2.125 | 2.80 | 0.0250 | −0.38 | 0.0071 |
| 4-hydroxychlorothalonil | 2.101 | 0.60 | 0.0840 | 0.48 | 0.0005 |
| 1-stearoyl-2-docosahexaenoyl-GPC (18:0/22:6) | 2.101 | 0.91 | 0.7008 | 0.42 | 0.0021 |
| guanosine | 2.087 | 1.07 | 0.8873 | −0.24 | 0.0916 |
| glycine | 2.081 | 1.04 | 0.6572 | −0.36 | 0.0102 |
| sphingomyelin (d18:2/18:1) | 2.064 | 0.63 | 0.0494 | 0.39 | 0.0056 |
| sphingomyelin (d18:2/23:1) | 2.053 | 0.71 | 0.0264 | 0.42 | 0.0022 |
| 3,5-dichloro-2,6-dihydroxybenzoic acid | 2.053 | 0.94 | 0.9000 | 0.43 | 0.0018 |
Publisher’s Note: MDPI stays neutral with regard to jurisdictional claims in published maps and institutional affiliations. |
© 2022 by the authors. Licensee MDPI, Basel, Switzerland. This article is an open access article distributed under the terms and conditions of the Creative Commons Attribution (CC BY) license (https://creativecommons.org/licenses/by/4.0/).
Share and Cite
Hasken, J.M.; de Vries, M.M.; Marais, A.-S.; May, P.A.; Parry, C.D.H.; Seedat, S.; Mooney, S.M.; Smith, S.M. Untargeted Metabolome Analysis of Alcohol-Exposed Pregnancies Reveals Metabolite Differences That Are Associated with Infant Birth Outcomes. Nutrients 2022, 14, 5367. https://doi.org/10.3390/nu14245367
Hasken JM, de Vries MM, Marais A-S, May PA, Parry CDH, Seedat S, Mooney SM, Smith SM. Untargeted Metabolome Analysis of Alcohol-Exposed Pregnancies Reveals Metabolite Differences That Are Associated with Infant Birth Outcomes. Nutrients. 2022; 14(24):5367. https://doi.org/10.3390/nu14245367
Chicago/Turabian StyleHasken, Julie M., Marlene M. de Vries, Anna-Susan Marais, Philip A. May, Charles D. H. Parry, Soraya Seedat, Sandra M. Mooney, and Susan M. Smith. 2022. "Untargeted Metabolome Analysis of Alcohol-Exposed Pregnancies Reveals Metabolite Differences That Are Associated with Infant Birth Outcomes" Nutrients 14, no. 24: 5367. https://doi.org/10.3390/nu14245367