
Association between Osteoporosis and Meniere’s Disease: Two Longitudinal Follow-Up Cohort Studies

1
Department of Otorhinolaryngology-Head & Neck Surgery, Hallym University College of Medicine, Anyang 14068, Republic of Korea
2
Department of Otorhinolaryngology-Head & Neck Surgery, Wonkwang University School of Medicine, Iksan 54538, Republic of Korea
3
Hallym Data Science Laboratory, Hallym University College of Medicine, Anyang 14068, Republic of Korea
4
Department of Otorhinolaryngology-Head & Neck Surgery, CHA Bundang Medical Center, CHA University, Seongnam 13496, Republic of Korea
*
Author to whom correspondence should be addressed.
†
These authors contributed equally to this work.
Nutrients 2022, 14(22), 4885; https://doi.org/10.3390/nu14224885
Submission received: 29 September 2022
/
Revised: 11 November 2022
/
Accepted: 17 November 2022
/
Published: 18 November 2022
(This article belongs to the Special Issue Role of Nutrition in Aging-Related Obesity, Sarcopenia, Osteoporosis and Chronic Disease)
Abstract
:A high rate of Meniere’s disease (MD) in patients with osteoporosis has been suggested. This research intended to estimate the bidirectional association of MD with osteoporosis. The ≥40-year-old population in the Korean National Health Insurance Service-Health Screening Cohort 2002–2019 was examined. In study I, 9529 patients with MD and 38,116 control I participants were analyzed for a previous history of osteoporosis. In study II, 65,858 patients with osteoporosis and 65,858 control II participants were analyzed for a previous history of MD. Stratified Cox proportional hazard models were applied to calculate the hazard ratios (HRs) and 95% confidence intervals (CIs) of MD for osteoporosis in study I and of osteoporosis for MD in study II. The rate of a prior history of osteoporosis was 13.3% for the MD group and 11.3% for the control I group. The patients with MD had a 1.12 times higher HR for previous osteoporosis (95% CI = 1.04–1.20). In study II, the rate or a prior history of MD was 3.7% for patients with osteoporosis and 2.0% for the control II group. The patients with osteoporosis had a 1.50 times higher HR for previous MD (95% CI = 1.40–1.61). Most subgroups according to age, sex, and comorbid conditions demonstrated consistent bidirectional associations between MD and osteoporosis. Adult patients with MD had a greater risk of osteoporosis. In addition, adult patients with osteoporosis also showed a higher risk of MD.
1. Introduction
Meniere’s disease (MD) is an inner ear disease with relapsing cochleovestibular symptoms of vertigo, ear fullness, and hearing loss [1]. Approximately 50–200/100,000 adults were reported to suffer from MD [2]. The etiology of MD has been suggested to be multifactorial, including an autoimmune dysfunction, a viral infection, and genetic factors [3,4,5]. These etiologic causes have been presumed to induce hydrops of the endolymphatic duct, which has been acknowledged as a main pathophysiologic mechanism of MD [6]. In addition, a few studies have suggested that otoconia that detach from the macula of the saccule and obstruct the ductus reuniens or endolymphatic duct can contribute to the development of MD [7]. Thus, it can be postulated that the derangement or degeneration of otoconia may increase the risk of MD. Because osteoporosis is one of the factors related to the degeneration of otoconia, osteoporosis can be a risk factor for MD.
The homeostasis of calcium is associated with the regulation of otoconia in animal studies, since a high risk of benign paroxysmal positional vertigo (BPPV) in patients with osteoporosis has been reported [8,9]. In addition, osteoporosis was linked with an increased risk of vestibular dysfunction (adjusted odds ratio = 2.47, 95% confidence intervals [95% CI] = 1.05–5.81) [10]. It was suggested that the demineralization of the vestibular labyrinth and elevated free calcium in the endolymphatic flow can induce vestibular dysfunction in patients with osteoporosis [10]. However, the causality between vestibular dysfunction and osteoporosis has not been explored. In addition to the potential impact of osteoporosis on vestibular impairment, it has been presumed that vestibular dysfunction can disturb bone homeostasis [11]. Therefore, the risk of osteoporosis in patients with vestibular dysfunction can be postulated.
We hypothesized that osteoporosis can be related to a greater risk of MD and that patients with MD can have a greater risk of osteoporosis. Although the exact pathophysiologic mechanism has not been elucidated, osteoporosis has been indicated as a risk factor for vestibular dysfunction [10]. In addition, prior studies proposed the possible association of osteoporosis with cochlear dysfunction [12]. Because the dysfunction of the cochlea-vestibular system is related to MD, we supposed that osteoporosis can be associated with the risk of MD. Moreover, MD can induce osteoporotic changes via defects in the vestibular input to the brainstem and influence the sympathetic function [11]. To examine this supposition, two independent case–control studies were conducted and analyzed the risk of osteoporosis in patients with MD and vice versa. This study is novel to investigate the bidirectional association between MD and osteoporosis.
2. Methods
2.1. Ethical Considerations
The ethics committee of Hallym University (2019-10-023) permitted the analyses and exempted the authors from obtaining a written informed consent for the current research. This study analyzed the ≥40-year-old population in the Korean National Health Insurance Service-Health Screening Cohort 2002–2019. This study complied with the STROBE guidelines.
2.2. Diagnostic Criteria
Osteoporosis and MD were classified as in previous studies [13,14]. Osteoporosis was classified based on the international classification of diseases (ICD)-10 codes (M80, M81, and M82), 2 or more times of clinical visits, and the examination of bone density using X-ray or computed tomography [13].
MD was classified based on the ICD-10 codes (H810), 2 or more times of clinical visits, and the examination of pure tone audiometry [14].
2.3. Study I
We enrolled 15,208 patients with MD. In total, 499,658 control participants were identified who were not diagnosed with MD during 2002–2019. Among the patients with MD, 539 patients who were diagnosed in 2002, as well as 779 MD patients and 18,847 control participants who had a history of head trauma were excluded. Participants with a history of brain tumors, disorders of acoustic nerves, and benign neoplasms of cranial nerves were also excluded. Age, sex, income, and region of residence were matched between the MD patients and the control participants. Finally, 9529 MD participants and 38,116 control I participants were included (Figure 1).
2.4. Study II
We identified 117,946 osteoporosis patients, as well as 396,920 control participants who were not diagnosed with osteoporosis during 2002–2019. Then, 15,510 osteoporosis patients who were diagnosed in 2002 and 4645 osteoporosis patients and 12,648 control participants who had a history of head trauma were excluded. Participants with a history of brain tumors, disorders of acoustic nerves, and benign neoplasms of cranial nerves were excluded too. Age, sex, income, and region of residence were matched between the osteoporosis patients and the control participants. Finally, 65,858 osteoporosis participants and 65,858 control II participants were included (Figure 1).
2.5. Variables
The variables of age, income level, region of residence, smoking, alcohol consumption, obesity, Charlson Comorbidity Index (CCI) were classified as previously described [15]. Ten age groups were defined, i.e., 40–44, 45–49, 50–54, 55–59, 60–64, 65–69, 70–74, 75–79, 80–84, and 85+ years of age. Five income groups were specified, from class 1 (lowest) to 5 (highest). Two groups of region of residence were defined as urban and rural areas. The status of smoking was defined as nonsmoker, past smoker, and current smoker based on a self-reported questionnaire. The frequency of alcohol consumption was defined as <1 time a week and ≥1 time a week. The body mass index (BMI, kg/m2) groups were classified as <18.5 (underweight), from.5 to <23 (normal), from 23 to <25 (overweight), from 25 to <30 (obese I), and ≥30 (obese II). Systolic blood pressure (SBP, mmHg), diastolic blood pressure (DBP, mmHg), fasting blood glucose (mg/dL), and total cholesterol (mg/dL) were measured. Histories of benign paroxysmal vertigo (BPPV), vestibular neuronitis (VN), other types of peripheral vertigo, and dyslipidemia were defined based on 2 or more clinical visits.
2.6. Statistical Method
The variables were compared between the study (MD or osteoporosis) and the control I or control II groups using standardized differences.
The hazard ratios (HRs) and 95% confidence intervals (CIs) of MD for osteoporosis (study I) and osteoporosis for MD (study II) were estimated using stratified Cox proportional hazard models. All collected variables were adjusted.
The cumulative incidence rates of osteoporosis in MD and control I groups (Figure 2a) and those of MD in osteoporosis participants and control II group (Figure 2b) were estimated using the Kaplan–Meier curve and log rank test.
Secondary analyses were conducted according to age, sex, income, region, blood pressure, fasting blood glucose, and total cholesterol. Interaction analyses were conducted to explore the interaction of the variables with MD or osteoporosis. A p value < 0.05 was regarded as statistical significance. SAS version 9.4 (SAS Institute Inc., Cary, NC, USA) was utilized.
3. Results
In total, 13.3% of MD patients and 11.3% of control I patients had osteoporosis. (sd = 0.06, Table 1). The histories of BPPV, VN, and other types of peripheral vertigo were more frequent in the MD group than in the control I group. The rates of obesity, hyperglycemia, and high CCI were greater in the MD group than in the control I group. On the other hand, current smoking, alcohol consumption, high SBP and DBP, and hypercholesterolemia were greater in the control I group than in the MD group.
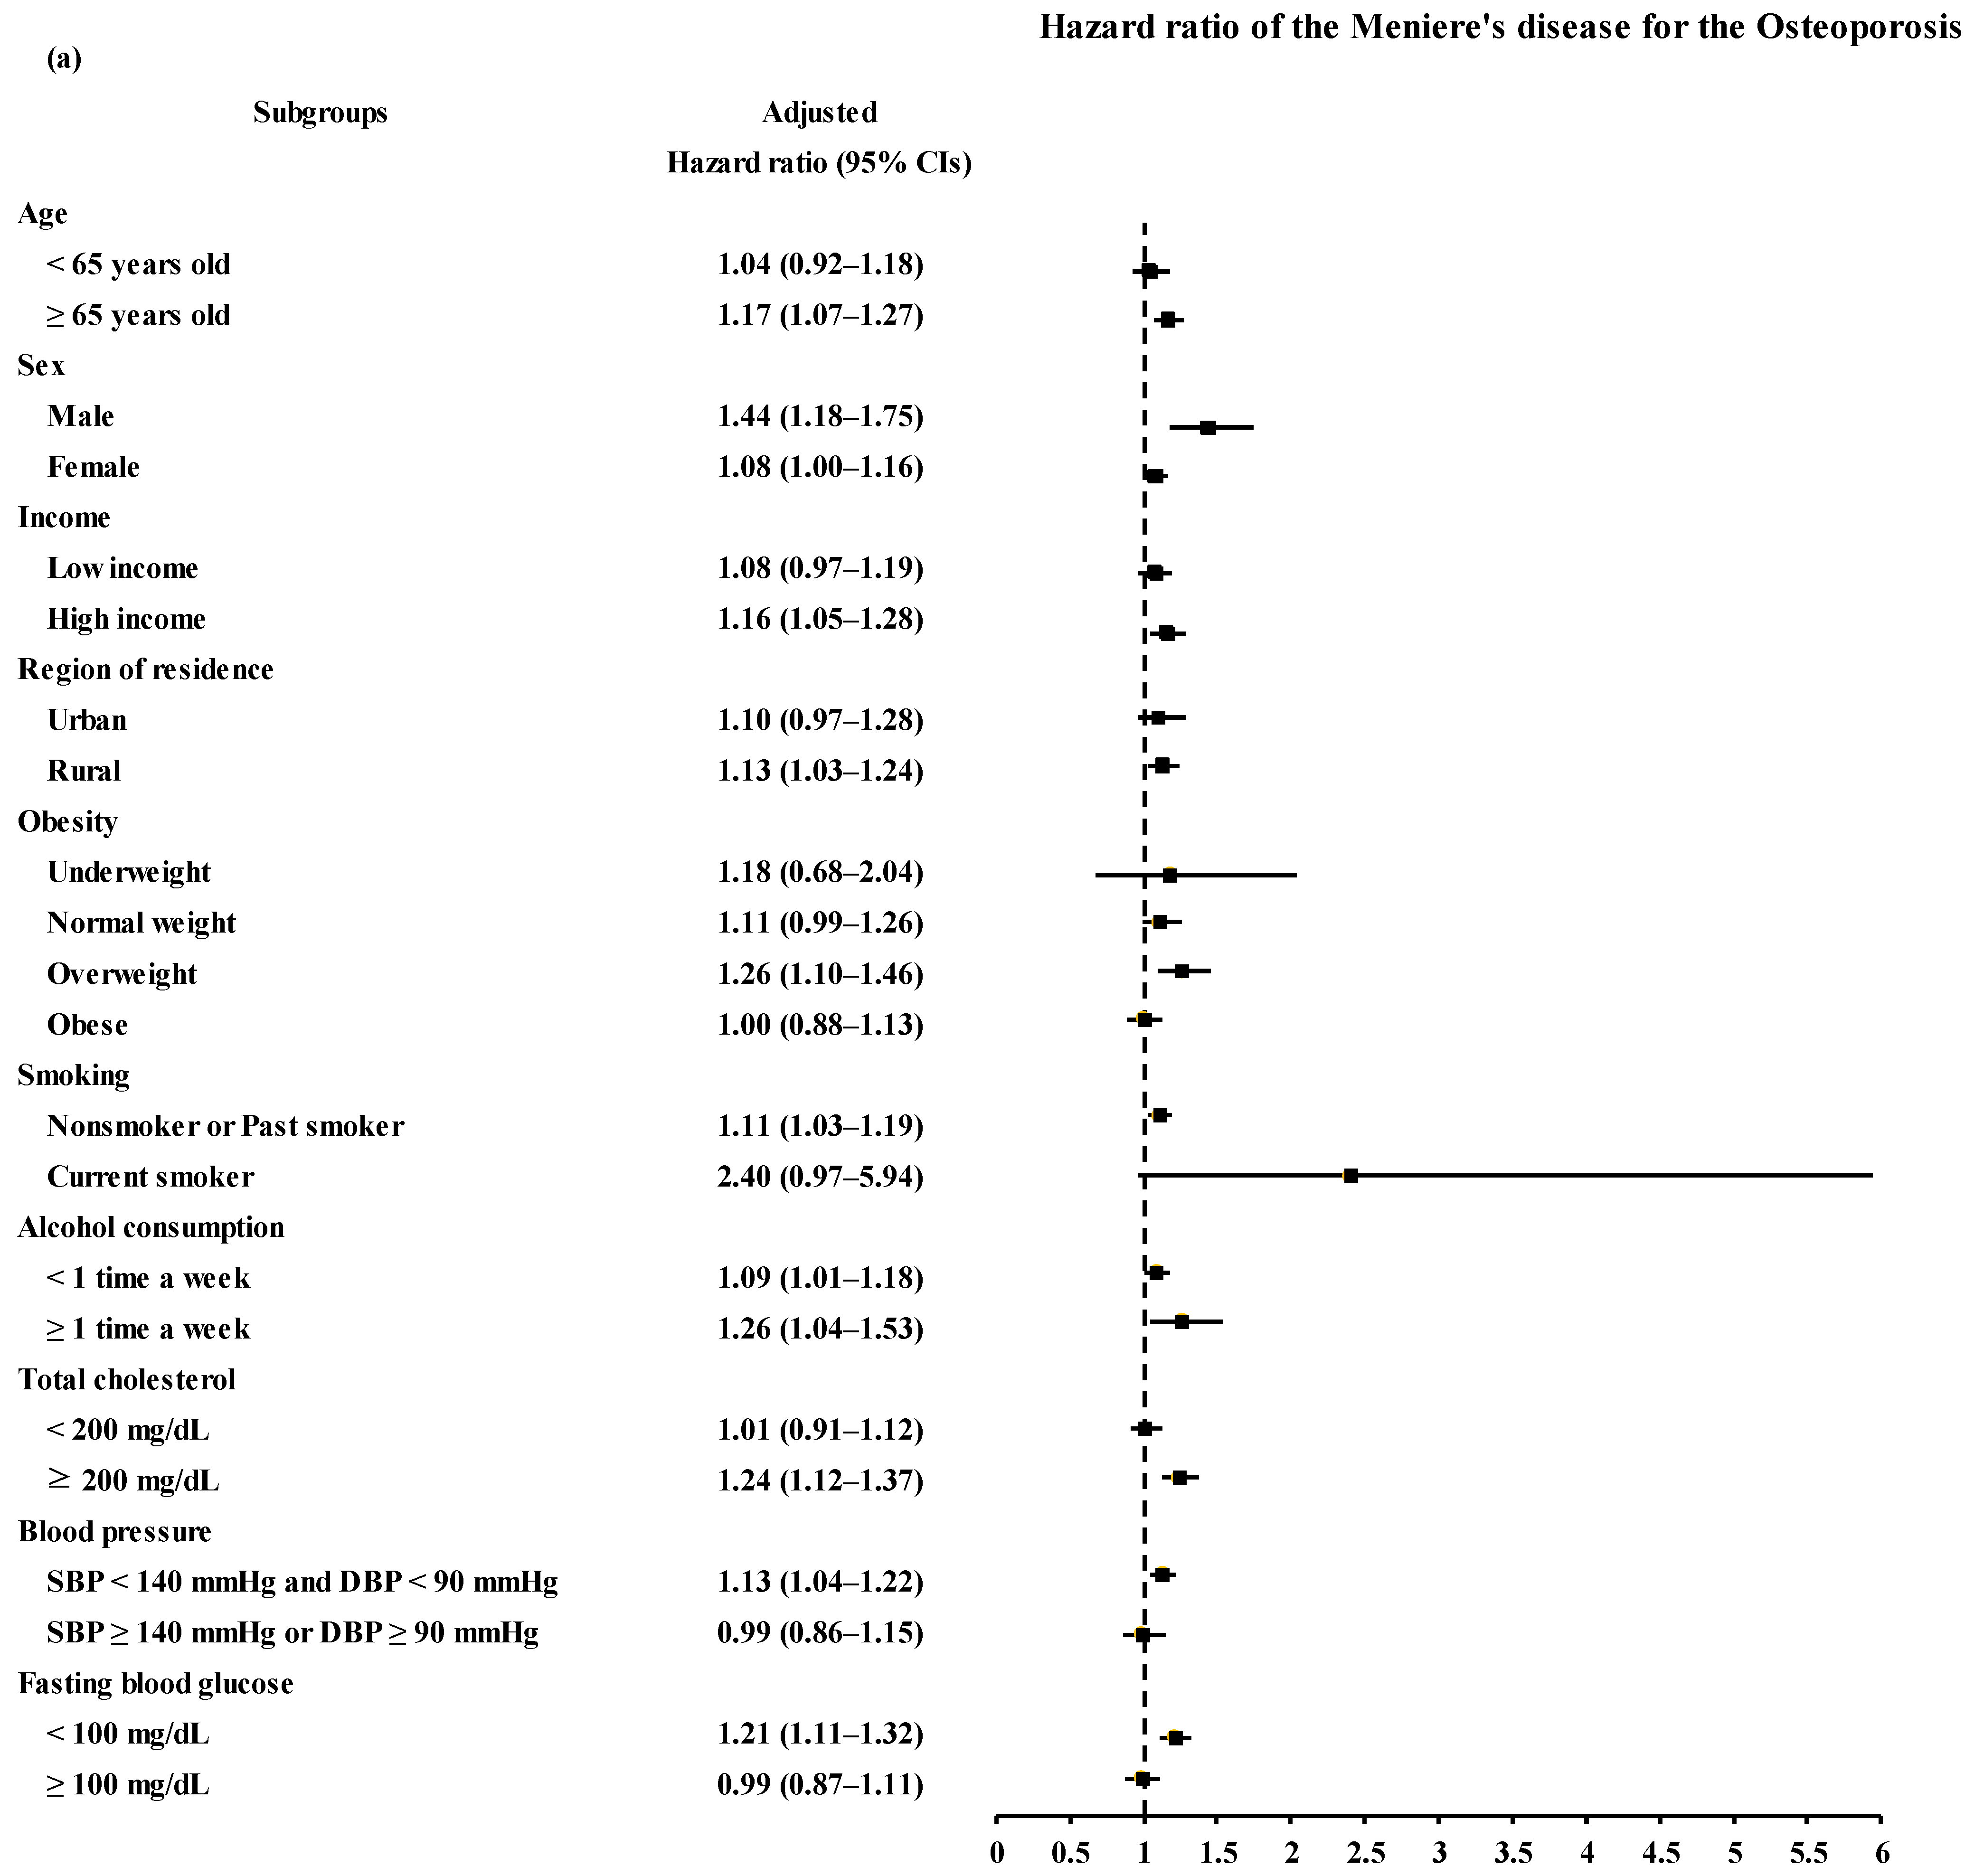
The patients with MD demonstrated a higher risk of a previous history of osteoporosis than the control I group (Table 2 and Figure 2a). The adjusted HR for osteoporosis was 1.12 in the MD group (95% CI = 1.04–1.20, p = 0.003). Interaction analyses demonstrated significant interactions between MD and sex, smoking, fasting blood glucose, and cholesterol levels. Subgroups of ≥65 years old, men, high income participants, rural residents, nonsmokers or past smokers, overweight participants, and participants with normal blood pressure, normal fasting blood glucose, and high total cholesterol levels presented a consistently higher risk of MD related to osteoporosis (Table 2 and Figure 3a).
In study II, 3.7% of the osteoporosis patients and 2.0% of the control II group had MD (sd = 0.10, Table 3). The histories of BPPV, VN, and other types of peripheral vertigo were more frequent in the osteoporosis group than in the control II group.
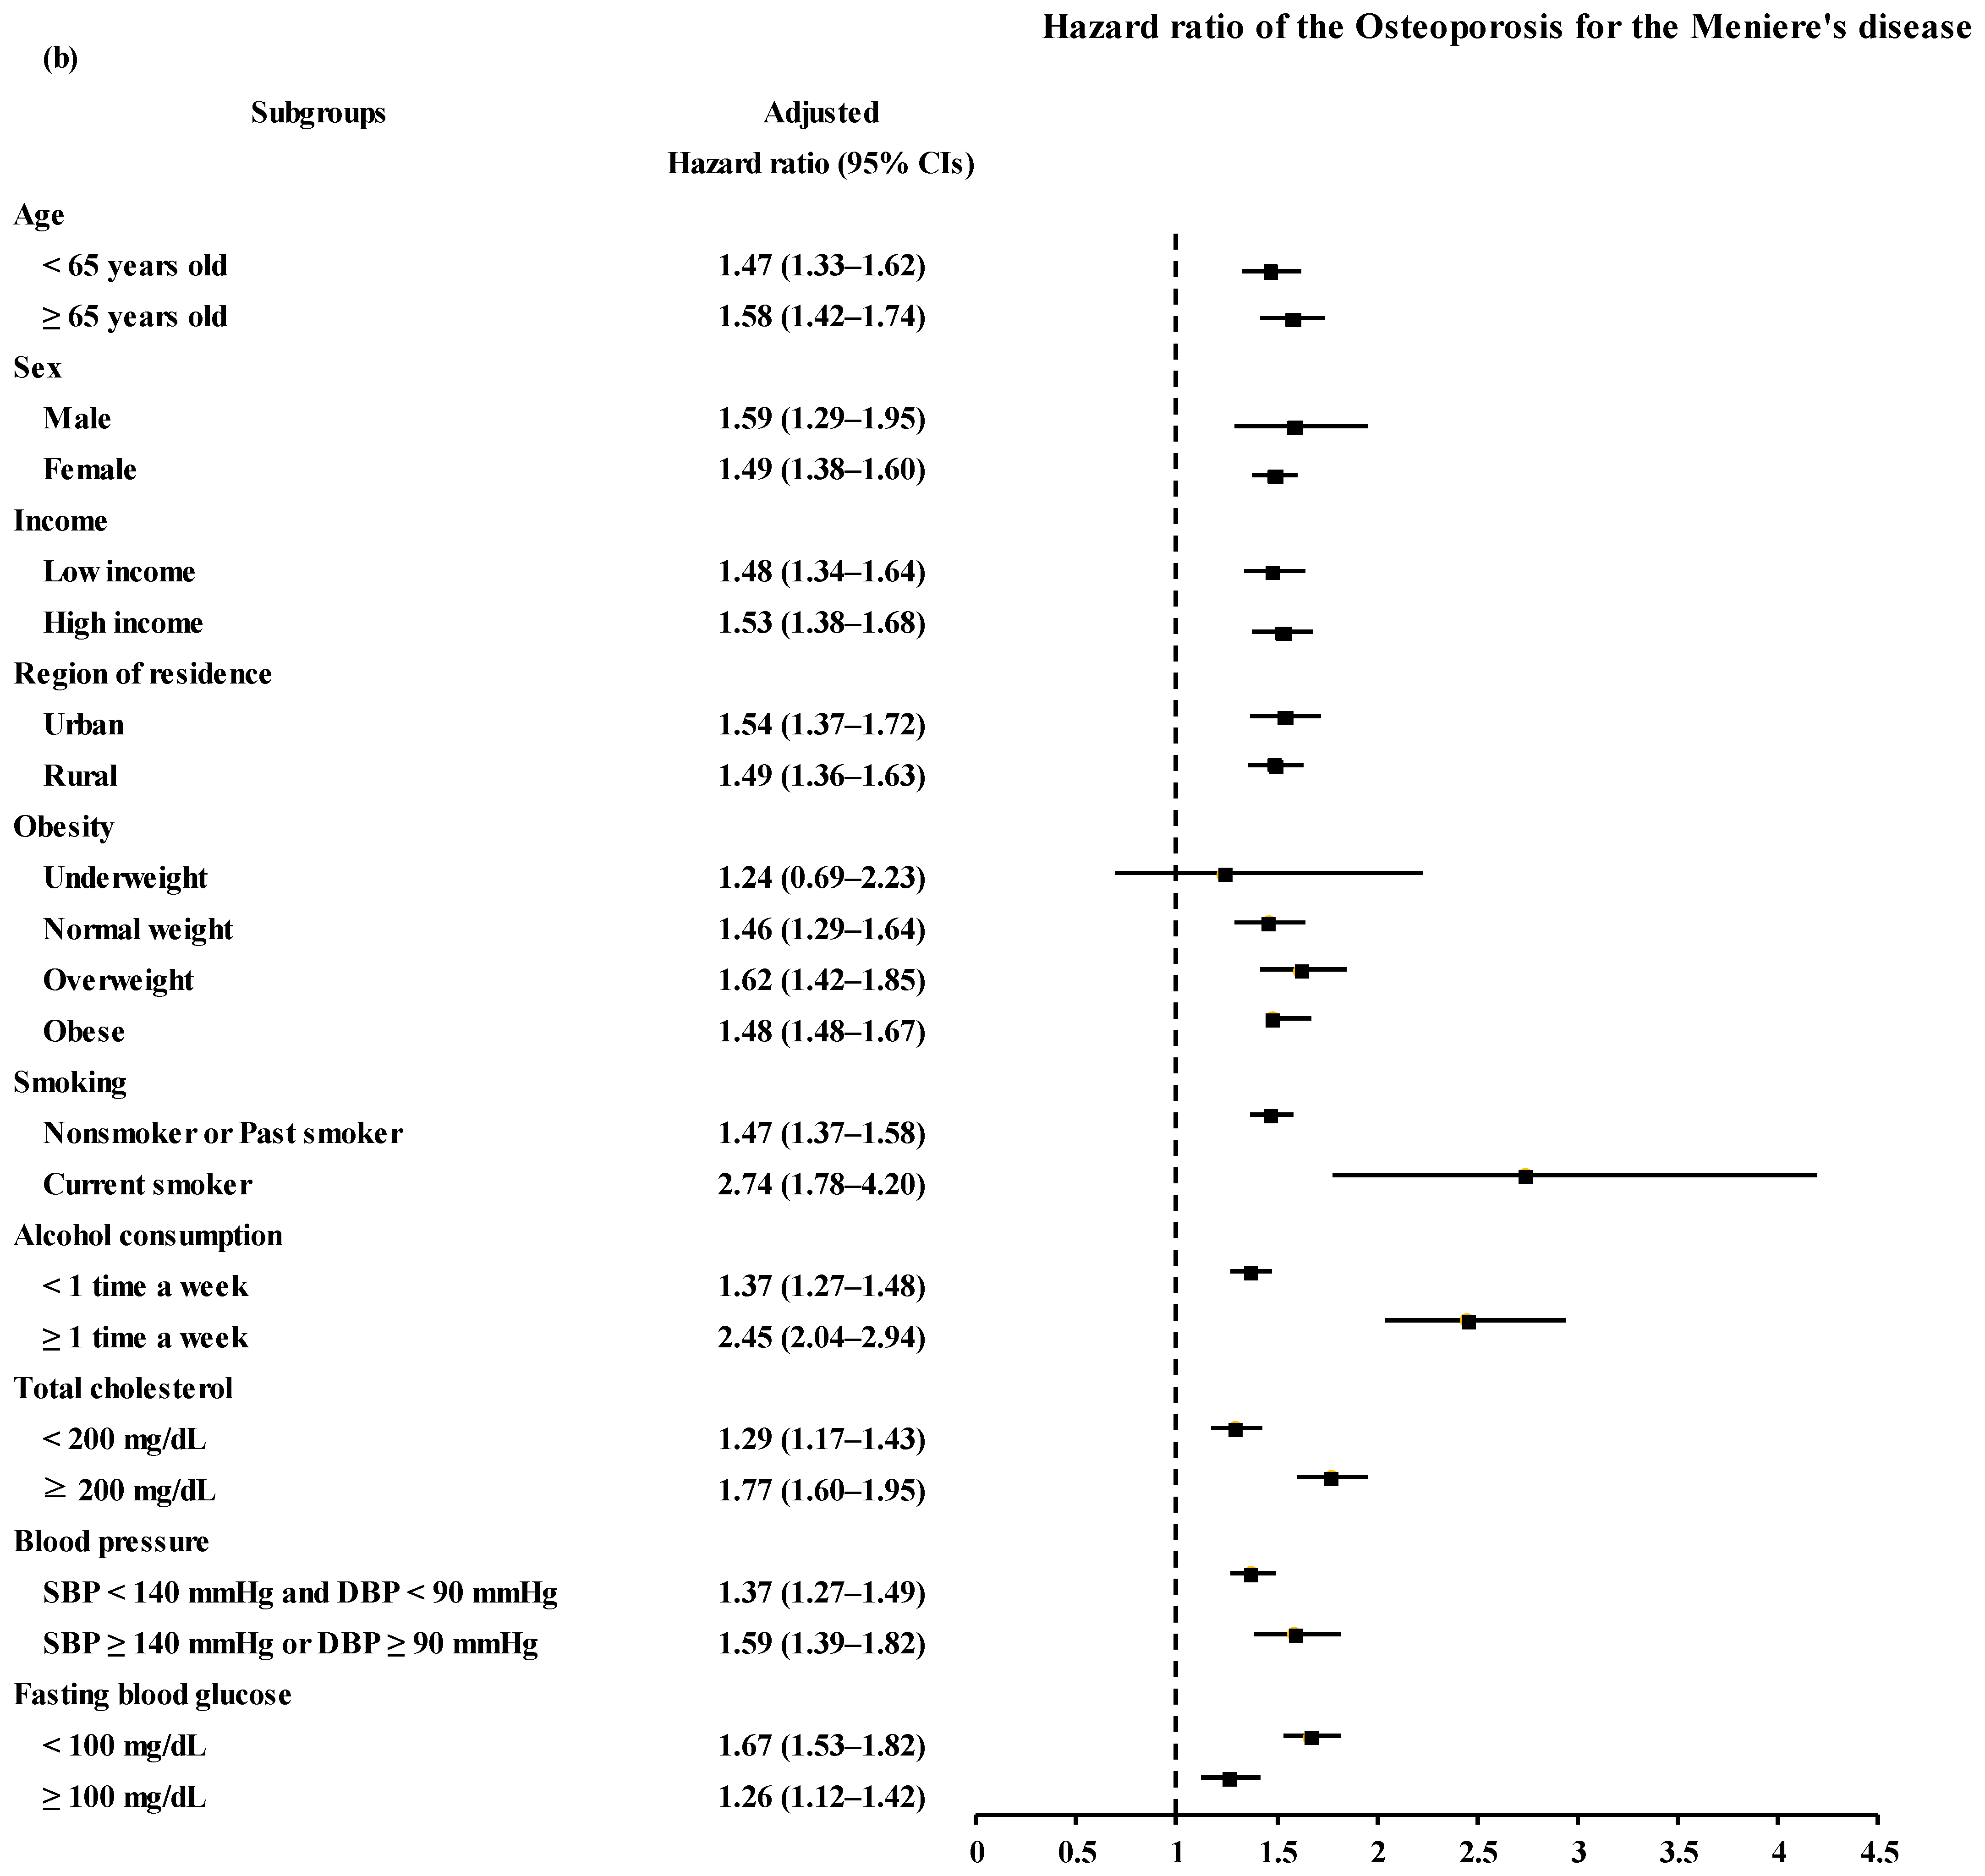
MD was associated with an increased risk of osteoporosis (Table 4 and Figure 2b). The patients with osteoporosis had a 1.50 times higher risk of previous MD than the control II group (95% CI = 1.40–1.61, p < 0.001). Interaction analyses demonstrated significant interactions between osteoporosis and smoking, alcohol consumption, fast blood glucose, and total cholesterol levels. A higher risk of osteoporosis associated with prior MD was maintained in all subgroups except for the underweight group (Table 4 and Figure 3b).
4. Discussion
A previous history of osteoporosis was related to a higher risk of subsequent MD in the present study. On the other hand, a prior history of MD was associated with a greater risk of osteoporosis. In particular, the risk of osteoporosis in patients with MD was as high as 1.50 in multivariable analysis. Thus, a potential risk of osteoporosis should be considered in patients with MD in the clinic. The current results enlarged previous knowledge on the association of MD with osteoporosis by elucidating the temporal relation between the two diseases.
Decreased bone mineral density in patients with MD has been documented [16]. As many as 74% of patients with MD had T-scores less than −1.0, a value found in 39% of the control participants [16]. However, this study was limited due to the small study population (23 MD patients and 23 controls) [16]. Although no other study has evaluated the association between osteoporosis and MD, prior researchers have reported impaired vestibular dysfunction and cochlear impairment in patients with osteoporosis [10,17,18]. The patients with low bone mineral density in the older population demonstrated a 3.72 times (95% CI = 1.07–12.85) higher rate of balance impairment and a 5.30 times (1.20–23.26) higher rate of hearing impairment [17]. The plausible pathophysiologic mechanism involves the fact that bone remodeling can induce resorption of the bony labyrinth and otoconial dislodgement, which will result in dysfunction of the cochleovestibular organ [18].
Patients with MD demonstrated an increased risk of osteoporosis in study II. The altered vestibular function in patients with MD could impact bone remodeling regulation. The vestibular system regulates the equilibrium function via innervation to the brainstem and cerebellum and can influence physical activity and the risk of falls. In addition, the vestibular connection with the brainstem autonomic system was suggested to regulate the cardiovascular function and bone homeostasis via sympathetic nerve regulation [11]. To support this hypothesis, in animal studies, vestibular dysfunction decreased the bone mass, which was prevented with sympathetic blockers or genetic deletion of the adrenergic receptor in osteoblasts [19,20]. Moreover, the increase in bone mineral content according to gravity change was shown to be mediated by vestibular function in a mouse study [21]. In that study, vestibular dysfunction inhibited the growth of bone mass related to hypergravity [21]. Therefore, it can be presumed that the vestibular function may have a crucial role in maintaining the bone mass and that vestibular dysfunction in patients with MD may increase the risk of bone loss and osteoporosis.
Furthermore, patients with osteoporosis reported a high risk of MD (study I). However, the risk was not great in this study (adjusted HR = 1.12). A decreased bone mineral density could increase the risk of otoconial dysfunction, which was suggested as one of the pathophysiologic mechanisms of MD [7]. Detached saccular otoconia obstructing the endolymphatic flow of the inner ear were suggested to induce MD [7,22]. Prior researchers documented a high risk of otoconial detachment or degeneration associated with osteoporosis [23]. Thus, otoconial dislodgement can be one of the possible causes of MD in patients with osteoporosis. Furthermore, the high concentration of free calcium ions in patients with osteoporosis can decrease the capacity of dissolving the dislodged otoconia [24].
The present study analyzed a large nationwide adult population in Korea. Control participants were selected based on matching variables, and selection bias was attenuated by random selection among a large cohort population. The laboratory measured data of SBP, DBP, serum glucose level, and cholesterol level were adjusted, and comorbidities were adjusted using the CCI score. In addition, lifestyle factors of smoking, alcohol consumption, and obesity were examined and adjusted. These variables can be related to osteoporosis and MD. For instance, obesity was suggested to be associated with osteoporosis in a previous study [25]. The variables analyzed in the current study can be further evaluated using a machine learning analysis in order to understand which are the main predictors of osteoporosis in MD. Because the health claim data did not include the results of vestibular and audiometric tests, the type and severity of MD could not be assessed in this study. To attenuate the misdiagnosis of MD and the confounding effect of other vestibular disorders, BPPV, VN, and other types of peripheral vertigo were evaluated. For osteoporosis, dual energy X-ray absorptiometry results and medication histories could not be evaluated. Because asymptomatic patients with osteoporosis can remain undiagnosed before the occurrence of an osteoporotic fracture, a selection bias is possible in our health claim cohort. Patients with MD can be prone to falls, which may mediate the current relationship between osteoporosis and MD. Because there are age- or sex-specific features for both osteoporosis and MD, there may be an age- or sex-specific relationship between osteoporosis and MD. However, the large number of participants in the current study resulted in a significant association between osteoporosis and MD in most subgroups. Forthcoming studies on the impact of the treatment of osteoporosis on MD and on the influence of MD management or types of MD on osteoporosis can solve the current limitations.
5. Conclusions
Patients with MD showed a high rate of subsequent occurrence of osteoporosis. In addition, patients with osteoporosis showed a greater rate of MD occurrence. Clinicians need to consider this reciprocal association when managing patients with MD and osteoporosis.
Author Contributions
H.G.C. designed the study; D.M.Y. and H.G.C. analyzed the data; S.Y.K., J.C., C.H.L. and H.G.C. drafted and revised the paper; and H.G.C. drew the figures. All authors have read and agreed to the published version of the manuscript.
Funding
This work was supported in part by a research grant (NRF-2020R1A2C212660 and NRF-2020R1A2C4002594) from the National Research Foundation (NRF) grant funded by the Korean government (MSIT).
Institutional Review Board Statement
The ethics committee of Hallym University (2019-10-023, ethical approval date: 12 November 2019) permitted this study following guidelines and regulations.
Informed Consent Statement
Written informed consent was waived by the Institutional Review Board.
Data Availability Statement
Releasing of the data by the researcher is not legally permitted. All data are available from the database of the Korea Centers for Disease Control and Prevention. The Korea Centers for Disease Control and Prevention allows data access, at a particular cost, for any researcher who promises to follow the research ethics. The data of this article can be downloaded from the website after agreeing to follow the research ethics.
Conflicts of Interest
The authors declare no conflict of interest.
References
- Basura, G.J.; Adams, M.E.; Monfared, A.; Schwartz, S.R.; Antonelli, P.J.; Burkard, R.; Bush, M.L.; Bykowski, J.; Colandrea, M.; Derebery, J.; et al. Clinical Practice Guideline: Meniere’s Disease. Otolaryngol. Head Neck Surg. 2020, 162 (Suppl. S2), S1–S55. [Google Scholar] [CrossRef] [PubMed] [Green Version]
- Watanabe, Y.; Mizukoshi, K.; Shojaku, H.; Watanabe, I.; Hinoki, M.; Kitahara, M. Epidemiological and clinical characteristics of Meniere’s disease in Japan. Acta Otolaryngol. Suppl. 1995, 519, 206–210. [Google Scholar] [CrossRef] [PubMed]
- Gacek, R.R. Meniere’s disease is a viral neuropathy. ORL J. Otorhinolaryngol. Relat. Spec. 2009, 71, 78–86. [Google Scholar] [CrossRef] [PubMed]
- Greco, A.; Gallo, A.; Fusconi, M.; Marinelli, C.; Macri, G.F.; de Vincentiis, M. Meniere’s disease might be an autoimmune condition? Autoimmun. Rev. 2012, 11, 731–738. [Google Scholar] [CrossRef]
- Gallego-Martinez, A.; Lopez-Escamez, J.A. Genetic architecture of Meniere’s disease. Hear. Res. 2020, 397, 107872. [Google Scholar] [CrossRef]
- Gurkov, R.; Pyyko, I.; Zou, J.; Kentala, E. What is Meniere’s disease? A contemporary re-evaluation of endolymphatic hydrops. J. Neurol. 2016, 263 (Suppl. S1), S71–S81. [Google Scholar] [CrossRef] [Green Version]
- Hornibrook, J.; Bird, P. A New Theory for Meniere’s Disease: Detached Saccular Otoconia. Otolaryngol. Head Neck Surg. 2017, 156, 350–352. [Google Scholar] [CrossRef]
- Vibert, D.; Sans, A.; Kompis, M.; Travo, C.; Mühlbauer, R.C.; Tschudi, I.; Boukhaddaoui, H.; Häusler, R. Ultrastructural changes in otoconia of osteoporotic rats. Audiol. Neurotol. 2008, 13, 293–301. [Google Scholar] [CrossRef]
- Guo, T.; Xing, Y.; Zhu, H.; Yang, L.; Xiao, Y.; Xu, J. Relationship between osteoporosis and benign paroxysmal positional vertigo based on evidence-based medicine and bioinformatics. Arch. Osteoporos. 2021, 16, 173. [Google Scholar] [CrossRef]
- Park, R.J.; Kim, Y.H. Association between Osteoporosis/Osteopenia and Vestibular Dysfunction in South Korean Adults. Ear Hear. 2016, 37, 615–619. [Google Scholar] [CrossRef]
- Vignaux, G.; Besnard, S.; Denise, P.; Elefteriou, F. The Vestibular System: A Newly Identified Regulator of Bone Homeostasis Acting Through the Sympathetic Nervous System. Curr. Osteoporos. Rep. 2015, 13, 198–205. [Google Scholar] [CrossRef] [PubMed]
- Upala, S.; Rattanawong, P.; Vutthikraivit, W.; Sanguankeo, A. Significant association between osteoporosis and hearing loss: A systematic review and meta-analysis. Braz. J. Otorhinolaryngol. 2017, 83, 646–652. [Google Scholar] [CrossRef] [PubMed] [Green Version]
- Kim, S.Y.; Yoo, D.M.; Min, C.; Choi, H.G. Association between Osteoporosis and Low Hemoglobin Levels: A Nested Case-Control Study Using a National Health Screening Cohort. Int. J. Environ. Res. Public Health 2021, 18, 8598. [Google Scholar] [CrossRef] [PubMed]
- Kim, S.Y.; Lee, C.H.; Yoo, D.M.; Kwon, M.J.; Kim, J.H.; Kim, J.-H.; Park, B.; Lee, H.-J.; Choi, H.G. Association Between Meniere Disease and Migraine. JAMA Otolaryngol. Head Neck Surg. 2022, 148, 457–464. [Google Scholar] [CrossRef] [PubMed]
- Kim, S.Y.; Min, C.; Yoo, D.M.; Chang, J.; Lee, H.-J.; Park, B.; Choi, H.G. Hearing Impairment Increases Economic Inequality. Clin. Exp. Otorhinolaryngol. 2021, 14, 278–286. [Google Scholar] [CrossRef] [PubMed]
- Shupak, A.; Faranesh, N. Bone Mineral Density in Patients Suffering from Meniere’s Disease. Audiol. Neurotol. 2020, 25, 158–163. [Google Scholar] [CrossRef]
- Mendy, A.; Vieira, E.R.; Albatineh, A.N.; Nnadi, A.K.; Lowry, D.; Gasana, J. Low bone mineral density is associated with balance and hearing impairments. Ann. Epidemiol. 2014, 24, 58–62. [Google Scholar] [CrossRef]
- Singh, N.K.; Jha, R.H.; Gargeshwari, A.; Kumar, P. Altered auditory and vestibular functioning in individuals with low bone mineral density: A systematic review. Eur. Arch. Otorhinolaryngol. 2018, 275, 1–10. [Google Scholar] [CrossRef]
- Vignaux, G.; Ndong, J.D.; Perrien, D.S.; Elefteriou, F. Inner Ear Vestibular Signals Regulate Bone Remodeling via the Sympathetic Nervous System. J. Bone Miner. Res. 2015, 30, 1103–1111. [Google Scholar] [CrossRef] [Green Version]
- Levasseur, R.; Sabatier, J.P.; Etard, O.; Denise, P.; Reber, A. Labyrinthectomy decreases bone mineral density in the femoral metaphysis in rats. J. Vestib. Res. 2004, 14, 361–365. [Google Scholar] [CrossRef]
- Kawao, N.; Morita, H.; Obata, K.; Tamura, Y.; Okumoto, K.; Kaji, H. The vestibular system is critical for the changes in muscle and bone induced by hypergravity in mice. Physiol. Rep. 2016, 4, e12979. [Google Scholar] [CrossRef] [PubMed]
- Hornibrook, J. Saccular otoconia as a cause of Meniere’s disease: Hypothesis based on two theories. J. Laryngol. Otol. 2018, 132, 771–774. [Google Scholar] [CrossRef] [PubMed]
- Chen, J.; Zhang, S.; Cui, K.; Liu, C. Risk factors for benign paroxysmal positional vertigo recurrence: A systematic review and meta-analysis. J. Neurol. 2021, 268, 4117–4127. [Google Scholar] [CrossRef] [PubMed]
- Vibert, D.; Kompis, M.; Hausler, R. Benign paroxysmal positional vertigo in older women may be related to osteoporosis and osteopenia. Ann. Otol. Rhinol. Laryngol. 2003, 112, 885–889. [Google Scholar] [CrossRef]
- Rondanelli, M.; Guido, D.; Opizzi, A.; Faliva, M.A.; Perna, S.; Grassi, M. A path model of sarcopenia on bone mass loss in elderly subjects. J. Nutr. Health Aging 2014, 18, 15–21. [Google Scholar] [CrossRef] [PubMed]
Figure 1.
(a) A schematic illustration of the participant selection process that was used in the present study. Of a total of 514,866 participants, 9529 Meniere’s disease participants were matched with 38,116 control participants for age, sex, income, and region of residence. (b) A schematic illustration of the participant selection process that was used in the present study. Of a total of 514,866 participants, 65,858 osteoporosis participants were matched with 65,858 control participants for age, sex, income, and region of residence.
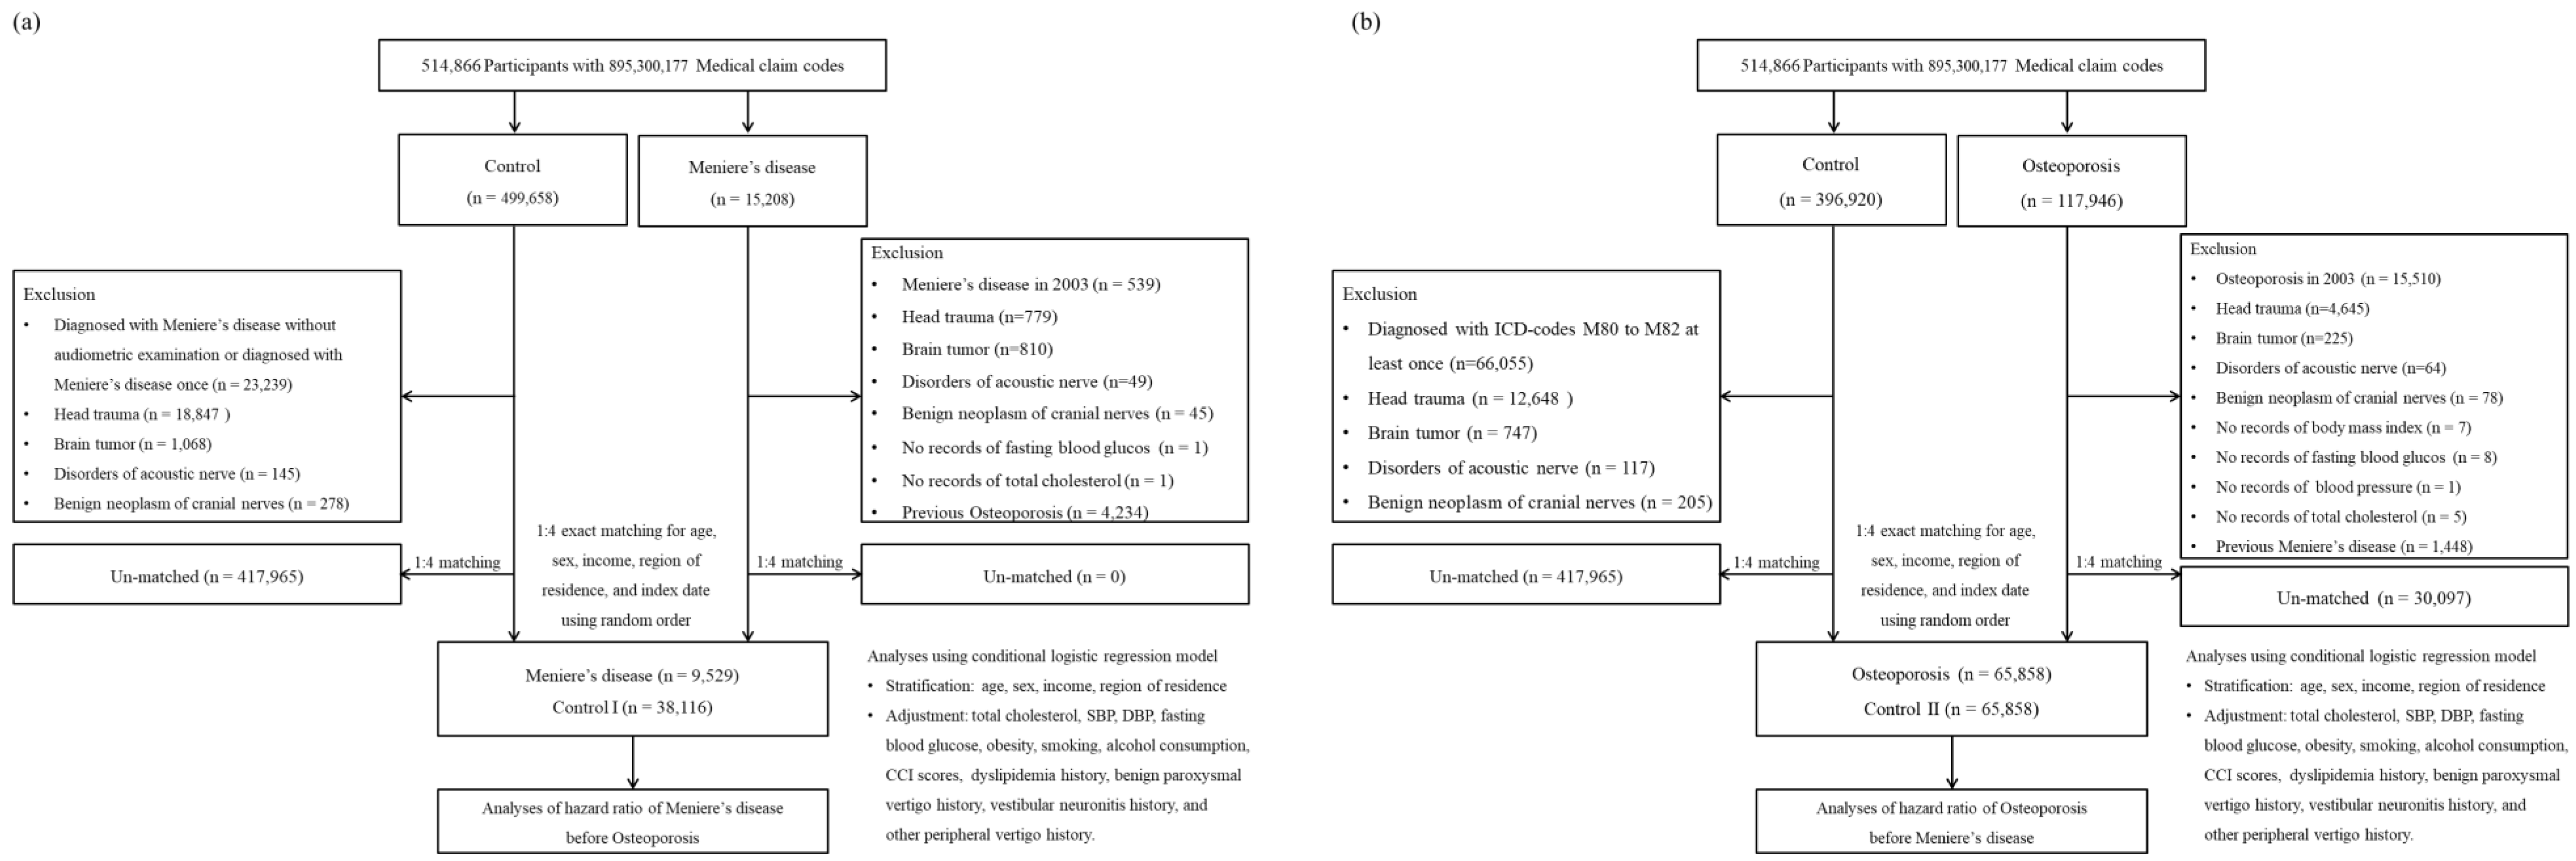
Figure 2.
(a) Kaplan–Meier curve for the cumulative incidence rates of osteoporosis in Meniere’s disease participants and control I group (b) Kaplan–Meier curve for the cumulative incidence rates of Meniere’s disease in osteoporosis participants and control II group.
Figure 2.
(a) Kaplan–Meier curve for the cumulative incidence rates of osteoporosis in Meniere’s disease participants and control I group (b) Kaplan–Meier curve for the cumulative incidence rates of Meniere’s disease in osteoporosis participants and control II group.
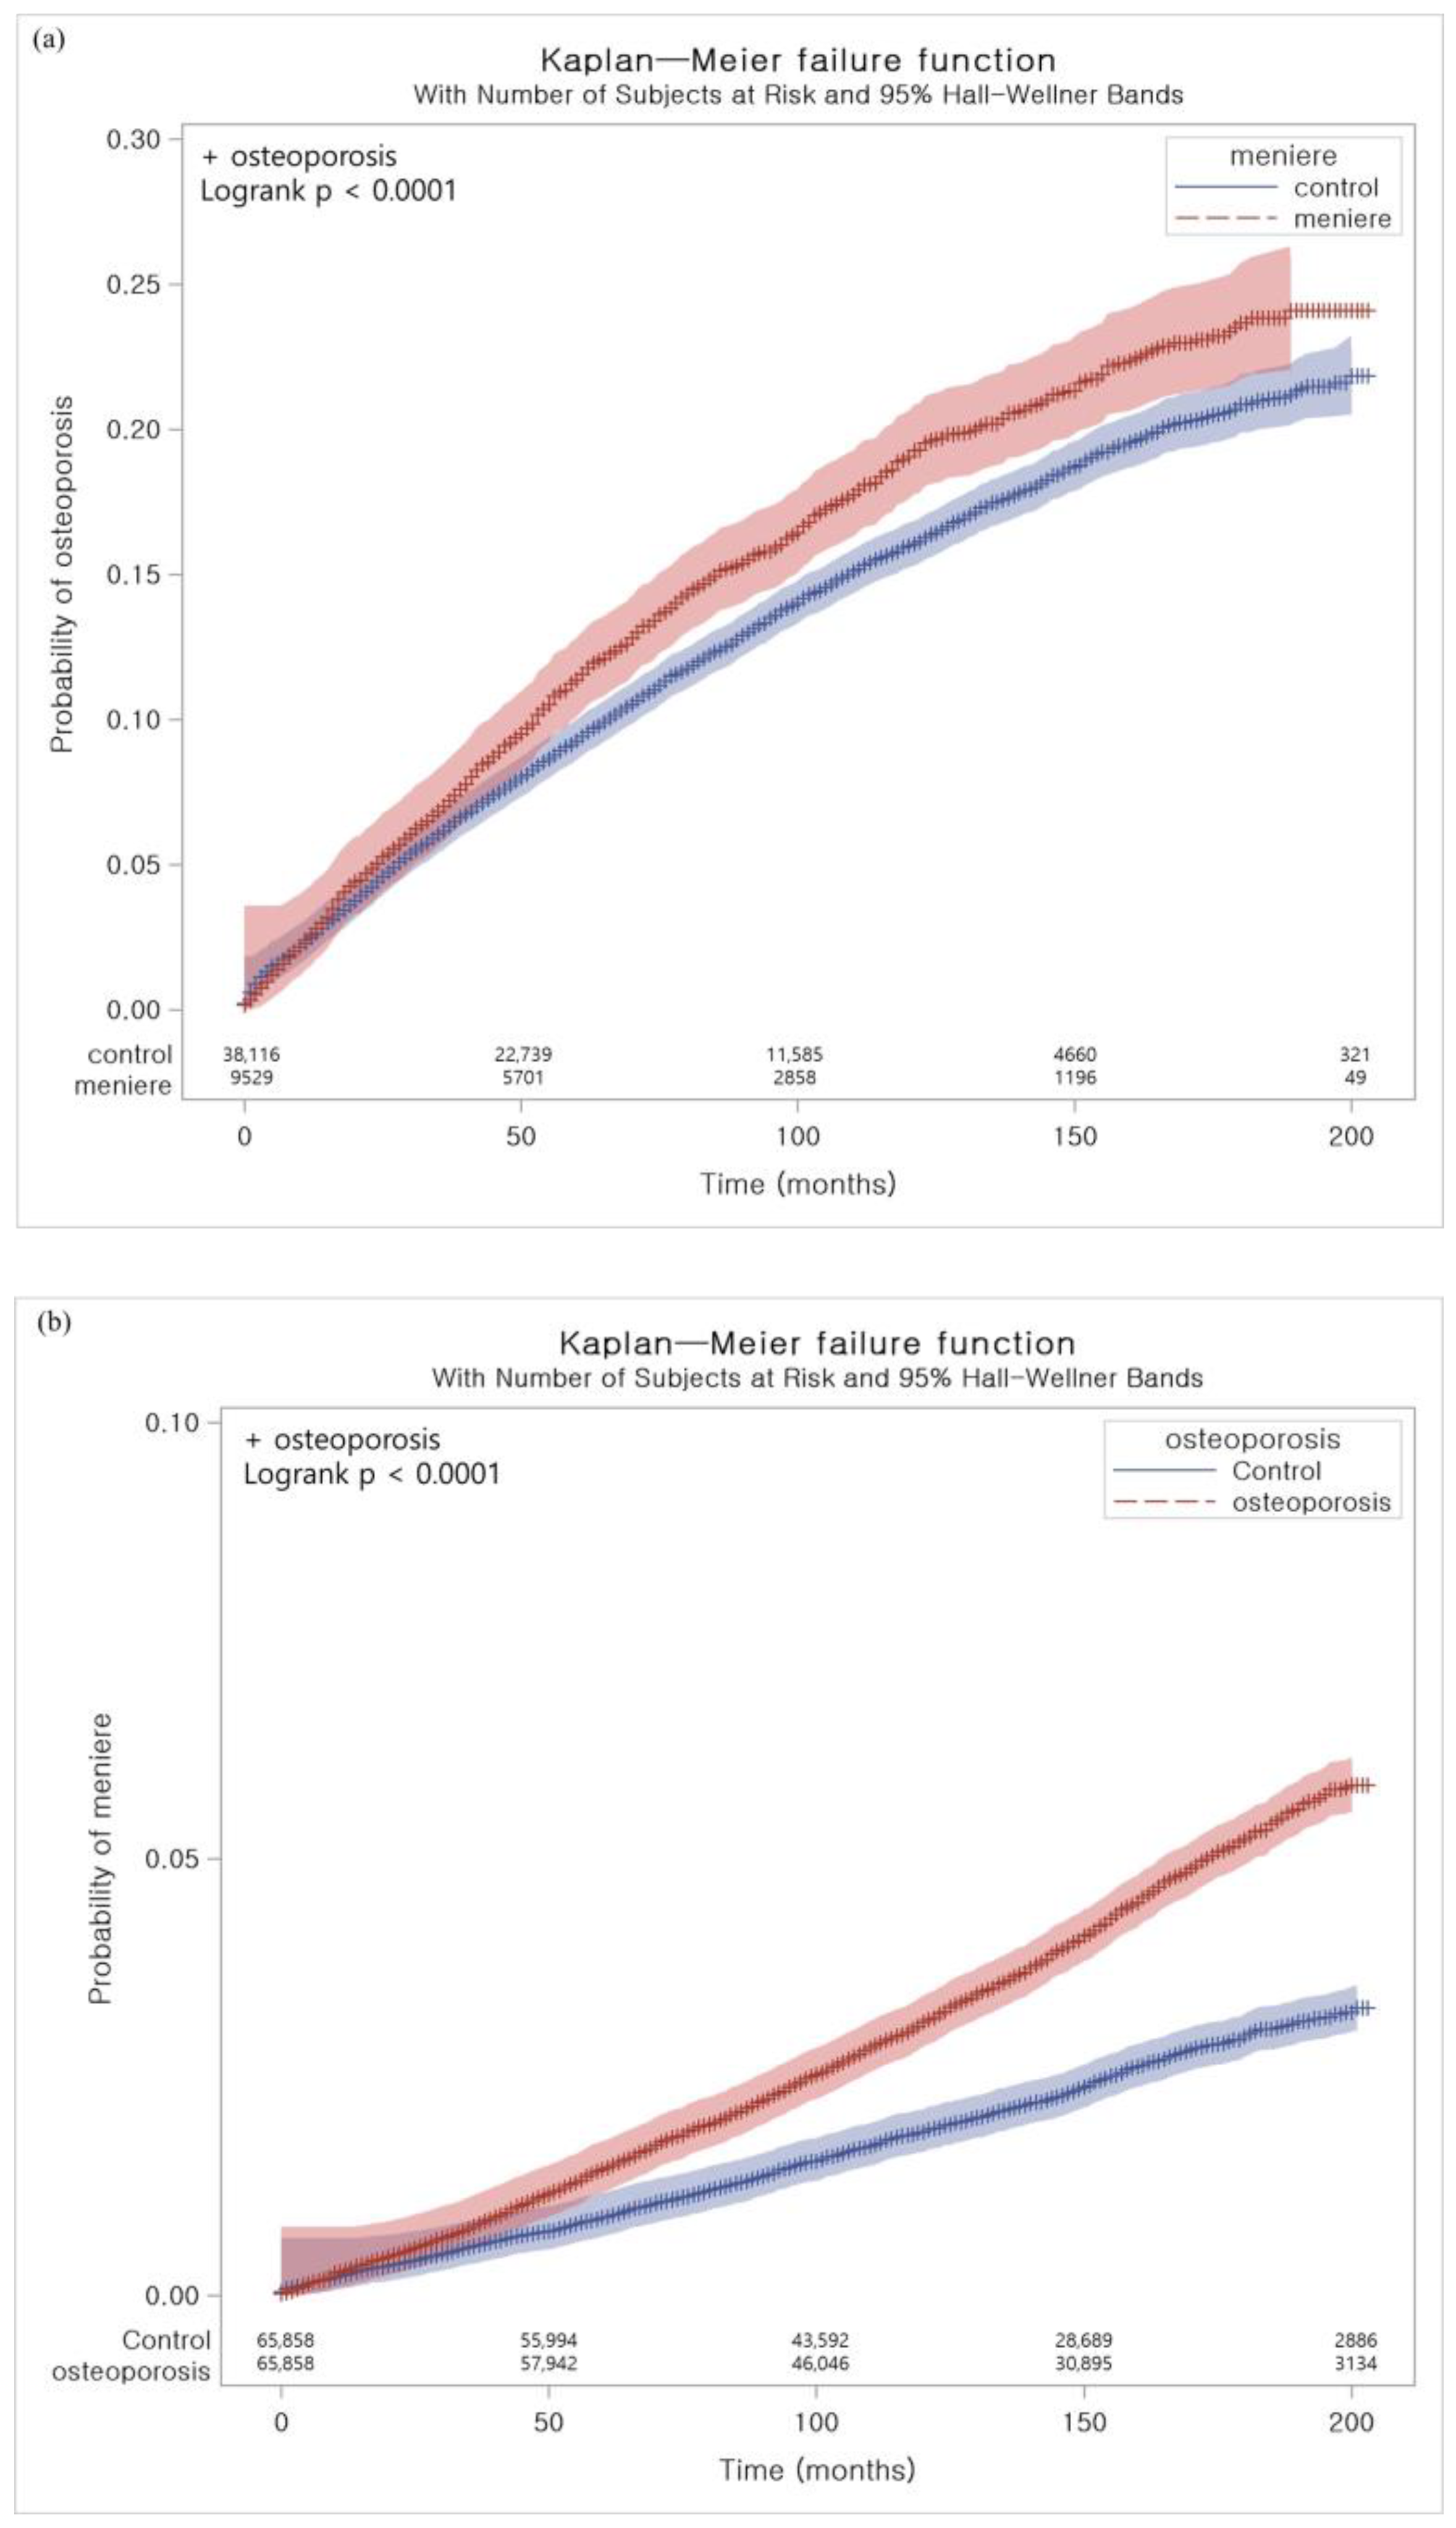
Figure 3.
(a) Adjusted hazard ratios of osteoporosis in Meniere’s disease patients according to age, sex, income, region, smoking status, alcohol consumption, obesity, blood pressure, fasting blood glucose, and total cholesterol (b) Adjusted hazard ratios of Meniere’s disease in osteoporosis patients according to age, sex, income, region, smoking status, alcohol consumption, obesity, blood pressure, fasting blood glucose, and total cholesterol.

Table 1.
General Characteristics of the Participants.
| Characteristics | Total Participants | |||
|---|---|---|---|---|
| Meniere’s Disease (n, %) | Control (n, %) | Standardized Difference | ||
| Age (years old) | 0.00 | |||
| 40–44 | 132 (1.4) | 528 (1.4) | ||
| 45–49 | 547 (5.7) | 2188 (5.7) | ||
| 50–54 | 1230 (12.9) | 4920 (12.9) | ||
| 55–59 | 1986 (20.8) | 7944 (20.8) | ||
| 60–64 | 1738 (18.2) | 6952 (18.2) | ||
| 65–69 | 1519 (15.9) | 6076 (15.9) | ||
| 70–74 | 1189 (12.5) | 4756 (12.5) | ||
| 75–79 | 742 (7.8) | 2968 (7.8) | ||
| 80–84 | 332 (3.5) | 1328 (3.5) | ||
| 85+ | 114 (1.2) | 456 (1.2) | ||
| Sex | 0.00 | |||
| Male | 4690 (49.2) | 18,760 (49.2) | ||
| Female | 4839 (50.8) | 19,356 (50.8) | ||
| Income | 0.00 | |||
| 1 (lowest) | 1523 (16.0) | 6092 (16.0) | ||
| 2 | 1202 (12.6) | 4808 (12.6) | ||
| 3 | 1500 (15.7) | 6000 (15.7) | ||
| 4 | 2088 (21.9) | 8352 (21.9) | ||
| 5 (highest) | 3216 (33.8) | 12,864 (33.8) | ||
| Region of residence | 0.00 | |||
| Urban | 4087 (42.9) | 16,348 (42.9) | ||
| Rural | 5442 (57.1) | 21,768 (57.1) | ||
| Obesity † | 0.08 | |||
| Underweight | 185 (1.9) | 889 (2.3) | ||
| Normal | 3017 (31.7) | 13,246 (34.8) | ||
| Overweight | 2578 (27.1) | 10,333 (27.1) | ||
| Obese I | 3388 (35.6) | 12,349 (32.4) | ||
| Obese II | 361 (3.8) | 1299 (3.4) | ||
| Smoking status | 0.16 | |||
| Nonsmoker | 7747 (81.3) | 31,249 (82.0) | ||
| Past smoker | 1714 (18.0) | 5891 (15.5) | ||
| Current smoker | 68 (0.7) | 976 (2.6) | ||
| Alcohol consumption | 0.06 | |||
| <1 time a week | 6234 (65.4) | 23,822 (62.5) | ||
| ≥1 time a week | 3295 (34.6) | 14,294 (37.5) | ||
| Systolic blood pressure | 0.02 | |||
| <120 mmHg | 2825 (29.7) | 11,661 (30.6) | ||
| 120–139 mmHg | 4937 (51.8) | 18,669 (49.0) | ||
| ≥140 mmHg | 1767 (18.5) | 7786 (20.4) | ||
| Diastolic blood pressure | 0.12 | |||
| <80 mmHg | 5438 (57.1) | 18,825 (49.4) | ||
| 80–89 mmHg | 3123 (32.8) | 13,359 (35.1) | ||
| ≥90 mmHg | 968 (10.2) | 5932 (15.6) | ||
| Fasting blood glucose | 0.09 | |||
| <100 mg/dL | 4870 (51.1) | 22,776 (59.8) | ||
| 100–125 mg/dL | 3510 (36.8) | 11,416 (30.0) | ||
| ≥126 mg/dL | 1149 (12.1) | 3924 (10.3) | ||
| Total cholesterol | 0.16 | |||
| <200 mg/dL | 5671 (59.5) | 20,579 (54.0) | ||
| 200–239 mg/dL | 2724 (28.6) | 12,362 (32.4) | ||
| ≥240 mg/dL | 1134 (11.9) | 5175 (13.6) | ||
| CCI score | 0.14 | |||
| 0 | 5499 (57.7) | 24,021 (63.0) | ||
| 1 | 1860 (19.5) | 5947 (15.6) | ||
| ≥2 | 2170 (22.8) | 8148 (21.4) | ||
| Dyslipidemia | 6081 (63.8) | 20,422 (53.6) | 0.21 | |
| Benign paroxysmal vertigo | 4607 (48.4) | 4772 (12.5) | 0.85 | |
| Vestibular neuronitis | 1770 (18.6) | 1169 (3.1) | 0.52 | |
| Other peripheral vertigo | 3582 (37.6) | 3587 (9.4) | 0.70 | |
| Osteoporosis | 1266 (13.3) | 4287 (11.3) | 0.06 | |
Abbreviations: CCI, Charlson comorbidity index. SD, standard deviation. † Obesity (BMI, body mass index, kg/m2) was categorized as <18.5 (underweight), from 18.5 to <23 (normal), from 23 to <25 (overweight), from 25 to <30 (obese I), and ≥30 (obese II).
Table 2.
Crude and adjusted hazard ratios of Meniere’s disease for osteoporosis in subgroups according to age, sex, income, region, smoking status, alcohol consumption, obesity, blood pressure, fasting blood glucose, and total cholesterol.
Table 2.
Crude and adjusted hazard ratios of Meniere’s disease for osteoporosis in subgroups according to age, sex, income, region, smoking status, alcohol consumption, obesity, blood pressure, fasting blood glucose, and total cholesterol.
| N of Event/ N of Total (%) | F/U Duration (PY) | IR per 1000 (PY) | IRD (95% CI) | Hazard Ratios | |||||
|---|---|---|---|---|---|---|---|---|---|
| Crude | p-Value | Adjusted † | p-Value | p for Interaction | |||||
| Total | |||||||||
| Meniere’s disease | 1266/9529 (13.3) | 55,280 | 22.90 | 3.59 (2.27 to 4.91) | 1.20 (1.13–1.28) | <0.001 * | 1.12 (1.04–1.20) | 0.003 * | |
| Control | 4287/38,116 (11.2) | 221,976 | 19.31 | 3.59 (2.27 to 4.91) | 1 | 1 | |||
| Age < 65 years old | 0.211 | ||||||||
| Meniere’s disease | 440/3895 (11.3) | 29,322 | 15.01 | 1.45 (−0.05 to 2.96) | 1.12 (1.01–1.24) | 0.037 * | 1.04 (0.92–1.18) | 0.533 | |
| Control | 1595/15,580 (10.2) | 117,693 | 13.55 | 1 | 1 | ||||
| Age ≥ 65 years old | |||||||||
| Meniere’s disease | 826/5634 (14.7) | 25,958 | 31.82 | 6.01 (3.77 to 8.24) | 1.25 (1.15–1.35) | <0.001 * | 1.17 (1.07–1.27) | <0.001 * | |
| Control | 2692/22,536 (11.9) | 104,283 | 25.81 | 1 | 1 | ||||
| Male | 0.001 * | ||||||||
| Meniere’s disease | 194/4690 (4.1) | 26,878 | 7.22 | 2.61 (1.66 to 3.57) | 1.56 (1.32–1.85) | <0.001 * | 1.44 (1.18–1.75) | <0.001 * | |
| Control | 487/18,760 (2.6) | 105,790 | 4.60 | 1 | 1 | ||||
| Female | |||||||||
| Meniere’s disease | 1072/4839 (22.2) | 28,402 | 37.74 | 5.04 (2.66 to 7.42) | 1.15 (1.08–1.23) | <0.001 * | 1.08 (1.00–1.16) | 0.060 | |
| Control | 3800/19,356 (19.6) | 116,186 | 32.71 | 1 | 1 | ||||
| Low income | 0.516 | ||||||||
| Meniere’s disease | 629/4225 (14.9) | 24,633 | 25.53 | 3.74 (1.64 to 5.84) | 1.18 (1.08–1.30) | <0.001 * | 1.08 (0.97–1.19) | 0.166 | |
| Control | 2145/16,900 (12.7) | 98,415 | 21.80 | 1 | 1 | ||||
| High income | |||||||||
| Meniere’s disease | 637/5304 (12.0) | 30,647 | 20.79 | 3.45 (1.77 to 5.13) | 1.22 (1.11–1.33) | <0.001 * | 1.16 (1.05–1.28) | 0.005 * | |
| Control | 2142/21,216 (10.1) | 123,561 | 17.34 | 1 | 1 | ||||
| Urban residents | 0.410 | ||||||||
| Meniere’s disease | 467/4087 (11.4) | 24,815 | 18.82 | 2.19 (0.37 to 4.01) | 1.14 (1.03–1.26) | 0.013 * | 1.10 (0.97–1.24) | 0.126 | |
| Control | 1638/16,348 (10.0) | 98,485 | 16.63 | 1 | 1 | ||||
| Rural residents | |||||||||
| Meniere’s disease | 799/5442 (14.7) | 30,465 | 26.23 | 4.78 (2.90 to 6.65) | 1.24 (1.14–1.34) | <0.001 * | 1.13 (1.03–1.24) | <0.001 * | |
| Control | 2649/21,768 (12.2) | 123,491 | 21.45 | 1 | 1 | ||||
| Nonsmoker or Past smoker | 0.002 * | ||||||||
| Meniere’s disease | 1247/9461 (13.2) | 54,747 | 22.78 | 2.96 (1.62 to 4.30) | 1.19 (1.12–1.27) | <0.001 * | 1.11 (1.03–1.19) | 0.006 * | |
| Control | 4209/37,140 (11.3) | 212,367 | 19.82 | 1 | 1 | ||||
| Current smoker | |||||||||
| Meniere’s disease | 19/68 (27.9) | 533 | 35.65 | 27.53 (19.00 to 36.06) | 2.71 (1.33–5.56) | 0.006 * | 2.40 (0.97–5.94) | 0.057 | |
| Control | 78/976 (8.0) | 9609 | 8.12 | 1 | 1 | ||||
| Alcohol consumption < 1 time a week | 0.375 | ||||||||
| Meniere’s disease | 1078/6234 (17.3) | 39,023 | 27.62 | 2.92 (1.15 to 4.69) | 1.19 (1.11–1.27) | <0.001 * | 1.09 (1.01–1.18) | 0.026 | |
| Control | 3714/23,822 (15.6) | 150,315 | 24.71 | 1 | 1 | ||||
| Alcohol consumption ≥ 1 time a week | |||||||||
| Meniere’s disease | 188/3295 (5.7) | 16,257 | 11.56 | 3.57 (1.98 to 5.15) | 1.28 (1.08–1.51) | 0.005 * | 1.26 (1.04–1.53) | 0.018 | |
| Control | 573/14,294 (4.0) | 71,661 | 8.00 | 1 | 1 | ||||
| Underweight | 0.123 | ||||||||
| Meniere’s disease | 40/185 (21.6) | 939 | 42.60 | 15.79 (3.66 to 27.92) | 1.52 (0.99–2.34) | 0.055 | 1.18 (0.68–2.04) | 0.555 | |
| Control | 117/889 (13.2) | 4364 | 26.81 | 1 | 1 | ||||
| Normal weight | |||||||||
| Meniere’s disease | 439/3017 (14.6) | 17,402 | 25.23 | 4.63 (2.22 to 7.03) | 1.21 (1.09–1.35) | <0.001 * | 1.11 (0.99–1.26) | 0.083 | |
| Control | 1593/13,246 (12.0) | 77,328 | 20.60 | 1 | 1 | ||||
| Overweight | |||||||||
| Meniere’s disease | 352/2578 (13.7) | 14,667 | 24.00 | 5.96 (3.47 to 8.46) | 1.35 (1.19–1.52) | <0.001 * | 1.26 (1.10–1.46) | 0.001 * | |
| Control | 1102/10,333 (10.7) | 61,097 | 18.04 | 1 | 1 | ||||
| Obese | |||||||||
| Meniere’s disease | 435/3749 (11.6) | 22,272 | 19.53 | 0.90 (−1.14 to 2.94) | 1.10 (0.99–1.23) | 0.082 | 1.00 (0.88–1.13) | 0.955 | |
| Control | 1475/13,648 (10.8) | 79,187 | 18.63 | 1 | 1 | ||||
| SBP < 140 mmHg and DBP < 90 mmHg | 0.604 | ||||||||
| Meniere’s disease | 973/7530 (12.9) | 43,501 | 22.37 | 3.13 (1.64 to 4.62) | 1.21 (1.13–1.30) | <0.001 * | 1.13 (1.04–1.22) | 0.005 * | |
| Control | 3141/28,886 (10.9) | 163,298 | 19.23 | 1 | 1 | ||||
| SBP ≥ 140 mmHg or DBP ≥ 90 mmHg | |||||||||
| Meniere’s disease | 293/1999 (14.7) | 11,779 | 24.87 | 5.34 (2.52 to 8.17) | 1.15 (1.01–1.31) | 0.037 | 0.99 (0.86–1.15) | 0.922 | |
| Control | 1146/9230 (12.4) | 58,678 | 19.53 | 1 | 1 | ||||
| Fasting blood glucose < 100 mg/dL | <0.001 * | ||||||||
| Meniere’s disease | 785/4870 (16.1) | 27,581 | 28.46 | 7.93 (6.03 to 9.84) | 1.37 (1.26–1.48) | <0.001 * | 1.21 (1.11–1.32) | <0.001 * | |
| Control | 2910/22,776 (12.8) | 141,761 | 20.53 | 1 | 1 | ||||
| Fasting blood glucose ≥ 100 mg/dL | |||||||||
| Meniere’s disease | 481/4659 (10.3) | 27,699 | 17.37 | 0.20 (−1.59 to 1.99) | 1.04 (0.94–1.15) | 0.478 | 0.99 (0.87–1.11) | 0.827 | |
| Control | 1377/15,340 (9.0) | 80,215 | 17.17 | 1 | 1 | ||||
| Total cholesterol < 200 mg/dL | <0.001 * | ||||||||
| Meniere’s disease | 629/5671 (11.1) | 33,282 | 18.90 | 1.40 (−0.22 to 3.03) | 1.07 (0.98–1.17) | 0.141 | 1.01 (0.91–1.12) | 0.800 | |
| Control | 2068/20,579 (10.0) | 118,204 | 17.50 | 1 | 1 | ||||
| Total cholesterol ≥ 200 mg/dL | |||||||||
| Meniere’s disease | 637/3858 (16.5) | 21,998 | 28.96 | 7.57 (5.38 to 9.77) | 1.36 (1.25–1.49) | 1.24 (1.12–1.37) | <0.001 * | ||
| Control | 2219/17,537 (12.7) | 103,772 | 21.38 | 1 | 1 | ||||
Abbreviation: IR, incidence rate; IRD, incidence rate difference; SBP, systolic blood pressure; DBP, diastolic blood pressure; PY. person-year; * Significance at p < 0.05. † Adjusted for age, sex, income, region of residence, SBP, DBP, fasting blood glucose, total cholesterol, obesity, smoking, alcohol consumption, CCI scores, dyslipidemia, benign paroxysmal vertigo, vestibular neuronitis, and other types of peripheral vertigo.
Table 3.
General Characteristics of the Participants.
| Characteristics | Total Participants | |||
|---|---|---|---|---|
| Osteoporosis (n, %) | Control (n, %) | Standardized Difference | ||
| Age (years old) | 0.00 | |||
| 40–44 | 1000 (1.5) | 1000 (1.5) | ||
| 45–49 | 5010 (7.6) | 5010 (7.6) | ||
| 50–54 | 11,850 (18.0) | 11,850 (18.0) | ||
| 55–59 | 14,944 (22.7) | 14,944 (22.7) | ||
| 60–64 | 13,199 (20.0) | 13,199 (20.0) | ||
| 65–69 | 6950 (10.6) | 6950 (10.6) | ||
| 70–74 | 6607 (10.0) | 6607 (10.0) | ||
| 75–79 | 4229 (6.4) | 4229 (6.4) | ||
| 80–84 | 1731 (2.6) | 1731 (2.6) | ||
| 85+ | 338 (0.5) | 338 (0.5) | ||
| Sex | 0.00 | |||
| Male | 11,749 (17.8) | 11,749 (17.8) | ||
| Female | 54,109 (82.2) | 54,109 (82.2) | ||
| Income | ||||
| 1 (lowest) | 12,421 (18.9) | 12,421 (18.9) | ||
| 2 | 9987 (15.2) | 9987 (15.2) | ||
| 3 | 10,829 (16.4) | 10,829 (16.4) | ||
| 4 | 13,376 (20.3) | 13,376 (20.3) | ||
| 5 (highest) | 19,245 (29.2) | 19,245 (29.2) | ||
| Region of residence | 0.00 | |||
| Urban | 27,896 (42.4) | 27,896 (42.4) | ||
| Rural | 37,962 (57.6) | 37,962 (57.6) | ||
| Obesity † | 0.16 | |||
| Underweight | 2826 (4.3) | 1545 (2.4) | ||
| Normal | 25,405 (38.6) | 22,504 (34.2) | ||
| Overweight | 16,515 (25.1) | 17,308 (26.3) | ||
| Obese I | 18,836 (28.6) | 21,581 (32.8) | ||
| Obese II | 2276 (3.5) | 2920 (4.4) | ||
| Smoking status | 0.20 | |||
| Nonsmoker | 58,740 (89.2) | 58,076(88.2) | ||
| Past smoker | 5150 (7.8) | 3388(5.1) | ||
| Current smoker | 1968 (3.0) | 4394(6.7) | ||
| Alcohol consumption | ||||
| <1 time a week | 55,978 (85.0) | 53,924(81.9) | ||
| ≥1 time a week | 9880 (15.0) | 11,934(18.1) | ||
| Systolic blood pressure | 0.04 | |||
| <120 mmHg | 20,144 (30.6) | 19,771(30.0) | ||
| 120–139 mmHg | 32,475 (49.3) | 29,094(44.2) | ||
| ≥140 mmHg | 20,144 (30.6) | 16,993(25.8) | ||
| Diastolic blood pressure | 0.25 | |||
| <80 mmHg | 39,450 (59.9) | 30,318(46.0) | ||
| 80–89 mmHg | 19,893 (30.2) | 22,020(33.4) | ||
| ≥90 mmHg | 6515 (9.9) | 13,520(20.5) | ||
| Fasting blood glucose | 0.04 | |||
| <100 mg/dL | 37,846 (57.5) | 42,460 (64.5) | ||
| 100–125 mg/dL | 21,848 (33.2) | 17,168 (26.1) | ||
| ≥126 mg/dL | 6164 (9.4) | 6230 (9.5) | ||
| Total cholesterol | 0.23 | |||
| <200 mg/dL | 37,697 (57.2) | 31,720 (48.2) | ||
| 200–239 mg/dL | 19,550 (29.7) | 22,908 (34.8) | ||
| ≥240 mg/dL | 8611 (13.1) | 11,230 (17.1) | ||
| CCI score | 0.13 | |||
| 0 | 36,787 (55.9) | 40,072 (60.9) | ||
| 1 | 12,023 (18.3) | 10,153 (15.4) | ||
| ≥2 | 17,048 (25.9) | 15,633 (23.7) | ||
| Dyslipidemia | 41,037 (62.3) | 33,512 (50.9) | 0.23 | |
| Benign paroxysmal vertigo | 13,651 (20.7) | 9551 (14.5) | 0.16 | |
| Vestibular neuronitis | 3646 (5.5) | 2426 (3.7) | 0.09 | |
| Other peripheral vertigo | 10,765 (16.4) | 7325 (11.1) | 0.15 | |
| Meniere’s disease | 2441 (3.7) | 1339 (2.0) | 0.10 | |
Abbreviations: CCI, Charlson comorbidity index. SD, standard deviation. † Obesity (BMI, body mass index, kg/m2) was categorized as <18.5 (underweight), from 18.5 to <23 (normal), from 23 to <25 (overweight), from 25 to <30 (obese I), and ≥30 (obese II).
Table 4.
Crude and adjusted hazard ratios of osteoporosis for osteoporosis in subgroups according to age, sex, income, region, smoking status, alcohol consumption, obesity, blood pressure, fasting blood glucose, and total cholesterol.
Table 4.
Crude and adjusted hazard ratios of osteoporosis for osteoporosis in subgroups according to age, sex, income, region, smoking status, alcohol consumption, obesity, blood pressure, fasting blood glucose, and total cholesterol.
| N of Event/ N of Total (%) | F/U Duration (PY) | IR per 1000 (PY) | IRD (95% CI) | Hazard Ratios | |||||
|---|---|---|---|---|---|---|---|---|---|
| Crude | p-Value | Adjusted † | p-Value | p for Interaction | |||||
| Total | |||||||||
| Osteoporosis | 2441/65,858 (3.7) | 686,328 | 3.56 | 1.51 (1.34 to 1.69) | 1.74 (1.63–1.86) | <0.001 * | 1.50 (1.40–1.61) | <0.001 * | |
| Control | 1339/65,858 (2.0) | 655,747 | 2.04 | 1 | 1 | ||||
| Age < 65 years old | |||||||||
| Osteoporosis | 1171/32,804 (3.6) | 365,188 | 3.21 | 1.26 (1.02 to 1.49) | 1.64 (1.50–1.81) | <0.001 * | 1.47 (1.33–1.62) | <0.001 * | 0.310 |
| Control | 706/32,804 (2.2) | 362,009 | 1.95 | 1 | 1 | ||||
| Age ≥ 65 years old | |||||||||
| Osteoporosis | 1270/33,054 (3.8) | 321,140 | 3.95 | 1.80 (1.52 to 2.08) | 1.85 (1.68–2.03) | <0.001 * | 1.58 (1.42–1.74) | <0.001 * | |
| Control | 633/33,054 (1.9) | 293,738 | 2.15 | 1 | 1 | ||||
| Male | 0.223 | ||||||||
| Osteoporosis | 308/11,749 (2.6) | 83,587 | 3.68 | 1.68 (1.16 to 2.19) | 1.84 (1.52–2.22) | <0.001 * | 1.59 (1.29–1.95) | <0.001 * | |
| Control | 162/11,749 (1.4) | 80,678 | 2.01 | 1 | 1 | ||||
| Female | |||||||||
| Osteoporosis | 2133/54,109 (3.9) | 602,741 | 3.54 | 1.49 (1.30 to 1.68) | 1.73 (1.61–1.86) | <0.001 * | 1.49 (1.38–1.60) | <0.001 * | |
| Control | 1177/54,109 (2.2) | 575,069 | 2.05 | 1 | 1 | ||||
| Low income | 0.730 | ||||||||
| Osteoporosis | 1223/33,237 (3.7) | 344,847 | 3.55 | 1.53 (1.28 to 1.79) | 1.76 (1.60–1.94) | <0.001 * | 1.48 (1.34–1.64) | <0.001 * | |
| Control | 659/33,237 (2.0) | 327,587 | 2.01 | 1 | 1 | ||||
| High income | |||||||||
| Osteoporosis | 1218/32,621 (3.7) | 341,481 | 3.57 | 1.49 (1.24 to 1.75) | 1.72 (1.57–1.89) | <0.001 * | 1.53 (1.38–1.68) | <0.001 * | |
| Control | 680/32,621 (2.1) | 328,160 | 2.07 | 1 | 1 | ||||
| Urban residents | 0.543 | ||||||||
| Osteoporosis | 986/27,896 (3.5) | 294,122 | 3.35 | 1.45 (1.18 to 1.71) | 1.76 (1.58–1.95) | <0.001 * | 1.54 (1.37–1.72) | <0.001 * | |
| Control | 543/27,896 (1.9) | 284,889 | 1.91 | 1 | 1 | ||||
| Rural residents | |||||||||
| Osteoporosis | 1455/37,962 (3.8) | 392,206 | 3.71 | 1.56 (1.32 to 1.81) | 1.73 (1.59–1.89) | <0.001 * | 1.49 (1.36–1.63) | <0.001 * | |
| Control | 796/37,962 (2.1) | 370,858 | 2.15 | 1 | 1 | ||||
| Nonsmoker or Past smoker | <0.001 * | ||||||||
| Osteoporosis | 2381/63,890 (3.7) | 671,791 | 3.54 | 1.46 (1.28 to 1.65) | 1.70 (1.59–1.82) | <0.001 * | 1.47 (1.37–1.58) | <0.001 * | |
| Control | 1289/61,464 (2.1) | 619,678 | 2.08 | 1 | 1 | ||||
| Current smoker | |||||||||
| Osteoporosis | 60/1968 (3.0) | 14,537 | 4.13 | 2.74 (1.84 to 3.64) | 3.03 (2.05–4.47) | <0.001 * | 2.74 (1.78–4.20) | <0.001 * | |
| Control | 50/4394 (1.1) | 36,069 | 1.39 | 1 | 1 | ||||
| Alcohol consumption < 1 time a week | <0.001 * | ||||||||
| Osteoporosis | 1898/55,978 (3.4) | 593,096 | 3.20 | 1.16 (0.98 to 1.35) | 1.57 (1.46–1.69) | <0.001 * | 1.37 (1.27–1.48) | <0.001 * | |
| Control | 1161/53,924 (2.2) | 569,883 | 2.04 | 1 | 1 | ||||
| Alcohol consumption ≥ 1 time a week | |||||||||
| Osteoporosis | 543/9880 (5.5) | 93,232 | 5.82 | 3.75 (3.16 to 4.34) | 2.83 (2.38–3.37) | <0.001 * | 2.45 (2.04–2.94) | <0.001 * | |
| Control | 178/11,934 (1.5) | 85,864 | 2.07 | 1 | 1 | ||||
| Under weight | 0.712 | ||||||||
| Osteoporosis | 63/2826 (2.2) | 27,050 | 2.33 | 0.92 (−0.03 to 1.87) | 1.56 (0.92–2.66) | 0.101 | 1.24 (0.69–2.23) | 0.471 | |
| Control | 18/1545 (1.2) | 12,782 | 1.41 | 1 | 1 | ||||
| Normal weight | |||||||||
| Osteoporosis | 893/25,405 (3.5) | 257,394 | 3.47 | 1.50 (1.20 to 1.80) | 1.74 (1.55–1.95) | <0.001 * | 1.46 (1.29–1.64) | <0.001 * | |
| Control | 426/22,504 (1.9) | 216,567 | 1.97 | 1 | 1 | ||||
| Overweight | |||||||||
| Osteoporosis | 672/16,515 (4.1) | 172,858 | 3.89 | 1.71 (1.35 to 2.08) | 1.78 (1.57–2.02) | <0.001 * | 1.62 (1.42–1.85) | <0.001 * | |
| Control | 376/17,308 (2.2) | 172,944 | 2.17 | 1 | 1 | ||||
| Obese | |||||||||
| Osteoporosis | 813/21,112 (3.9) | 229,026 | 3.55 | 1.50 (1.21 to 1.80) | 1.73 (1.55–1.93) | <0.001 * | 1.48 (1.32–1.67) | <0.001 * | |
| Control | 519/24,501 (2.1) | 253,454 | 2.05 | 1 | 1 | ||||
| SBP < 140 mmHg and DBP < 90 mmHg | 0.076 | ||||||||
| Osteoporosis | 1884/51,259 (3.7) | 529,039 | 3.56 | 1.44 (1.23 to 1.66) | 1.68 (1.55–1.81) | <0.001 * | 1.37 (1.27–1.49) | <0.001 * | |
| Control | 947/46,032 (2.1) | 447,432 | 2.12 | 1 | 1 | ||||
| SBP ≥ 140 mmHg or DBP ≥ 90 mmHg | |||||||||
| Osteoporosis | 557/14,599 (3.8) | 157,289 | 3.54 | 1.66 (1.33 to 1.99) | 1.87 (1.64–2.13) | <0.001 * | 1.59 (1.39–1.82) | <0.001 * | |
| Control | 392/19,826 (2.0) | 208,315 | 1.88 | 1 | 1 | ||||
| Fasting blood glucose < 100 mg/dL | <0.001 * | ||||||||
| Osteoporosis | 1517/37,846 (4.0) | 389,966 | 3.89 | 1.88 (1.65 to 2.11) | 1.95 (1.79–2.11) | <0.001 * | 1.67 (1.53–1.82) | <0.001 * | |
| Control | 879/42,460 (2.1) | 437,869 | 2.01 | 1 | 1 | ||||
| Fasting blood glucose ≥ 100 mg/dL | |||||||||
| Osteoporosis | 924/28,012 (3.3) | 296,362 | 3.12 | 1.01 (0.72 to 1.29) | 1.48 (1.32–1.66) | <0.001 * | 1.26 (1.12–1.42) | <0.001 * | |
| Control | 460/23,398 (2.0) | 217,878 | 2.11 | 1 | 1 | ||||
| Total cholesterol < 200 mg/dL | <0.001 * | ||||||||
| Osteoporosis | 1287/37,697 (3.4) | 393,783 | 3.27 | 1.18 (0.93 to 1.42) | 1.52 (1.38–1.68) | <0.001 * | 1.29 (1.17–1.43) | <0.001 * | |
| Control | 641/31,720 (2.0) | 306,281 | 2.09 | 1 | 1 | ||||
| Total cholesterol ≥ 200 mg/dL | |||||||||
| Osteoporosis | 1154/28,161 (4.1) | 292,545 | 3.94 | 1.95 (1.68 to 2.21) | 2.04 (1.86–2.24) | <0.001 * | 1.77 (1.60–1.95) | <0.001 * | |
| Control | 698/34,138 (2.0) | 349,466 | 2.00 | 1 | 1 | ||||
Abbreviation: IR, incidence rate; IRD, incidence rate difference; SBP, systolic blood pressure; DBP, diastolic blood pressure; PY. person-year; * Significance at p < 0.05. † Adjusted for age, sex, income, region of residence, SBP, DBP, fasting blood glucose, total cholesterol, obesity, smoking, alcohol consumption, CCI scores, dyslipidemia, benign paroxysmal vertigo, vestibular neuronitis, and other types of peripheral vertigo.
Publisher’s Note: MDPI stays neutral with regard to jurisdictional claims in published maps and institutional affiliations. |
© 2022 by the authors. Licensee MDPI, Basel, Switzerland. This article is an open access article distributed under the terms and conditions of the Creative Commons Attribution (CC BY) license (https://creativecommons.org/licenses/by/4.0/).
Share and Cite
MDPI and ACS Style
Choi, H.G.; Chung, J.; Yoo, D.M.; Lee, C.H.; Kim, S.Y. Association between Osteoporosis and Meniere’s Disease: Two Longitudinal Follow-Up Cohort Studies. Nutrients 2022, 14, 4885. https://doi.org/10.3390/nu14224885
AMA Style
Choi HG, Chung J, Yoo DM, Lee CH, Kim SY. Association between Osteoporosis and Meniere’s Disease: Two Longitudinal Follow-Up Cohort Studies. Nutrients. 2022; 14(22):4885. https://doi.org/10.3390/nu14224885
Chicago/Turabian StyleChoi, Hyo Geun, Juyong Chung, Dae Myoung Yoo, Chang Ho Lee, and So Young Kim. 2022. "Association between Osteoporosis and Meniere’s Disease: Two Longitudinal Follow-Up Cohort Studies" Nutrients 14, no. 22: 4885. https://doi.org/10.3390/nu14224885
Note that from the first issue of 2016, this journal uses article numbers instead of page numbers. See further details here.