Abstract
Household income was related to habitual dietary intake in general Japanese people. This cross-sectional study investigated the relationship between household income and habitual dietary intake in people with type 2 diabetes mellitus (T2DM). Household income was evaluated using a self-reported questionnaire and categorized into high and low household income. Nutritional status was assessed using a brief-type self-administered diet history questionnaire. Among 128 men and 73 women, the proportions of participants with low household income were 67.2% (n = 86/128) in men and 83.6% (n = 61/73) in women. Dietary fiber intake (11.3 ± 4.2 vs. 13.8 ± 6.0 g/day, p = 0.006) was lower, and dietary acid load, net endogenous aid production score (NEAP) (51.7 ± 10.5 vs. 46.8 ± 10.4 mEq/day, p = 0.014) and potential renal acid load score (PRAL) (9.5 ± 10.7 vs. 3.7 ± 14.1 mEq/day, p = 0.011) were higher in men with low household income than in those without. Multivariable linear regression analyses demonstrated that log (dietary fiber intake) in men with low household income was lower than that in those with high household income after adjusting for covariates (2.35 [2.26–2.44] vs. 2.52 [2.41–2.62], p = 0.010). Furthermore, NEAP (54.6 [51.7–57.4] vs. 45.8 [42.5–49.2], p <0.001) in men with low household income were higher than in those with high household income after adjusting for covariates. Contrastingly, household income was not related to diet quality in women. This study showed that household income was related to dietary fiber intake and dietary acid load in men but not in women.
1. Introduction
All over the world, the population of people with type 2 diabetes mellitus (T2DM) continues to increase [1]. Socioeconomic status, which consists of educational level, occupation, living status, and household income, affects the prevalence of T2DM [2]. In particular, low household income has been related to the prevalence of T2DM [3,4]. Among people with T2DM, those with low income have been shown to have worse glycemic control than those with high income [5]. Moreover, low household income is found to be the risk of mortality in general populations [6]. Therefore, people with low household income are considered to have various risks.
According to data from the 2014 National Health and Nutrition Survey in Japan, a lower household income was related to higher carbohydrate intake and lower vegetable intake [7]. Moreover, a previous study revealed the association between low household income and low dietary fiber intake [8]. Among people with T2DM, dietary fiber intake has been shown to improve glycemic control, decrease hyperinsulinemia, and decrease plasma lipid concentrations [9]. Dietary fiber intake has reportedly been associated with all-cause mortality [10,11].
Moreover, dietary acid load has been revealed as a risk factor for metabolic syndrome [12], T2DM [13,14], hypertension [15], and mortality [16]. Dietary acid load score includes potential renal acid load (PRAL) and net endogenous acid production (NEAP). PRAL reflects the rates of intestinal absorption of contributing balances of nutrient ions for protein, potassium, calcium, and magnesium, as well as the dissociation of phosphate at pH 7.4 [17]. NEAP, estimated by the ratio of protein to potassium content in a diet, mirrors acid balance and is known as the risk of the chronic kidney disease advancement [18].
However, the relationship between household income and habitual dietary intake, especially dietary fiber intake and dietary acid load, in people with T2DM is unclear; thus, this cross-sectional study proposed to examine this association.
2. Method
2.1. Study Design, Setting and Participants
This cross-sectional study was included in the prospective KAMOGAWA-DM cohort study, running since 2014 [19]. This cohort study involved outpatients from the Department of Endocrinology and Metabolism, Kyoto Prefectural University of Medicine Hospital (Kyoto, Japan). The goal of this cohort study is to reveal the natural history of people with diabetes. The patients were invited to participate by their primary doctors, and those who agreed were included in this cohort study. All participants provided written informed consent. The present study was carried out in accordance with the Declaration of Helsinki with the approval of the Local Research Ethics Committee (No. RBMR-E-466-6). The inclusion criterion was the capability of responding to the questionnaires, including the brief-type self-administered diet history questionnaire (BDHQ), from January 2016 to February 2021. The exclusion criteria were non-T2DM; extremely low or high energy intake (<600 or >4000 kcal/day), as extremely low or high energy intake is unnatural [20]; incomplete questionnaire; and unknown household income.
2.2. Questionnaire Regarding Lifestyle Characteristics and Household Income
Participants were given a standardized questionnaire to assess lifestyle factors and household income. According to the answer to the questionnaire, participants were categorized as non-smokers and current smokers. Additionally, participants were categorized as non-exercisers and exercisers based on their performance, or lack thereof, of any type of sport at least one time per week. Educational level was evaluated with the following response options: “elementary school”, “junior high school”, “high school”, “technical college”, “vocational school”, “college”, and “graduate school”, and educational background of “elementary school” or “junior high school” was defined as <12 years [21]. Household income was evaluated with the following response options: “<3,000,000 JPY”, “3,000,000–5,000,000 JPY”, “5,000,000–8,000,000 JPY”, “≥8,000,000 JPY”, and “unknown or declined to answer” [22]. The average salary at that time of this study was JPY 4,360,000 [23]. Therefore, household income of “<3,000,000 JPY” or “3,000,000–5,000,000 JPY” was defined as low household income, whereas that of “5,000,000–8,000,000 JPY” or “≥8,000,000 JPY” was defined as high household income in this study [23].
2.3. Participant Data
Body mass index (BMI) was obtained as follows: body weight (kg) divided by height squared (m2). Ideal body weight (IBW) was determined as follows: IBW (kg) = 22 × (height [m])2 [24].
Fasting plasma glucose, glycosylated hemoglobin (HbA1c), uric acid, creatinine, triglycerides, and high-density lipoprotein cholesterol concentrations were analyzed using venous blood samples from all participants after a night of fasting. The estimated glomerular filtration rate (eGFR [mL/min/1.73 m2]) was estimated using the Japanese Society of Nephrology equation [25]. Renal failure was defined as eGFR <30 mL/min per 1.73 m2 [26]. Blood pressure was tested with an HEM-906 device (OMRON, Kyoto, Japan). Additionally, data on the use of medications, including insulin and antihypertensives, were gathered from the patients’ medical records. Hypertension was defined as systolic blood pressure of ≥140 mmHg and/or diastolic blood pressure of ≥90 mmHg, and/or use of antihypertensive drugs.
2.4. Estimation and Assessment of Habitual Food and Nutrient Intake
To assess habitual food and nutrient intake, the BDHQ, a dietary recall tool that estimates a respondent’s dietary intake of 58 items over the past month, was utilized [20]. The details and validity of BDHQ have been presented previously [27]. Data on energy (kcal/day); protein (g/day), including animal and vegetable proteins; fat (g/day); carbohydrate (g/day); fiber (g/day); phosphorus (mg/day); potassium (mg/day); magnesium (mg/day); calcium (mg/day); and alcohol (g/day) intakes were obtained from the BDHQ. Energy (kcal/IBW/day), fat (g/IBW/day), carbohydrate (g/IBW/day), total protein (g/IBW/day), animal protein (g/IBW/day), and vegetable protein (g/IBW/day) intakes were obtained. The carbohydrate to fiber intake ratio was calculated as follows: carbohydrate intake divided by fiber intake [28]. Alcohol consumption was also obtained, and habitual alcohol consumption was determined as that >20 g/day [29].
PRAL and NEAP were estimated as the following equations: PRAL (mEq/day) = 0.037 × phosphorus (mg/day) + 0.49 × protein (g/day) − 0.026 × magnesium (mg/day) − 0.021 × potassium (mg/day) − 0.013 × calcium (mg/day) [30] and NEAP (mEq/day) = −10.2 + (54.5 × protein [g/day]/potassium [mEq/day]) [31].
2.5. Statistical Analysis
Data are presented as means ± standard deviations or frequencies of potential confounding variables. The chi-square test was used for categorical variables, and the Student’s t-test was used for continuous variables to assess the statistical significance of differences between groups. Moreover, because the characteristics and dietary intakes differed between men and women, the data were analyzed by sex.
NEAP was equal variance. Although dietary fiber intake was not equal variance, logarithmic dietary fiber intake was equal variance. Therefore, NEAP and log (dietary fiber intake) were used for multivariable linear regression to assess the association between household income and log (dietary fiber intake) and dietary acid load. Multivariable linear regression analyses were executed, and geometric means with 95% confidence intervals were calculated, after adjusting for age, sex, BMI, the duration of diabetes, exercise habit, smoking habit, HbA1c, triglycerides, presence of hypertension, energy intake and alcohol consumption. Age, duration of diabetes, BMI, HbA1c, triglycerides and presence of hypertension are known to effect diet [32,33,34,35]. Exercise, smoking and drinking alcohol affected glycemic control, which are associated with diet therapy, including dietary fiber intake [36,37,38]. Increased energy intake results in a relatively high dietary fiber intake.
Statistical analyses were conducted using JMP software (version 13.2; SAS Institute Inc., Cary, NC, USA) and EZR (Saitama Medical Center, Jichi Medical University, Saitama, Japan) [39]. Differences with p values < 0.05 were considered statistically significant.
3. Results
In total, 338 people were contained in this study. We excluded 137 people: 24 without T2DM, 3 with hyper- or hypo-nutrition, 84 who failed to complete the questionnaire and 26 whose household income was unknown; thus, the final research population comprised 201 people (128 men and 73 women; Figure 1).
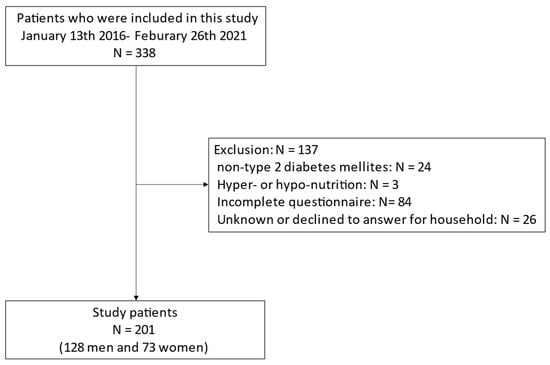
Figure 1.
Inclusion and exclusion flow.
The clinical characteristics of study participants are sum up in Table 1. Mean age and BMI were 68.3 ± 9.5 years and 23.9 ± 3.3 kg/m2 in men and 70.4 ± 7.2 years and 23.5 ± 3.9 kg/m2 in women, respectively. The percentage of participants with high household income were 32.8% (n = 42/128) and 16.4% (n = 12/73) in men and women, respectively. Mean dietary fiber intake was 12.1 ± 5.0 g/day in men and 12.3 ± 4.9 g/day in women. Mean PRAL and NEAP were 7.6 ± 12.2 mEq/day and 50.1 ± 10.7 mEq/day in men and 3.7 ± 13.1 mEq/day and 47.0 ± 10.6 mEq/day in women, respectively.

Table 1.
Clinical characteristics of study participants.
Table 2 presents the results of clinical characteristics according to household income. People with low household intake were older than those with high household intake (70.4 ± 7.7 vs. 65.3 ± 10.4 years, p < 0.001). The percentage of men in people with low household intake was lower than that with high household intake (58.5 vs. 77.8%, p = 0.019). Dietary fiber intake in people with low household income was lower than that in those with high household income (11.7 ± 4.5 vs. 13.5 ± 5.9 g/day, p = 0.028). Dietary fiber intake in men with low household income was lower than that in those with high household income (11.3 ± 4.2 vs. 13.8 ± 6.0 g/day, p = 0.006). PRAL (9.5 ± 10.7 vs. 3.7 ± 14.1 mEq/day, p = 0.011) and NEAP (51.7 ± 10.5 vs. 46.8 ± 10.4 mEq/day, p = 0.014) in men with low household income were higher than in those with high household income.
Table 2.
Clinical characteristics according to household income.
Furthermore, we investigated the association of dietary fiber intake and NEAP with household income (Table 3). Log (dietary fiber intake) with low household intake tended to be lower than that with high household income (2.38 [2.30–2.46] vs. 2.47 [2.37–2.57], p = 0.088). Log (dietary fiber intake) in men with low household income was lower than that in those with high household income after adjusting for covariates (2.35 [2.26–2.44] vs. 2.52 [2.41–2.62], p = 0.010). Furthermore, NEAP (54.6 [51.7–57.4] vs. 45.8 [42.5–49.2], p < 0.001) in men with low household income were higher than in those with high household income after adjusting for covariates. In contrast, household income was not related to dietary fiber intake and dietary acid load in women after adjusting for covariates.
Table 3.
The adjusted correlation of dietary fiber intake or net endogenous acid production score with household income.
The difference between included and excluded participants with T2DM was showed in Table S1. HbA1c in included people was higher than that in excluded people (7.3 ± 0.9 vs. 7.0 ± 0.8 %, p = 0.032). Exercise habit were different between included and excluded participants with T2DM (57.7 vs. 38.9 %, p = 0.002). The other characteristics were not different between included and excluded participants with T2DM.
4. Discussion
This study verified the relationship between household income and habitual dietary intake, especially dietary fiber intake and dietary acid load, in people with T2DM. The results of this study demonstrated that household income was related to dietary fiber intake and dietary acid load in men but not in women.
In the present study, men with low household income consumed lower dietary fiber than those with high household income, and the presence of hypertension in men with low household income was more prevalent than that in those with high household income. Previous studies found that there was an association between household income and vegetable intake [8,40]. This might because that although people are aware that vegetables are good for their health, price of vegetables may be a barrier to purchase vegetables, especially for those with low household income [41]. There is a relationship between dietary fiber and glycemic control, insulin sensitivity and lipid concentration [9]. Dietary fiber intake is reportedly related to blood pressure [42]. Additionally, higher dietary fiber intake is reportedly associated with a lower risk of all-cause death [10,11,43]. Taking these finding together, adequate dietary fiber intake is recommended for people with T2DM; thus, we should pay attention to dietary fiber intake among men with low household income.
Furthermore, PRAL and NEAP in men with low household income were higher than in those with high household income in this study. PRAL and NEAP are parameters of dietary acid load and exhibit higher values in diets containing a lot of acidogenic foods, such as meat and fish, and a lack of alkaline foods, such as fruits and vegetables [44]. Previously, PRAL and NEAP were reported to have positive associations with blood pressure [45]. High PRAL is recognized as a risk of cardiovascular diseases [46], and high NEAP is known to be associated with hypertension [47]. Therefore, improving dietary quality, such as dietary fiber intake and dietary acid load, potentially decreases the presence of hypertension and cardiovascular disease in men with low household income.
Previously, a relationship between household income and glycemic control in people with T2DM has been found [5]. However, household income was not related to glycemic control in the current study. Participants in this study were limited to those who were continuously visiting diabetes outpatient clinics and receiving treatment; thus, there might not have been an association between glycemic control and household income.
In the present study, an association between household income and dietary fiber intake or dietary acid load was found in men but not in women. A previous study showed that women tended to practice dietary self-care behaviors more than men [48]. Moreover, women have tended to purchased vegetables and fruits because they regarded vegetables and fruits were healthy [41]. Taking these finding together, household income might not relate to dietary fiber intake and dietary acid load in women in the present study. Therefore, a higher interest in dietary treatment among women might have reduced the effect of household income on diet.
The present study has certain limitations. First, socioeconomic status factors other than household income were not evaluated. Second, household income data were based on personal reporting, and thus the accuracy of the data was uncertain. Moreover, the number of participants, especially extreme incomes, were not enough. Therefore, we need further research with more participants and used the different cut-off. Third, since this study was a cross-sectional study, we could not confirm a causal relationship. Fourth, the validation of BDHQ has been showed previously [27]. However, the Pearson correlation coefficients between the dietary record and the BDHQ is around r = 0.60, which is a little low. Finally, all study participants were exclusively outpatients; therefore, the generalizability of the results to people with untreated T2DM is unclear.
5. Conclusions
This study showed that household income was related to dietary fiber intake and dietary acid load in men but not in women. Better dietary quality is important for people with T2DM; thus, clinicians and dieticians should pay attention to poor diet quality among men with low household income.
Supplementary Materials
The following are available online at https://www.mdpi.com/article/10.3390/nu14153229/s1. Table S1: Clinical characteristics of study participants according to included and excluded participants with type 2 diabetes mellitus.
Author Contributions
Conceptualization Y.H., A.K., R.S. and M.F.; data curation F.T., Y.H., A.K., R.S., Y.K., T.O. and M.H.; formal analysis F.T. and Y.H.; investigation F.T., Y.H., A.K., R.S., T.O., N.N., S.M., H.O., T.S., E.U., M.A., M.H., M.Y. and M.F.; methodology Y.H.,Y.K., M.H., W.A., M.K. and M.F.; project administration M.F.; validation Y.H. and M.F.; writing—original draft F.T., Y.H., Y.K., A.K., R.S., T.O., N.N., S.M., H.O., T.S., E.U., M.A., M.H., W.A., M.Y., M.K. and M.F.; writing—review and editing F.T., Y.H., Y.K., T.O., N.N., S.M., H.O., T.S., E.U., M.A., M.H., M.Y., W.A., M.K. and M.F. All authors have read and agreed to the published version of the manuscript.
Funding
This research received no external funding.
Institutional Review Board Statement
The study was conducted according to the Declaration of Helsinki, and approved by the Research Ethics Committee of Kyoto Prefectural University of Medicine (No. RBMR-E-466-6).
Informed Consent Statement
Informed consent was obtained from all subjects involved in the study.
Data Availability Statement
The datasets generated during and/or analyzed during the current study are available from the corresponding author on reasonable request.
Conflicts of Interest
Hashimoto received personal fees from Novo Nordisk Pharma Ltd., Mitsubishi Tanabe Pharma Corp., Kowa Company Ltd., Sanofi K.K., Takeda Pharmaceutical Co., Ltd., Ono Pharmaceutical Co., Ltd., Daiichi Sankyo Co., Ltd. and Sumitomo Dainippon Pharma Co., Ltd. outside of the submitted work. Nakanishi received grant support from the Japan Society for the Promotion of Science (JSPS KAKENHI grant numbers: 19K23999 and 20K16158) and the Japan Food Chemical Research Foundation and personal fees from Novo Nordisk Pharma Ltd. and Kowa Pharmaceutical Co., Ltd. Okada received grant support from the Japan Society for the Promotion of Science and personal fees from Daiichi Sankyo Co., Ltd., Takeda Pharmaceutical Co., Ltd., Sumitomo Dainippon Pharma Co., Ltd., Novo Nordisk Pharma Ltd., MSD K.K., Kyowa Hakko Kirin Company Ltd., Kowa Pharmaceutical Co., Ltd., Eli Lilly Japan K.K., Ono Pharmaceutical Co., Ltd., Kissei Pharmaceutical Co., Ltd., Sanofi K.K. and Mitsubishi Tanabe Pharma Corporation. Senmaru received personal fees from Kyowa Hakko Kirin Co., Ltd., Astellas Pharma Inc., Mitsubishi Tanabe Pharma Co., Kowa Pharma Co., Ltd., Sanofi K.K., Taisho Toyama Pharma Co., Ltd., Kissei Pharma Co., Ltd., MSD K.K., Novo Nordisk Pharma Ltd., Ono Pharma Co., Ltd., Eli Lilly Japan K.K. and Takeda Pharma Co., Ltd. outside the submitted work. Ushigome received grant support from the Japanese Study Group for Physiology and Management of Blood Pressure, Astellas Foundation for Research on Metabolic Disorders (grant number: 4024), Japan Society for the Promotion of Science, Mishima Kaiun Memorial Foundation and personal fees from Sumitomo Dainippon Pharma Co., Ltd., Mitsubishi Tanabe Pharma Corporation, Nippon Boehringer Ingelheim Co., Ltd., Sanofi K.K., Kowa Pharmaceutical Co., Ltd., Daiichi Sankyo Co., Ltd., Kyowa Hakko Kirin Co., Ltd., AstraZeneca K.K., Novo Nordisk Pharma Ltd., Ono Pharmaceutical Co., Ltd., Taisho Pharmaceutical Co., Ltd., Takeda Pharmaceutical Company Ltd. and MSD K.K. outside of the submitted work. The donated fund laboratory of diabetes therapeutics is an endowment department supported by an unrestricted grant from Taiyo Kagaku Co., Ltd., Taisho Pharmaceutical Co., Ltd., and Ono Pharmaceutical Co., Ltd. Asano received personal fees from Takeda Pharmaceutical Co., Ltd., Kowa Pharmaceutical Co., Ltd., AstraZeneca K.K., Ono Pharmaceutical Co., Ltd., Abbott Japan Co., Ltd., Novo Nordisk Pharma Ltd., Chugai Pharmaceutical Co., Ltd. and Sumitomo Dainippon Pharma Co., Ltd. outside the submitted work. Hamaguchi received grants from Yamada Bee Farm, Oishi Kenko Inc., Nippon Boehringer Ingelheim Co., Ltd., AstraZeneca K.K., and Ono Pharma Co., Ltd. and personal fees from Eli Lilly, Japan, Sanofi K.K., Sumitomo Dainippon Pharma Co., Ltd., Daiichi Sankyo Co., Ltd., Mitsubishi Tanabe Pharma Corp., AstraZeneca K.K., Ono Pharma Co., Ltd. and Kowa Pharma Co., Ltd. outside the submitted work. Yamazaki received personal fees from Sumitomo Dainippon Pharma Co., Ltd., Kowa Pharmaceutical Co., Ltd., Takeda Pharmaceutical Company Limited, Kyowa Hakko Kirin Co., Ltd., Kowa Company, Limited, Daiichi Sankyo Co., Ltd., Ono Pharmaceutical Co., Ltd., AstraZeneca PLC and MSD K.K. outside the submitted work. Fukui received grants from Eli Lilly, Japan, K.K., Nippon Boehringer Ingelheim Co., Ltd., Sanwa Kagagu Kenkyusho Co., Ltd., Oishi Kenko Inc., MSD K.K., Kowa Pharma Co., Ltd., Kissei Pharma Co., Ltd., Sumitomo Dainippon Pharma Co., Ltd., Ono Pharma Co. Ltd., Mitsubishi Tanabe Pharma Corp., Abbott Japan Co., Ltd., Daiichi Sankyo Co., Ltd., Johnson & Johnson K.K. Medical Co., Astellas Pharma Inc., Kyowa Kirin Co., Ltd., Novo Nordisk Pharma Ltd., Yamada Bee Farm, Taisho Pharma Co., Ltd., Terumo Corp., Takeda Pharma Co., Ltd., Tejin Pharma Ltd., Sanofi K.K., Nippon Chemiphar Co., Ltd. and TERUMO CORPORATION and personal fees from Astellas Pharma Inc., Nippon Boehringer Ingelheim Co., Ltd., Sanwa Kagaku Kenkyusho Co., Ltd., MSD K.K., Mochida Pharma Co., Ltd., Eli Lilly Japan K.K., Kissei Pharma Co., Ltd., AstraZeneca K.K., Mitsubishi Tanabe Pharma Corp., TERUMO CORPORATION, Daiichi Sankyo Co., Ltd., Bayer Yakuhin, Ltd., Takeda Pharma Co., Ltd., Teijin Pharma Ltd., Ono Pharma Co., Ltd., Taisho Pharma Co., Ltd., Kyowa Kirin Co., Ltd., Abbott Japan Co., Ltd., Sumitomo Dainippon Pharma Co., Ltd., Arkray Inc., Medtronic Japan Co., Ltd., Novo Nordisk Pharma Ltd., Kowa Pharma Co., Ltd., Nipro Corp. and Sanofi K.K. outside of the submitted work. The other authors declare no conflict of interest.
References
- Charvat, H.; Goto, A.; Goto, M.; Inoue, M.; Heianza, Y.; Arase, Y.; Sone, H.; Nakagami, T.; Song, X.; Qiao, Q.; et al. Impact of population aging on trends in diabetes prevalence: A meta-regression analysis of 160,000 Japanese adults. J. Diabetes Investig. 2015, 6, 533–542. [Google Scholar] [CrossRef] [PubMed]
- Connolly, V.; Unwin, N.; Sherriff, P.; Bilous, R.; Kelly, W. Diabetes prevalence and socioeconomic status: A population based study showing increased prevalence of type 2 diabetes mellitus in deprived areas. J. Epidemiol. Community Health 2000, 54, 173–177. [Google Scholar] [CrossRef] [PubMed] [Green Version]
- Nagamine, Y.; Kondo, N.; Yokobayashi, K.; Ota, A.; Miyaguni, Y.; Sasaki, Y.; Tani, Y.; Kondo, K. Socioeconomic Disparity in the Prevalence of Objectively Evaluated Diabetes Among Older Japanese Adults: JAGES Cross-Sectional Data in 2010. J. Epidemiol. 2019, 29, 295–301. [Google Scholar] [CrossRef] [Green Version]
- Adams, P.F.; Benson, V. Current estimates from the National Health interview survey, 1989. Vital Health Stat. 1990, 10, 1–221. [Google Scholar]
- Branfield Day, L.; Austin, P.C.; Shah, B.R. Universal drug coverage and income-related disparities in glycaemic control. Diabet. Med. 2020, 37, 822–827. [Google Scholar] [CrossRef]
- Kondo, N.; Saito, M.; Hikichi, H.; Aida, J.; Ojima, T.; Kondo, K.; Kawachi, I. Relative deprivation in income and mortality by leading causes among older Japanese men and women: AGES cohort study. J. Epidemiol. Community Health 2015, 69, 680–685. [Google Scholar] [CrossRef]
- Japan Ministry of Health, Labour and Welfare. The National Nutrition Survey in Japan. 2012. Available online: https://www.mhlw.go.jp/bunya/kenkou/eiyou/h26-houkoku.html (accessed on 24 April 2021). (In Japanese).
- Storey, M.; Anderson, P. Income and race/ethnicity influence dietary fiber intake and vegetable consumption. Nutr. Res. 2014, 34, 844–850. [Google Scholar] [CrossRef] [Green Version]
- Chandalia, M.; Garg, A.; Lutjohann, D.; von Bergmann, K.; Grundy, S.M.; Brinkley, L.J. Beneficial effects of high dietary fiber intake in patients with type 2 diabetes mellitus. N. Engl J. Med. 2000, 342, 1392–1398. [Google Scholar] [CrossRef]
- Kim, Y.; Je, Y. Dietary fiber intake and total mortality: A meta-analysis of prospective cohort studies. Am. J. Epidemiol. 2014, 180, 565–573. [Google Scholar] [CrossRef] [Green Version]
- Katagiri, R.; Goto, A.; Sawada, N.; Yamaji, T.; Iwasaki, M.; Noda, M.; Iso, H.; Tsugane, S. Dietary fiber intake and total and cause-specific mortality: The Japan Public Health Center-based prospective study. Am. J. Clin. Nutr. 2020, 111, 1027–1035. [Google Scholar] [CrossRef]
- Iwase, H.; Tanaka, M.; Kobayashi, Y.; Wada, S.; Kuwahata, M.; Kido, Y.; Hamaguchi, M.; Asano, M.; Yamazaki, M.; Hasegawa, G.; et al. Lower vegetable protein intake and higher dietary acid load associated with lower carbohydrate intake are risk factors for metabolic syndrome in patients with type 2 diabetes: Post-hoc analysis of a cross-sectional study. J. Diabetes Investig. 2015, 6, 465–472. [Google Scholar] [CrossRef] [PubMed]
- Fagherazzi, G.; Vilier, A.; Bonnet, F.; Lajous, M.; Balkau, B.; Boutron-Rualt, M.C.; Clavel-Chapelon, F. Dietary acid load and risk of type 2 diabetes: The E3N-EPIC cohort study. Diabetologia 2014, 57, 313–320. [Google Scholar] [CrossRef] [PubMed] [Green Version]
- Akter, S.; Kurotani, K.; Kashino, I.; Goto, A.; Mizoue, T.; Noda, M.; Sawada, N.; Tsugane, S.; Japan Public Health Center–based Prospective Study Group. High Dietary Acid Load Score Is Associated with Increased Risk of Type 2 Diabetes in Japanese Men: The Japan Public Health Center-based Prospective Study. J. Nutr. 2016, 146, 1076–1083. [Google Scholar] [CrossRef] [PubMed] [Green Version]
- Zhang, L.; Curhan, G.C.; Forman, J.P. Diet-dependent net acid load and risk of incident hypertension in United States women. Hypertension 2009, 54, 751–755. [Google Scholar] [CrossRef]
- Kurotani, K.; Akter, S.; Kashino, I.; Goto, A.; Mizoue, T.; Noda, M.; Sasazuki, S.; Sawada, N.; Tsugane, S.; Japan Public Health Center based Prospective Study Group. Quality of diet and mortality among Japanese men and women: Japan Public Health Center based prospective study. BMJ 2016, 352, i1209. [Google Scholar] [CrossRef] [Green Version]
- Remer, T.; Manz, F. Potential renal acid load of foods and its influence on urine pH. J. Am. Diet. Assoc. 1995, 95, 791–797. [Google Scholar] [CrossRef]
- Toba, K.; Hosojima, M.; Kabasawa, H.; Kuwahara, S.; Murayama, T.; Yamamoto-Kabasawa, K.; Kaseda, R.; Wada, E.; Watanabe, R.; Tanabe, N.; et al. Higher estimated net endogenous acid production with lower intake of fruits and vegetables based on a dietary survey is associated with the progression of chronic kidney disease. BMC Nephrol. 2019, 20, 421. [Google Scholar] [CrossRef] [Green Version]
- Sakai, R.; Hashimoto, Y.; Ushigome, E.; Miki, A.; Okamura, T.; Matsugasumi, M.; Fukuda, T.; Majima, S.; Matsumoto, S.; Senmaru, T.; et al. Late-night-dinner is associated with poor glycemic control in people with type 2 diabetes: The KAMOGAWA-DM cohort study. Endocr. J. 2018, 65, 395–402. [Google Scholar] [CrossRef] [Green Version]
- Murakami, K.; Sasaki, S.; Takahashi, Y.; Okubo, H.; Hosoi, Y.; Horiguchi, H.; Oguma, E.; Kayama, F. Dietary glycemic index and load in relation to metabolic risk factors in Japanese female farmers with traditional dietary habits. Am. J. Clin. Nutr. 2006, 83, 1161–1169. [Google Scholar] [CrossRef] [Green Version]
- Sakurai, M.; Nakagawa, H.; Kadota, A.; Yoshita, K.; Nakamura, Y.; Okuda, N.; Nishi, N.; Miyamoto, Y.; Arima, H.; Ohkubo, T.; et al. Macronutrient Intake and Socioeconomic Status: NIPPON DATA2010. J. Epidemiol. 2018, 28, S17–S22. [Google Scholar] [CrossRef] [Green Version]
- Hashimoto, Y.; Sakai, R.; Ikeda, K.; Fukui, M. Association between sleep disorder and quality of life in patients with type 2 diabetes: A cross-sectional study. BMC Endocr. Disord. 2020, 20, 98. [Google Scholar] [CrossRef]
- National Tax Agency. Statistical Survey of Actual Status for Salary in the Private Sector in Japan. 2020. Available online: https://www.nta.go.jp/publication/statistics/kokuzeicho/minkan/gaiyou/2019.htm (accessed on 6 May 2021). (In Japanese).
- Lemmens, H.J.; Brodsky, J.B.; Bernstein, D.P. Estimating ideal body weight—A new formula. Obes. Surg. 2005, 15, 1082–1083. [Google Scholar] [CrossRef] [PubMed]
- Matsuo, S.; Imai, E.; Horio, M.; Yasuda, Y.; Tomita, K.; Nitta, K.; Yamagata, K.; Tomino, Y.; Yokoyama, H.; Hishida, A.; et al. Revised equations for estimated GFR from serum creatinine in Japan. Am. J. Kidney Dis. 2009, 53, 982–992. [Google Scholar] [CrossRef]
- Haneda, M.; Utsunomiya, K.; Koya, D.; Babazono, T.; Moriya, T.; Makino, H.; Kimura, K.; Suzuki, Y.; Wada, T.; Ogawa, S.; et al. A New Classification of Diabetic Nephropathy 2014: A Report from Joint Committee on Diabetic Nephropathy. J. Diabetes Investig. 2015, 6, 242–246. [Google Scholar] [CrossRef] [PubMed]
- Kobayashi, S.; Honda, S.; Murakami, K.; Sasaki, S.; Okubo, H.; Hirota, N.; Notsu, A.; Fukui, M.; Date, C. Both Comprehensive and Brief Self-Administered Diet History Questionnaires Satisfactorily Rank Nutrient Intakes in Japanese Adults. J. Epidemiol. 2012, 22, 151–159. [Google Scholar] [CrossRef] [Green Version]
- Hashimoto, Y.; Tanaka, M.; Miki, A.; Kobayashi, Y.; Wada, S.; Kuwahata, M.; Kido, Y.; Yamazaki, M.; Fukui, M. Intake of Carbohydrate to Fiber Ratio Is a Useful Marker for Metabolic Syndrome in Patients with Type 2 Diabetes: A Cross-Sectional Study. Ann. Nutr. Metab. 2018, 72, 329–335. [Google Scholar] [CrossRef] [PubMed]
- Kaji, A.; Hashimoto, Y.; Sakai, R.; Okada, H.; Hamaguchi, M.; Ushigome, E.; Majima, S.; Yamazaki, M.; Fukui, M. Frequent Usage of Convenience Stores is Associated with Low Diet Quality. Nutrients 2019, 11, 1212. [Google Scholar] [CrossRef] [Green Version]
- Remer, T.; Dimitriou, T.; Manz, F. Dietary potential renal acid load and renal net acid excretion in healthy, free-living children and adolescents. Am. J. Clin. Nutr. 2003, 77, 1255–1260. [Google Scholar] [CrossRef] [Green Version]
- Frassetto, L.A.; Todd, K.M.; Morris, R.C.; Sebastian, A., Jr. Estimation of net endogenous noncarbonic acid production in humans from diet potassium and protein contents. Am. J. Clin. Nutr. 1998, 68, 576–583. [Google Scholar] [CrossRef] [Green Version]
- Roberts, S.B.; Rosenberg, I. Nutrition and Aging: Changes in the Regulation of Energy Metabolism with Aging. Physiol. Rev. 2006, 86, 651–667. [Google Scholar] [CrossRef]
- Mottalib, A.; Salsberg, V.; Mohd-Yusof, B.N.; Mohamed, W.; Carolan, P.; Pober, D.M.; Mitri, J.; Hamdy, O. Effects of Nutrition Therapy on HbA1c and Cardiovascular Disease Risk Factors in Overweight and Obese Patients with Type 2 Diabetes. Nutr. J. 2018, 17, 42. [Google Scholar] [CrossRef] [PubMed] [Green Version]
- Preuss, H.G.; Gondal, J.A.; Lieberman, S. Association of Macronutrients and Energy Intake with Hypertension. J. Am. Coll. Nutr. 2013, 15, 21–35. [Google Scholar] [CrossRef] [PubMed]
- Riccardi, G.; Rivellese, A.A. Effects of Dietary Fiber and Carbohydrate on Glucose and Lipoprotein Metabolism in Diabetic Patients. Diabetes Care 1991, 14, 1115–1125. [Google Scholar] [CrossRef] [PubMed]
- Tsukui, S.; Kanda, T.; Nara, M.; Nishino, M.; Kondo, T.; Kobayashi, I. Moderate-Intensity Regular Exercise Decreases Serum Tumor Necrosis Factor-α and HbA1c Levels in Healthy Women. Int. J. Obes. 2000, 24, 1207–1211. [Google Scholar] [CrossRef] [PubMed] [Green Version]
- Nilsson, P.M.; Gudbjörnsdottir, S.; Eliasson, B.; Cederholm, J. Smoking Is Associated with Increased HbA1c Values and Microalbuminuria in Patients with Diabetes—Data from the National Diabetes Register in Sweden. Diabetes Metab. 2004, 30, 261–268. [Google Scholar] [CrossRef]
- Hirakawa, M.; Arase, Y.; Amakawa, K.; Ohmoto-Sekine, Y.; Ishihara, M.; Shiba, M.; Ogawa, K.; Okuda, C.; Jinno, T.; Kato, H.; et al. Relationship between Alcohol Intake and Risk Factors for Metabolic Syndrome in Men. Intern. Med. 2015, 54, 2139–2145. [Google Scholar] [CrossRef] [Green Version]
- Kanda, Y. Investigation of the freely available easy-to-use software ‘EZR’ for medical statistics. Bone Marrow Transpl. 2013, 48, 452–458. [Google Scholar] [CrossRef] [Green Version]
- Nishi, N.; Horikawa, C.; Murayama, N. Characteristics of food group intake by household income in the National Health and Nutrition Survey, Japan. Asia Pac. J. Clin. Nutr. 2017, 26, 156–159. [Google Scholar] [CrossRef]
- Produce for Better Health Foundation. Moms’ Attitudes and Beliefs Related to Fruit and Vegetable Consumption; 2007–2014 [P. 5, 16, 19, 20, 21]. Available online: https://fruitsandveggies.org/wp-content/uploads/2020/08/MomReport2014_WEB.pdf (accessed on 8 September 2021).
- Whelton, S.P.; Hyre, A.D.; Pedersen, B.; Yi, Y.; Whelton, P.K.; He, J. Effect of dietary fiber intake on blood pressure: A meta-analysis of randomized, controlled clinical trials. J. Hypertens. 2005, 23, 475–481. [Google Scholar] [CrossRef]
- Yang, Y.; Zhao, L.G.; Wu, Q.J.; Ma, X.; Xiang, Y.B. Association between dietary fiber and lower risk of all-cause mortality: A meta-analysis of cohort studies. Am. J. Epidemiol. 2015, 181, 83–91. [Google Scholar] [CrossRef]
- Adeva, M.M.; Souto, G. Diet-induced metabolic acidosis. Clin. Nutr. 2011, 30, 416–421. [Google Scholar] [CrossRef] [PubMed]
- Murakami, K.; Livingstone, M.; Okubo, H.; Sasaki, S. Higher dietary acid load is weakly associated with higher adiposity measures and blood pressure in Japanese adults: The National Health and Nutrition Survey. Nutr. Res. 2017, 44, 67–75. [Google Scholar] [CrossRef] [PubMed]
- Dehghan, P.; Abbasalizad Farhangi, M. Dietary acid load, blood pressure, fasting blood sugar and biomarkers of insulin resistance among adults: Findings from an updated systematic review and meta-analysis. Int. J. Clin. Pract. 2020, 74, e13471. [Google Scholar] [CrossRef] [PubMed]
- Chen, S.W.; Chen, Z.H.; Liang, Y.H.; Wang, P.; Peng, J.W. Elevated hypertension risk associated with higher dietary acid load: A systematic review and meta-analysis. Clin. Nutr. ESPEN. 2019, 33, 171–177. [Google Scholar] [CrossRef] [PubMed]
- Ouyang, C.M.; Dwyer, J.T.; Jacques, P.F.; Chuang, L.M.; Haas, C.F.; Weinger, K. Determinants of dietary self-care behaviours among Taiwanese patients with type 2 diabetes. Asia Pac. J. Clin. Nutr. 2015, 24, 430–437. [Google Scholar] [CrossRef]
Publisher’s Note: MDPI stays neutral with regard to jurisdictional claims in published maps and institutional affiliations. |
© 2022 by the authors. Licensee MDPI, Basel, Switzerland. This article is an open access article distributed under the terms and conditions of the Creative Commons Attribution (CC BY) license (https://creativecommons.org/licenses/by/4.0/).