
Development of a Food-Based Diet Quality Scale for Brazilian Schoolchildren Using Item Response Theory

 , , , , ,
Abstract
:1. Introduction
2. Materials and Methods
2.1. PHASE 1-Surveys, Measures and Instruments
2.1.1. Weight Status and Family Income
2.1.2. Web-CAAFE Questionnaire
2.1.3. Dietary Assessment
2.2. PHASE 2-Data Organization for Scale Development
2.2.1. Step 1—Latent Trait Definition
2.2.2. Step 2—Items Generation
2.2.3. Step 3—Response Categories
2.2.4. Step 4—Selection of a Convenience Sample Presenting Variability in Food Consumption
2.3. PHASE 3-Scale Development
2.3.1. Step 5—Dimensionality
2.3.2. Step 6—Item Parameters
- j = 1, 2, …, n (n denotes the total number of respondents);
- ki = 0, 1, …, mi (mi denotes the number of categories of the i-th item minus 1);
- bi,ki is the difficulty parameter of the ki-th category of item i, with bi,1 ≤ bi,2 ≤ … ≤ bi,m;
- ai is the discrimination parameter of item i;
- θj represents the latent trait of the j-th individual, i.e., the individual’s diet quality; and
- is the probability of the j-th respondent with a diet quality level of θj to be classified in a particular category of the i-th diet quality level (ki) or higher.
2.3.3. Step 7—Linear Transformation of Items Parameters
2.3.4. Step 8—Item Positions and Scale Levels
2.4. PHASE 4, Step 9—Scale Application
3. Results
4. Discussion
5. Conclusions
Supplementary Materials
Author Contributions
Funding
Institutional Review Board Statement
Informed Consent Statement
Acknowledgments
Conflicts of Interest
References
- Bell, L.K.; Golley, R.K.; Magarey, A.M. Short tools to assess young children’s dietary intake: A systematic review focusing on application to dietary index research. J. Obes. 2013, 2013, 1–17. [Google Scholar] [CrossRef] [Green Version]
- Golley, R.K.; Bell, L.K.; Hendrie, G.; Rangan, A.; Spence, A.; McNaughton, S.A.; Carpenter, L.; Allman-Farinelli, M.; De Silva, A.; Gill, T.; et al. Validity of short food questionnaire items to measure intake in children and adolescents: A systematic review. J. Hum. Nutr. Diet. 2017, 30, 36–50. [Google Scholar] [CrossRef] [Green Version]
- Dalwood, P.; Marshall, S.; Burrows, T.L.; McIntosh, A.; Collins, C.E. Diet quality indices and their associations with health-related outcomes in children and adolescents: An updated systematic review. Nutr. J. 2020, 19, 1–43. [Google Scholar] [CrossRef] [PubMed]
- Trijsburg, L.; Talsma, E.F.; De Vries, J.H.M.; Kennedy, G.; Kuijsten, A.; Brouwer, I.D. Diet quality indices for research in low-and middle-income countries: A systematic review. Nutr. Rev. 2019, 77, 515–540. [Google Scholar] [CrossRef] [PubMed]
- Nguyen, T.H.; Han, H.-R.; Kim, M.T.; Chan, K.S. An Introduction to item response theory for patient-reported outcome measurement. Patient Patient Cent. Outcomes Res. 2014, 7, 23–35. [Google Scholar] [CrossRef] [Green Version]
- Kazman, J.B.; Scott, J.M.; Deuster, P.A. Using item response theory to address vulnerabilities in FFQ. Br. J. Nutr. 2017, 118, 383–391. [Google Scholar] [CrossRef] [PubMed]
- Bortolotti, S.L.V.; Tezza, R.; De Andrade, D.F.; Bornia, A.C.; Júnior, A.F.D.S. Relevance and advantages of using the item response theory. Qual. Quant. 2013, 47, 2341–2360. [Google Scholar] [CrossRef]
- Edelen, M.O.; Reeve, B.B. Applying item response theory (IRT) modeling to questionnaire development, evaluation, and refinement. Qual. Life Res. 2007, 16, 5–18. [Google Scholar] [CrossRef] [PubMed]
- Wilson, M.R.; Allen, D.D.; Li, J.C. Improving measurement in health education and health behavior research using item response modeling: Comparison with the classical test theory approach. Health Educ. Res. 2006, 21, 19–32. [Google Scholar] [CrossRef] [PubMed] [Green Version]
- Mâsse, L.C.; O’Connor, T.M.; Lin, Y.; Hughes, S.O.; Tugault-Lafleur, C.N.; Baranowski, T.; Beauchamp, M.R. Calibration of the food parenting practice (FPP) item bank: Tools for improving the measurement of food parenting practices of parents of 5–12-year-old children. Int. J. Behav. Nutr. Phys. Act. 2020, 17, 140. [Google Scholar] [CrossRef]
- Santos, T.S.S.; Julián, C.; Vincenzi, S.L.; de Andrade, D.F.; Slater, B.; de Assis, M.A.A.; Kafatos, A.; de Henauw, S.; Gottrand, F.; Androutsos, O.; et al. A new measure of health motivation influencing food choices and its association with food intakes and nutritional biomarkers in European adolescents. Public Health Nutr. 2021, 24, 685–695. [Google Scholar] [CrossRef]
- Santos, T.S.S.; Araújo, P.H.D.M.; de Andrade, D.F.; Louzada, M.L.D.C.; de Assis, M.A.A.; Slater, B. Two validity evidences of the ESQUADA and Brazilians’ dietary quality levels. Revista Saúde Pública 2021, 55, 39. [Google Scholar] [CrossRef] [PubMed]
- Da Costa, F.F.; Schmoelz, C.P.; Davies, V.F.; Di Pietro, P.F.; Kupek, E.; De Assis, M.A.A.; Thompson, D.; Kerr, D. Assessment of diet and physical activity of brazilian schoolchildren: Usability testing of a web-based questionnaire. JMIR Res. Protoc. 2013, 2, e31. [Google Scholar] [CrossRef] [PubMed]
- Davies, V.F.; Kupek, E.; Assis, M.A.; Natal, S.; Di Pietro, P.F.; Baranowski, T. Validation of a web-based questionnaire to assess the dietary intake of Brazilian children aged 7–10 years. J. Hum. Nutr. Diet. 2015, 28, 93–102. [Google Scholar] [CrossRef] [PubMed]
- Jesus, G.M.; Assis, M.A.A.; Kupek, E. Validity and reproducibility of an Internet-based questionnaire (Web-CAAFE) to evaluate the food consumption of students aged 7 to 15 years. Cad. Saude Publica 2017, 33, e00163016. [Google Scholar] [PubMed] [Green Version]
- Perazi, F.M.; Kupek, E.; Assis, M.A.A.; Pereira, L.J.; Cezimbra, V.G.; Oliveira, M.T.; Vieira, F.G.K.; Di Pietro, P.F.; Hinnig, P.F. Effect of the day and the number of days of application on reproducibility of a questionnaire to assess the food intake in schoolchildren. Rev. Bras. Epidemiol. 2020, 23, e200084. [Google Scholar] [CrossRef] [PubMed]
- Lobo, A.S.; De Assis, M.A.A.; Leal, D.B.; Borgatto, A.F.; Vieira, F.K.; Di Pietro, P.F.; Kupek, E. Empirically derived dietary patterns through latent profile analysis among Brazilian children and adolescents from Southern Brazil, 2013–2015. PLoS ONE 2019, 14, e0210425. [Google Scholar] [CrossRef]
- Cezimbra, V.G.; de Assis, M.A.A.; de Oliveira, M.T.; Pereira, L.J.; Vieira, F.G.K.; Di Pietro, P.F.; Roberto, D.M.T.; Geraldo, A.P.G.; Soar, C.; Rockenbach, G.; et al. Meal and snack patterns of 7–13-year-old schoolchildren in southern Brazil. Public Health Nutr. 2021, 24, 2542–2553. [Google Scholar] [CrossRef]
- Instituto Nacional de Estudos e Pesquisas Educacionais Anísio Teixeira. Censo Escolar. Available online: http://portal.inep.gov.br/microdados (accessed on 22 November 2020).
- Lohman, T.G.; Roche, A.F.; Martorell, R. Anthropometric Standardization Reference Manual; Human Kinetics Books: Champaign, IL, USA, 1998. [Google Scholar]
- Cole, T.J.; Bellizzi, M.C.; Flegal, K.; Dietz, W.H. Establishing a standard definition for child overweight and obesity worldwide: International survey. BMJ 2000, 320, 1240. [Google Scholar] [CrossRef] [Green Version]
- Instituto Brasileiro de Geografia e Estatística—IBGE. Base de Informações do Censo Demográfico 2010: Resultados do Universo por Setor Censitário. Rio de Janeiro: IBGE. 2011. Available online: http://www.ipea.gov.br/redeipea/images/pdfs/base_de_informacoess_por_setor_ (accessed on 3 November 2019).
- Baranowski, T.; Islam, N.; Baranowski, J.; Cullen, K.W.; Myres, D.; Marsh, T.; de Moor, C. The food intake recording software system is valid among fourth-grade children. J. Am. Diet. Assoc. 2002, 102, 380–385. [Google Scholar] [CrossRef]
- Diep, C.S.; Hingle, M.; Chen, T.A.; Dadabhoy, R.; Beltran, A.; Baranowski, J.; Subar, A.F.; Baranowski, T. The automated self-administered 24-hour dietary recall for children, 2012 version, for youth aged 9 to 11 years: A validation study. J. Acad. Nutr. Diet. 2015, 115, 1591–1598. [Google Scholar] [CrossRef] [PubMed] [Green Version]
- Ministério da Saúde; Secretaria de Atenção à Saúde, Departamento de Atenção Básica. Guia Alimentar Para a População Brasileira: Promovendo a Alimentação Saudável, 1st ed.; Ministério da Saúde: Palácio do Buriti, Brasília, 2008; 210p. Available online: https://bvsms.saude.gov.br/bvs/publicacoes/guia_alimentar_populacao_brasileira_2008.pdf (accessed on 4 June 2018).
- Ministério da Saúde; Secretaria de Atenção à Saúde; Departamento de Atenção Básica. Guia Alimentar Para a População Brasileira, 2nd ed.; Ministério da Saúde: Palácio do Buriti, Brasília, 2014; 156p. Available online: https://bvsms.saude.gov.br/bvs/publicacoes/guia_alimentar_populacao_brasileira_2ed.pdf (accessed on 4 June 2018).
- USDHHS/USDA—Dietary Guidelines for Americans 2015–2020. Available online: http://health.gov/dietaryguidelines/2015/guidelines/ (accessed on 29 May 2021).
- Agence Nationale de Sécurité Sanitaire de L’alimentation, de L’environnement et du Travail. Actualisation des Repères du PNNS: Élaboration des References Nutritionnelles; ANSES: Angers, France, 2016; 196p, Available online: https://www.anses.fr/fr/system/files/NUT2012SA0103Ra-2.pdf (accessed on 4 June 2018).
- Public Health England. A Quick Guide to the Government’s Healthy Eating Recommendations; Public Health England: London, UK, 2018; 12p. Available online: https://assets.publishing.service.gov.uk/government/uploads/system/uploads/attachment_data/file/742746/A_quick_guide_to_govt_healthy_eating_update.pdf (accessed on 3 April 2020).
- National Health and Medical Research Council. Australian Dietary Guidelines Summary; National Health and Medical Research Council: Canberra, Australia, 2013; 54p. Available online: https://www.eatforhealth.gov.au/sites/default/files/files/the_guidelines/n55a_australian_dietary_guidelines_summary_130530.pdf (accessed on 3 April 2020).
- Joreskog, K.G.; Moustaki, I. Factor analysis of ordinal variables with full information maximum likelihood. Multivar. Behah Res. 2001, 36, 347–387. [Google Scholar]
- Reckase, M.D. Unifactor latent trait models applied to multifactor tests: Results and implications. J. Educ. Stat. 1979, 4, 207–230. [Google Scholar] [CrossRef]
- Samejima, F. Estimation of latent ability using a response pattern of graded scores. Psychometrika 1969, 34, 1–97. [Google Scholar] [CrossRef]
- Borgatto, A.F.; Azevedo, C.; Pinheiro, A.; Andrade, D. Comparison of ability estimation methods using IRT for tests with different degrees of difficulty. Commun. Stat. Simul. Comput. 2014, 44, 474–488. [Google Scholar] [CrossRef]
- R Core Team. R: A Language and Environment for Statistical Computing; R Foundation for Statistical Computing: Vienna, Austria, 2019; Available online: https://www.R-project.org/ (accessed on 2 May 2020).
- Lumley, T. Survey: Analysis of complex survey samples. J. Statist. Softw. 2004, 9, 1–19. [Google Scholar] [CrossRef] [Green Version]
- Pereira, L.J.; Hinnig, P.D.F.; Di Pietro, P.F.; De Assis, M.A.A.; Vieira, F.G.K. Trends in food consumption of schoolchildren from 2nd to 5th grade: A panel data analysis. Revista Nutrição 2020, 33, e190164. [Google Scholar] [CrossRef]
- Rosi, A.; Paolella, G.; Biasini, B.; Scazzina, F.; SINU Working Group on Nutritional Surveillance in Adolescents. Dietary habits of adolescents living in North America, Europe or Oceania: A review on fruit, vegetable and legume consumption, sodium intake, and adherence to the Mediterranean Diet. Nutr. Metab. Cardiovasc. Dis. 2019, 29, 544–560. [Google Scholar] [CrossRef] [PubMed]
- Cheng, G.; Gerlach, S.; Libuda, L.; Kranz, S.; Karaolis-Danckert, N.; Kroke, A.; Buyken, A.E.; Günther, A.L.B. Diet quality in childhood is prospectively associated with the timing of puberty but not with body composition at puberty onset. J. Nutr. 2009, 140, 95–102. [Google Scholar] [CrossRef] [Green Version]
- Marrodán, M.D.; López-Ejed, N.; De Espinosa, M.G.M.; Martínez-Álvarez, J.R.; Carmenate, M.; Cabañas, M.D.; Cabañas, D.; Villarino, A.; Calabria, V.; Pacheco, J.L.; et al. High blood pressure and diet quality in the spanish childhood population. J. Hypert. 2013, 2, 1–7. [Google Scholar] [CrossRef] [Green Version]
- Baranowski, T.; Domel, S.B. A cognitive model of children’s reporting of food intake. Am. J. Clin. Nutr. 1994, 59, 212S–217S. [Google Scholar] [CrossRef] [PubMed]
- Thompson, F.E.; Kirkpatrick, S.I.; Subar, A.F.; Reedy, J.; Schap, T.E.; Wilson, M.M.; Krebs-Smith, S.M. The national cancer institute’s dietary assessment primer: A resource for diet research. J. Acad. Nutr. Diet. 2015, 115, 1986–1995. [Google Scholar] [CrossRef] [PubMed] [Green Version]
- Dodd, K.W.; Guenther, P.; Freedman, L.S.; Subar, A.F.; Kipnis, V.; Midthune, D.; Tooze, J.A.; Krebs-Smith, S.M. Statistical methods for estimating usual intake of nutrients and foods: A review of the theory. J. Am. Diet. Assoc. 2006, 106, 1640–1650. [Google Scholar] [CrossRef] [PubMed]


| Item | Web-CAAFE Foods, Beverages, and Food Groups | Consumption Frequency (Times/Day) | ||
|---|---|---|---|---|
| Category 0 (Lower) | Category 1 (Intermediate) | Category 2 (Higher) | ||
| (1) Cereals, pasta, breads, roots, and tubers | Rice, corn/potatoes/mashed potatoes, pasta, cassava flour, bread/biscuits, cakes, cheese bread | 0 | 1, 2, 3, 4, or ≥7 | 5 or 6 |
| (2) Beans | Beans | 0 | ≥3 | 1 or 2 |
| (3) Vegetables and leafy greens | Vegetables, leafy greens, vegetable soup | 0 | 1 or 2 | ≥3 |
| (4) Fruits | Fruits and fruit salad | 0 | 1 or 2 | ≥3 |
| (5) Dairy products | Milk, milk and coffee, cheese, yoghurt | 0 | 1, 2, or ≥4 | 3 |
| (6) Meat, fish, and eggs | Beef/poultry, fish/seafood, eggs | 0 | ≥3 | 1 or 2 |
| (7) Ultraprocessed sugary foods | Candies, chocolate bars, ice cream, with frosting/filling, sandwich cookies, breakfast cereal | ≥ 2 | 1 | 0 |
| (8) Sugary drinks | Soft drinks, fruit juices, chocolate milk | ≥ 2 | 1 | 0 |
| (9) Ultraprocessed savoury snacks and sausages | Savoury snacks (pizza/hamburger/hot dog), French fries, chips, instant noodles, sausages | ≥ 2 | 1 | 0 |
| (10) Water | Water | 0 | 1, 2, 3, or 4 | 5 or 6 |
| Item | Parameter | |||||
|---|---|---|---|---|---|---|
| a | SE (a) | b1 | SE (b1) | b2 | SE (b2) | |
| 1. Cereals, pasta, breads, roots, and tubers | 0.68 | 0.11 | −3.34 | 0.51 | 1.56 | 0.25 |
| 2. Beans | 1.05 | 0.14 | −0.32 | 0.09 | −0.10 | 0.08 |
| 3. Vegetables and leafy greens | 0.77 | 0.11 | 0.23 | 0.10 | 3.13 | 0.40 |
| 4. Fruits | 0.75 | 0.10 | −0.20 | 0.11 | 3.36 | 0.43 |
| 5. Dairy products | 0.97 | 0.12 | −1.11 | 0.14 | 2.24 | 0.25 |
| 6. Meat, fish, and eggs | 0.75 | 0.11 | −0.91 | 0.16 | −0.35 | 0.11 |
| 7. Ultraprocessed sugary foods | 0.81 | 0.11 | −1.40 | 0.19 | 0.54 | 0.12 |
| 8. Sugary drinks | 0.71 | 0.11 | −0.27 | 0.12 | 1.86 | 0.26 |
| 9. Ultraprocessed savoury snacks and sausages | 1.04 | 0.13 | −0.90 | 0.12 | 0.55 | 0.10 |
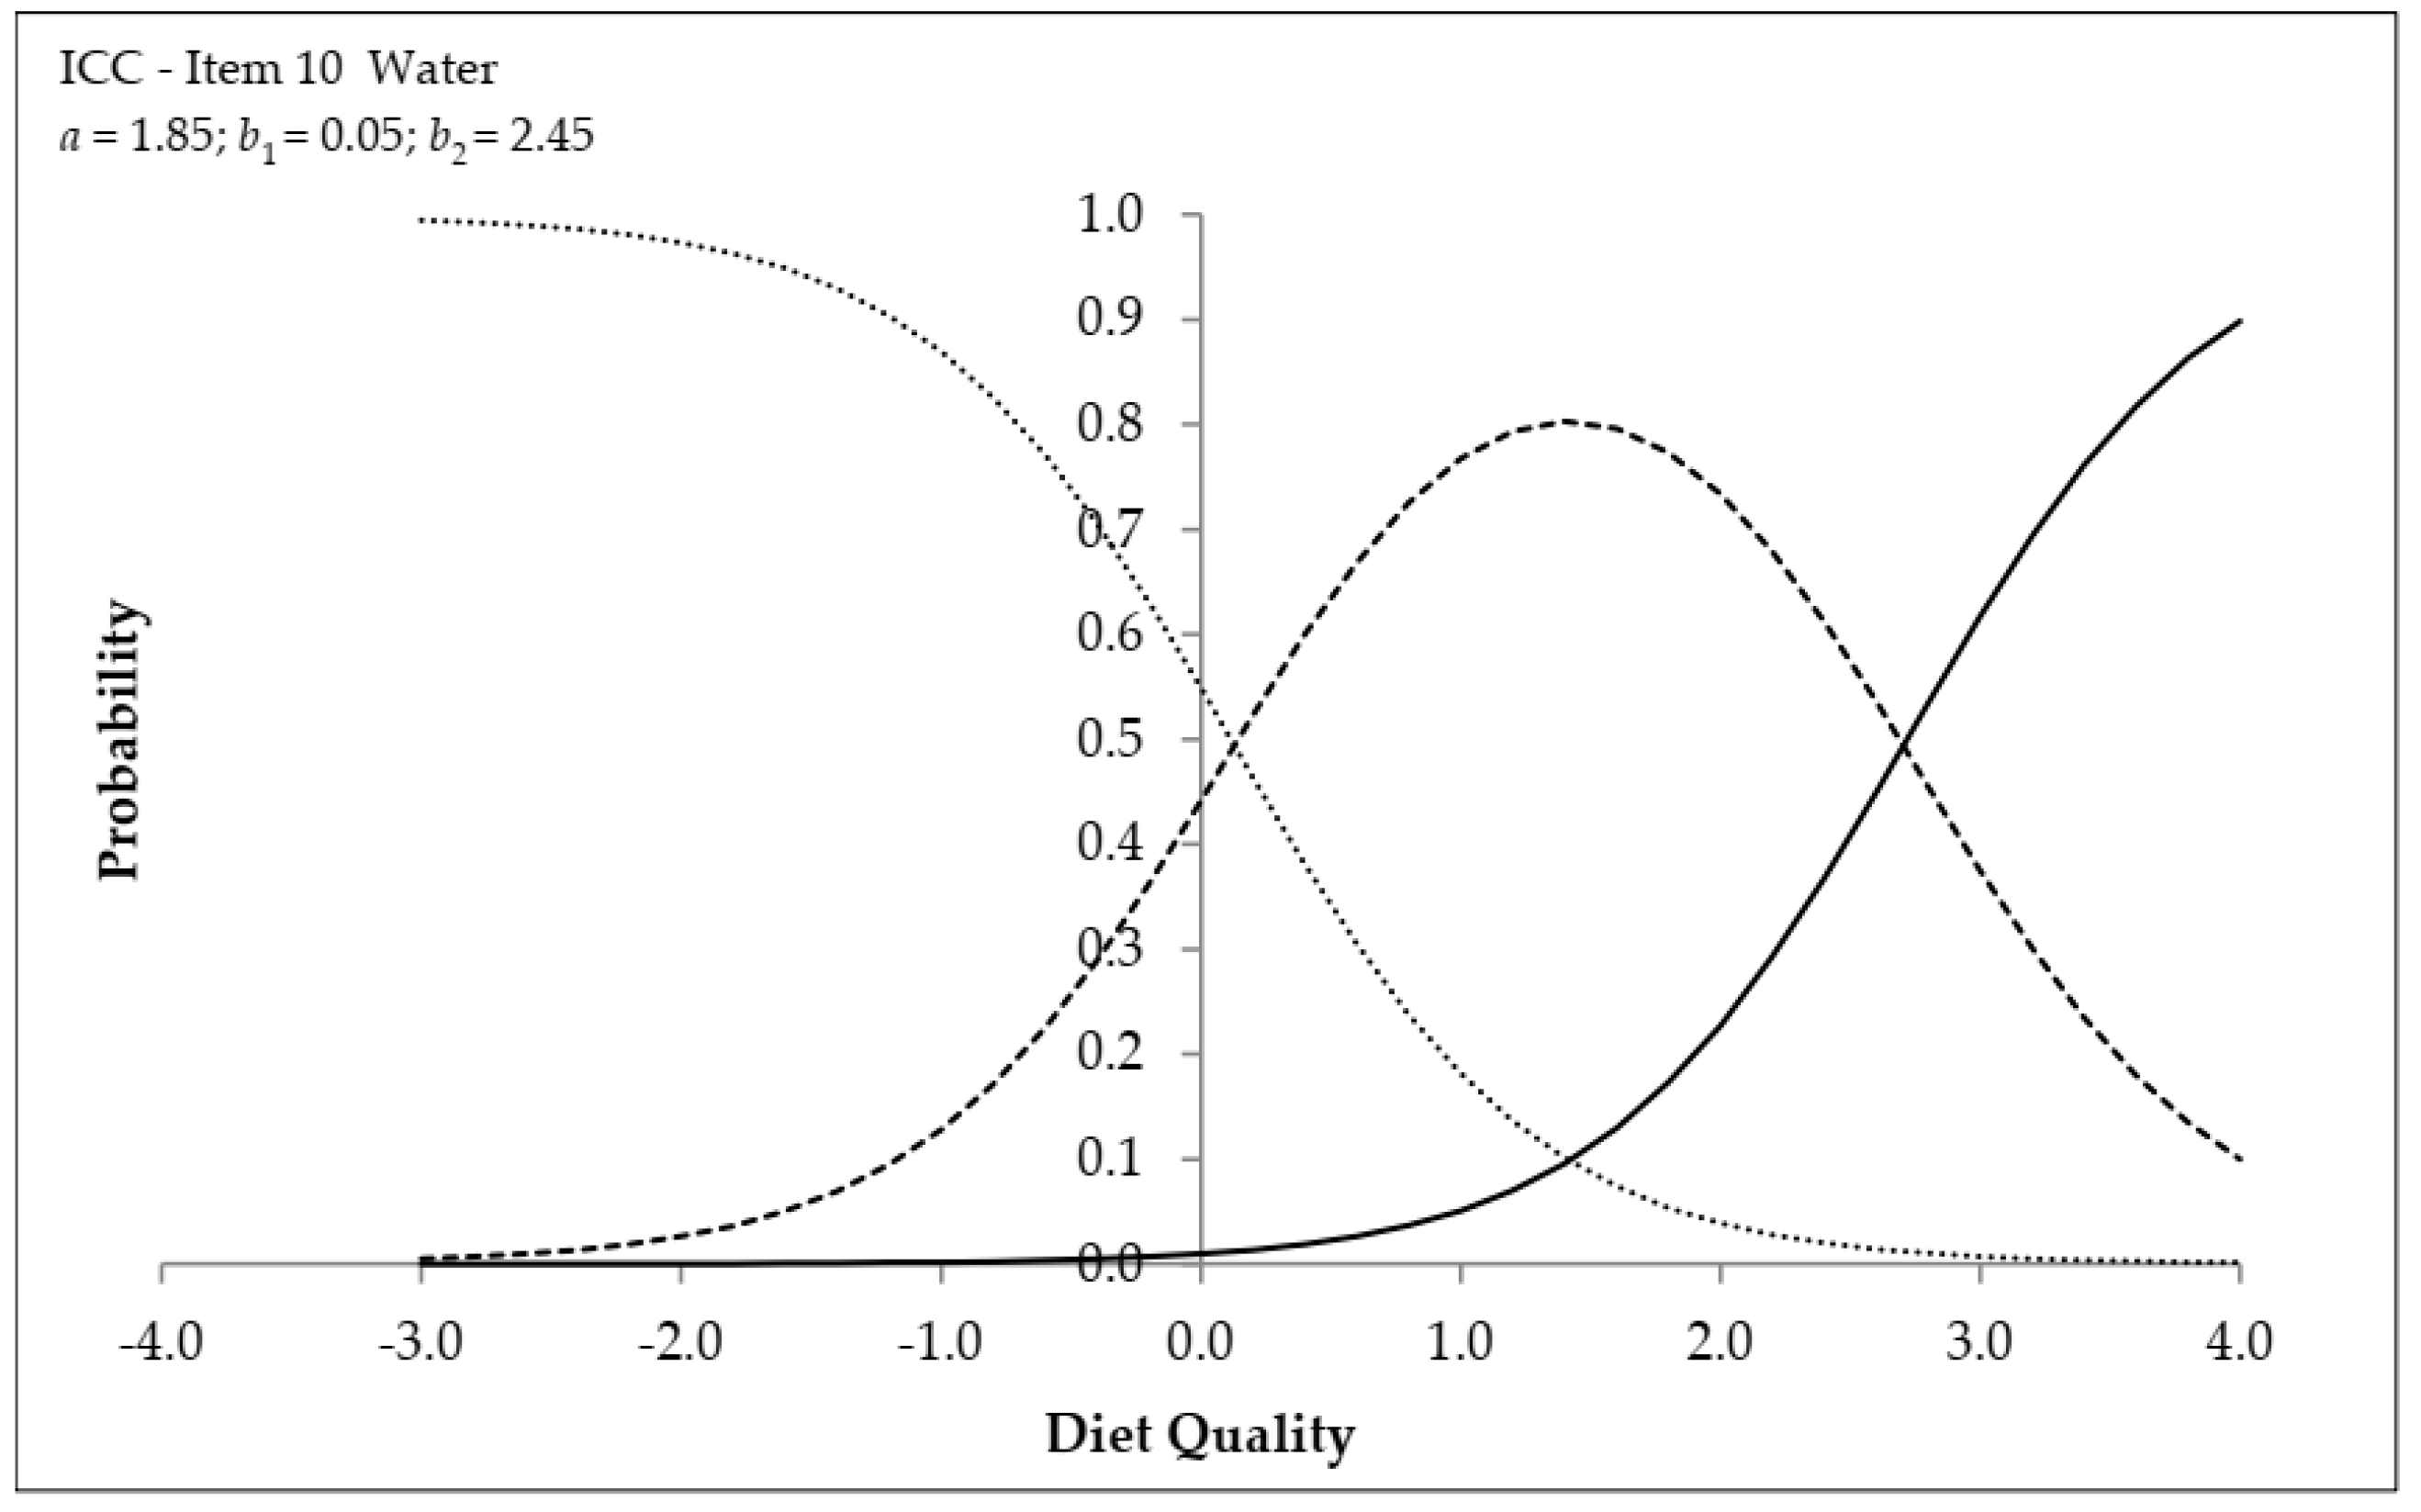
| 10. Water | 1.85 | 0.48 | 0.05 | 0.11 | 2.45 | 0.47 |
| Levels of Diet Quality | |||||||||||||||
|---|---|---|---|---|---|---|---|---|---|---|---|---|---|---|---|
| Very Poor | Poor | Reasonable | Good | Very Good | |||||||||||
| 70 | 75 | 80 | 85 | 90 | 95 | 100 | 105 | 110 | 115 | 120 | 125 | 130 | 135 | 140 | 145 |
| C1 | D1 | B1 | F1 | V1 | USF2 | C2 | D2 | V2 | F2 | ||||||
| M1 | SD1 | SSS2 | SD2 | W2 | |||||||||||
| SSS1 | W1 | ||||||||||||||
| USF1 | M2 | ||||||||||||||
| B2 | |||||||||||||||
| Diet Quality | Description |
|---|---|
| Level 1: Very Poor θ < 95 | Unhealthy foods are consumed ≥2 times/day, whereas healthy foods are not consumed (lower category), except cereals, pasta, breads, roots, and tubers 1–4 or ≥7 times/day (intermediate category) |
| Level 2: Poor 95 ≤ θ < 105 | Unhealthy foods are still consumed, but some at a lower frequency: ultraprocessed sugary foods and ultraprocessed savoury snacks and sausages are consumed 1 time/day (intermediate category). The consumption of cereals, pasta, breads, roots, and tubers remains in the intermediate category. Dairy products are consumed 1–2 or ≥4 times/day, and meat, fish, and eggs, ≥3 times/day (intermediate categories). Some schoolchildren consume beans ≥3 times/day (intermediate category) |
| Level 3: Reasonable 105 ≤ θ < 115 | The consumption of cereals, pasta, breads, roots, and tubers and dairy products still occurs at a frequency below or above the recommended (intermediate category). The consumption of other healthy foods begins in the intermediate category: fruits, 1–2 times/day and water, 1–4 times/day. Beans and meat, fish, and eggs are consumed 1–2 times/day (higher category). The consumption of sugary drinks is limited to 1 time/day (intermediate category), but that of ultraprocessed sugary foods and ultraprocessed savoury snacks and sausages remains in the intermediate category (1 time/day). |
| Level 4: Good 115 ≤ θ < 130 | All healthy foods are consumed at the higher category (beans and meat, fish, and eggs) or intermediate category (cereals, pasta, breads, roots, and tubers; dairy products; fruits; water; and vegetables and leafy greens). Unhealthy foods (ultraprocessed sugary foods and ultraprocessed savoury snacks and sausages) are no longer consumed, and some children do not consume sugary drinks. |
| Level 5: Very Good θ ≥ 130 | Unhealthy foods (ultraprocessed sugary foods, ultraprocessed savoury snacks and sausages, and sugary drinks) are not consumed. The consumption of dairy products (3 times/day) and water (5–6 times/day) is increased to the higher category. Other healthy foods are consumed at the recommended frequency (higher category: cereals, pasta, breads, roots, and tubers; beans; and meat, fish, and eggs) or close to the recommended level (intermediate category: fruits and vegetables and leafy greens). Some children consume fruits and vegetables and leafy greens ≥3 times/day (higher category). |
| Survey Year | Schoolchildren’s Diet Quality Scale | p * | ||||
|---|---|---|---|---|---|---|
| Very Poor | Poor | Reasonable | Good | Very good | ||
| 2013 (n 1934) | 20.8 (2.5) | 40.2 (2.7) | 28.8 (2.7) | 9.8 (1.8) | 0.4 (0.4) | 0.2666 |
| 2014 (n 1980) | 23.7 (2.9) | 41.3 (3.5) | 26.8 (2.5) | 8.0 (1.8) | 0.3 (0.2) | |
| 2015 (n 2409) | 20.9 (3.9) | 38.1 (3.5) | 30.9 (3.1) | 9.6 (2.0) | 0.4 (0.4) | |
| Family income (R$) | ||||||
| 1º tertile (n 2221) | 19.2 (2.7) | 40.7 (3.1) | 30.0 (2.4) | 9.9 (1.7) | 0.2 (0.1) | 0.1221 |
| 2º tertile (n 2067) | 23.0 (3.5) | 39.8 (3.5) | 28.4 (2.9) | 8.2 (1.6) | 0.6 (0.6) | |
| 3º tertile (n 2035) | 24.3 (2.4) | 38.4 (3.1) | 27.6 (3.1) | 9.3 (2.0) | 0.3 (0.4) | |
Publisher’s Note: MDPI stays neutral with regard to jurisdictional claims in published maps and institutional affiliations. |
© 2021 by the authors. Licensee MDPI, Basel, Switzerland. This article is an open access article distributed under the terms and conditions of the Creative Commons Attribution (CC BY) license (https://creativecommons.org/licenses/by/4.0/).
Share and Cite
Giacomelli, S.d.C.; de Assis, M.A.A.; de Andrade, D.F.; Schmitt, J.; Hinnig, P.d.F.; Borgatto, A.F.; Engel, R.; Vieira, F.G.K.; Fiates, G.M.R.; Di Pietro, P.F. Development of a Food-Based Diet Quality Scale for Brazilian Schoolchildren Using Item Response Theory. Nutrients 2021, 13, 3175. https://doi.org/10.3390/nu13093175
Giacomelli SdC, de Assis MAA, de Andrade DF, Schmitt J, Hinnig PdF, Borgatto AF, Engel R, Vieira FGK, Fiates GMR, Di Pietro PF. Development of a Food-Based Diet Quality Scale for Brazilian Schoolchildren Using Item Response Theory. Nutrients. 2021; 13(9):3175. https://doi.org/10.3390/nu13093175
Chicago/Turabian StyleGiacomelli, Simone de C., Maria Alice A. de Assis, Dalton F. de Andrade, Jeovani Schmitt, Patrícia de F. Hinnig, Adriano F. Borgatto, Raquel Engel, Francilene G. K. Vieira, Giovanna M. R. Fiates, and Patricia F. Di Pietro. 2021. "Development of a Food-Based Diet Quality Scale for Brazilian Schoolchildren Using Item Response Theory" Nutrients 13, no. 9: 3175. https://doi.org/10.3390/nu13093175