Somatotropic Axis and Obesity: Is There Any Role for the Mediterranean Diet?


 ,
, 

Abstract
:1. Introduction
2. Materials and Methods
2.1. Design and Setting
2.2. Population Study
2.3. Dietary Assessment
2.4. Anthropometric Measurements
2.5. Laboratory Test
2.6. Bioelectrical Impedance Analysis
2.7. Visceral Adiposity Index
2.8. Fatty Liver Index
2.9. Criteria to Define Metabolic Syndrome
2.10. Statistical Methods
3. Results
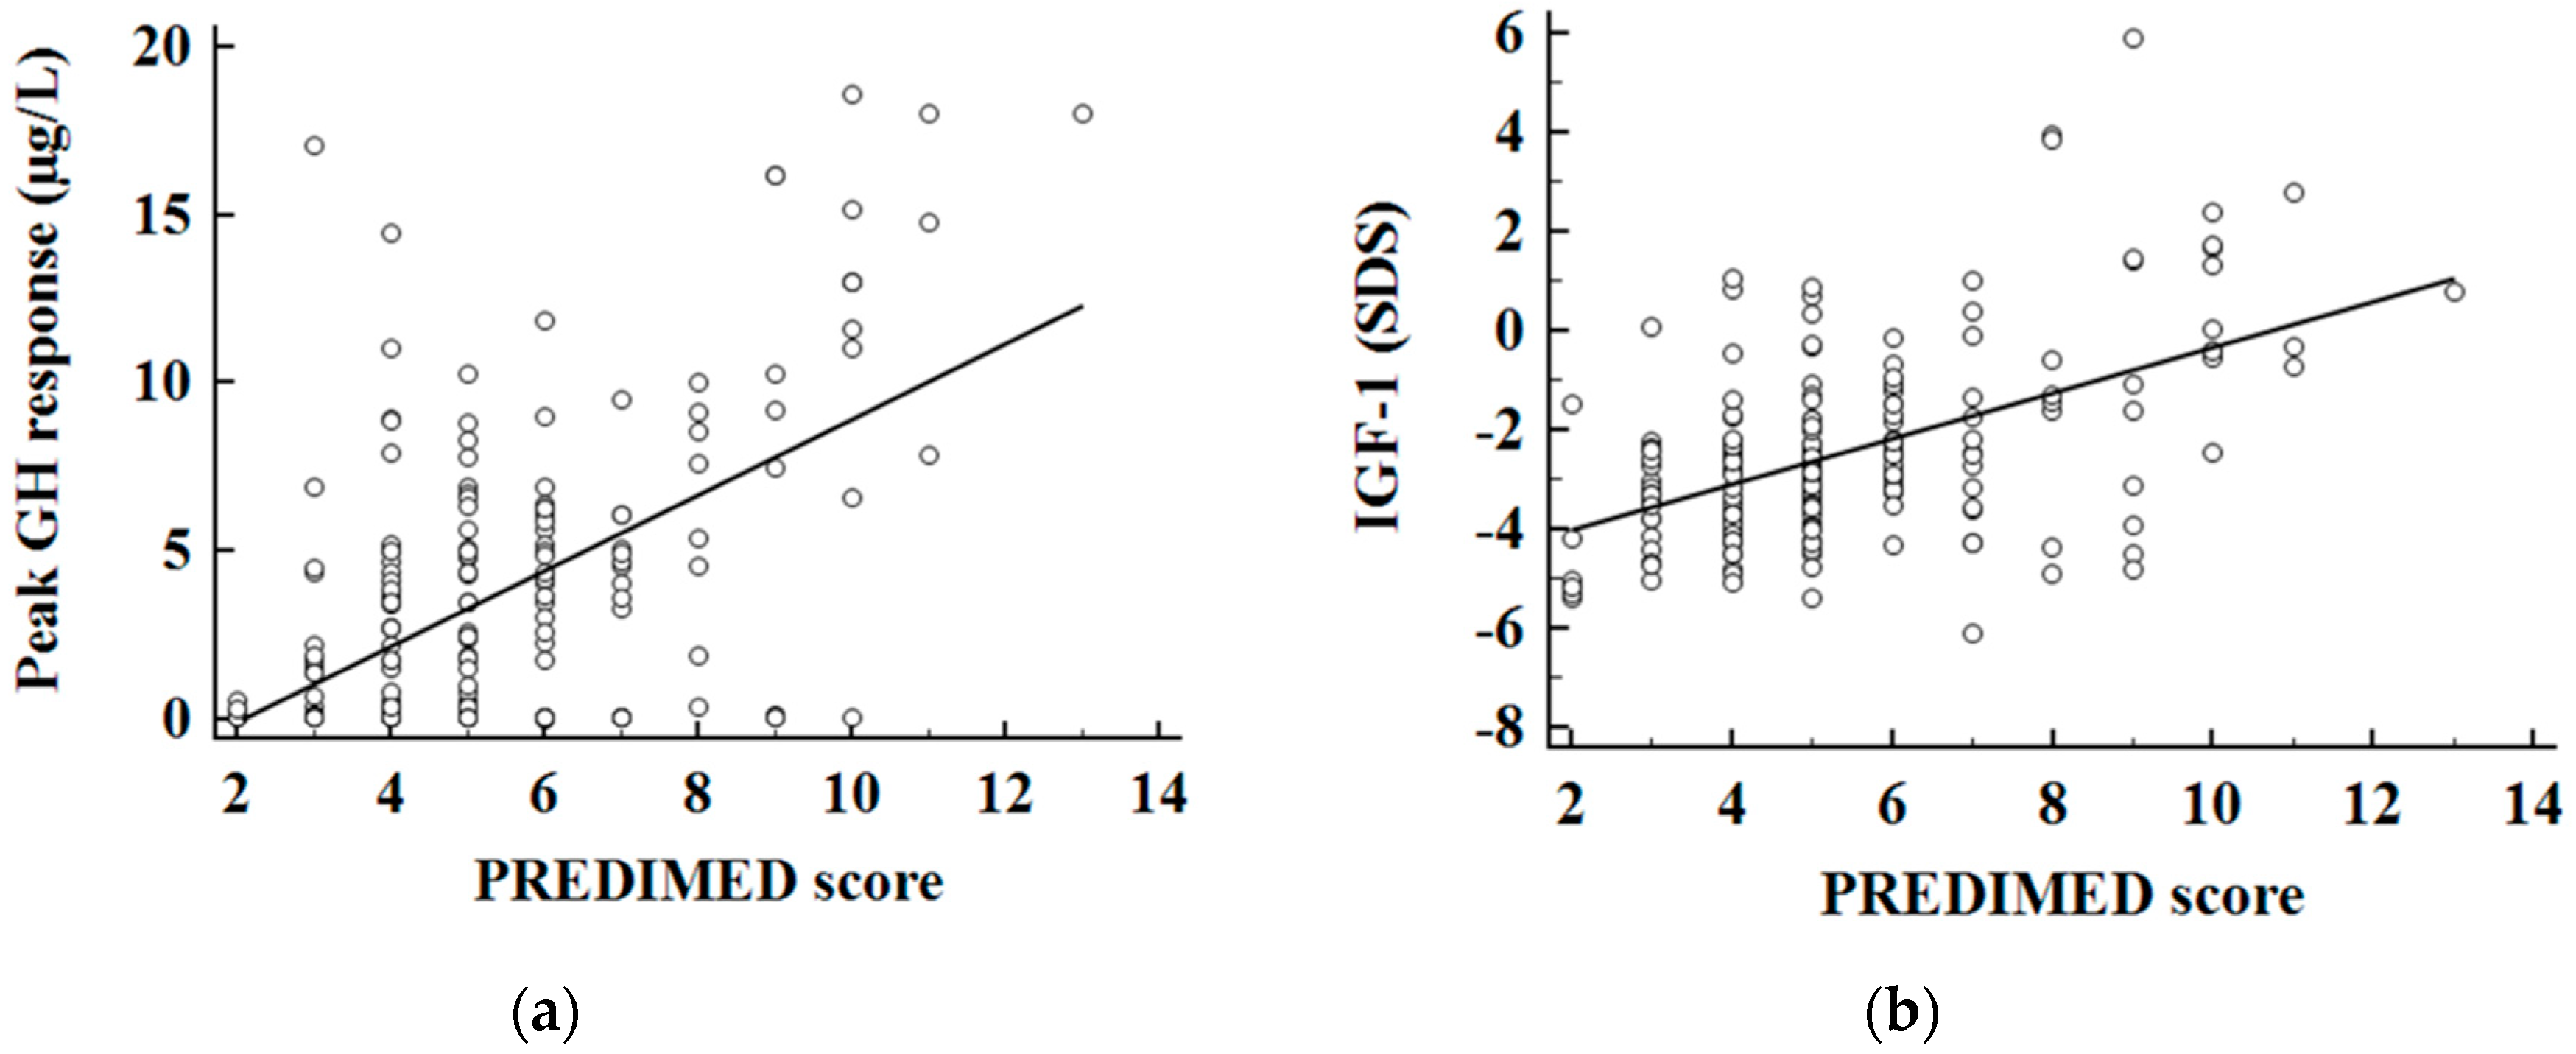
Correlation Studies
4. Discussion
5. Conclusions
Author Contributions
Funding
Conflicts of Interest
Abbreviations
| GH | Growth hormone |
| IGF-I | Insulin-like growth factor I |
| GHD | Growth hormone deficiency |
| BMI | Body mass index |
| BIA | Bioelectrical impedance analysis |
| FLI | Fatty liver index |
| VAI | Visceral adiposity index |
| NAFLD | Non-alcoholic fatty liver disease |
| PhA | Phase angle |
| FM | Fat mass |
| FFM | Free fat mass |
References
- Di Somma, C.; Pivonello, R. Prevalence of the metabolic syndrome in moderately-severely people with obesity with and without growth hormone deficiency. J. Endocrinol. Investig. 2010, 33, 171–177. [Google Scholar] [CrossRef] [PubMed]
- Makimura, H.; Stanley, T. The effects of central adiposity on growth hormone (GH) response to GH-releasing hormone-arginine stimulation testing in men. J. Clin. Endocrinol. Metab. 2008, 93, 4254–4260. [Google Scholar] [CrossRef] [PubMed]
- Berryman, D.E.; Glad, C.A. The GH/IGF-1 axis in obesity: Pathophysiology and therapeutic considerations. Nat. Rev. Endocrinol. 2013, 9, 346–356. [Google Scholar] [CrossRef] [PubMed]
- Utz, A.L.; Yamamoto, A. Growth hormone deficiency by growth hormone releasing hormone-arginine testing criteria predicts increased cardiovascular risk markers in normal young overweight and obese women. J. Clin. Endocrinol. Metab. 2008, 93, 2507–2514. [Google Scholar] [CrossRef]
- Makimura, H.; Stanley, T. Reduced growth hormone secretion is associated with increased carotid intima-media thickness in obesity. J. Clin. Endocrinol. Metab. 2009, 94, 5131–5138. [Google Scholar] [CrossRef] [PubMed]
- Makimura, H.; Feldpausch, M.N. Reduced growth hormone secretion in obesity is associated with smaller LDL and HDL particle size. Clin. Endocrinol. (Oxf.) 2012, 76, 220–227. [Google Scholar] [CrossRef] [PubMed]
- Savastano, S.; Di Somma, C. Growth hormone status in morbidly people with obesity and correlation with body composition. J. Endocrinol. Investig. 2006, 29, 536–543. [Google Scholar] [CrossRef]
- Skrypnik, D.; Bogdański, P. Role of gestational weight gain, gestational diabetes, breastfeeding, and hypertension in mother-to-child obesity transmission. Pol. Arch. Intern. Med. 2019, 129, 267–275. [Google Scholar] [CrossRef] [Green Version]
- Skrypnik, D.; Bogdański, P. Influence of endurance and endurance-strength training on mineral status in women with abdominal obesity: A randomized trial. Medicine (Baltim.) 2019, 98, e14909. [Google Scholar] [CrossRef]
- Cordido, F.; Peino, R. Impaired growth hormone secretion in people with obesity is partially reversed by acipimox-mediated plasma free fatty acid depression. J. Clin. Endocrinol. Metab. 1996, 81, 914–918. [Google Scholar]
- Vijayakumar, A.; Yakar, S. The intricate role of growth hormone in metabolism. Front. Endocrinol. (Lausanne) 2011, 2, 32. [Google Scholar] [CrossRef] [PubMed]
- Barrea, L.; Di Somma, C. Influence of nutrition on somatotropic axis: Milk consumption in adult individuals with moderate-severe obesity. Clin. Nutr. 2017, 36, 293–301. [Google Scholar] [CrossRef] [PubMed]
- Holmes, M.D.; Pollak, M.N. Dietary correlates of plasma insulin-like growth factor I and insulin-like growth factor binding protein 3 concentrations. Cancer Epidemiol. Biomark. Prev. 2002, 11, 852–861. [Google Scholar]
- Hoppe, C.; Udam, T.R. Animal protein intake, serum insulin-like growth factor I, and growth in healthy 2.5-y-old Danish children. Am. J. Clin. Nutr. 2004, 80, 447–452. [Google Scholar] [CrossRef] [PubMed]
- Hoppe, C.; Molgaard, C. High intakes of skimmed milk, but not meat, increase serum IGF-I and IGFBP-3 in eight-year-old boys. Eur. J. Clin. Nutr. 2004, 58, 1211–1216. [Google Scholar] [CrossRef] [PubMed]
- Szulińska, M.; Skrypnik, D. Effects of Endurance and Endurance-strength Exercise on Renal Function in Abdominally Obese Women with Renal Hyperfiltration: A Prospective Randomized Trial. Biomed. Environ. Sci. 2016, 29, 706–712. [Google Scholar]
- Welch, A.A.; McTaggart, A. DINER (Data into Nutrients for Epidemiological Research)—A new data-entry program for nutritional analysis in the EPIC-Norfolk cohort and the 7-day diary method. Public Health Nutr. 2001, 4, 1253–1265. [Google Scholar] [CrossRef] [PubMed]
- Escola-Gil, J.C.; Calpe-Berdiel, L. Moderate beer consumption does not change early or mature atherosclerosis in mice. Nutr. J. 2004, 3, 1. [Google Scholar] [CrossRef]
- Terapia Alimentare Dietosystem® DS-Medica. Available online: http://www.dsmedica.info (accessed on 21 July 2019).
- Muscogiuri, G.; Barrea, L. Patient empowerment and the Mediterranean diet as a possible tool to tackle prediabetes associated with overweight or obesity: A pilot study. Hormones (Athens) 2019, 18, 75–84. [Google Scholar] [CrossRef]
- Barrea, L.; Annunziata, G. Trimethylamine N-oxide, Mediterranean diet, and nutrition in healthy, normal-weight adults: Also a matter of sex? Nutrition 2018, 62, 7–17. [Google Scholar] [CrossRef]
- Barrea, L.; Fabbrocini, G. Role of Nutrition and Adherence to the Mediterranean Diet in the Multidisciplinary Approach of Hidradenitis Suppurativa: Evaluation of Nutritional Status and Its Association with Severity of Disease. Nutrients 2019, 11, 57. [Google Scholar] [CrossRef] [PubMed]
- Barrea, L.; Annunziata, G. Trimethylamine-N-oxide (TMAO) as Novel Potential Biomarker of Early Predictors of Metabolic Syndrome. Nutrients 2018, 10, 1971. [Google Scholar] [CrossRef] [PubMed]
- Barrea, L.; Muscogiuri, G. Coffee consumption, metabolic syndrome and clinical severity of psoriasis: Good or bad stuff? Arch. Toxicol. 2018, 92, 1831–1845. [Google Scholar] [CrossRef] [PubMed]
- Barrea, L.; Macchia, P.E. Nutrition: A key environmental dietary factor in clinical severity and cardio-metabolic risk in psoriatic male patients evaluated by 7-day food-frequency questionnaire. J. Transl. Med. 2015, 13, 303. [Google Scholar] [CrossRef] [PubMed]
- Martinez-Gonzalez, M.A.; Garcia-Arellano, A. A 14-item Mediterranean diet assessment tool and obesity indexes among high-risk subjects: The PREDIMED trial. PLoS ONE 2012, 7, e43134. [Google Scholar] [CrossRef] [PubMed]
- Barrea, L.; Muscogiuri, G. Association between Mediterranean diet and hand grip strength in older adult women. Clin. Nutr. 2019, 38, 721–729. [Google Scholar] [CrossRef]
- Barrea, L.; Tarantino, G. Adherence to the Mediterranean Diet and Circulating Levels of Sirtuin 4 in Obese Patients: A Novel Association. Oxid. Med. Cell. Longev. 2017, 2017, 6101254. [Google Scholar] [CrossRef]
- Savanelli, M.C.; Barrea, L. Preliminary results demonstrating the impact of Mediterranean diet on bone health. J. Transl. Med. 2017, 15, 81. [Google Scholar] [CrossRef]
- Barrea, L.; Muscogiuri, G. Mediterranean Diet and Phase Angle in a Sample of Adult Population: Results of a Pilot Study. Nutrients 2017, 9, 151. [Google Scholar] [CrossRef]
- Barrea, L.; Balato, N. Nutrition and psoriasis: Is there any association between the severity of the disease and adherence to the Mediterranean diet? J. Transl. Med. 2015, 13, 18. [Google Scholar] [CrossRef]
- Ghigo, E.; Aimaretti, G. New approach to the diagnosis of growth hormone deficiency in adults. Eur. J. Endocrinol. 1996, 134, 352–356. [Google Scholar] [CrossRef] [PubMed]
- Corneli, G.; Di Somma, C. The cut-off limits of the GH response to GH-releasing hormone-arginine test related to body mass index. Eur. J. Endocrinol. 2005, 153, 257–264. [Google Scholar] [CrossRef] [PubMed]
- Colao, A.; Di Somma, C. Relationships between serum IGF1 levels, blood pressure, and glucose tolerance: An observational, exploratory study in 404 subjects. Eur. J. Endocrinol. 2008, 159, 389–397. [Google Scholar] [CrossRef] [PubMed]
- Bioelectrical impedance analysis in body composition measurement: National Institutes of Health Technology Assessment Conference Statement. Am. J. Clin. Nutr. 1996, 64, 524S–532S. [CrossRef] [PubMed]
- Barrea, L.; Macchia, P.E. Bioelectrical phase angle and psoriasis: A novel association with psoriasis severity, quality of life and metabolic syndrome. J. Transl. Med. 2016, 14, 130. [Google Scholar] [CrossRef] [PubMed]
- Barrea, L.; Altieri, B. Impact of Nutritional Status on Gastroenteropancreatic Neuroendocrine Tumors (GEP-NET) Aggressiveness. Nutrients 2018, 10, 1854. [Google Scholar] [CrossRef] [PubMed]
- Kyle, U.G.; Bosaeus, I. Bioelectrical impedance analysis-part II: Utilization in clinical practice. Clin. Nutr. 2004, 23, 1430–1453. [Google Scholar] [CrossRef]
- Kushner, R.F. Bioelectrical impedance analysis: A review of principles and applications. J. Am. Coll. Nutr. 1992, 11, 199–209. [Google Scholar]
- Amato, M.C.; Giordano, C. Visceral Adiposity Index: A reliable indicator of visceral fat function associated with cardiometabolic risk. Diabetes Care 2010, 33, 920–922. [Google Scholar] [CrossRef]
- Bedogni, G.; Bellentani, S. The Fatty Liver Index: A simple and accurate predictor of hepatic steatosis in the general population. BMC Gastroenterol. 2006, 6, 33. [Google Scholar] [CrossRef]
- Savastano, S.; Di Somma, C. The complex relationship between obesity and the somatropic axis: The long and winding road. Growth Horm. IGF Res. 2014, 24, 221–226. [Google Scholar] [CrossRef] [PubMed]
- Attallah, H.; Friedlander, A.L. Visceral obesity, impaired glucose tolerance, metabolic syndrome, and growth hormone therapy. Growth Horm. IGF Res. 2006, 16 (Suppl. A), S62–S67. [Google Scholar] [CrossRef]
- Hong, J.W.; Kim, J.Y. Metabolic parameters and nonalcoholic fatty liver disease in hypopituitary men. Horm. Metab. Res. 2011, 43, 48–54. [Google Scholar] [CrossRef] [PubMed]
- Ichikawa, T.; Hamasaki, K. Non-alcoholic steatohepatitis and hepatic steatosis in patients with adult onset growth hormone deficiency. Gut 2003, 52, 914. [Google Scholar] [CrossRef]
- Nyenwe, E.A.; Williamson-Baddorf, S. Nonalcoholic Fatty liver disease and metabolic syndrome in hypopituitary patients. Am. J. Med. Sci. 2009, 338, 190–195. [Google Scholar] [CrossRef] [PubMed]
- Tai, T.S.; Lin, S.Y. Metabolic effects of growth hormone therapy in an Alstrom syndrome patient. Horm. Res. 2003, 60, 297–301. [Google Scholar] [CrossRef] [PubMed]
- Takano, S.; Kanzaki, S. Effect of growth hormone on fatty liver in panhypopituitarism. Arch. Dis. Child. 1997, 76, 537–538. [Google Scholar] [CrossRef] [PubMed]
- Takahashi, Y.; Iida, K. Growth hormone reverses nonalcoholic steatohepatitis in a patient with adult growth hormone deficiency. Gastroenterology 2007, 132, 938–943. [Google Scholar] [CrossRef] [PubMed]
- Isokuortti, E.; Zhou, Y. Use of HOMA-IR to diagnose non-alcoholic fatty liver disease: A population-based and inter-laboratory study. Diabetologia 2017, 60, 1873–1882. [Google Scholar] [CrossRef] [PubMed]
- Reaven, G.M. Banting lecture 1988. Role of insulin resistance in human disease. Diabetes 1988, 37, 1595–1607. [Google Scholar] [CrossRef] [PubMed]
- Van der Klaauw, A.A.; Biermasz, N.R. The prevalence of the metabolic syndrome is increased in patients with GH deficiency, irrespective of long-term substitution with recombinant human GH. Eur. J. Endocrinol. 2007, 156, 455–462. [Google Scholar] [CrossRef] [PubMed]
- Attanasio, A.F.; Mo, D. Prevalence of metabolic syndrome in adult hypopituitary growth hormone (GH)-deficient patients before and after GH replacement. J. Clin. Endocrinol. Metab. 2010, 95, 74–81. [Google Scholar] [CrossRef] [PubMed]
- Norman, K.; Stobaus, N. Bioelectrical phase angle and impedance vector analysis—Clinical relevance and applicability of impedance parameters. Clin. Nutr. 2012, 31, 854–861. [Google Scholar] [CrossRef] [PubMed]
- Stobaus, N.; Pirlich, M. Determinants of bioelectrical phase angle in disease. Br. J. Nutr. 2012, 107, 1217–1220. [Google Scholar] [CrossRef] [PubMed]
- Kyle, U.G.; Soundar, E.P. Can phase angle determined by bioelectrical impedance analysis assess nutritional risk? A comparison between healthy and hospitalized subjects. Clin. Nutr. 2012, 31, 875–881. [Google Scholar] [CrossRef] [PubMed]
- Siddiqui, N.I.; Khan, S.A. Anthropometric Predictors of Bio-Impedance Analysis (BIA) Phase Angle in Healthy Adults. J. Clin. Diagn. Res. 2016, 10, CC01–CC04. [Google Scholar] [CrossRef] [PubMed]
- Barbosa-Silva, M.C.; Barros, A.J. Bioelectrical impedance analysis: Population reference values for phase angle by age and sex. Am. J. Clin. Nutr. 2005, 82, 49–52. [Google Scholar] [CrossRef]
- Piccoli, A.; Rossi, B. A new method for monitoring body fluid variation by bioimpedance analysis: The RXc graph. Kidney Int. 1994, 46, 534–539. [Google Scholar] [CrossRef] [Green Version]
- Chertow, G.M.; Lowrie, E.G. Nutritional assessment with bioelectrical impedance analysis in maintenance hemodialysis patients. J. Am. Soc. Nephrol. 1995, 6, 75–81. [Google Scholar]
- Abdu, T.A.; Neary, R. Coronary risk in growth hormone deficient hypopituitary adults: Increased predicted risk is due largely to lipid profile abnormalities. Clin. Endocrinol. (Oxf.) 2001, 55, 209–216. [Google Scholar] [CrossRef]
- Gazzaruso, C.; Gola, M. Cardiovascular risk in adult patients with growth hormone (GH) deficiency and following substitution with GH—An update. J. Clin. Endocrinol. Metab. 2014, 99, 18–29. [Google Scholar] [CrossRef] [PubMed]
- Di Somma, C.; Scarano, E. Cardiovascular alterations in adult GH deficiency. Best Pract. Res. Clin. Endocrinol. Metab. 2017, 31, 25–34. [Google Scholar] [CrossRef] [PubMed] [Green Version]


| Parameters | Mean ± SD |
|---|---|
| Age (years) | 36.98 ± 11.10 |
| BMI (kg/m2) | 45.19 ± 6.30 |
| Grade II obesity | 41, 20.5% |
| Grade III obesity | 159, 79.5% |
| Waist circumference (cm) | 126.74 ± 17.05 |
| SBP (mmHg) | 126.89±15.29 |
| DBP (mmHg) | 80.68 ± 10.84 |
| GH peak response (µg/L) | 3.72 ± 4.29 |
| GH deficit 1 | 123, 61.5% |
| IGF-1 (µg/L) | 151.93 ± 64.93 |
| IGF-1 (SDS) | −2.43 ± 1.85 |
| IGF-1(SDS) deficiency 2 | 142, 71.0% |
| Fasting glucose (mg/dL) | 105.27 ± 36.79 |
| Fasting insulin (µU/mL) | 19.95 ± 11.76 |
| Total cholesterol (mg/dL) | 187.36 ± 47.88 |
| HDL cholesterol (mg/dL) | 50.17 ± 11.94 |
| LDL cholesterol (mg/dL) | 106.54 ± 49.96 |
| Fasting triglycerides (mg/mL) | 151.95 ± 53.10 |
| AST (U/L) | 30.15 ± 16.44 |
| ALT (U/L) | 41.70 ± 30.21 |
| γGT (U/L) | 41.37 ± 25.38 |
| CRP (ng/mL) | 2.33 ± 1.01 |
| HoMA-IR | 6.04 ± 6.55 |
| >Cut-off | 155, 77.5% |
| VAI | 1.86 ± 0.94 |
| >Cut-off | 57, 28.5% |
| FLI | 96.43 ± 6.79 |
| >Cut-off | 197, 98.5% |
| Metabolic syndrome (presence) | 88, 44.0% |
| Parameters | Blunted GH Peak 1 n = 123, 61.5% | Normal GH Peak 2 n = 77, 35.8% | p-Value | IGF-1 Deficiency 3 n = 142 (71.0%) | IGF-1 Sufficiency 4 n = 58 (29.0%) | p-Value |
|---|---|---|---|---|---|---|
| BMI (kg/m2) | 47.47 ± 6.05 | 41.54 ± 4.84 | <0.001 | 46.61 ± 6.06 | 41.70 ± 5.53 | <0.001 |
| Waist circumference (cm) | 132.11 ± 16.33 | 118.18 ± 14.60 | <0.001 | 129.98 ± 16.09 | 118.83 ± 16.88 | <0.001 |
| SBP (mmHg) | 130.83 ± 15.41 | 120.58 ± 12.87 | <0.001 | 129.19 ± 15.17 | 121.24 ± 14.21 | 0.001 |
| DBP (mmHg) | 83.33 ± 9.32 | 76.45 ± 11.77 | <0.001 | 82.16 ± 10.02 | 77.05 ± 11.94 | 0.002 |
| GH peak response (µg/L) | - | - | - | 2.14 ± 2.78 | 7.59 ± 4.88 | <0.001 |
| IGF-1 (µg/L) | 120.94 ± 44.41 | 201.45 ± 61.91 | <0.001 | - | - | - |
| IGF-1 (SDS) | −3.26 ± 1.12 | −1.11 ± 2.04 | <0.001 | - | - | - |
| Fasting Glucose (mg/dL) | 115.00 ± 40.41 | 89.73 ± 22.94 | <0.001 | 111.67 ± 39.12 | 89.66 ± 24.32 | <0.001 |
| Fasting Insulin (µU/mL) | 24.47 ± 11.59 | 12.73 ± 7.77 | <0.001 | 22.50 ± 11.52 | 13.71 ± 9.93 | <0.001 |
| Total cholesterol (mg/dL) | 195.06 ± 48.20 | 175.08 ± 45.00 | 0.004 | 192.02 ± 47.82 | 175.97 ± 46.49 | 0.031 |
| HDL cholesterol (mg/dL) | 48.09 ± 11.41 | 53.47 ± 12.10 | 0.002 | 48.59 ± 11.57 | 54.00 ± 12.07 | 0.004 |
| LDL cholesterol (mg/dL) | 114.55 ± 50.28 | 93.77 ± 47.00 | 0.004 | 111.39 ± 49.88 | 94.68 ± 48.55 | 0.031 |
| Fasting Triglycerides (mg/dL) | 159.94 ± 53.09 | 139.19 ± 50.89 | 0.007 | 158.30 ± 52.05 | 136.37 ± 52.87 | 0.008 |
| AST (U/L) | 31.17 ± 16.64 | 28.52 ± 16.08 | 0.268 | 30.25 ± 16.36 | 29.91 ± 16.77 | 0.897 |
| ALT (U/L) | 41.54 ± 32.53 | 41.96 ± 26.27 | 0.919 | 41.56 ± 31.25 | 42.03 ± 27.75 | 0.921 |
| γGT (U/L) | 42.26 ± 22.50 | 37.14 ± 19.31 | 0.089 | 42.34 ± 21.61 | 35.28 ± 20.27 | 0.030 |
| CRP (ng/mL) | 2.46 ± 1.02 | 2.12 ± 0.96 | 0.019 | 2.47 ± 1.00 | 1.98 ± 0.95 | 0.002 |
| HoMA-IR | 7.81 ± 7.07 | 3.20 ± 4.36 | <0.001 | 7.08 ± 6.83 | 3.49 ± 5.02 | <0.001 |
| VAI | 2.06 ± 1.01 | 1.55 ± 0.69 | <0.001 | 2.00 ± 0.96 | 1.50 ± 0.75 | <0.001 |
| FLI | 98.23 ± 3.04 | 93.45 ± 9.61 | <0.001 | 97.98 ± 3.18 | 92.64 ± 10.75 | <0.001 |
| Presence of Metabolic Syndrome (n, %) | 75, 61.0% | 13, 16.9% | <0.001 | 75, 52.8% | 13, 22.4% | <0.001 |
| Questions PREDIMED Questionnaire | Blunted GH Peak 1 n = 123, (61.5%) | Normal GH Peak 2 n = 77, (35.8%) | χ2, p-Value | IGF-1 Deficiency 3 n = 142, (71.0%) | IGF-1 Sufficiency 4 n = 58, (29.0%) | χ2, p-Value |
|---|---|---|---|---|---|---|
| EVOO as main culinary lipid | 57, 46.3% | 54, 70.1% | 9.71, 0.002 | 75, 52.8% | 36, 62.1% | 1.08, 0.299 |
| EVOO >4 tablespoons | 27, 22.0% | 22, 28.6% | 0.79, 0.373 | 32, 22.5% | 17, 29.3% | 0.069, 0.407 |
| Vegetables ≥2 servings/day | 34, 27.6% | 32, 41.6% | 3.54, 0.059 | 41, 28.9% | 25, 43.1% | 3.16, 0.076 |
| Fruits ≥3 servings/day | 32, 26.0% | 48, 62.3% | 24.53, <0.001 | 46, 32.4% | 34, 58.6% | 10.73, 0.011 |
| Red/processed meats <1/day | 54, 43.9% | 43, 55.8% | 2.25, 0.134 | 65, 45.8% | 32, 55.2% | 1.10, 0.293 |
| Butter, cream, margarine <1/day | 52, 42.3% | 26, 33.8% | 1.11, 0.293 | 56, 39.4% | 22, 37.9% | 0.01, 0.969 |
| Soda drinks <1/day | 39, 31.7% | 30, 39.0% | 0.81, 0.369 | 40, 28.2% | 29, 50.0% | 7.75, 0.001 |
| Wine glasses ≥7/week | 33, 26.8% | 21, 27.3% | 0.01, 0.925 | 37, 26.1% | 17, 29.3% | 0.09, 0.768 |
| Legumes ≥3/week | 56, 45.5% | 47, 61.0% | 3.96, 0.046 | 70, 49.3% | 33, 56.9% | 0.67, 0.412 |
| Fish/seafood ≥3/week | 20, 16.3% | 45, 58.4% | 36.51, <0.001 | 9, 6.3% | 26, 96.6% | 148.69, <0.001 |
| Commercial sweets and confectionery ≤2/week | 50, 40.7% | 39, 50.6% | 1.54, 0.216 | 55, 38.7% | 34, 58.6% | 5.82, 0.016 |
| Tree nuts ≥3/week | 16, 13.0% | 15, 19.5% | 1.06, 0.303 | 20, 14.1% | 11, 19.0% | 0.42, 0.516 |
| Poultry more than red meats | 51, 41.5% | 39, 50.6% | 1.27, 0.261 | 63, 44.4% | 27, 46.6% | 0.02, 0.900 |
| Use of sofrito sauce ≥2/week | 61, 49.6% | 38, 49.4% | 0.01, 0.911 | 69, 48.6% | 30, 51.7% | 0.06, 0.806 |
| PREDIMED categories | ||||||
| Low adherence to the Mediterranean Diet | 95, 77.2% | 32, 41.6% | 24.49, <0.001 | 107, 75.4 | 20, 34.5% | 27.94, <0.001 |
| Average adherence to the Mediterranean Diet | 27, 22.0% | 33, 42.9% | 8.89, 0.001 | 34, 23.9 | 26, 44.8% | 7.59, 0.006 |
| High adherence to the Mediterranean Diet | 1, 0.8% | 12, 15.6% | 14.66, 0.001 | 1, 0.7 | 12, 20.7% | 23.88, <0.001 |
| Parameters | Blunted GH Peak 1 n = 123, 61.5% | Normal GH Peak 2 n = 77, 35.8% | p-Value | IGF-1 Deficiency 3 n = 142 (71.0%) | IGF-1 Sufficiency 4 n = 58 (29.0%) | p-Value |
|---|---|---|---|---|---|---|
| Dietary assessment | ||||||
| Total energy (kcal) | 2838.97 ± 253.89 | 2783.68 ± 255.47 | 0.136 | 2830.21 ± 250.61 | 2787.00 ± 266.11 | 0.278 |
| Protein (gr of total kcal) | 112.92 ± 14.36 | 127.90 ± 17.98 | <0.001 | 112.32 ± 13.33 | 134.27 ± 16.47 | <0.001 |
| Carbohydrate (gr of total kcal) | 388.99 ± 38.27 | 376.01 ± 36.34 | 0.018 | 388.58 ± 37.19 | 372.78 ± 37.87 | 0.007 |
| Fat (gr of total kcal) | 92.36 ± 10.46 | 85.34 ± 9.84 | <0.001 | 91.84 ± 10.72 | 84.31 ± 8.89 | <0.001 |
| BIA parameters | ||||||
| R (Ω) | 489.47 ± 95.91 | 471.45 ± 80.07 | 0.153 | 488.16 ± 93.22 | 471.56 ± 79.74 | 0.296 |
| Xc (Ω) | 42.20 ± 8.49 | 43.82 ± 7.89 | 0.180 | 42.15 ± 8.13 | 44.73 ± 8.82 | 0.082 |
| PhA (°) | 4.95 ± 0.49 | 5.35 ± 0.70 | <0.001 | 4.97 ± 0.50 | 5.45 ± 0.79 | <0.001 |
| FM (kg) | 68.05 ± 16.24 | 49.98 ± 12.02 | <0.001 | 68.37 ± 16.61 | 45.83 ± 10.15 | <0.001 |
| FM (%) | 53.30 ± 6.71 | 46.73 ± 6.70 | <0.001 | 53.38 ± 6.70 | 45.21 ± 6.49 | <0.001 |
| FFM (kg) | 58.29 ± 8.03 | 55.99 ± 7.37 | 0.041 | 58.41 ± 7.87 | 54.92 ± 7.73 | 0.014 |
| FFM (%) | 46.69 ± 6.71 | 53.28 ± 6.73 | <0.001 | 46.62 ± 6.71 | 54.81 ± 6.54 | <0.001 |
| Skeletal muscle mass (kg) | 29.77 ± 7.12 | 32.52 ± 7.54 | 0.011 | 29.88 ± 7.20 | 33.01 ± 8.08 | 0.020 |
| Skeletal muscle mass (%) | 23.96 ± 6.38 | 31.34 ± 8.97 | <0.001 | 24.01 ± 6.50 | 33.37 ± 9.68 | <0.001 |
| TBW (Lt) | 42.72 ± 5.85 | 40.99 ± 5.39 | 0.035 | 42.75 ± 5.76 | 40.19 ± 5.66 | 0.014 |
| TBW (%) | 34.18 ± 4.90 | 39.00 ± 4.93 | <0.001 | 34.13 ± 4.90 | 40.12 ± 4.79 | <0.001 |
| ICW (Lt) | 20.87 ± 3.35 | 20.87 ± 3.48 | 0.980 | 20.91 ± 3.32 | 20.67 ± 3.71 | 0.708 |
| ICW (%) | 48.77 ± 2.81 | 50.83 ± 3.65 | <0.001 | 48.83 ± 2.87 | 51.33 ± 4.15 | <0.001 |
| ECW (Lt) | 21.86 ± 2.95 | 20.11 ± 2.69 | <0.001 | 21.83 ± 2.93 | 19.52 ± 2.88 | 0.001 |
| ECW (%) | 51.23 ± 2.81 | 49.17 ± 3.65 | <0.001 | 51.17 ± 2.87 | 48.67 ± 4.15 | 0.001 |
| BCMI | 8.34 ± 2.36 | 9.69 ± 2.68 | <0.001 | 8.37 ± 2.39 | 10.00 ± 2.86 | 0.001 |
| GH peak Response (µg/L) | IGF-1 (SDS) | |||
|---|---|---|---|---|
| Parameters | r | p Value | r | p Value |
| Age (years) | 0.158 | 0.026 | 0.315 | <0.001 |
| BMI (kg/m2) | −0.548 | <0.001 | −0.369 | <0.001 |
| Waist circumference (cm) | −0.484 | <0.001 | −0.331 | <0.001 |
| SBP (mmHg) | −0.354 | <0.001 | −0.261 | <0.001 |
| DBP (mmHg) | −0.315 | <0.001 | −0.303 | <0.001 |
| Fasting glucose (mg/dL) | −0.381 | <0.001 | −0.284 | 0.001 |
| Fasting insulin (µU/mL) | −0.521 | <0.001 | −0.338 | <0.001 |
| Total cholesterol (mg/dL) | −0.239 | 0.001 | −0.228 | 0.001 |
| HDL cholesterol (mg/dL) | 0.292 | <0.001 | 0.273 | <0.001 |
| LDL cholesterol (mg/dL) | −0.265 | <0.001 | −0.246 | <0.001 |
| Fasting triglycerides (mg/dL) | −0.138 | 0.050 | −0.143 | 0.043 |
| AST (U/L) | 0.026 | 0.714 | 0.055 | 0.443 |
| ALT (U/L) | −0.050 | 0.479 | 0.026 | 0.711 |
| γGT (U/L) | −0.134 | 0.050 | −0.191 | 0.007 |
| CRP (ng/mL) | −0.163 | 0.021 | −0.206 | 0.003 |
| HoMA−IR | −0.378 | <0.001 | −0.253 | <0.001 |
| VAI | −0.236 | 0.001 | −0.217 | 0.002 |
| FLI | −0.592 | <0.001 | −0.495 | <0.001 |
| Metabolic syndrome (n, %) | −0.332 | <0.001 | −0.255 | <0.001 |
| GH peak Response (µg/L) | IGF-1 (SDS) | |||
|---|---|---|---|---|
| Parameters | r | p-Value | R | p-Value |
| Dietary assessment | ||||
| Total energy (kcal) | −0.100 | 0.158 | −0.017 | 0.806 |
| Protein (gr of total kcal) | 0.536 | <0.001 | 0.761 | <0.001 |
| Carbohydrate (gr of total kcal) | −0.237 | 0.001 | −0.169 | 0.017 |
| Fat (gr of total kcal) | −0.277 | <0.001 | −0.329 | <0.001 |
| BIA parameters | ||||
| R (Ω) | −0.109 | 0.123 | −0.023 | 0.750 |
| Xc (Ω) | 0.120 | 0.090 | 0.155 | 0.029 |
| PhA (°) | 0.392 | <0.001 | 0.280 | <0.001 |
| FM (kg) | −0.585 | <0.001 | −0.409 | <0.001 |
| FM (%) | −0.528 | <0.001 | −0.328 | <0.001 |
| FFM (kg) | −0.155 | 0.029 | 0.203 | 0.004 |
| FFM (%) | 0.529 | <0.001 | 0.329 | <0.001 |
| Skeletal muscle mass (kg) | 0.251 | <0.001 | 0.111 | 0.120 |
| Skeletal muscle mass (%) | 0.565 | <0.001 | 0.368 | <0.001 |
| TBW (Lt) | −0.161 | 0.024 | −0.200 | 0.005 |
| TBW (%) | 0.529 | <0.001 | 0.330 | <0.001 |
| ICW (Lt) | 0.016 | 0.818 | −0.063 | 0.378 |
| ICW (%) | 0.368 | <0.001 | 0.265 | <0.001 |
| ECW (Lt) | −0.328 | <0.001 | −0.313 | <0.001 |
| ECW (%) | −0.368 | <0.001 | −0.265 | <0.001 |
| BCMI | 0.333 | <0.001 | 0.202 | 0.004 |
| GH peak Response (µg/L) n = 200 | IGF-1 (SDS) n = 200 | |||||||
|---|---|---|---|---|---|---|---|---|
| Parameters | OR | p Value | 95% IC | R2 adj | OR | p Value | 95% IC | R2 adj |
| EVOO as main culinary lipid | 1.12 | 0.003 | 1.04–1.21 | 0.05 | 1.19 | 0.037 | 1.01–1.40 | 0.02 |
| EVOO oil >4 tablespoons | 1.08 | 0.030 | 1.00–1.16 | 0.02 | 1.14 | 0.001 | 0.096–1.35 | 0.01 |
| Vegetables ≥2 servings/day | 1.07 | 0.035 | 1.00–1.15 | 0.02 | 1.31 | 0.002 | 1.10–1.54 | 0.05 |
| Fruits ≥ 3servings/day | 1.22 | <0.001 | 1.12–133 | 0.13 | 1.36 | <0.001 | 1.15–1.62 | 0.07 |
| Red/processed meats <1/day | 1.06 | 0.062 | 0.99–1.14 | 0.02 | 1.07 | 0.394 | 0.09–1.24 | 0.01 |
| Butter, cream, margarine <1/day | 1.01 | 0.753 | 0.95–1.07 | 0.01 | 1.07 | 0.420 | 0.91–1.24 | 0.01 |
| Soda drinks <1/day | 1.09 | 0.014 | 1.02–1.16 | 0.03 | 1.19 | 0.035 | 1.01–1.38 | 0.02 |
| Wine glasses ≥7/week | 0.98 | 0.946 | 0.93–1.07 | 0.01 | 0.99 | 0.863 | 0.83–1.16 | 0.01 |
| Legumes ≥3/week | 1.07 | 0.049 | 1.00–1.15 | 0.02 | 1.16 | 0.066 | 0.99–1.35 | 0.02 |
| Fish/seafood ≥3/week | 1.36 | <0.001 | 1.23–1.51 | 0.24 | 6.98 | <0.001 | 3.83–12.73 | 0.48 |
| Commercial sweets and confectionery ≤2/week | 1.11 | 0.002 | 1.04–1.19 | 0.05 | 1.22 | 0.013 | 1.04–1.44 | 0.03 |
| Tree nuts ≥3/week | 1.08 | 0.049 | 1.00–1.17 | 0.02 | 0.17 | 0.092 | 0.97–1.41 | 0.01 |
| Poultry more than red meats | 1.05 | 0.089 | 0.99–1.13 | 0.01 | 1.17 | 0.042 | 1.00–1.37 | 0.02 |
| Use of sofrito sauce ≥2/week | 1.01 | 0.716 | 0.095–1.08 | 0.01 | 0.09 | 0.087 | 0.085–1.15 | 0.01 |
| PREDIMED categories | ||||||||
| Low adherence to the Mediterranean Diet | 0.81 | <0.001 | 0.75–0.88 | 0.15 | 0.61 | <0.001 | 0.50–0.75 | 0.14 |
| Average adherence to the Mediterranean Diet | 1.06 | 0.046 | 0.99–1.14 | 0.02 | 1.23 | 0.014 | 1.04–1.44 | 0.03 |
| High adherence to the Mediterranean Diet | 1.47 | <0.001 | 1.26–1.69 | 0.19 | 1.96 | <0.001 | 1.45–2.63 | 0.12 |
| Parameters | Multiple Regression Analysis | |||
|---|---|---|---|---|
| Model 1 | R2 | β | t | pvalue |
| PREDIMED score | 0.297 | 0.548 | 9.22 | <0.001 |
| Protein (gr of total kcal) | 0.398 | 0.362 | 5.86 | <0.001 |
| Variables excluded: EVOO, vegetables, fruits, soda drinks, legumes, fish/seafood, commercial sweets and confectionery, tree nuts, carbohydrates and fat. | ||||
| Model 2 | ||||
| FLI | 0.347 | −0.592 | −10.34 | <0.001 |
| FM | 0.453 | −0.382 | −6.22 | <0.001 |
| PhA (°) | 0.479 | 0.181 | 3.30 | <0.001 |
| Variables excluded: HoMA-IR, VAI, metabolic syndrome, and other parameters of the BIA | ||||
© 2019 by the authors. Licensee MDPI, Basel, Switzerland. This article is an open access article distributed under the terms and conditions of the Creative Commons Attribution (CC BY) license (http://creativecommons.org/licenses/by/4.0/).
Share and Cite
Muscogiuri, G.; Barrea, L.; Laudisio, D.; Di Somma, C.; Pugliese, G.; Salzano, C.; Colao, A.; Savastano, S. Somatotropic Axis and Obesity: Is There Any Role for the Mediterranean Diet? Nutrients 2019, 11, 2228. https://doi.org/10.3390/nu11092228
Muscogiuri G, Barrea L, Laudisio D, Di Somma C, Pugliese G, Salzano C, Colao A, Savastano S. Somatotropic Axis and Obesity: Is There Any Role for the Mediterranean Diet? Nutrients. 2019; 11(9):2228. https://doi.org/10.3390/nu11092228
Chicago/Turabian StyleMuscogiuri, Giovanna, Luigi Barrea, Daniela Laudisio, Carolina Di Somma, Gabriella Pugliese, Ciro Salzano, Annamaria Colao, and Silvia Savastano. 2019. "Somatotropic Axis and Obesity: Is There Any Role for the Mediterranean Diet?" Nutrients 11, no. 9: 2228. https://doi.org/10.3390/nu11092228