Article

An Evaluation of the Sodium Content and Compliance with the National Sodium Reduction Targets among Packaged Foods Sold in Costa Rica in 2015 and 2018

by
Jaritza Vega-Solano
1,
Adriana Blanco-Metzler
1,*,
Karla Francela Benavides-Aguilar
1 and
JoAnne Arcand
2
1
Costa Rican Institute of Research and Teaching in Nutrition and Health (INCIENSA), Tres Ríos Box 4-2250, Costa Rica
2
Faculty of Health Sciences, Ontario Tech University (University of Ontario Institute of Technology), 2000 Simcoe St N, Oshawa, ON L1H 7K4, Canada
*
Author to whom correspondence should be addressed.
Nutrients 2019, 11(9), 2226; https://doi.org/10.3390/nu11092226
Submission received: 1 August 2019 / Revised: 27 August 2019 / Accepted: 9 September 2019 / Published: 15 September 2019
(This article belongs to the Special Issue Advances in Dietary Sodium Research to Improve Human Health)

Abstract

:
High blood pressure is a leading cause of death in Costa Rica, with an estimated mortality rate of 30%. The average household sodium intake is two times higher than the World Health Organization recommendation. The consumption of processed foods is an important and growing contributor to sodium intake. The objective of this study was to describe the sodium content of packaged foods (mg/100 g) sold in Costa Rica in 2015 (n = 1158) and 2018 (n = 1016) and to assess their compliance with the national sodium reduction targets. All 6 categories with national targets were analyzed: condiments, cookies and biscuits, bread products, processed meats, bakery products, and sauces. A significant reduction in mean sodium content was found in only 3 of the 19 subcategories (cakes, tomato-based sauces, and tomato paste). No subcategories had statistically significant increases in mean sodium levels, but seasonings for sides/mains, ham, and sausage categories were at least 15% higher in sodium. Compliance with the national sodium targets among all foods increased from 80% in 2015 to 87% in 2018. The results demonstrate that it is feasible to reduce the sodium content in packaged foods in Costa Rica, but more work is needed to continually support a gradual reduction of sodium in packaged foods, including more stringent sodium targets.

1. Introduction

Excess dietary sodium causes high blood pressure (HBP) and is associated with an increased risk of hypertension and cardiovascular disease (CVD) in both men and women [1,2]. CVDs are the primary cause of death globally, resulting in over 15 million deaths in 2015 [3,4], with HBP as the main risk factor [5,6]. Since the 1970s, HBP has been the leading cause of death in Costa Rica, with an estimated mortality rate of 30% [7]. In 2014, the prevalence of HBP in Costa Rica was 36.2%, in adults >19 years of age, exceeding 60% in those >65 years [8]. In 2012, the cost of healthcare for HBP represented 3.47% of Costa Rica’s Social Security expense alone [9].
The Household Budget Survey (HBS) administered in Costa Rica during the periods of 2004–2005 and 2012–2013 found that the population sodium intakes are an estimated 3900 and 4600 mg/person/day, respectively. These levels far exceed the dietary sodium recommendations by the World Health Organization (WHO) of 2000 mg per day (5 g of salt per day) [10,11]. Dietary sources of sodium in Costa Rica are common salt (60%) and packaged food and condiments (27%), with the remainder coming from foods that naturally contain sodium; however, there is a substantive increasing trend in the amount of dietary sodium derived from packaged foods [10].
To address these health and dietary challenges, dietary sodium reduction has become a public health priority. Sodium reduction initatives are recognized by the World Health Organization and Pan American Health Organization (PAHO/WHO) as cost-effective, “best-buy” interventions that have significant potential to impact HBP and CVD outcomes [12,13]. Therefore, worldwide, numerous countries have implemented national sodium reduction strategies [14]. These strategies usually include multiple components, such as the development of sodium reduction targets for packaged and/or restaurant foods, consumer education, front-of-pack nutritional labeling schemes, warning labels, taxes for high sodium foods, and interventions and standards for foods served in public institutions, among others [15,16,17,18,19].
In 2010, the Costa Rican Ministry of Health committed to implementing the “Cardiovascular Disease Prevention Initiative through the Reduction of Salt Intake in the Americas,” launched in 2009 by PAHO/WHO, with a goal of gradually reducing sodium to 2000 mg/person/day sodium by 2020 [16]. In 2011, the “National Plan for Salt/Sodium Intake Reduction in Costa Rica’s Population 2011-2021” was created [20], and in 2013 the “National Program for Salt/Sodium Intake Reduction in Costa Rica’s Population" was declared of public and national interest [21]. Subsequently, a goal to reduce sodium intake by 15% and to reduce the prevalence of HBP by 25% was established as part the “National Strategy for the Integral Approach to Chronic Non-Communicable Disease and Obesity, 2013–2021,” under the National Plan [22]. A key component of this plan is to reduce sodium in the food supply, as an impactful strategy to support the Costa Rican population in achieving the dietary sodium recommendations.
Food supply interventions to reduce population sodium intake requires monitoring and surveillance. Having data on the sodium content of packaged food sold in Costa Rica also allows for the creation of national reduction targets to promote reformulation.
In 2013, the health and food industry sectors in Costa Rica began negotiations that led to the execution of the first public–private partnership between the Ministry of Health and the Costa Rican Chamber of Food Industry. This partnership sought to join efforts and work together in the implementation of strategies to reduce the sodium content of packaged and restaurant foods [23]. In 2016, national voluntary sodium reduction targets were established for six categories and twenty-three subcategories of packaged food that contributed the greatest amounts of sodium to the Costa Rican diet. These targets were voluntary from March 2016 to January 2018 [23]. However, it is unknown if changes in the sodium content of packaged foods have occurred during this period of time. Therefore, the objective of this study was to describe the changes in the sodium content in packaged foods sold in Costa Rica in 2015 and 2018 and to assess their compliance with the national sodium reduction targets.

2. Materials and Methods

2.1. Study Design

This study is an analysis of two cross-sectional databases containing food label information on of packaged food sold in 2015 and 2018. The databases contained data on foods that were systematically collected from a large supermarket chains in the Greater Metropolitan Area of the country [24,25]. Data were collected from one supermarket in 2015 and two supermarkets in 2018.

2.2. Data Collection

A team of two researchers collected data between June and December 2015 and between January and August 2018. In 2015, collection was carried out through a smartphone application developed by the George Institute for Global Health of Australia [26,27]. In 2018, data were collected with the FLIP-LAC system (Food Label Information Program for Latin America and the Caribbean), developed by the Department of Nutritional Sciences from the University of Toronto and adopted and validated in an International Development Research Centre of Canada-funded research project (#108167) [28]. Regardless of the data capturing software, the sampling framework and procedures were consistent during the two time periods. In both surveys, the barcode of all packaged products was scanned (excluding alcoholic beverages). Photos of all sides of the package were taken to capture required information such as name, brand, ingredients list, serving size, and nutritional information per serving and/or 100 g or 100 mL. In both years, only the information from medium-sized packages was included for analysis. Where foods required nutrition information to be presented “as consumed”, the Institute of Central America and Panama (INCAP) nutrient database was used to create recipes [29]. Food categories that contained items requiring recipes were bouillon cubes and powders and cakes. Quality assurance measures were executed to ensure accuracy and consistency of the data and food classifications.

2.3. Food Classification and Data Analysis

This study captured data on all foods that within food categories and subcategories that aligned with the national sodium reduction targets. Included foods had the sodium content reported on the nutritional label. The list of categories and subcategories with their respective baseline and national target is shown in Table S1. All 6 categories and 19 out of 23 subcategories with national targets were analyzed. The “bread with cheese” and “semi-sweet bread” categories were excluded, because these products are not considered packaged food according to Costa Rican legislation and many do not carry nutrition labels [30,31]. In the bakery category, the “fermented dough without filling” and “unfermented dough” subcategories were excluded because a list of ingredients was not available on the package to verify their subclassification.
The average, median, standard deviation, minimum, and maximum amount of sodium per 100 g of food in each food category and subcategory were determined. A comparison of the mean sodium content between 2015 and 2018 was assessed using an unpaired t-test. The prevalence of compliance with the national sodium targets for each food subcategory was calculated. Categorical data are presented as frequency and percentages. Continuous data are presented as means and standard deviations. A p-value < 0.05 was considered statistically significant. Data were analyzed with SPSS version 21 (IBM Corp, Chicago, IL, USA).

3. Results

In 2015 and 2018, information on 1158 and 1016 food products, respectively, was collected. Most foods packages contained nutritional labeling information 76% (880 products) in 2015 and 87% (884 products) in 2018. Finally, only products that included information on sodium as part of the nutrition labels were included in the analysis: 724 foods (82%) in 2015 and 791 foods (89%) in 2018. In 2015 and 2018, cookies and biscuits was the food category with the highest number of products that contained labelling on sodium (n = 332 and n = 355, respectively), followed by sauces (n = 129 and n = 150), bakery (n = 79 and n = 58), bread products (n = 69 and n = 90), processed meats (n = 60 and n = 79), and condiments (n = 55 and n = 57) (Table 1). In all categories, a higher number of products were available 2018 compared to 2015.

3.1. Sodium Content by Category and Subcategory of Packaged Food from 2015 to 2018

The condiments subcategories had the highest average sodium content, with up to 19,044 mg/100 g as observed with bouillon cubes and powders. The bread subcategories had the lowest sodium content, with sweet and whole grain breads containing 166 and 291 mg/100 g, respectively (Table 1).
On examination of the distribution of sodium levels between 2015 and 2018, 16% of food categories had statistically significant decreases in sodium; thus, 84% had no significant changes in sodium. Statistically significant changes from 2015 to 2018 occurred in tomato-based sauces (mean ± SD, mg/100 g; 920 ± 1030 to 462 ± 265; 50% reduction, p = 0.000), tomate paste (417 ± 187 to 231 ± 190; 45% reduction, p = 0.007), and cakes (452 ± 272 to 341 ± 240; 25% reduction, p = 0.012). Median sodium levels showed declining trend in most subcategories.
A high degree of variability in the sodium content within the food categories and subcategories was observed in both years. In particular, the highest variance was observed among meat and fish seasonings, dry salted crackers, English sauce, and tomato sauce. Extreme values were found in most subcategories (Table 1). A lower variability in sodium levels was observed in 2018, compared to 2015, for some categories such as bread and sauces. Variation in the condiments and cookies and biscuits sub categories remained similar between 2015 and 2018, and there was greater homogeneity (Table 1). Variability was similar in subcategories with the lowest number of food products (condiments for side and other main dishes, filled salted crackers, sweet bread, salchichón, and mortadella) in both years, except for the salchichón subcategory, where the limits increased widely due to a small sample size (Table 1).

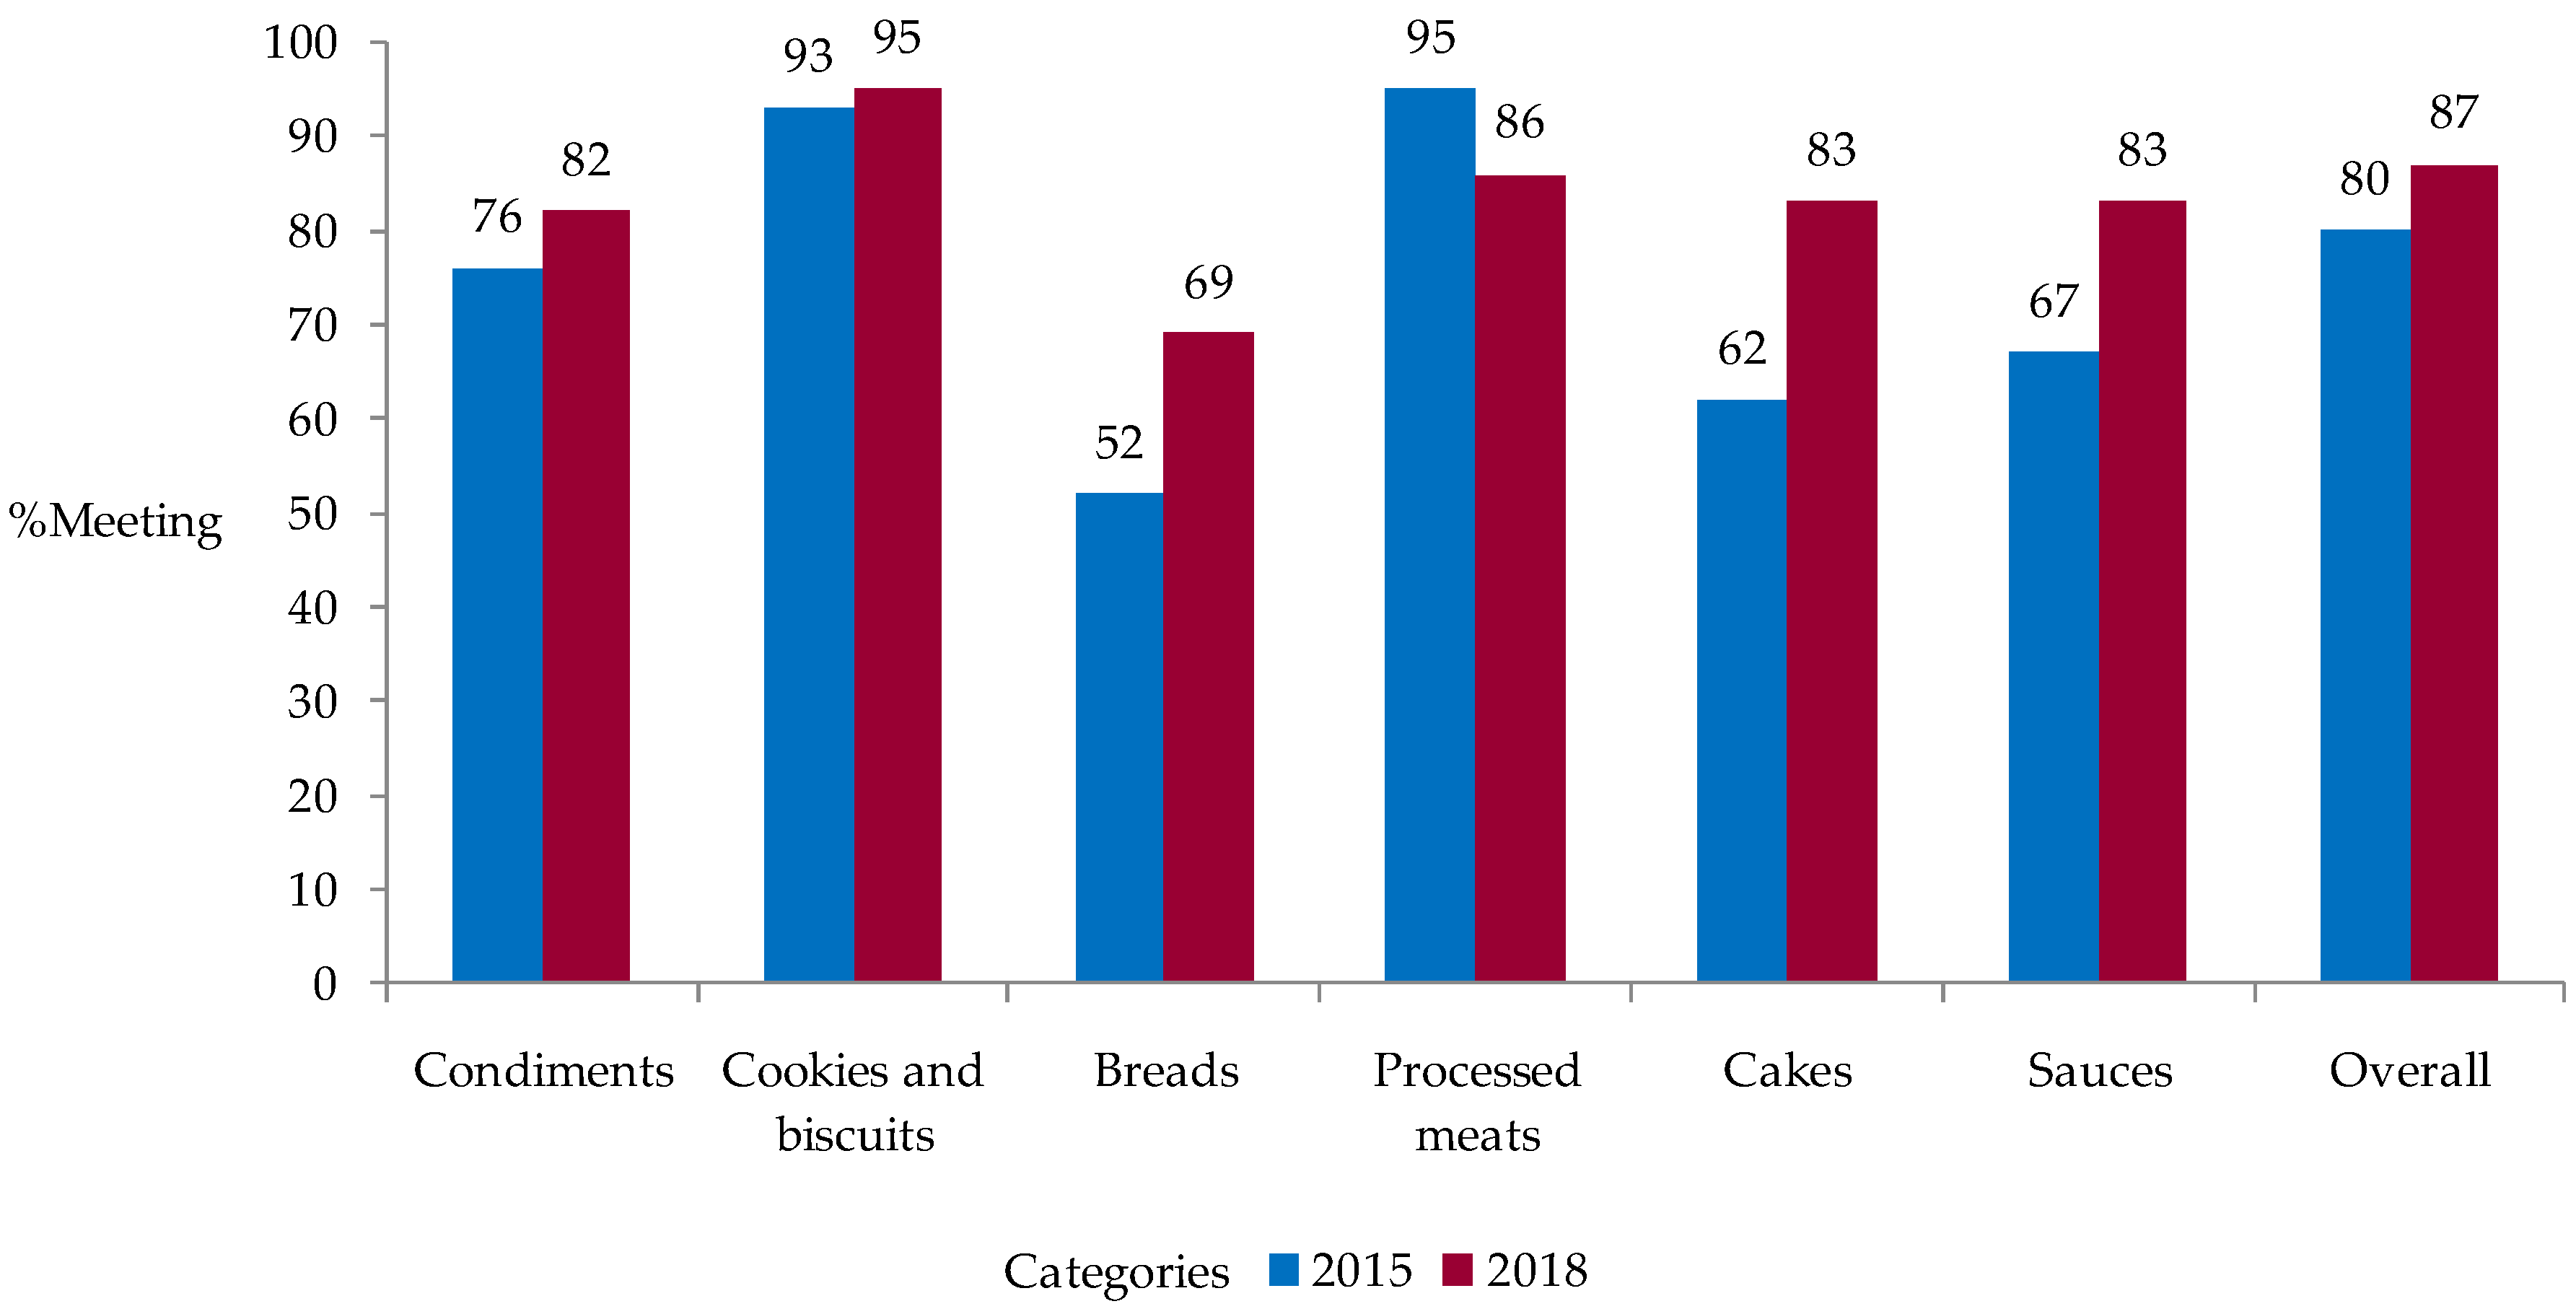
3.2. Compliance with National Targets for the Sodium Reduction in Packaged Food by Category and Subcategory

There was slight increase in the proportion of foods that met the national targets from 80% in 2015 to 87% in 2018 (Table 2, Figure 1). In 2018, cookies and biscuits had the highest level of compliance (95%), while breads had the lowest level of compliance (69%) (Table 2, Figure 1). With the exception of processed meats, all the categories had an increased proportion of foods that met the national targets (Figure 1). The greatest improvements were observed among cakes, bread and sauces with a 21%, 17% and 16% percentage point increase, respectively. Improvements in the compliance with the national targets was consistent with changes to mean sodium levels observed in the earlier analysis.
Among subcategories, the greatest positive changes in meeting the national targets were seen among sweet bread (67% to 100%), wholemeal bread (50% to 82%), tomato-based sauces (59% to 81%), English sauce (68% to 86%), bouillon cubes and powders (33% to 50%) and cakes (62% to 83%). Three categories had a lower proportion meeting the national targets: Sausages (100% to 71%) Salchichón (100% to 33%) and ketchup (81% to 74%). There was no change observed among seasonings for side and main dishes, dry sweet cookies, mortadella, and ham.
On examination of the 2018 data alone, overall, there was a high level of compliance. Sweet bread, mortadella, as well as seasoning for side and main dishes achieved 100% compliance (Table 2). Only two subcategories had a compliance of 50% or less: bouillon, cubes and powders (50%), as well as salchichón (33%).

4. Discussion

This is the first longitudinal study performed in Costa Rica regarding the changes to sodium levels in packaged food, before and after the implementation of national targets. Costa Rica is the first Central American country to implement a national plan for the reduction of sodium intake [32]. This was achieved by commitment and dedication from both the Ministry of Health and Costa Rican Chamber of Food Industry in establishing a private–public partnership in 2014 to reduce sodium in processed food, which included the development and adoption of voluntary targets for the reduction of sodium in packaged in 2016, with a renewal in 2019 [33].
The implementation of sodium reduction targets requires the food industry to reformulate products, which represents a challenge in certain foods due to functional properties of sodium, such as the provision of microbiological protection, its influence in taste and texture, and being a preservative, among others [34]. However, there is evidence that its progressive and gradual reduction is feasible and allows the food industry to develop alternatives for a more significant reduction and to ensure the adaptation of consumers of food with less sodium [35].
Between 2015 and 2018, 84% of food subcategories analyzed did not have a statistically significant reduction in mean sodium content. However, while not all data were statistically significant, there were some meaningful changes that show some improvement, which may have resulted from efforts within Costa Rica or regionally. For example, the cakes subcategory which had significantly lower sodium in 2018, also has a regional sodium target that was established by the Salt Smart consortium; thus, this decrease may be linked to food industry efforts at the regional level [36]. In the case of the other two subcategories, the tomato-based sauces and the tomato paste, the main food production industries are also transnational companies recognized for initiating sodium reduction processes in their products in parallel with the establishment of regional goals [37,38,39,40].
Furthermore, the analysis found a high variability of sodium content within the same subcategory, but in some categories, this variance decreased over time. This wide variability in a same subcategory establishes the feasibility of reformulating foods that have a higher sodium content.
In 2018, a larger sample size was found in some subcategories that had meaningful but nonsignificant increases in sodium content (seasonings for side and main dishes, sausages, salchichón, and ham). Since the same methodology was used to systematically sample data in 2015 and 2018, this larger sample could be the result of the emergence of new products on the market that are higher in sodium. The results may show the influence of a dynamic food marketplace, characterized by a broad rotation of new products that mostly contain more sodium, directly affecting the mean and median sodium levels as well as variation observed. Future research should assess the sodium levels and compliance of these foods alone, and impact on population sodium intake.
The actions taken by the food industry to introduce a variety of lower sodium products are recognized, but it remains necessary to continue to increase their availability and accessibility to the consumer [33]. These actions are reflected in the current study, which found that the majority of foods offered in 2015 (80%) already contained sodium levels that were below the national sodium reduction targets, a compliance rate that increased by 7% in 2018. In addition, it is evident that: (1) It is feasible for the food industry in Costa Rica to reduce the sodium content of the foods they produce, and (2) there needs to be a progressive and continuous effort to reduce sodium among all of the sectors involved, and the successes and challenges of these efforts should be monitored. For many of the large food companies with sodium reduction programs, voluntary targets as a first step may not require significant efforts. Although food reformulation is feasible [14], sodium reduction efforts should be periodically reassessed, following the example of countries such as the United Kingdom, Canada, and South Africa [15,41,42].
The results obtained are consistent with those of other countries, whether the sodium reduction targets were voluntary or mandatory [17,35,43,44,45,46]. For example, in Argentina, several food categories had a high proportion of products below the voluntary and mandatory targets in 2011 and 2014, respectively [35]. Brazil has had a voluntary sodium reduction plan since 2011. An evaluation of compliance in 2017 revealed that most of the categories already met the national target and even the regional targets. Additionally, most of the categories achieved a mean reduction between 8% and 34%, resulting in the need to implement more stringent targets [17,45]. In Canada, 51.4% of packaged food already met the sodium value set in the national and voluntary targets [43]. A recent analysis carried out between 2012 and 2016 showed no progress in the compliance of 48% of the products [44]. Moreover, the 2015 baseline study performed in fourteen countries of Latin America and the Caribbean, including Costa Rica, met an 82% general compliance with the regional targets. Costa Rica stands out for submitting one of the lowest proportions of food (77%) that met regional targets [46].
Although the compliance rate in Costa Rica and Latin America are high, sodium intakes continue to exceed recommended intakes in Costa Rica and LAC; therefore, there is a need to consider adopting stricter targets for optimal public health benefit. Nilson and Combris [17,18] highlighted the need to gradually adjusting national targets over time. The Salt Smart Consortium emphasized the same concept and agreed to updating the regional targets every two years [36]. However, when considering an update to targets, the food industry compliance, the target levels themselves, and the addition of new categories and subcategories must be assessed at a country level. In Costa Rica, the public–private partnership between the Ministry of Health and the Costa Rican Chamber of Food Industry itself indicated the possibility to include other categories of food identified as future priority in the previous version and reiterates it with its renewal. The targets set with biannual gradual reduction until 2022 should also be assessed, considering the international guidelines, the most recent data on the sodium consumption at the population level, the technological viability, and the acceptability of the consumer [33].
The Pan American Health Organization/ World Health Organization (PAHO/WHO) highlights, through the Declaration of the Salt Smart Consortium, that a significant strategy to reduce the salt intake by the entire population requires the cooperation of food processors and importers to also reduce the presence of salt (table salt) in the food supply itself. However, it also suggests significant effort and coordination is required to modify the social norms for the consumers and to engage them in self-regulating the amount of salt they add to food [36]. The data in the current study align with the need to implement other measures for the achievement of the national plan target [20], which includes the development of interventions such as social marketing and communication campaigns, education, the promotion of easy to interpret front-of-pack food labeling, and the involvement of the civilian population in decision-making related to public health, among others.
The study has limitations. Nutritional labelling is not mandatory in Costa Rica; therefore, it is not possible evaluate the compliance in all foods [30,31]. Despite this, the majority of foods do contain labeling and information about sodium, and the results are consistent with similar analyses in other countries [47]. This data also suggest that legislation should follow mandatory inclusion of the sodium content on food labels to allow the evaluation of compliance with the national targets. This is relevant in those categories and subcategories that currently have a smaller proportion of products with labeling. Our analysis is based on the reported information on the nutrition label, and we make an assumption that these reported values are correct. We note that variation may exist between the label and actual sodium content, particularly for certain food categories or among smaller food manufacturers [48], and because in Costa Rica, legislation allows up to ± 20% variance [30,31]. In addition, for some foods, the research team prepared recipes so that the nutritional composition of a food product reflected what would actually be consumed by an individual. While recipes were created according to preparation instructions on the package, we acknowledge that there may be inherent variation in actual recipes used by the population. Finally, some subcategories such as seasonings for side and main dishes, bouillon, cubes and powders, filled salted crackers, sweet bread, salchichón, and mortadella have little variety of trademarks and product versions that may be due to the small size of the country, the presence of dominant companies monopolizing the market or because of the special characteristics of the products that that are made for a small market. It must also be considered that voluntary policy measures like these require not only industry commitment, but also continuous monitoring by the government to assess the implementation of sodium reduction initiatives and changes in the food nutritional profile [34].

5. Conclusions

This study provides the first evaluation of sodium content in packaged food in Costa Rica. A relatively high proportion of foods compy with the national targets levels, suggesting that some food categories need to be made more stringent. Continuous monitoring and updating of national targets by government authorities in collaboration with the food industry and external financial entities is needed. It this regard, it is recommended to establish a program for monitoring and researching the sodium content in processed foods, through analyzing the nutritional labeling and, ideally, chemical analysis. As part of the official monitoring process, periodic reports on changes to the sodium content of food should be made public and shared with food companies. Finally, this future work should be extended to capture actual changes in dietary intake that result from food product reformulation, as well as any changes in clinical outcomes, such as improved rates of hypertension and cardiovascular disease.

Supplementary Materials

The following are available online at https://www.mdpi.com/2072-6643/11/9/2226/s1, Table S1: List of food categories and subcategories with national target for the sodium reduction on January 2018, Costa Rica.

Author Contributions

J.V.-S. participed in data collection and informed data analysis, interpretation and prepared the manuscript. A.B.-M. and J.A. participated in the study design and critically reviewed the manuscript. K.B.-A. participated in data collection. All authors reviewed and approved the final version of the manuscript.

Funding

This research was funded by THE INTERNATIONAL DEVELOPMENT RESEARCH CENTER, CANADA, IDRC Project #108167 to Adriana Blanco-Metzler MSc. of INCIENSA.

Acknowledgments

External financial support was from the International Development Research Center, Canada (IDRC Project #108167). INCIENSA for financial support during all the project. Mary R. L’Abbe PhD, professor of University of Toronto and advisor of IDRC Project 108167. Rubí Vázquez Cárdenas-student of nutrition of Universidad Hispanoamericana of CR-collected data. María Fernanda Redondo Sáenz and Angie Vega Solano-nutritionists-registered data. Kimberly Campos Mena-food engineer, collaborated in the preparation of tables, graphs and references. Elizabeth Dunford PhD, Research Fellow of The George Institute for Global Health, University of New South Wales, Australia, advisor of IDRC Project 106888. David López, statistical consultant.

Conflicts of Interest

The authors declare no conflict of interest. The founding sponsor had no role in the design of the study; in the collection, analyses, or interpretation of data; in the writing of the manuscript, and in the decision to publish the results.

References

  1. Newberry, S.J.; Chung, M.; Anderson, C.A.M.; Chen, C.; Fu, Z.; Tang, A.; Zhao, N.; Booth, M.; Marks, J.; Hollands, S.; et al. Sodium and Potassium Intake: Effects on Chronic Disease Outcomes and Risks; Comparative Effectiveness; RAND Southern California Evidence-based Practice Center: Santa Monica, CA, USA, 2018; pp. 1–951. [Google Scholar]
  2. Aburto, N.J.; Ziolkovska, A.; Hooper, L.; Elliott, P.; Cappuccio, F.P.; Meerpohl, J.J. Effect of lower sodium intake on health: Systematic review and meta-analyses. BMJ 2013, 346, 1326. [Google Scholar] [CrossRef] [PubMed]
  3. Organización Mundial de la Salud. LAS 10 Principales Causas DE DefuncióN. Available online: http://www.who.int/mediacentre/factsheets/fs310/es/ (accessed on 3 October 2018).
  4. GBD 2015 Mortality and Causes of Death Collaborators. Global, Regional, and National Life Expectancy, All-Cause Mortality, and Cause-Specific Mortality for 249 Causes of Death, 1980–2015: A Systematic Analysis for the Global Burden of Disease Study 2015. Available online: https://www.ncbi.nlm.nih.gov/pubmed/27733281 (accessed on 7 December 2018).
  5. Global Status Report on Noncommunicable Diseases 2010. Available online: https://www.who.int/nmh/publications/ncd_report_full_en.pdf (accessed on 30 September 2014).
  6. Lim, S.S.; Vos, T.; Flaxman, A.D.; Danaei, G.; Shibuya, K.; Adair-Rohani, H.; Amann, M.; Anderson, H.R.; Andrews, K.G.; Aryee, M.; et al. A comparative risk assessment of burden of disease and injury attributable to 67 risk factors and risk factor clusters in 21 regions, 1990–2010: A systematic analysis for the Global Burden of Disease Study 2010. Lancet 2012, 380, 2224–2260. [Google Scholar] [CrossRef]
  7. Costa Rica. Ministerio de Salud, Instituto Costarricense de Investigación y Enseñanza en Nutrición y Salud, Caja Costarricense del Seguro Social y Organización Panamericana de la Salud. Encuesta Multinacional de Diabetes Mellitus, Hipertensión Arterial y Factores de Riesgo Asociados, Área Metropolitana, San José, 2004; El Ministerio: San José, Costa Rica, 2009; pp. 12–15. [Google Scholar]
  8. Caja Costarricense del Seguro Social. Vigilancia de los Factores de Riesgo Cardiovascular. Segunda Encuesta, 2014; Editorial Nacional de Salud y Seguridad Social: San José, Costa Rica, 2016; pp. 34–92. [Google Scholar]
  9. Wong, R. Perfil actual de la hipertensión arterial en Costa Rica 2013; Caja Costarricense de Seguro Social: San Jose, Costa Rica, 2013; p. 15. [Google Scholar]
  10. Blanco-Metzler, A.; Moreira Claro, R.; Heredia-Blonval, K.; Caravaca Rodríguez, I.; Montero-Campos, M.A.; Legetic, B.; L’Abbé, M.R. Baseline and Estimated Trends of Sodium Availability and Food Sources in the Costa Rican Population during 2004–2005 and 2012–2013. Nutrients 2017, 9, 1020. [Google Scholar] [CrossRef] [PubMed]
  11. World Health Organization. Guideline: Sodium Intake for Adults and Children; WHO: Geneva, Switzerland, 2012; p. 2. [Google Scholar]
  12. World Health Organization. Scaling Up Action against Noncommunicable Diseases: How Much Will It Cost? WHO: Geneva, Switzerland, 2011; p. 12. [Google Scholar]
  13. Public Health Agency of Canada and Pan American Health Organization. Dropping the Salt. Proceedings of the Mobilizing for Dietary Salt Reduction Policies and Strategies, Americas, Miami, FL, USA, 13–14 January 2009, Pan American Health Organization: Miami, FL, USA, 2009; 7. [Google Scholar]
  14. Trieu, K.; Neal, B.; Hawkes, C.; Dunford, E.; Campbell, N.; Rodriguez-Fernandez, R.; Legetic, B.; McLaren, L.; Barberio, A.; Webster, J. Salt Reduction Initiatives around the World-A Systematic Review of Progress towards the Global Target. PLoS ONE 2015, 10, e0130247. [Google Scholar] [CrossRef] [PubMed]
  15. Hyseni, L.; Elliot-Green, A.; Lloyd-Williams, F.; Kypridemos, C.; O’Flaherty, M.; Orton, L.; Bromley, H.; Cappuccio, F.P.; Capewell, S. Systematic review of dietary salt reduction policies: Evidence for an effectiveness hierarchy? PLoS ONE 2017, 12, e0177535. [Google Scholar] [CrossRef] [PubMed]
  16. Declaración Política Sobre La Prevención De Las Enfermedades Cardiovasculares Mediante La Reducción De La Ingesta DE Sal Alimentaria De Toda La Población. Available online: https://www.paho.org/hq/index.php?option=com_content&view=category&view=article&id=2022&Itemid=1757&lang=es (accessed on 2 October 2018).
  17. Nilson, E.; Jaime, P.; Resende, O. Initiatives developed in Brazil to reduce sodium content of processed foods. Rev. Pan. Salud Publica 2012, 32, 287–292. [Google Scholar] [CrossRef] [PubMed]
  18. Combris, P.; Goglia, R.; Henini, M.; Soler, L.G.; Spiteri, M. Improvement of the nutritional quality of foods as a public health tool. Public Health 2011, 125, 717–726. [Google Scholar] [CrossRef] [PubMed]
  19. Hendriksen, M.; Hoogenveen, R.; Hoekstra, J.; Geleijnse, J.; Boshuizen, H.; van Raaij, J.M.A. Potential effect of salt reduction in processed foods on health. Am. J. Clin. Nutr. 2014, 99, 446–453. [Google Scholar] [CrossRef] [PubMed]
  20. Costa Rica. Ministerio de Salud. Plan Nacional Para la Reducción del Consumo de Sal/Sodio en la Población de Costa Rica, 2011–2021; El Ministerio: San José, Costa Rica, 2011; pp. 3–20. [Google Scholar]
  21. Declaración de interés Programa para reducir el consumo de sal/sodio en Costa Rica. Decreto Ejecutivo DM-MG-1083-2013. Available online: https://www.imprentanacional.go.cr/pub/2013/03/11/COMP_11_03_2013.html (accessed on 4 October 2018).
  22. Costa Rica. Ministerio de Salud. Estrategia Nacional Abordaje Integral de las Enfermedades Crónicas No Transmisibles y Obesidad 2014–2021; El Ministerio: San José, Costa Rica, 2014; p. 29. [Google Scholar]
  23. Ministerio De Salud, Alianza PúBlico-Privada Ministerio De Salud Y AsociacióN Costarricense De La Industria Alimentaria (Cacia) Para Implementar Acciones Y Fomentar Estilos De Vida Saludable, Asociados Particularmente Al Sodio, Que Incluyen Una AlimentacióN Saludable Y Equilibrada, Nutricionalmente Adecuada. 2014. Available online: https://www.cacia.org/5275-2/ (accessed on 4 October 2018).
  24. Walmart acordó compra de las cadenas Perimercados, Súper Compro y Saretto. Transacción se informó este 19 de julio a la Comisión para la Promoción de la Competencia de Costa Rica e incluiría 52 tiendas con más de 1.300 empleados. Available online: https://www.nacion.com/economia/negocios/walmart-acordo-compra-de-cadenas-de-supermercados/AUTRG6NUO5A3LEIMZGU4NNWALA/story/ (accessed on 8 July 2019).
  25. ¿Dónde se ubican los supermercados en Centroamérica? Available online: https://centralamericadata.com/es/product/inteligenciaComercialReporte/8304263 (accessed on 23 August 2019).
  26. Dunford, E.; Webster, J.; Metzler, A.B.; Czernichow, S.; Mhurchu, C.N.; Wolmarans, P.; Snowdon, W.; L’Abbe, M.; Li, N.; Maulik, P.K.; et al. International collaborative project to compare and monitor the nutritional composition of processed foods. Eur. J. Prev. Cardiol. 2012, 19, 1326–1332. [Google Scholar] [CrossRef] [PubMed]
  27. App Store Preview. The George Institute for Global Health. Data Collector Application 2014. Available online: https://apps.apple.com/au/app/data-collector/id545847554 (accessed on 3 October 2018).
  28. Bernstein, J.T.; Franco-Arellano, B.; Schermel, A.; Labonté, M.; L’Abbé, M.R. Healthfulness and nutritional composition of Canadian prepackaged foods with and without sugar claims. Appl. Physiol. Nutr. Metab. 2017, 42, 1217–1224. [Google Scholar] [CrossRef] [PubMed]
  29. Tabla de Composición de Alimentos de Centroamérica. Available online: https://es.slideshare.net/marcelahooot/tabla-de-composicion-de-alimentos-para-centroamerica-del-incap (accessed on 27 December 2018).
  30. Etiquetado General de los Alimenticios Previamente Envasados (Preenvasados). Available online: http://www.cita.ucr.ac.cr/sites/default/files/archivos_adjuntos/Reglamento%20Tecnico%20Centroamericano%20de%20Etiquetado%20General%20de%20los%20Alimentos%20Preenvasados.pdf (accessed on 27 December 2018).
  31. Etiquetado Nutricional de Productos Alimenticios Preenvasados Para Consumo Humano Para la Poblacion a Partir de 3 Años de Edad. Available online: https://extranet.who.int/nutrition/gina/sites/default/files/COMIECO%202011%20Etiquetado%20Nutricional%20de%20Productos%20Alimenticios%20Preenvasados%20para%20Consumo%20Humano.pdf (accessed on 27 December 2018).
  32. Estrategia Regional para la Reducción del consumo de sal y sodioen Centroamérica y República Dominicana. Available online: https://www.sica.int/download/?118341 (accessed on 2 January 2019).
  33. Ministerio De Salud Y Cacia Renuevan Alianza Para Reducir Sodio en Productos Procesados. Available online: https://www.ministeriodesalud.go.cr/index.php/noticias/noticias-2019/1430-ministerio-de-salud-y-cacia-renuevan-alianza-para-reducir-sodio-en-productos-procesados (accessed on 15 June 2019).
  34. Buttriss, J.L. Food reformulation: The challenges to the food industry. Proc. Nut. Soc. 2013, 72, 61–69. [Google Scholar] [CrossRef] [PubMed]
  35. Allemandi, L.; Tiscornia, M.V.; Ponce, M.; Castronuovo, L.; Dunford, E.; Schoj, V. Sodium content in processed foods in Argentina: Compliance with the national law. Cardiovasc. Diag. Ther. 2015, 5, 197–206. [Google Scholar]
  36. Salt Smart Consortium Consensus Statement to Advance Target Harmonization by Agreeing on Regional Targets for the Salt/Sodium Content of Key Food Categories. Available online: https://www.paho.org/hq/dmdocuments/2015/salt-smart-Consensus-statement-with-targets-FINAL.pdf (accessed on 3 October 2018).
  37. Nestlé. Nestlé in Society: Creating Shared Value and Meeting our Commitments 2013; Nestlé, S.A., Ed.; Public Affairs: Vevey, Switzerland, 2014; p. 53. [Google Scholar]
  38. The Call For Well-being 2014 Progress Report. Available online: https://www.mondelezinternational.com/~/media/MondelezCorporate/uploads/downloads/CFWB2014ProgressReport.pdf (accessed on 22 July 2019).
  39. Unilever’s Position on Salt Reduction. Available online: https://www.unilever.com/Images/salt-reduction-position-statement_tcm244-414411_1_en.pdf (accessed on 22 July 2019).
  40. Nutrition in Unilever Means Better Products, Better Diets, Better Lives For Our Consumers. Available online: http://www.consumergoodsforbetterlives.com/wp-content/uploads/2015/06/Unilever-Global-Nutrition-brochure-2015.pdf (accessed on 22 July 2019).
  41. Campbell, N.; Legowski, B.; Legetic, B.; Ferrante, D.; Nilson, E.; Campbell, C.; L’Abbé, M.R. Targets and Timelines for Reducing Salt in Processed Food in the Americas. J. Clin. Hypertens 2014, 16, 619–623. [Google Scholar] [CrossRef] [PubMed]
  42. Public Health England. Salt Reduction Targets for 2017; Public Health England: London, UK, 2017; p. 4. [Google Scholar]
  43. Arcand, J.; Au, J.T.; Schermel, A.; L’Abbé, M.R. A comprehensive analysis of sodium levels in the Canadian packaged food supply. Am. J. Prev. Med. 2014, 46, 633–642. [Google Scholar] [CrossRef] [PubMed]
  44. Sodium Reduction in Processed Foods in Canada: An Evaluation of Progress toward Voluntary Targets from 2012 to 2016. Available online: https://www.canada.ca/en/health-canada/services/food-nutrition/legislation-guidelines/guidance-documents/guidance-food-industry-reducing-sodium-processed-foods-progress-report-2017.html (accessed on 27 December 2018).
  45. Nilson, E.A.F.; Spaniol, A.M.; Goncalves, V.S.S.; Moura, I.; Silva, S.A.; L’Abbé, M.R.; Jaime, P.C. Sodium Reduction in Processed Foods in Brazil: Analysis of Food Categories and Voluntary Targets from 2011 to 2017. Nutrients 2017, 9, 742. [Google Scholar] [CrossRef] [PubMed]
  46. Arcand, J.; Blanco-Metzler, A.; Benavides Aguilar, K.; L’Abbé, M.R.; Legetic, B. Sodium Levels in Packaged Foods Sold in 14 Latin American and Caribbean Countries: A Food Label Analysis. Nutrients 2019, 11, 369. [Google Scholar] [CrossRef] [PubMed]
  47. Blanco-Metzler, A.; Roselló-Araya, M.; Núñez-Rivas, H.P. Situación basal de la información nutricional declarada en las etiquetas de los alimentos comercializados en Costa Rica. ALAN 2011, 6, 87–95. [Google Scholar]
  48. Fitzpatrick, L.; Arcand, J.; L’Abbe, M.; Deng, M.; Duhaney, T.; Campbell, N. Accuracy of Canadian food labels for sodium content of food. Nutrients 2014, 6, 3326–3335. [Google Scholar] [CrossRef] [PubMed]
Figure 1. Comparison between years of the compliance with the national target for the sodium reduction in packaged food categories, Costa Rica, 2015–2018.
Nutrients 11 02226 g001
Table 1. Sodium content in packaged food by subcategories with national reduction targets, Costa Rica 2015–2018.
SubcategoryYearnSodium (mg/100 g)
Mean ±SDMedianMinimumMaximum% DifferenceP Value
Sweet bread20153447 ± 4394630877−630.399
20183166 ± 233660432
Tomato-based sauces201571920 ± 10305432465415−50 *0.000
201893462 ± 26539301857
Tomato paste201513417 ± 1873630814−45 *0.007
201831231 ± 1901970636
Wholemeal bread201514435 ± 3105050936−330.139
201833291 ± 2422910936
Ketchup201526922 ± 5726663372045−260.089
201819685 ± 3376271401187
Cakes201579452 ± 272344871334−25 *0.012
201858341 ± 24034401108
Mortadella20153820 ± 3386436071210−240.420
20182622 ± 75623569675
Meat and fish seasonings20154010,946 ± 9762600013333,636−220.243
2018458545 ± 8948551716733,636
English sauce2015191927 ± 59219075902633−160.283
201871620 ± 62215007002633
Filled salted crackers20159796 ± 2257935161235−120.527
20186702 ± 2945525001265
Dry sweet cookies2015144304 ± 19228701800−120.086
2018161269 ± 15526701250
Filled sweet cookies2015120311 ± 290275382750−110.411
2018112277 ± 33625093419
Dry salted crackers201559784 ± 24280001259−100.059
201876706 ± 22772651433
Bread201552471± 35748301668−50.670
201854448± 15948014767
Bouillon cubes and powders2015919,044 ± 666620,800784027,000−3.20.846
20181418,441 ± 788620,300100026,400
Sausages201520874 ± 173875001214+150.182
2018171003 ± 3539003451720
Ham201535995 ± 4439292902321+160.075
2018491158 ± 34511323252321
Seasonings for side and main dishes2015612,366 ± 95899883142727,000+320.470
2018816,269 ± 975514,622600028,000
Salchichón20151736736736736**NA
201835923 ± 8214154083015,400
Data presented as mean ± standard deviation. p-values for comparison of mean sodium levels 2015 vs. 2018. * Significant (p ≤ 0.05); ** Data not assessed due to small sample size.
Table 2. Compliance with national target for the sodium reduction in packaged food by categories and subcategories, Costa Rica, 2015–2018.
SubcategorySodium National Target (mg/100 g) % Meeting National Target (n)
n2015n2018
Condiments (Overall) 5576% (42)6782% (55)
Seasonings for side and main dishes 33,1006100% (6)8100% (8)
Meat and fish seasonings 23,0004082% (33)4588% (40)
Bouillon cubes and powders 20,500933.3% (3)1450% (7)
Cookies and Biscuits (Overall) 33293% (310)35595% (337)
Dry salted crackers 10665990% (53)7696% (73)
Filled salted crackers 1111988% (8)683% (5)
Dry sweet cookies 48514494% (135)16194% (152)
Filled sweet cookies 48512095% (114)11296% (107)
Breads (Overall) 6952% (36)9069% (62)
Bread 5005252% (27)5459% (32)
Sweet bread 500367% (2)3100% (3)
Wholemeal bread 5001450% (7)3382% (27)
Processed meats (Overall) 6095% (57)7186% (61)
Sausages123520100% (20)1771% (12)
Salchichón14251100% (1)333% (1)
Mortadella12823100% (3)2100% (2)
Ham 18053594% (33)4994% (46)
Cakes (Overall)5127962% (49)5883% (48)
Sauces (Overall) 12967% (87)15083% (124)
English sauce22501968% (13)786% (6)
Ketchup9902681% (21)1974% (14)
Tomato-based sauces6167159% (42)9381% (75)
Tomato paste5721385% (11)3194% (29)
Overall72480% (581)79187% (687)
Data presented as % (n). Bouillon cubes and powders and cakes presented “as consumed”.

