Tolerability and Safety of a Nutritional Supplement with Potential as Adjuvant in Colorectal Cancer Therapy: A Randomized Trial in Healthy Volunteers

 ,
,  ,
,
Abstract
:
1. Introduction
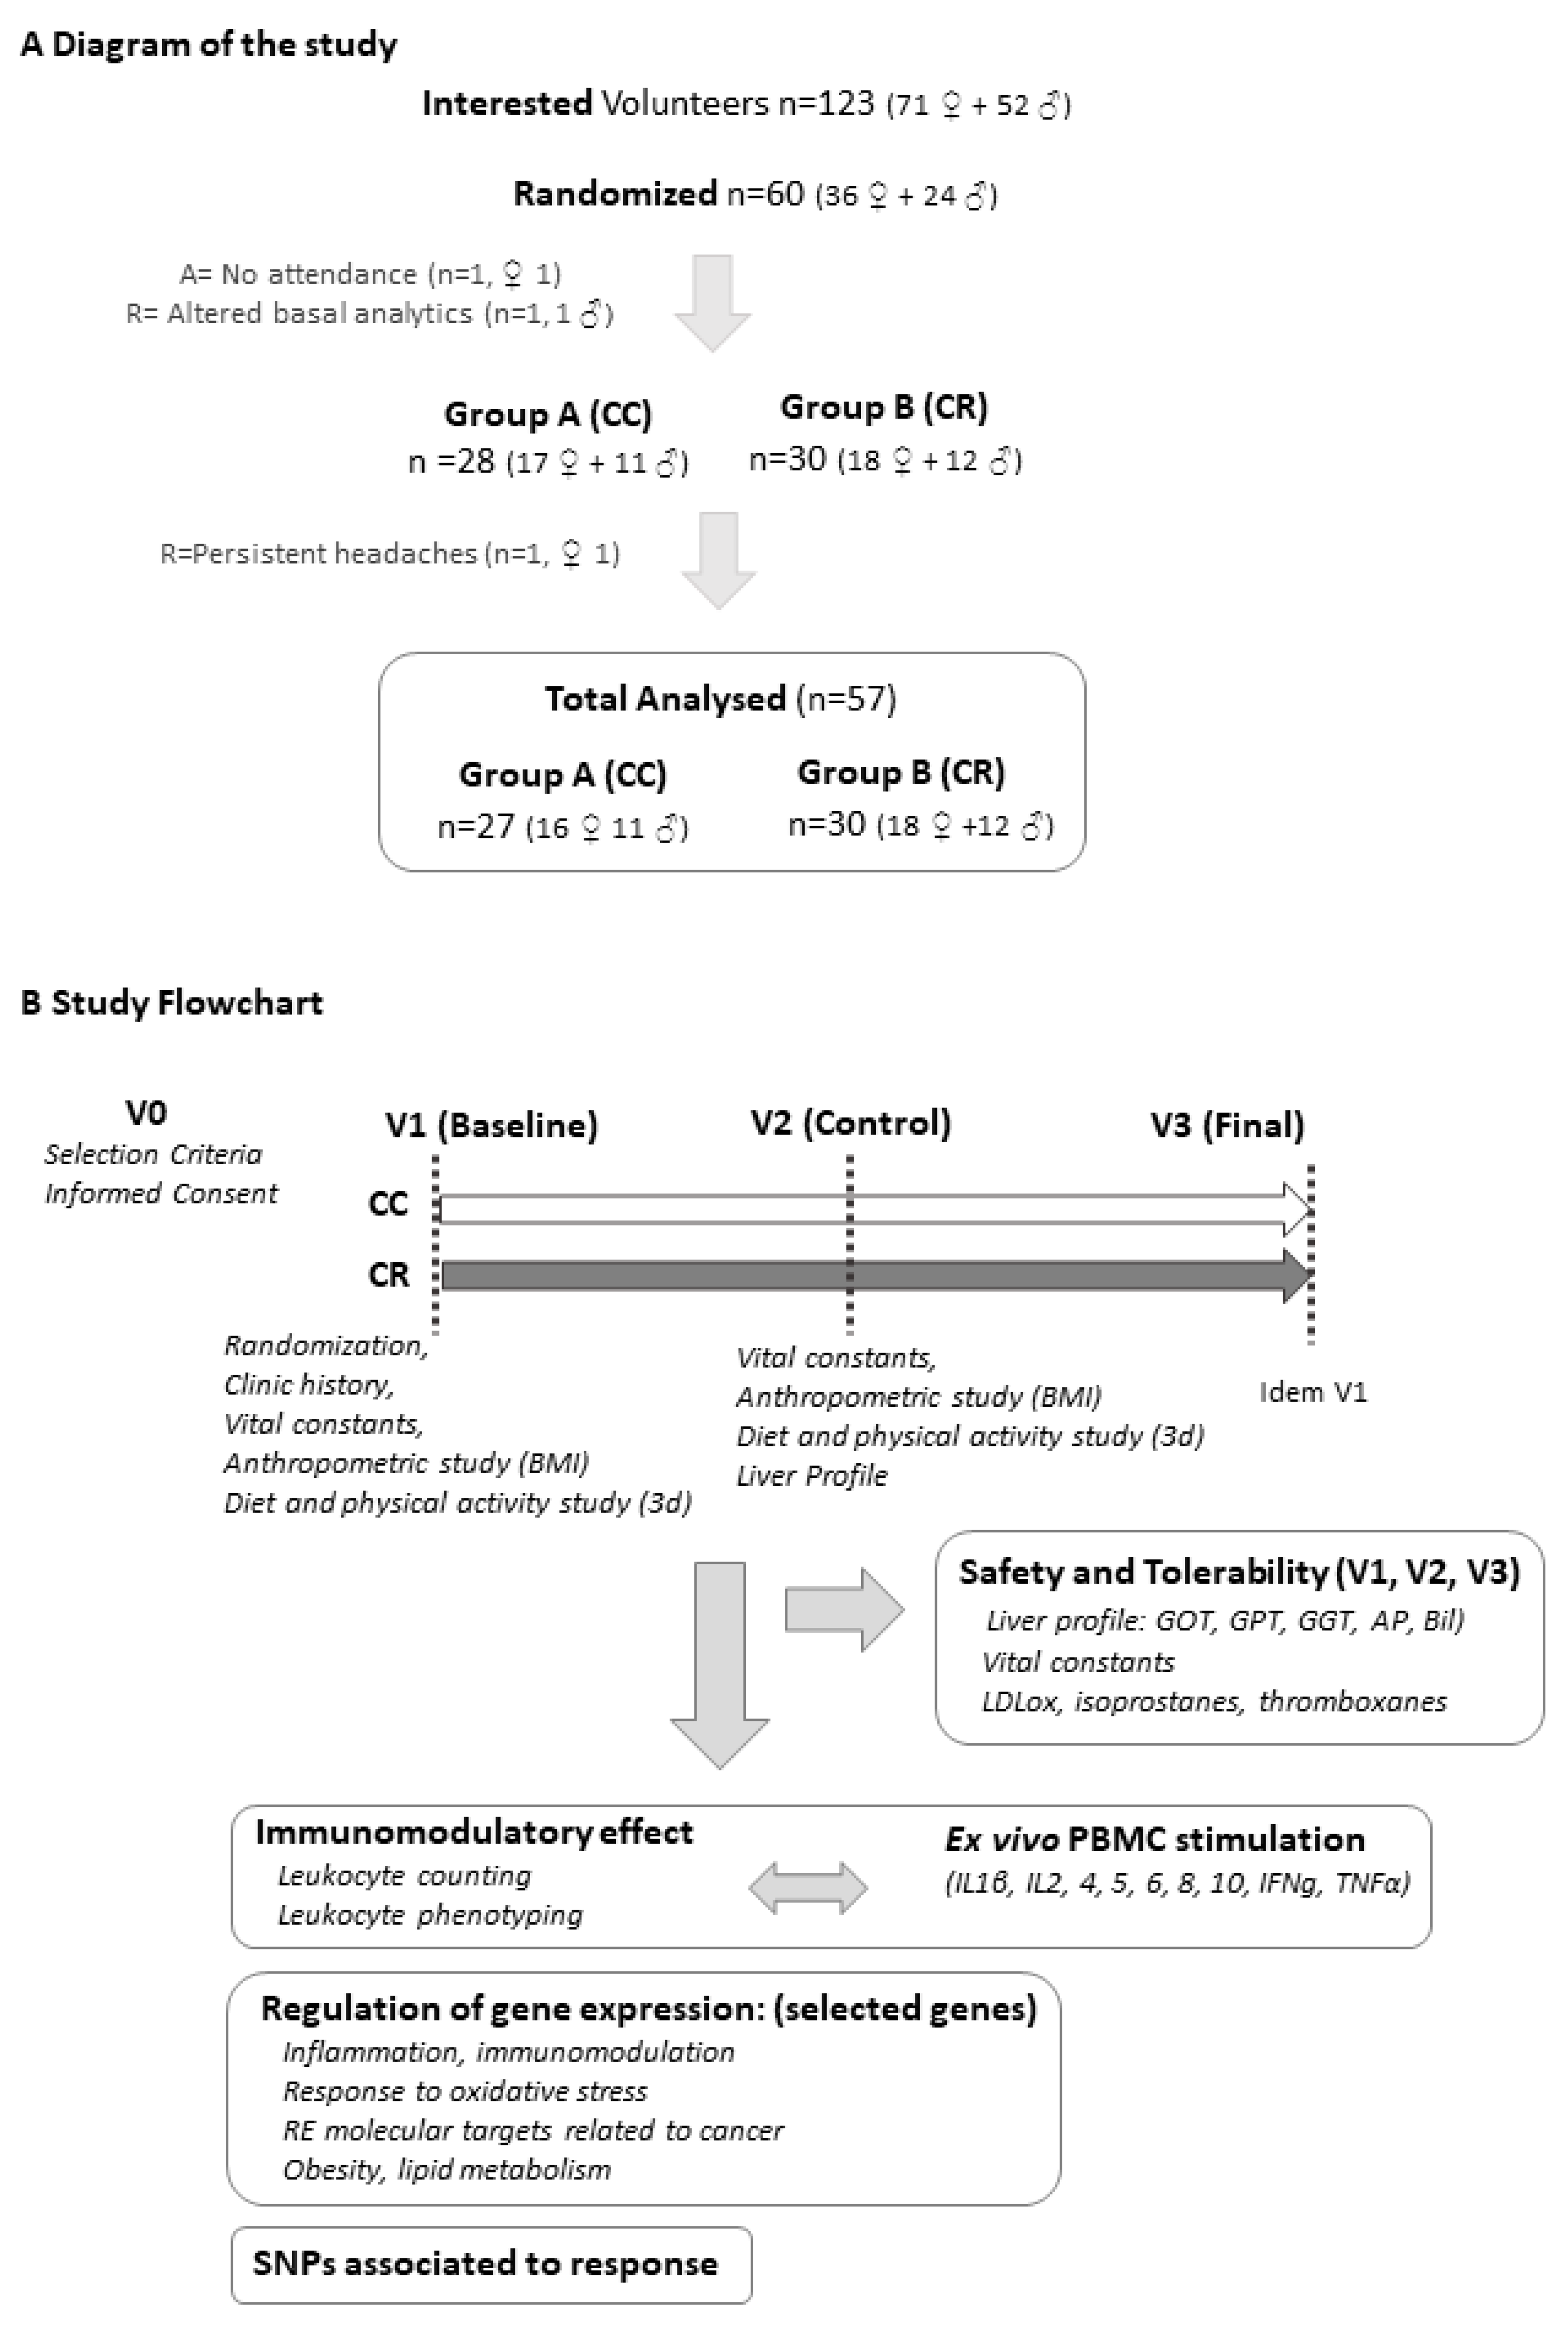
2. Study Design and Materials and Methods
2.1. Supplement Composition
2.2. Subjects and Study Design
2.3. Biochemical Analyses
2.4. Isolation of Peripheral Blood Mononuclear Cells (PBMCs)
2.5. Multiplex Bead Immunoassay
2.6. FACS (Fluorescence Activated Cell Sorting) Analysis of Cluster of Differentiation (CDs) Markers
2.7. Cell Culture and In Vitro Treatments
2.8. RNA Extraction
2.9. Gene Expression Analysis
2.10. DNA Extraction and Genotyping
2.11. Statistical Analyses
3. Results
3.1. Baseline Variables and Safety and Tolerability of Product Consumption
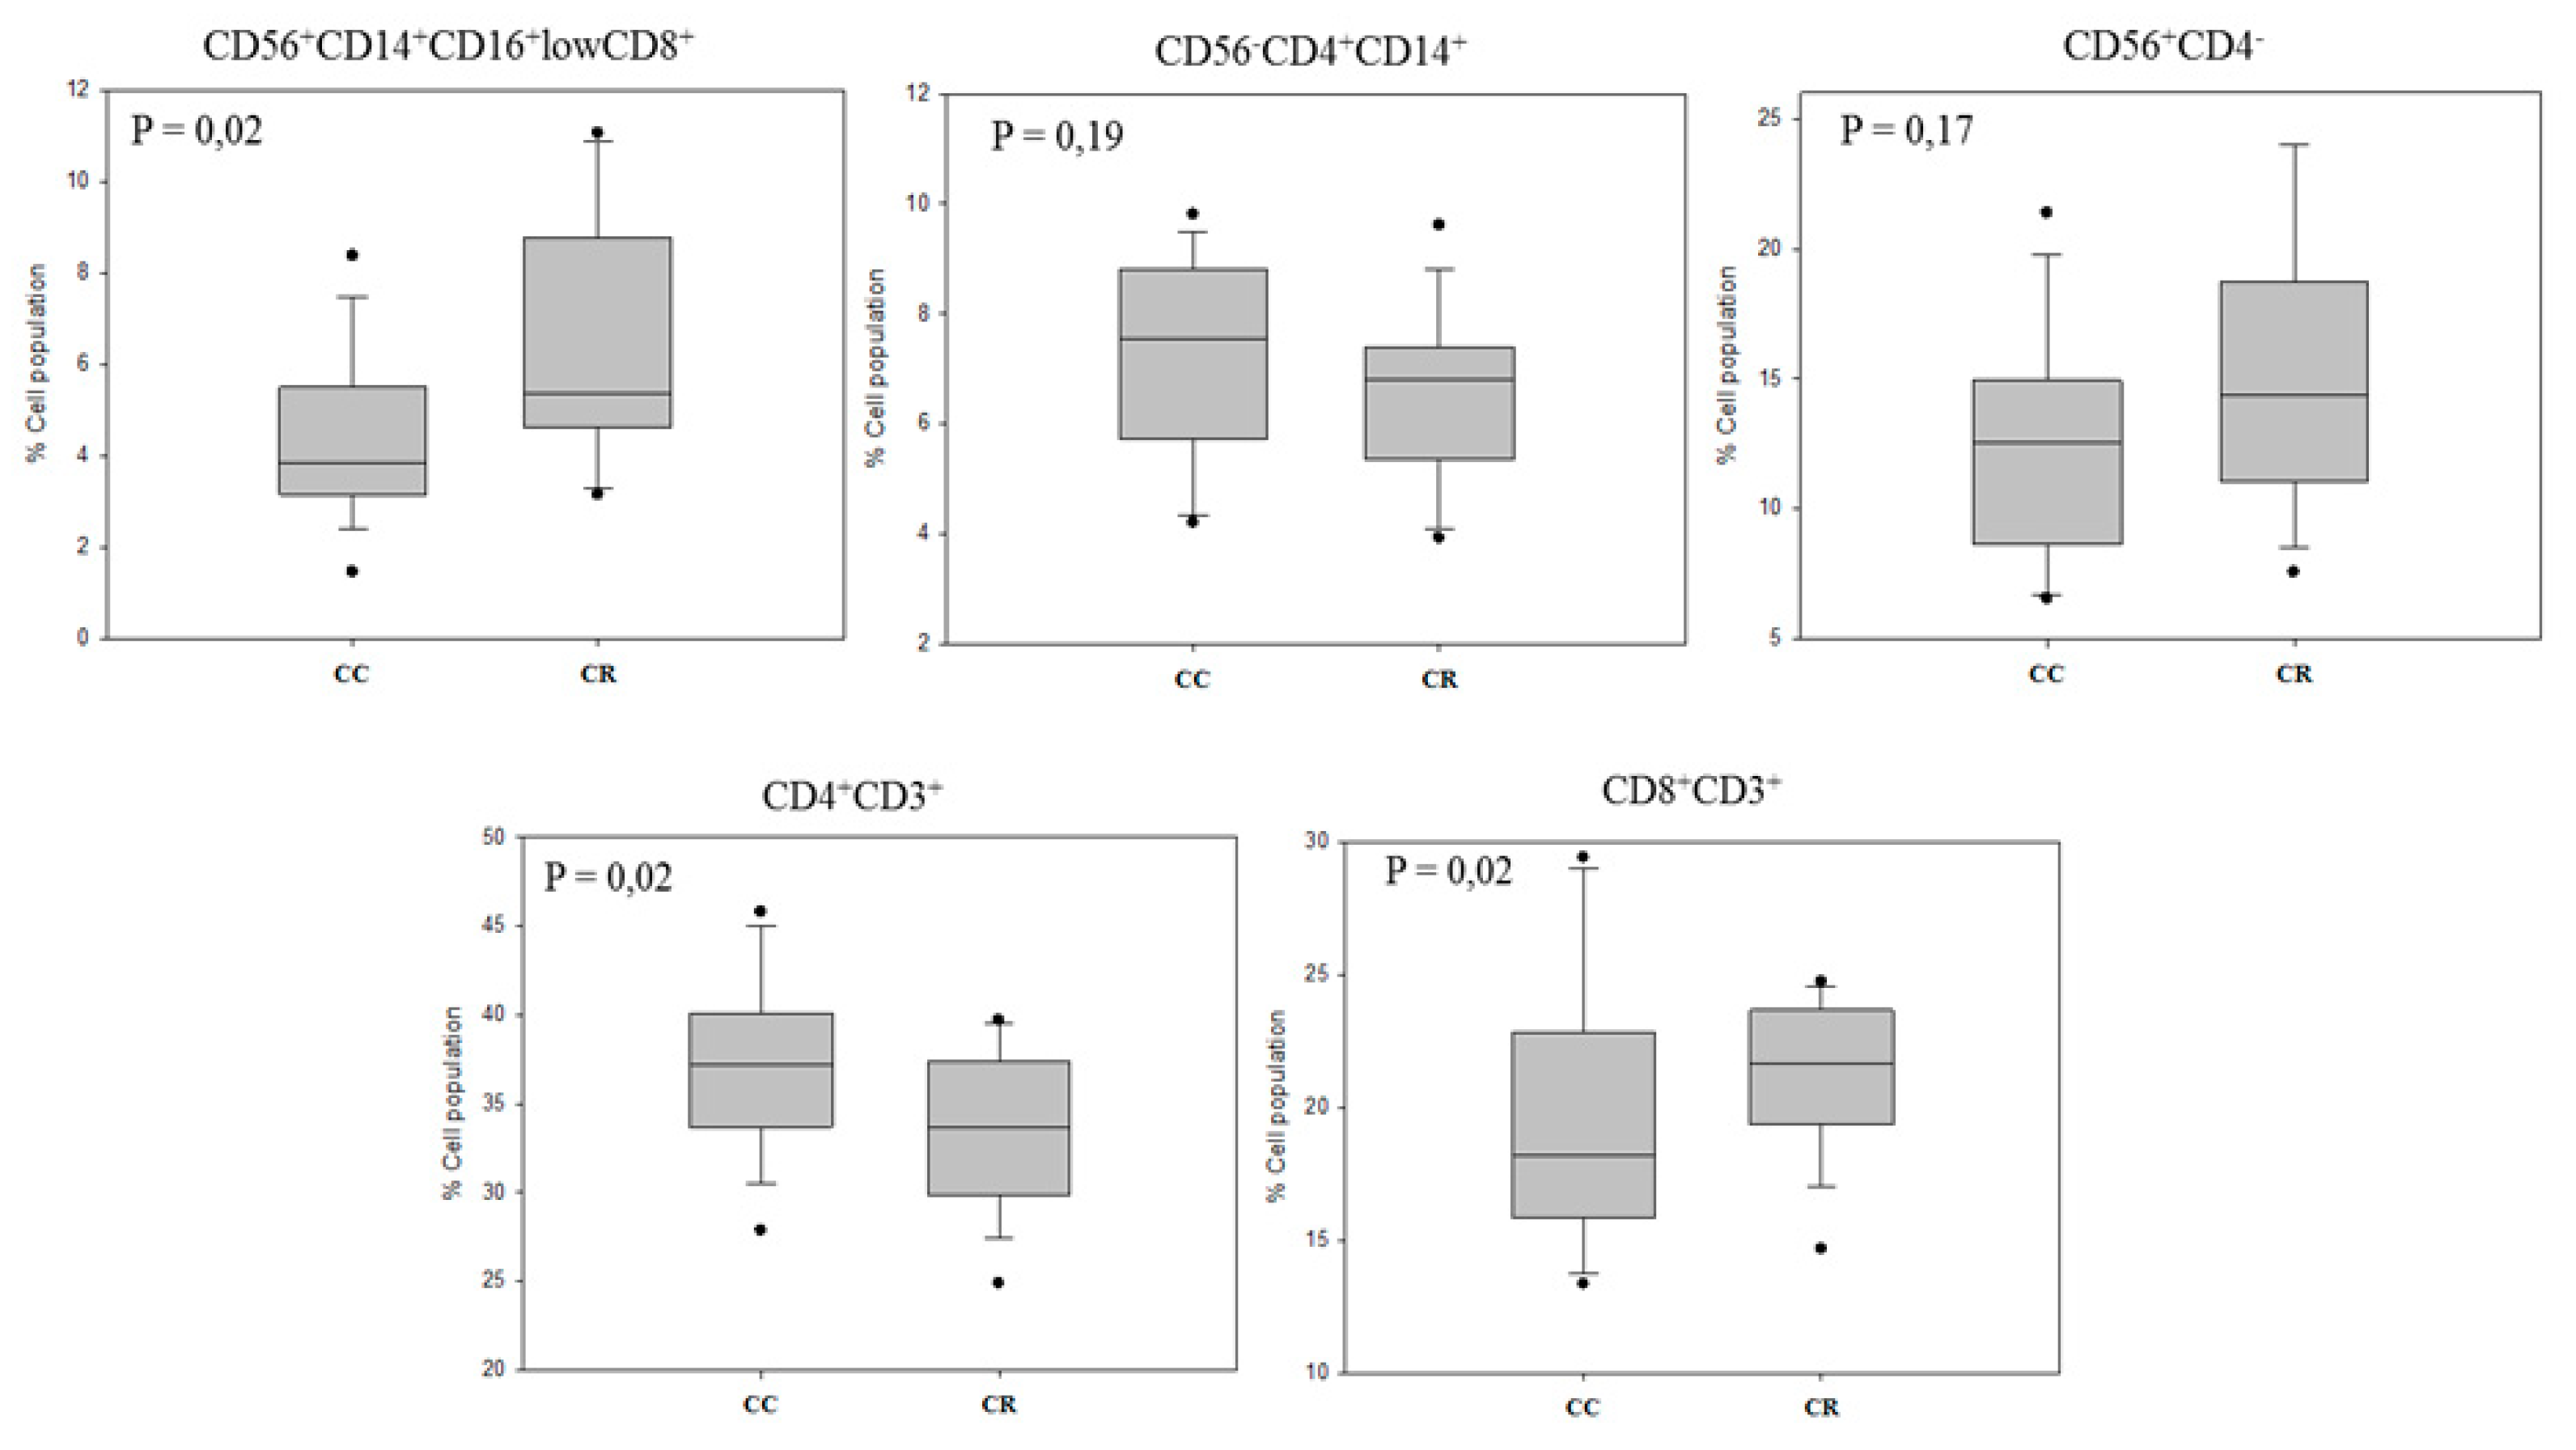
3.2. Immunomodulatory Effect on Leukocyte Subpopulations
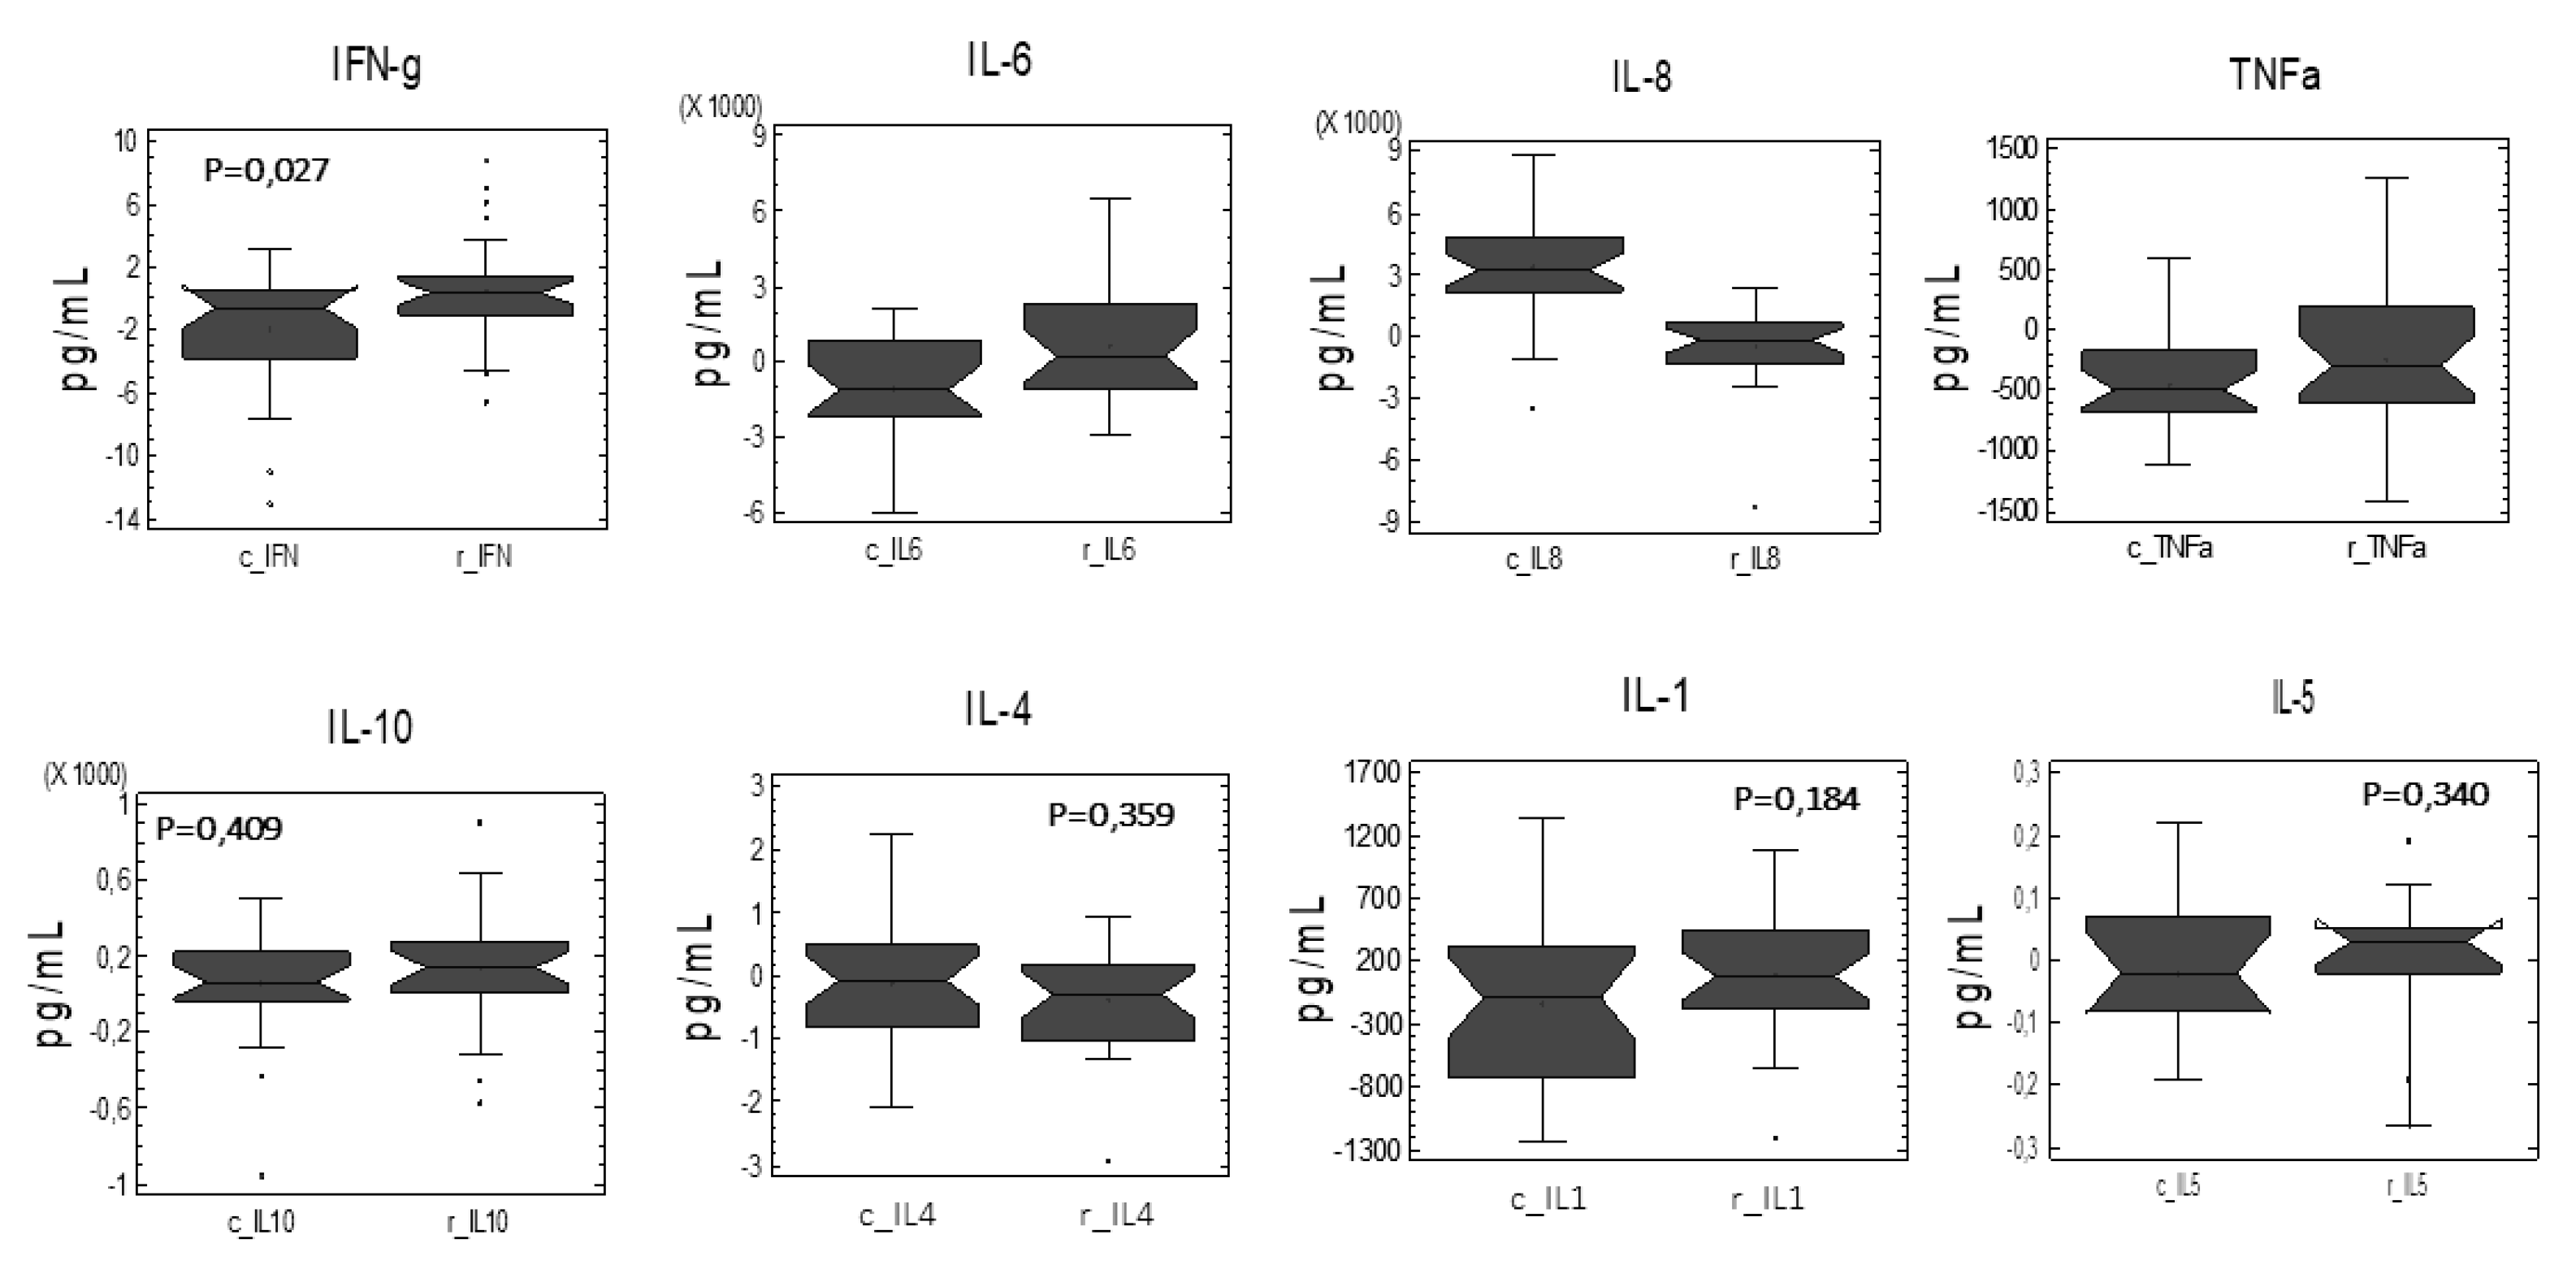
3.3. Cytokine Profile After Ex Vivo LPS Stimulation of PBMC
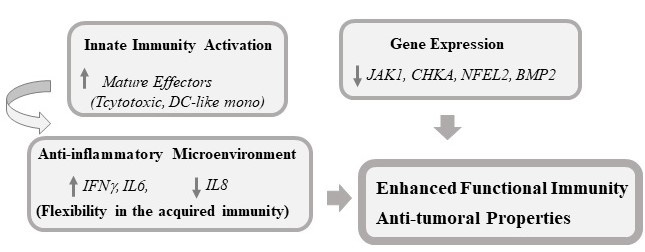
3.4. Modulation of the Expression of Genes Related to Immunomodulation, Inflammation, Oxidative Stress, and Cancer
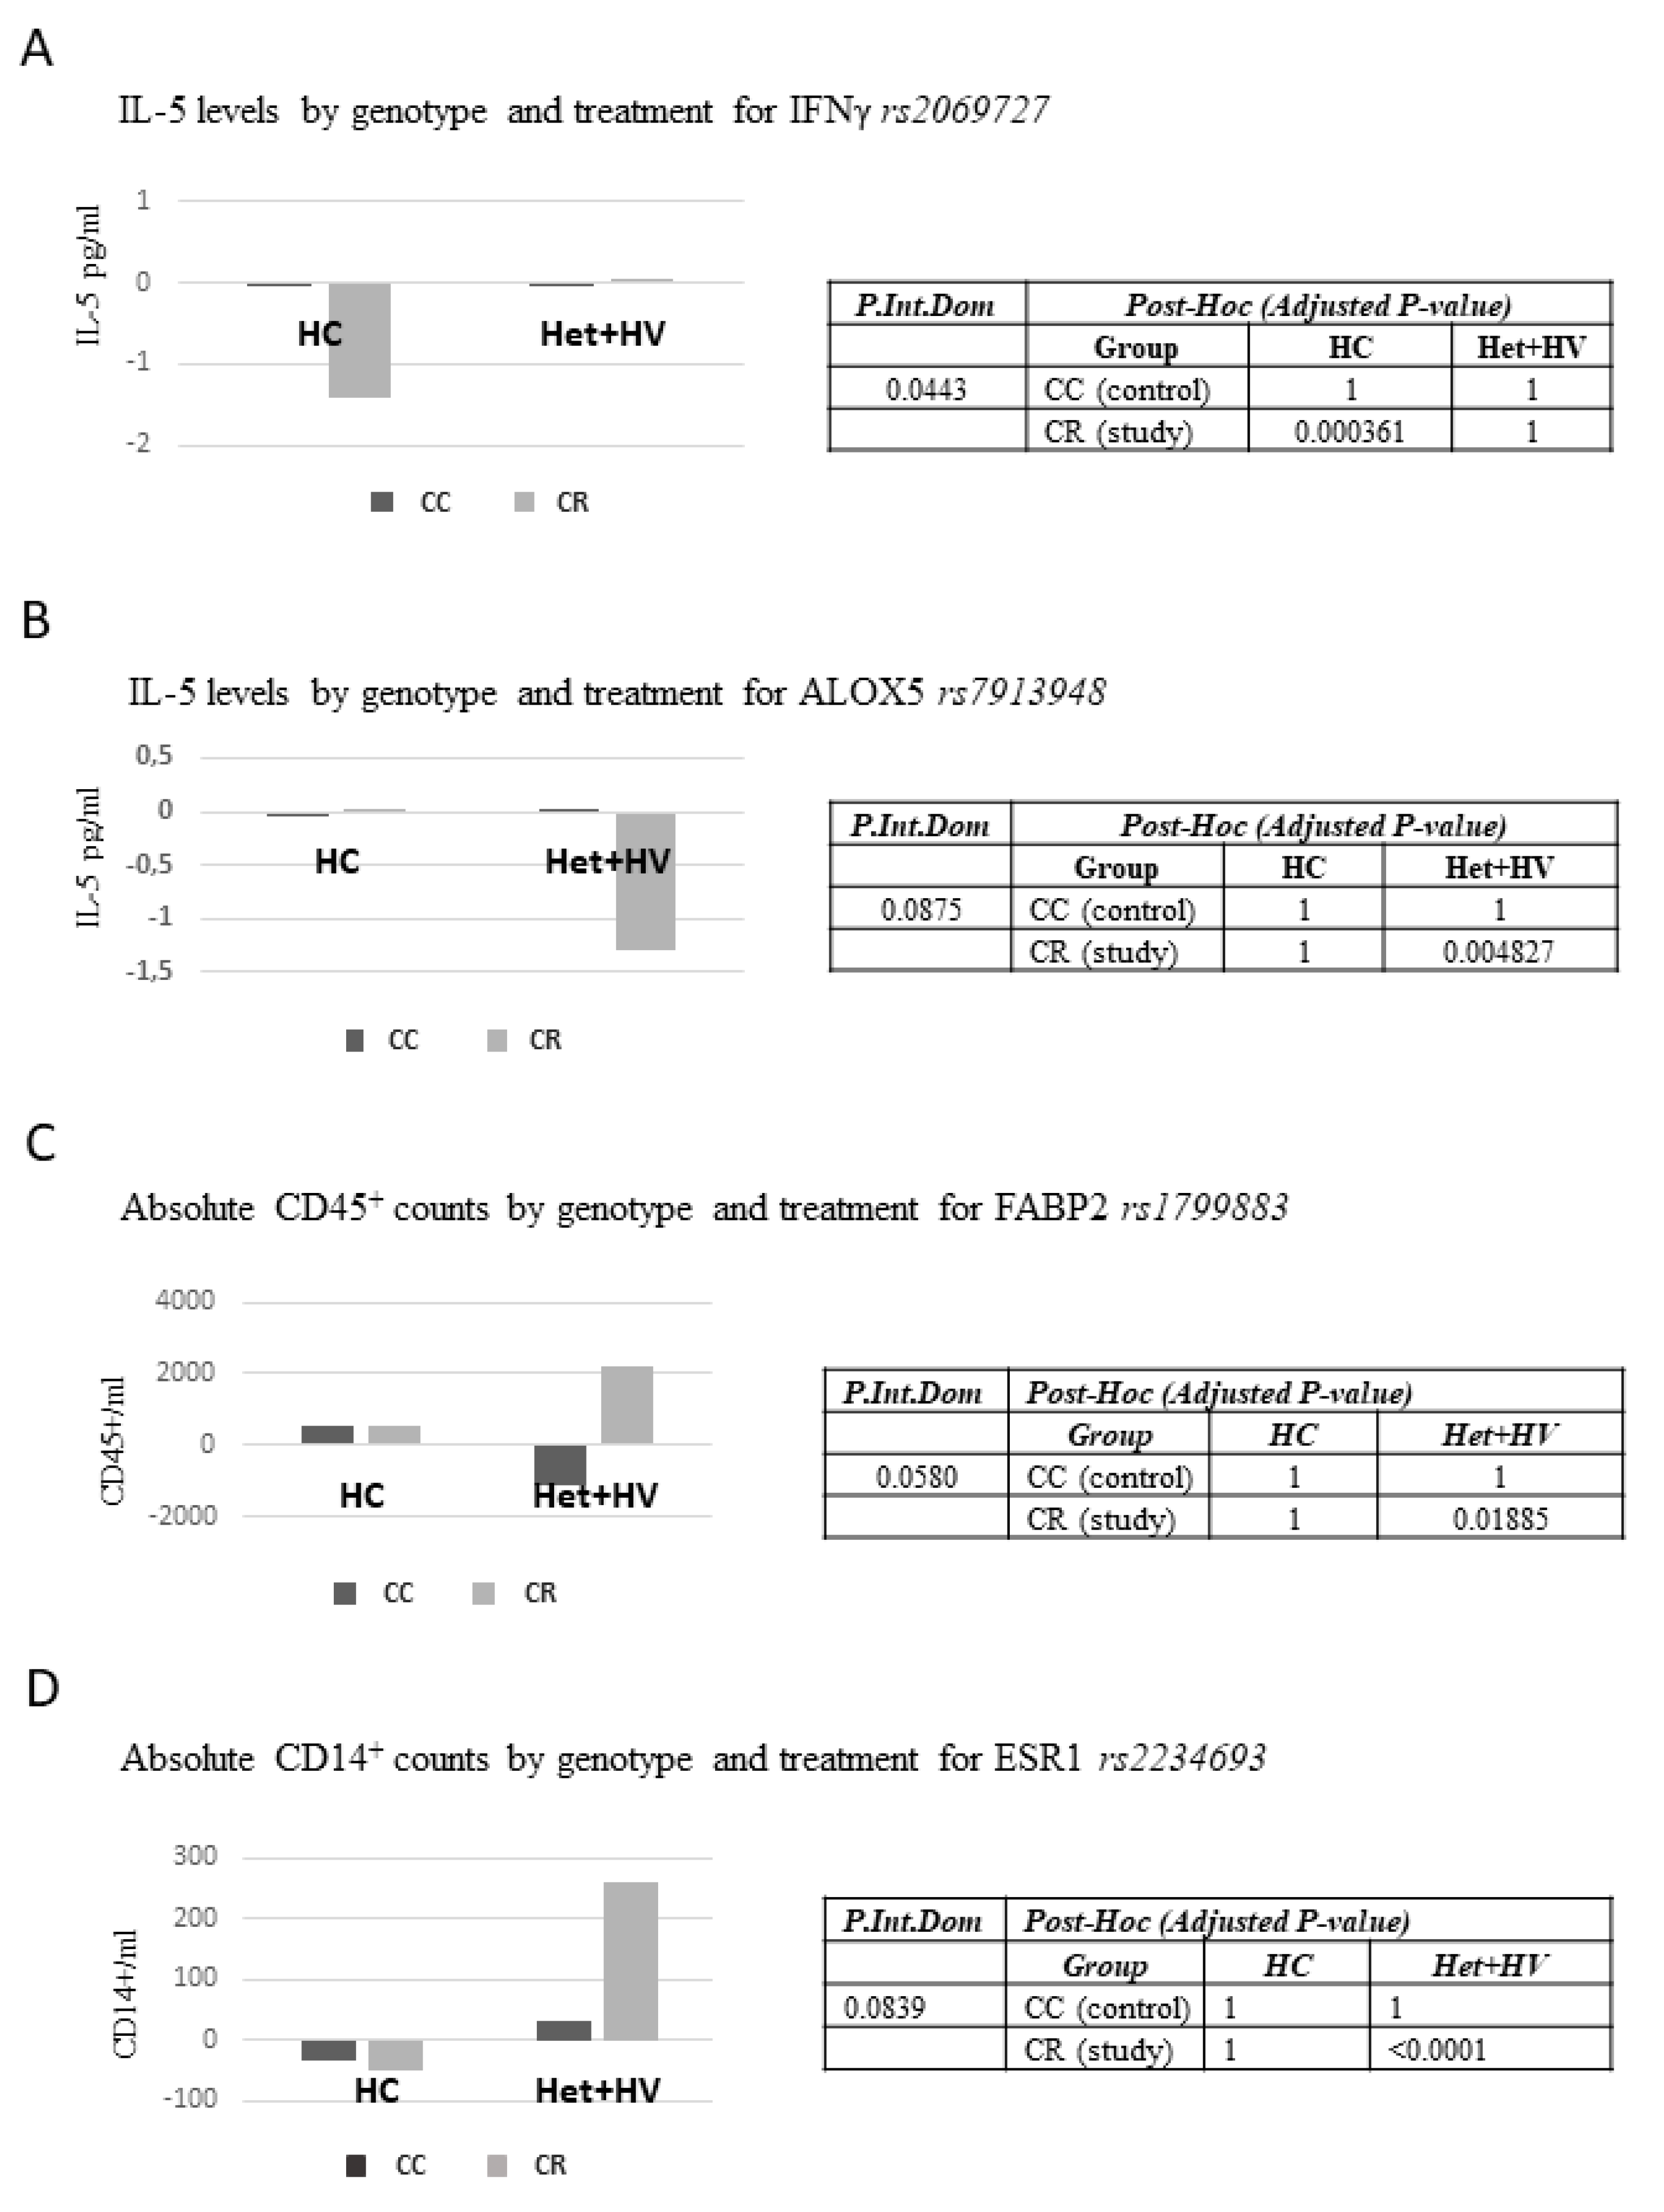
3.5. Associations Between Different Genetic Variants (Single Nucleotide Polymorphisms, SNPs) and Responses to the Dietary Intervention with the Capsules
4. Discussion
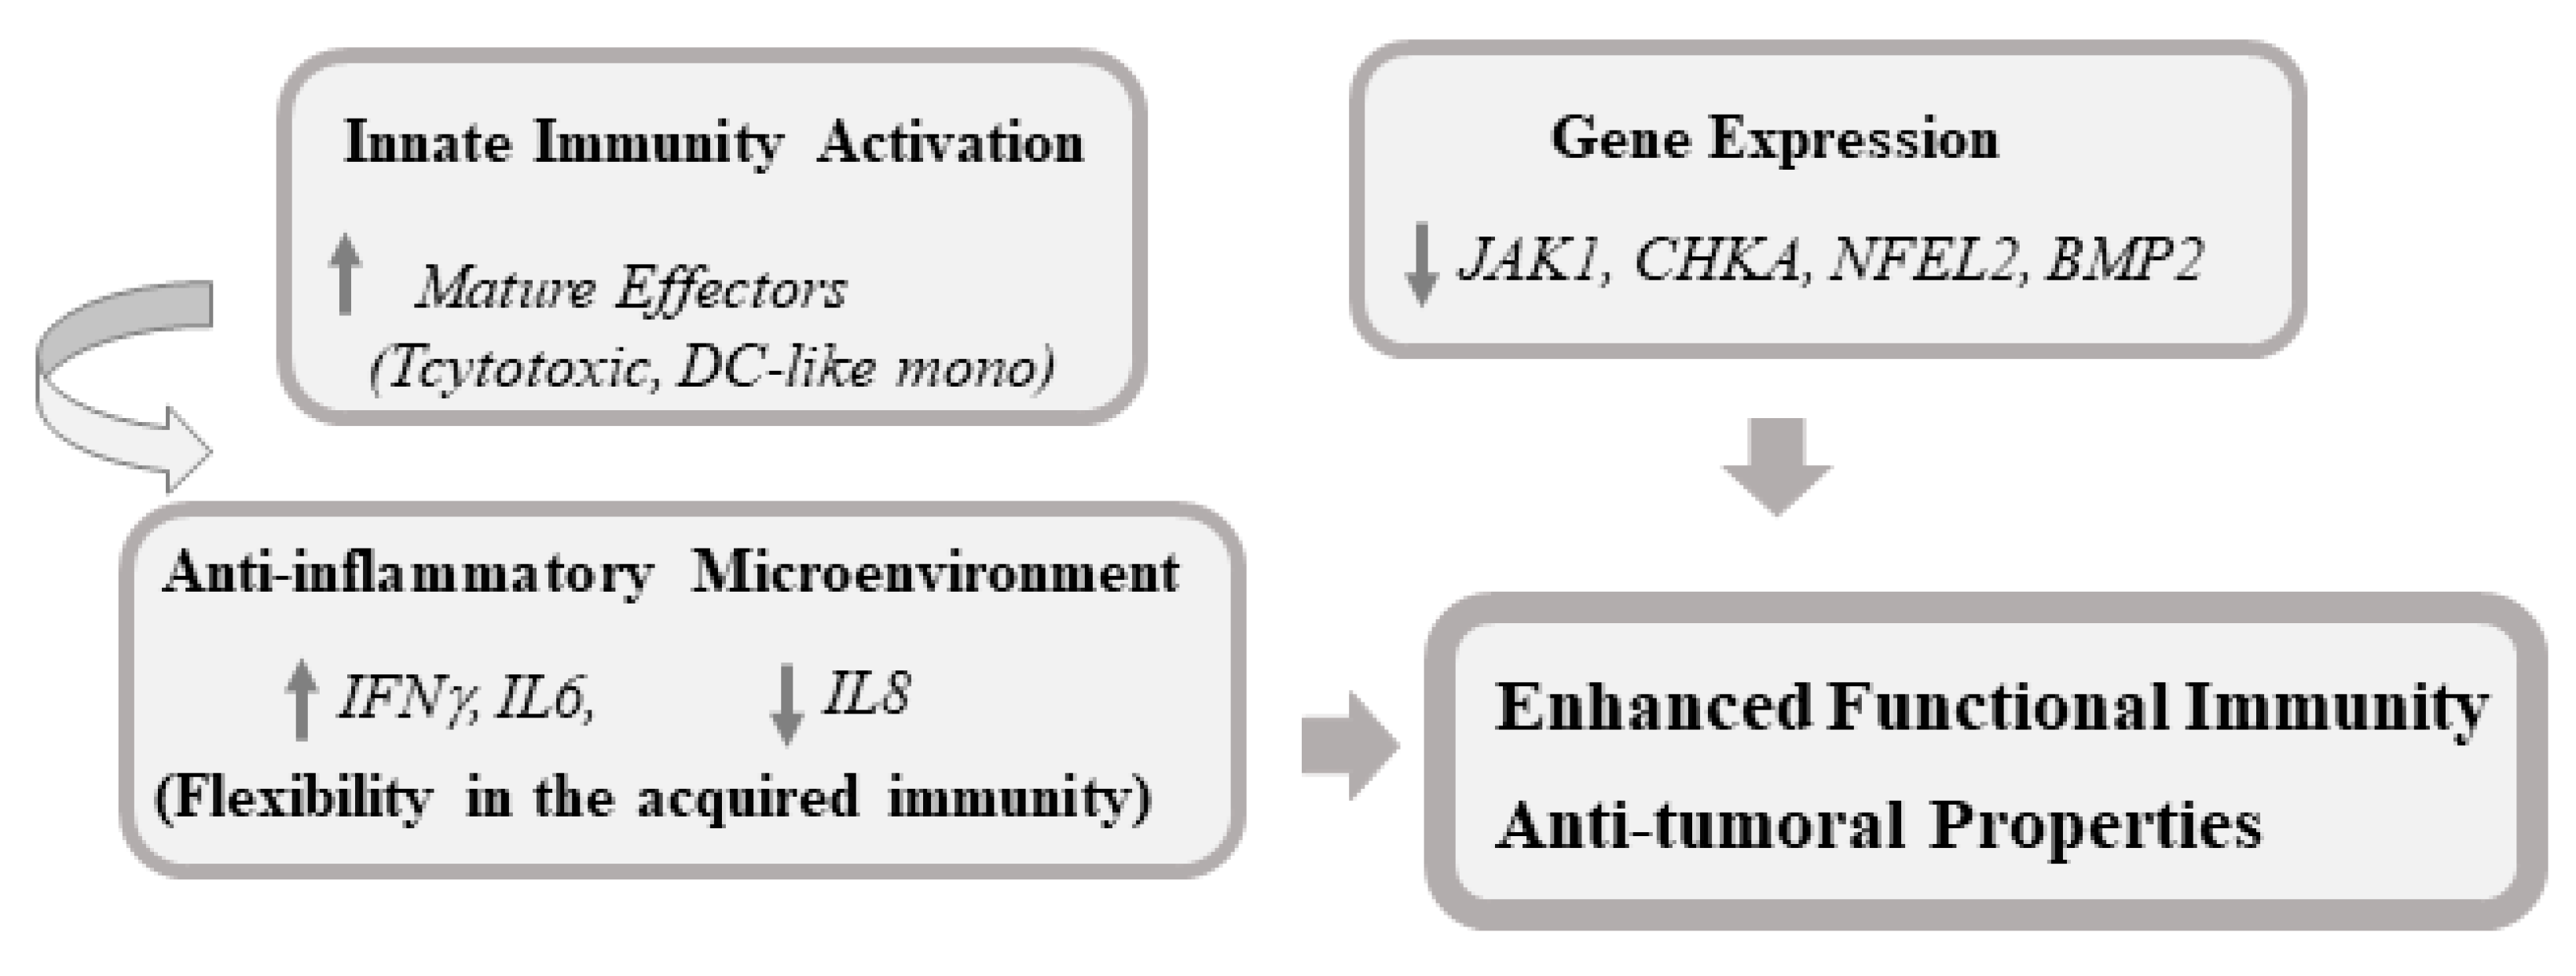
5. Conclusions
Supplementary Materials
Author Contributions
Funding
Acknowledgments
Conflicts of Interest
Abbreviations
| AKG | Alkylglycerols |
| AP | Alkaline phosphatase |
| APC | Antigen-presenting cell |
| Bil | Bilirubin |
| BMI | Body mass index |
| BMP2 | Bone morphogenetic protein 2 |
| CHKA | Choline kinase A |
| CRP | C reactive protein |
| CC | Control capsules |
| CR | Intervention capsules |
| DC | Dendritic cell |
| GGT | Gamma glutamyltransferase |
| GOT | Glutamyl oxaloacetic transaminase |
| GPT | Glutamic-pyruvatetransaminase |
| HDL | High-density lipoprotein |
| IFN | Interferon |
| IL | Interleukin |
| JAK1 | Janus kinase 1 |
| LDL | Low-density lipoprotein |
| LPS | Lipopolysaccharide |
| Mθ | Macrophages |
| MC | Monocytes |
| NFE2L2 | Nuclear factor (erythroid-derived 2)-like 2 |
| PBMC | Peripheral blood mononuclear cells |
| PCA | Principal component analysis |
| RE | Rosmarinus officinalis L. extract |
References
- Suchner, U.; Kuhn, K.S.; Furst, P. The scientific basis of immunonutrition. Proc. Nutr. Soc. 2000, 59, 553–563. [Google Scholar] [CrossRef] [PubMed] [Green Version]
- Senatore, F.J.; Murali, S.; Dasanu, A.C. Accelerated Premalignant Polyposis and Second Colon Cancers: Incriminating Immunosuppression, Radiotherapy, and Systemic Chemotherapy Agents. J. Gastrointest. Cancer 2016, 47, 152–156. [Google Scholar] [CrossRef] [PubMed]
- Watt, S.K.; Hasselbalch, H.C.; Skov, V.; Kjær, L.; Thomassen, M.; Kruse, T.A.; Burton, M.; Gögenur, I. Whole Blood Gene Expression Profiling in patients undergoing colon cancer surgery identifies differential expression of genes involved in immune surveillance, inflammation and carcinogenesis. Surg. Oncol. 2018, 27, 208–215. [Google Scholar] [CrossRef] [PubMed]
- Andrews, F.J.; Griffiths, R.D. Glutamine: Essential for immune nutrition in the critically ill. Br. J. Nutr. 2002, 87 (Suppl. S1), S3–S8. [Google Scholar] [CrossRef]
- Grimble, G.K.; Westwood, O.M. Nucleotides as immunomodulators in clinical nutrition. Curr. Opin. Clin. Nutr. Metab. Care 2001, 4, 57–64. [Google Scholar] [CrossRef] [PubMed]
- Weiss, G.; Meyer, F.; Matthies, B.; Pross, M.; Koenig, W.; Lippert, H. Immunomodulation by perioperative administration of n-3 fatty acids. Br. J. Nutr. 2002, 87 (Suppl. S1), S89–S94. [Google Scholar] [CrossRef]
- Arends, J.; Bachmann, P.; Baracos, V.; Barthelemy, N.; Bertz, H.; Bozzetti, F.; Fearon, K.; Hütterer, E.; Isenring, E.; Kaasa, S.; et al. ESPEN guidelines on nutrition in cancer patients. Clin. Nutr. 2017, 36, 11–48. [Google Scholar] [CrossRef] [PubMed]
- August, D.A.; Huhmann, M.B.A.S.P.E.N. clinical guidelines: Nutrition support therapy during adult anticancer treatment and in hematopoietic cell transplantation. JPEN J. Parenter. Enter. Nutr. 2009, 33, 472–500. [Google Scholar] [CrossRef]
- Song, G.M.; Tian, X.; Liang, H.; Yi, L.J.; Zhou, J.G.; Zeng, Z.; Shuai, T.; Ou, Y.X.; Zhang, L.; Wang, Y. Role of Enteral Immunonutrition in Patients Undergoing Surgery for Gastric Cancer: A Systematic Review and Meta-Analysis of Randomized Controlled Trials. Medicine (Baltim.) 2015, 94, e1311. [Google Scholar] [CrossRef]
- Jain, A.; Pasare, C. Innate Control. of Adaptive Immunity: Beyond the Three-Signal Paradigm. J. Immunol. 2017, 198, 3791–3800. [Google Scholar] [CrossRef]
- Gaudino, S.J.; Kumar, P. Presenting Cells and T Cells Impacts Intestinal Homeostasis, Bacterial Infections, and Tumorigenesis. Front. Immunol. 2019, 6, 360. [Google Scholar] [CrossRef] [PubMed]
- Corzo-Martínez, M.; Vázquez, L.; Arranz-Martínez, P.; Menéndez, N.; Reglero, G.; Torres, C.F. Production of a bioactive lipid-based delivery system from radish liver oil by enzymatic glycerolysis. Food Bioprod. Process. 2017, 100, 311–322. [Google Scholar] [CrossRef]
- Gonzalez-Vallinas, M.; Reglero, G.; de Molina, A.R. Rosemary (Rosmarinus officinalis L.) Extract as a Potential Complementary Agent in Anticancer Therapy. Nutr. Cancer 2015, 67, 1221–1229. [Google Scholar] [PubMed]
- Gonzalez-Vallinas, M.; Molina, S.; Vicente, G.; de la Cueva, A.; Vargas, T.; Santoyo, S.; García-Risco, M.R.; Fornari, T.; Reglero, G.; Ramírez de Molina, A. Antitumor effect of 5-fluorouracil is enhanced by rosemary extract in both drug sensitive and resistant colon cancer cells. Pharm. Res. 2013, 72, 61–68. [Google Scholar] [CrossRef] [PubMed]
- Gonzalez-Vallinas, M.; González-Castejón, M.; Rodríguez-Casado, A.; Ramírez de Molina, A. Dietary phytochemicals in cancer prevention and therapy: A complementary approach with promising perspectives. Nutr. Rev. 2013, 71, 585–599. [Google Scholar] [CrossRef]
- Livak, K.J.; Schmittgen, T.D. Analysis of relative gene expression data using real-time quantitative PCR and the 2(-Delta Delta C(T)) Method. Methods 2001, 25, 402–408. [Google Scholar] [CrossRef]
- Ahmad, R.; Kumar, B.; Chen, Z.; Chen, X.; Müller, D.; Lele, S.M.; Washington, M.K.; Batra, S.K.; Dhawan, P.; Singh, A.B. Loss of claudin-3 expression induces IL6/gp130/Stat3 signaling to promote colon cancer malignancy by hyperactivating Wnt/beta-catenin signaling. Oncogene 2017, 36, 6592–6604. [Google Scholar] [CrossRef]
- Chen, J.; Ivashkiv, L.B. IFN-gamma abrogates endotoxin tolerance by facilitating Toll-like receptor-induced chromatin remodeling. Proc. Natl. Acad. Sci. USA 2010, 107, 19438–19443. [Google Scholar] [CrossRef]
- Pugliese, P.T.; Jordan, K.; Cederberg, H.; Brohult, J. Some biological actions of alkylglycerols from shark liver oil. J. Altern. Complement. Med. 1998, 4, 87–99. [Google Scholar] [CrossRef]
- Lewkowicz, P.; Banasik, M.; Głowacka, E.; Lewkowicz, N.; Tchórzewski, H. Effect of high doses of shark liver oil supplementation on T cell polarization and peripheral blood polymorphonuclear cell function. Pol. Merkur. Lek. 2005, 18, 686–692. [Google Scholar]
- Deniau, A.L.; Mosset, P.; Pédrono, F.; Mitre, R.; Le Bot, D.; Legrand, A.B. Multiple beneficial health effects of natural alkylglycerols from shark liver oil. Mar. Drugs 2010, 8, 2175–2184. [Google Scholar] [CrossRef] [PubMed]
- Deniau, A.L.; Mosset, P.; Le Bot, D.; Legrand, A.B. Which alkylglycerols from shark liver oil have anti-tumour activities? Biochimie 2011, 93, 1–3. [Google Scholar] [CrossRef] [PubMed]
- Molina, S.; Moran-Valero, M.I.; Martin, D.; Vázquez, L.; Vargas, T.; Torres, C.F.; Ramirez de Molina, A.; Reglero, G. Antiproliferative effect of alkylglycerols as vehicles of butyric acid on colon cancer cells. Chem. Phys. Lipids 2013, 175–176, 50–56. [Google Scholar] [CrossRef] [PubMed]
- Iannitti, T.; Palmieri, B. An update on the therapeutic role of alkylglycerols. Mar. Drugs 2010, 8, 2267–2300. [Google Scholar] [CrossRef] [PubMed]
- Park, M.Y.; Mun, S.T. Carnosic acid inhibits TLR4-MyD88 signaling pathway in LPS-stimulated 3T3-L1 adipocytes. Nutr. Res. Pract. 2014, 8, 516–520. [Google Scholar] [CrossRef] [PubMed] [Green Version]
- Yoshida, S.; Shime, H.; Funami, K.; Takaki, H.; Matsumoto, M.; Kasahara, M.; Seya, T. The Anti-Oxidant Ergothioneine Augments the Immunomodulatory Function of TLR Agonists by Direct Action on Macrophages. PLoS ONE 2017, 12, e0169360. [Google Scholar] [CrossRef] [PubMed]
- Yamamoto, N.; St Claire, D.A., Jr.; Homma, S.; Ngwenya, B.Z. Activation of mouse macrophages by alkylglycerols, inflammation products of cancerous tissues. Cancer Res. 1988, 48, 6044–6049. [Google Scholar] [PubMed]
- Vitorino, D.C.; Buzzachera, C.F.; Curi, R.; Fernandes, L.C. Effect of chronic supplementation with shark liver oil on immune responses of exercise-trained rats. Eur. J. Appl. Physiol. 2010, 108, 1225–1232. [Google Scholar] [CrossRef]
- Mantovani, A.; Sica, A.; Sozzani, S.; Allavena, P.; Vecchi, A.; Locati, M. The chemokine system in diverse forms of macrophage activation and polarization. Trends Immunol. 2004, 25, 677–686. [Google Scholar] [CrossRef]
- Ucer, U.; Scheurich, P.; Bartsch, H.; Berkovic, D.; Ertel, C.; Pfizenmaier, K. Specific membrane receptors for human interferon-gamma (IFN-gamma). Behring Inst. Mitt. 1987, 81, 88–97. [Google Scholar]
- Cassetta, L.; Pollard, J.W. Cancer immunosurveillance: Role of patrolling monocytes. Cell Res. 2016, 26, 3–4. [Google Scholar] [CrossRef]
- Stuart, E.; Scheurich, P.; Bartsch, H.; Berkovic, D.; Ertel, C.; Pfizenmaier, K. Therapeutic inhibition of Jak activity inhibits progression of gastrointestinal tumors in mice. Mol. Cancer 2014, 13, 468–474. [Google Scholar] [CrossRef]
- An, H.J.; Choi, E.K.; Kim, J.S.; Hong, S.W.; Moon, J.H.; Shin, J.S.; Ha, S.H.; Kim, K.P.; Hong, Y.S.; Lee, J.L.; et al. INCB018424 induces apoptotic cell death through the suppression of pJAK1 in human colon cancer cells. Neoplasma 2014, 61, 56–62. [Google Scholar] [CrossRef] [Green Version]
- DeNicola, G.M.; Karreth, F.A.; Humpton, T.J.; Gopinathan, A.; Wei, C.; Frese, K.; Mangal, D.; Yu, K.H.; Yeo, C.J.; Calhoun, E.S.; et al. Oncogene-induced Nrf2 transcription promotes ROS detoxification and tumorigenesis. Nature 2011, 475, 106–109. [Google Scholar] [CrossRef]
- Kim, B.R.; Oh, S.C.; Lee, D.H.; Kim, J.L.; Lee, S.Y.; Kang, M.H.; Lee, S.I.; Kang, S.; Joung, S.Y.; Min, B.W. BMP-2 induces motility and invasiveness by promoting colon cancer stemness through STAT3 activation. Tumour Biol. 2015, 36, 9475–9486. [Google Scholar] [CrossRef]
- Ramirez de Molina, A.; Penalva, V.; Lucas, L.; Lacal, J.C. Regulation of choline kinase activity by Ras proteins involves Ral-GDS and PI3K. Oncogene 2002, 21, 937–946. [Google Scholar] [CrossRef]
- Ramirez de Molina, A.; Sarmentero-Estrada, J.; Belda-Iniesta, C.; Tarón, M.; Ramírez de Molina, V.; Cejas, P.; Skrzypski, M.; Gallego-Ortega, D.; de Castro, J.; Casado, E.; et al. Expression of choline kinase alpha to predict outcome in patients with early-stage non-small-cell lung cancer: A retrospective study. Lancet Oncol. 2007, 8, 889–897. [Google Scholar] [CrossRef]
- Janardhan, S.; Srivani, P.; Sastry, G.N. Choline kinase: An important target for cancer. Curr. Med. Chem. 2006, 13, 1169–1186. [Google Scholar] [CrossRef]
- Ramirez de Molina, A.; Gallego-Ortega, D.; Sarmentero-Estrada, J.; Lagares, D.; Gómez Del Pulgar, T.; Bandrés, E.; García-Foncillas, J.; Lacal, J.C. Choline kinase as a link connecting phospholipid metabolism and cell cycle regulation: Implications in cancer therapy. Int. J. Biochem. Cell Biol. 2008, 40, 1753–1763. [Google Scholar] [CrossRef]
- Jackaman, C.; Tomay, F.; Duong, L.; Abdol Razak, N.B.; Pixley, F.J.; Metharom, P.; Nelson, D.J. Aging and cancer: The role of macrophages and neutrophils. Ageing Res. Rev. 2017, 36, 105–116. [Google Scholar] [CrossRef]
- Calvo-Rodríguez, M.; de la Fuente, C.; García-Durillo, M.; García-Rodríguez, C.; Villalobos, C.; Núñez, L. Aging and amyloid β oligomers enhance TLR4 expression, LPS-induced Ca2+ responses, and neuron cell death in cultured rat hippocampal neurons. J. Neuroinflamm. 2017, 14, 24. [Google Scholar] [CrossRef]


| Group CC (n = 28) | Group CR (n = 30) | p | |
|---|---|---|---|
| Age | 28.32 ± 11.39 | 27.5 ± 9.04 | 0.963 |
| Hemogram | |||
| Leucocytes (10.3/µL) | 6.42 ± 1.62 | 6.33 ± 1.83 | 0.856 |
| Hemoglobin (g/dL) | 13.57 ± 1.2 | 13.61 ± 1.43 | 0.896 |
| Eritrocytes (10.6/µL) | 4.52 ± 0.35 | 4.57 ± 0.42 | 0.669 |
| Platelets (10.3/µL) | 231.64 ± 42.35 | 236.1 ± 47.38 | 0.846 |
| Lipidic Profile | |||
| TC (mg/dL) | 174.21 ± 25.90 | 184.26 ± 29.78 | 0.319 |
| HDL (mg/dL) | 58.64 ± 10.28 | 61.64 ± 9.57 | 0.255 |
| LDL (mg/dL) | 101 ± 26.02 | 108.25 ± 27.00 | 0.302 |
| TG (mg/dL) | 72.82 ± 33.20 | 71.8 ± 31.07 | 0.904 |
| Oxidation-inflammation markers | |||
| CRPus (mg/dL) | 0.12 ± 0.15 | 0.09 ± 0.01 | 0.308 |
| LDL-ox (U/L) | 36.91 ± 11.00 | 37.09 ± 11.08 | 0.95 |
| Isoprostanes (ng/mL) | 1.06 ± 0.55 | 1.23 ± 0.91 | 0.853 |
| Tromboxanes (ng/mL) | 983.05 ± 1149.57 | 1193.59 ± 1662.67 | 0.783 |
| IFNg (pg/mL) | 6.80 ± 8.00 | 5.27 ± 5.92 | 0.619 |
| IL 10 (pg/mL) | 621.51 ± 1065.24 | 926.88 ± 1692.32 | 0.987 |
| IL 1β (pg/mL) | 1361.55 ± 833.3 | 1005.92 ± 825.92 | 0.05 |
| IL 2 (pg/mL) | 0.44 ± 0.24 | 0.45 ± 0.22 | 0.73 |
| IL 4 (pg/mL) | 2.95 ± 1.55 | 3.19 ± 1.77 | 0.363 |
| IL 5 (pg/mL) | 0.44 ± 0.22 | 0.84 ± 1.22 | 0.844 |
| TNFα (pg/mL) | 1940.55 ± 546.88 | 1671.57 ± 666.93 | 0.107 |
| Anthropometric data | |||
| Weight (kg) | 63.11 ± 8.10 | 65.57 ± 8.31 | 0.258 |
| BMI (kg/m2) | 22.4 ± 2.34 | 22.54 ± 2.19 | 0.984 |
| Waist (cm) | 78.18 ± 7.33 | 80.96 ± 9.96 | 0.23 |
| Hip (cm) | 98.69 ± 5.01 | 97.38 ± 8.00 | 0.456 |
| T Fat Mass (%) | 27.36 ± 8.11 | 25.6 ± 9.52 | 0.455 |
| T Muscle Mass (%) | 32.2 ± 6.05 | 33.92 ± 7.08 | 0.497 |
| Vital constants | |||
| SBP | 116 ± 12.12 | 118.03 ± 15.35 | 0.577 |
| DBP | 68.79 ± 6.97 | 69.17 ± 8.91 | 0.856 |
| (A) Liver Enzymes, Total Bilirubin, Creatinine | |||||||||
| CC (Control) | CR (Study) | Effect * | |||||||
| V1 | V2 | V3 | V1 | V2 | V3 | Visit | Group | Visit × Group | |
| GOT (UI/L) | 18.26 (0.73) | 18.26 (1.05) | 18.07 (0.75) | 19.7 (0.86) | 18.63 (0.84) | 20.57 (0.9) | 0.2416 | 0.1512 | 0.1512 |
| GPT (UI/L) | 17.74 (1.4) | 16.15 (1.21) | 15.7 (1.31) | 18.83 (1.47) | 16.2 (1.26) | 18.63 (1.42) | 0.0065 | 0.368 | 0.0794 |
| GGT (UI/L) | 17.99 (2.18) | 16.01 (1.5) | 15.24 (1.04) | 18.63 (1.3) | 17.46 (1.14) | 18.36 (1.21) | 0.0187 | 0.2867 | 0.1182 |
| AP (UI/L) | 57.07 (4.21) | 56.19 (3.39) | 57.07 (3.66) | 54.2 (3.37) | 54.83 (2.67) | 56.97 (2.89) | 0.2637 | 0.741 | 0.4248 |
| TBil (mg/dL) | 0.77 (0.08) | 0.7 (0.08) | 0.71 (0.08) | 0.79 (0.06) | 0.7 (0.06) | 0.65 (0.05) | 0.038 | 0.9484 | 0.4705 |
| Creatinine (mg/dL) | 0.79 (0.02) | - | 0.83 (0.02) | 0.8 (0.02) | - | 0.85 (0.02) | <0.001 | 0.5661 | 0.5346 |
| (B) Vital Constants | |||||||||
| CC (Control) | CR (Study) | Effect * | |||||||
| V1 | V3 | V1 | V3 | Visit | Group | Visit × Group | |||
| SBP (mmHg) | 115.85 (2.28) | 110.69 (2.31) | 118.03 (2.8) | 115.37 (2.63) | 0.0091 | 0.1588 | 0.3909 | ||
| DBP (mmHg) | 69 (1.21) | 69.88 (1.7) | 69.17 (1.65) | 69.28 (1.64) | 0.6083 | 0.9966 | 0.6844 | ||
| HR (beat/min) | 71.38 (2.46) | 70.08 (2.34) | 67.21 (2.59) | 66.1 (1.94) | 0.3559 | 0.1254 | 0.9132 | ||
| (C) Hematological Profile | |||||||||
| CC (Control) | CR (Study) | Effect * | |||||||
| V1 | V3 | V1 | V3 | Visit | Group | Visit × Group | |||
| Erythrocytes (10.6/µL) | 4.53 (0.07) | 4.42 (0.07) | 4.57(0.08) | 4.46 (0.08) | <0.001 | 0.5753 | 0.8106 | ||
| Erythrocytes (%) | 40.84 (0.57) | 39.73 (0.58) | 40.95 (0.7) | 39.94 (0.67) | <0.001 | 0.5927 | 0.8402 | ||
| Hemoglobin (g/dL) | 13.63 (0.23) | 13.47 (0.22) | 13.61 (0.26) | 13.52 (0.25) | 0.0792 | 0.7324 | 0.6625 | ||
| Leukocytes (10.3/µL) | 6.4 (0.32) | 6.01 (0.29) | 6.33 (0.33) | 6.5 (0.32) | 0.6178 | 0.6266 | 0.1667 | ||
| Lymphocytes (10.3/µL) | 2.15 (0.09) | 2.14 (0.1) | 2.2 (0.09) | 2.3 (0.14) | 0.408 | 0.4449 | 0.3247 | ||
| Neutrophils (10.3/µL) | 3.53 (0.28) | 3.2 (0.22) | 3.41 (0.28) | 3.47 (0.23) | 0.4645 | 0.8303 | 0.2574 | ||
| Monocytes (10.3/µL) | 0.53 (0.03) | 0.5 (0.03) | 0.51 (0.02) | 0.5 (0.02) | 0.2564 | 0.7444 | 0.4594 | ||
| Basophils (10.3/µL) | 0.06 (0) | 0.05 (0) | 0.07 (0) | 0.06 (0) | <0.001 | 0.0962 | 0.9151 | ||
| Platelets (10.3/µL) | 231.33 (8.3) | 217.59 (7.78) | 236.1 (8.65) | 228.67 (8.26) | 0.0048 | 0.4715 | 0.3886 | ||
| (A) Markers of Inflammation and Oxidation | |||||||
| CC (Control) | CR (Study) | Effect * | |||||
| V1 | V3 | V1 | V3 | Visit | Group | Visit × Group | |
| LDLox (U/L) | 36.91 (2.12) | 34.15 (1.81) | 37.09 (2.02) | 38.66 (2.14) | 0.5902 | 0.3653 | 0.0196 |
| T isop (ng/mg creat) | 0.87 (0.08) | 0.84 (0.06) | 0.8 (0.09) | 0.95 (0.07) | 0.3129 | 0.8948 | 0.1045 |
| TXB2 (ng/mg creat) | 713.1 (128.16) | 709.39 (120.37) | 713.74 (178.88) | 879.44 (187.51) | 0.5506 | 0.7363 | 0.4338 |
| CRP (mg/dL) | 0.11 (0.03) | 0.09 (0.02) | 0.09 (0.02) | 0.07 (0.01) | 0.0826 | 0.1725 | 0.7098 |
| (B) Lipid Profile | |||||||
| CC (Control) | CR (Study) | Effect * | |||||
| V1 | V3 | V1 | V3 | Visit | Group | Visit × Group | |
| TC (mg/dL) | 174.96 (5.02) | 171.05 (5.02) | 184.26 (5.44) | 185.77 (5.93) | 0.6062 | 0.0723 | 0.1745 |
| HDL (mg/dL) | 58.41 (2) | 65.67 (2.65) | 61.64 (1.75) | 65.59 (2.7) | <0.001 | 0.6235 | 0.1491 |
| TG (mg/dL) | 73.19 (6.5) | 70.74 (5.9) | 71.8 (5.67) | 75.2 (7.73) | 0.8527 | 0.8138 | 0.4571 |
| LDL (mg/dL) | 101.91 (5.02) | 91.23 (5.29) | 108.25 (4.93) | 105.13 (5.6) | <0.001 | 0.1078 | 0.0434 |
| (C) Anthropometric Data | |||||||
| CC (Control) | CR (Study) | Effect * | |||||
| V1 | V3 | V1 | V3 | Visit | Group | Visit × Group | |
| Weight (kg) | 63.11 (1.59) | 62.57 (1.58) | 65.57 (1.52) | 65.35 (1.58) | 0.0222 | 0.0276 | 0.3273 |
| BMI (kg/m2) | 22.3 (0.45) | 22.11 (0.42) | 22.54 (0.4) | 22.46 (0.39) | 0.0031 | <0.001 | 0.3137 |
| FM (%) | 26.95 (1.57) | 26.02 (1.56) | 25.6 (1.74) | 25.5 (1.71) | 0.0125 | 0.228 | 0.0523 |
| MM (%) | 32.42 (1.19) | 32.92 (1.2) | 33.92 (1.29) | 33.92 (1.3) | 0.0727 | 0.0761 | 0.0787 |
| Wc(cm) | 78.11 (1.43) | 77.75 (1.37) | 80.96 (1.82) | 79.14 (1.19) | 0.2267 | 0.0954 | 0.4164 |
| Cluster Differentiation Markers Counts | |||||||
|---|---|---|---|---|---|---|---|
| CC (Control) | CR (Study) | Effect * | |||||
| V1 | V3 | V1 | V3 | Visit | Group | Visit × Group | |
| CD45+ (cs/mL) | 6458.99 (457.29) | 6231.24 (474.55) | 6260.18 (403.99) | 7764.86 (378.69) | 0.0491 | 0.2578 | 0.0207 |
| CD3+ (cs/mL)∆ | 1615.72 (124.1) | 1744.94 (140.34) | 1581.5 (93.34) | 2012.5 (161.31) | 0.0018 | 0.5577 | 0.0678 |
| CD4+ (cs/mL)∆ | 960.67 (66.18) | 1045.5 (77.89) | 902.11 (59.85) | 1149.33 (89.98) | <0.001 | 0.9008 | 0.0714 |
| CD8+ (cs/mL) ∆ | 526.94 (68.13) | 555.56 (63.82) | 524.28 (36.67) | 667.11 (62.62) | 0.0047 | 0.5025 | 0.0563 |
| CD14+ (cs/mL) | 473.06 (39.68) | 471.22 (40.84) | 409.94 (28.53) | 565.72 (42.81) | 0.0144 | 0.7858 | 0.0126 |
| CD16+ (cs/mL) | 3485.56 (362.15) | 3183.78 (310.67) | 3253.83 (274.68) | 3935.72 (224.94) | 0.365 | 0.3393 | 0.0318 |
| CD56+ (cs/mL) | 429.61 (51.53) | 407.78 (46.1) | 415.33 (40.05) | 516.11 (50.95) | 0.2417 | 0.4904 | 0.0716 |
© 2019 by the authors. Licensee MDPI, Basel, Switzerland. This article is an open access article distributed under the terms and conditions of the Creative Commons Attribution (CC BY) license (http://creativecommons.org/licenses/by/4.0/).
Share and Cite
Gómez de Cedrón, M.; Laparra, J.M.; Loria-Kohen, V.; Molina, S.; Moreno-Rubio, J.; Montoya, J.J.; Torres, C.; Casado, E.; Reglero, G.; Ramírez de Molina, A. Tolerability and Safety of a Nutritional Supplement with Potential as Adjuvant in Colorectal Cancer Therapy: A Randomized Trial in Healthy Volunteers. Nutrients 2019, 11, 2001. https://doi.org/10.3390/nu11092001
Gómez de Cedrón M, Laparra JM, Loria-Kohen V, Molina S, Moreno-Rubio J, Montoya JJ, Torres C, Casado E, Reglero G, Ramírez de Molina A. Tolerability and Safety of a Nutritional Supplement with Potential as Adjuvant in Colorectal Cancer Therapy: A Randomized Trial in Healthy Volunteers. Nutrients. 2019; 11(9):2001. https://doi.org/10.3390/nu11092001
Chicago/Turabian StyleGómez de Cedrón, Marta, José Moises Laparra, Viviana Loria-Kohen, Susana Molina, Juan Moreno-Rubio, Juan Jose Montoya, Carlos Torres, Enrique Casado, Guillermo Reglero, and Ana Ramírez de Molina. 2019. "Tolerability and Safety of a Nutritional Supplement with Potential as Adjuvant in Colorectal Cancer Therapy: A Randomized Trial in Healthy Volunteers" Nutrients 11, no. 9: 2001. https://doi.org/10.3390/nu11092001