Abstract
Plant-based diets are becoming increasingly popular, and scientific information concerning the nutritional status in this population is needed. This study determined the fatty acid profile of Spanish lacto-ovo vegetarians (LO-vegetarians) and vegans. Participants were 104 healthy adults, LO-vegetarians (n = 49) and vegans (n = 55). Lifestyle habits and consumption of food and omega-3 supplements were estimated by questionnaires. BMI, blood pressure, and abdominal and body fat were determined. Serum was collected to analyze fatty acids, glucose, lipids, homocysteine, insulin, and leptin. Volunteers were classified according to serum omega-6 to omega-3 (n-6/n-3) ratio into three groups: n-6/n-3 < 10, n-6/n-3 ≥ 10 to 20, and n-6/n-3 > 20. Results showed low cardiovascular risk and high insulin sensitivity with negligible differences between diet types. Linoleic acid (C18:2n-6) was the major serum fatty acid, followed by oleic (C18:1n-9) and palmitic (C16:0) acids. In contrast, serum eicosapentaenoic acid (EPA, C20:5n-3) and docosahexaenoic acid (DHA, C22:6n-3) were (median, interquartile range) 0.27, 0.18% and 1.59, and 0.93%, respectively. Users of n-3 supplements (<10% of total vegetarians) had significantly higher EPA than non-users, while frequent consumption of flax-seeds was associated with increased α-linolenic acid (C18:3n-3). However, neither n-3 supplementation nor food consumption affected DHA levels in this vegetarian population.
1. Introduction
Diets exclusively based on plant foods have become progressively common in developed countries. However, the scientific evidence concerning the nutritional status of this population is limited. Vegetarian diets are usually associated with the prevention of some diseases such as ischemic heart disease, obesity and type 2 diabetes [1]. Nevertheless, they may result in insufficient intake of several nutrients such vitamin B12, vitamin D, and essential fatty acids [2,3]. There are two essential polyunsaturated fatty acids (PUFAs) for human nutrition: linoleic acid (LA, C18:2n-6) and α-linolenic acid (ALA, C18:3n-3), of the n-6 and n-3 PUFAs pathways respectively. These fatty acids are substrates for long-chain PUFAs which exert important functions. LA is a precursor of arachidonic acid (AA, C20:4n-6), and ALA of eicosapentaenoic acid (EPA, C20:5n-3) and docosahexaenoic acid (DHA, C22:6n-3) [3]. In addition, the eicosanoids derived from the n-6 or n-3 pathways have pro-inflammatory or anti-inflammatory activities, respectively, [4] and these should be balanced for adequate health maintenance.
Vegetarian diets, of which the best characterized are lacto-ovo vegetarian (LO-vegetarian) and vegan, provide high intakes of n-6 but are low in n-3 PUFAs, as the principal dietary source of EPA and DHA is oily fish, which is absent in vegetarian diets. In this line, it has been observed that vegetarians have lower plasma concentrations of both fatty acids compared to omnivores [5], and there may be relevant health implications since these fatty acids are crucial for brain and retina development, and exert important neurological, anti-inflammatory, antithrombotic, and cognitive functions [6]. In this regard, it has been reported that Western diets have ratios of n-6/n-3 in the range of 15–20 and a ratio lower than 10 has been proposed [7], though there is no consensus on this issue [8,9].
Assessment of fatty acids intake can be based on dietary questionnaires and food composition databases. However, information on the composition of new foods and vegetarian foods is lacking or incomplete, which limits the applicability of this procedure. Currently, the use of intake biomarkers is preferred. Therefore, in the present study, serum fatty acids were analyzed as short-term intake markers [10,11].
Given that there is no available research on the relationship between plant-based diets and health biomarkers of Spanish vegetarians, the objectives of this study are: (1) to determine the fatty acid profile and cardiometabolic markers of Spanish vegetarians and characterize the possible differences between LO-vegetarian and vegans; (2) to evaluate whether this vegetarian population uses n-3 supplements or not and their effect on serum fatty acids; and (3) to determine if there are differences in cardiometabolic biomarkers according to n-6/n-3 ratio and the contribution of fat rich foods.
2. Materials and Methods
2.1. Study Design and Subjects
This study is part of a wider research with a cross-sectional design. Recruitment was performed in the area of Madrid, Spain, through different advertisements in web pages and social networks inviting healthy LO-vegetarian or vegan adults (age ≥18 years) to participate in this research. Exclusion criteria were: occasional meat or fish consumption, diagnosed digestive, renal, hematologic, endocrine or oncological diseases, eating disorders, pregnancy, lactation, and menopause. Initially, a total of 194 subjects were interested, of which 56 were excluded and 33 declined to participate. Finally, a total of 105 volunteers were selected for the study, of which 104 participated and gave consent to blood extraction (81 women and 23 men).
This study was conducted in accordance with the ethical principles expressed in the Declaration of Helsinki and was approved by the Clinical Research Ethics Committee of Puerta de Hierro University Hospital (Madrid) and the Ethics Committee of the Spanish National Research Council (CSIC). A written informed consent was obtained from all the participants.
2.2. Dietary Assessment, Anthropometric and Body Composition Measurements
Volunteers were asked to fill out an on-line lifestyle and food frequency questionnaires (FFQ) previously used by our research group [6]. Diet type, LO-vegetarian or vegan, consumption of n-3 supplements, smoking habits, physical activity, and educational level were assessed. Food consumption was classified from 0 to 5 according to the following frequency categories: once a month or less (0), two to four times a month (1), two to three times a week (2), four to six times a week (3), once a day (4), and twice a day or more (5). Supplement intake was classified from 0 to 4 as follows: never (0), one to 12 times a year (1), two to five times a month (2), two to six times a week (3) and daily (4). Food items being fat sources were considered, including nuts (walnuts, cashew nuts, almonds, peanuts, pistachio, soy nuts, pecans, Brazil nuts, and hazelnuts), seeds (pumpkin seeds, sesame seeds, sunflower seeds, flax-seeds, and poppy seeds), nut butters (cashew butter, peanut butter, almond butter, soy nut butter, and tahini), oils (olive oil, sunflower oil, soybean oil and canola oil), and others (avocado and olives).
Volunteers’ height, body weight, and waist and hip perimeters were measured. Body mass index (BMI) and body composition were obtained (Tanita BC-601, Tanita Ltd., Amsterdam, Netherlands).
2.3. Blood Sampling and Cardiometabolic Markers Determinations
Blood samples were collected in Vacuette Z Serum Sep Clot Activator tubes (Greiner Bio-One GmbH, Frickenhausen, Germany) at the Human Nutrition Unit (UNH) of the Institute of Food Science, Technology and Nutrition (ICTAN-CSIC, Madrid, Spain) from 8:00 h to 8:30 h, after a 12 h fasting overnight period. Serum was isolated by centrifugation in a Jouan CR-312 centrifuge (Jouan Ltd, Ilkeston, UK) at 1000 g for 15 min and samples were then stored at −30 °C for fatty acid analysis. Fatty acids were measured in serum because serum fatty acid levels are correlated with recent intake and reflect the dietary habits of the subjects at the time of the study [10,11]. Moreover, elaidic acid (ELA, C18:1n-9t) was analyzed as an unsaturated trans-fatty acids status indicator because it is the major trans-fatty acid found in hydrogenated vegetable oils.
Serum glucose, total cholesterol (TC), HDL-cholesterol (HDLc), LDL-cholesterol (LDLc), and triglycerides (TAG) were analyzed in the ADVIA Chemistry XPT System (Siemens, Erlangen, Germany). Homocysteine (Hcy) was analyzed by competitive immunoassay of direct chemiluminescent technology in an ADVIA Centaur XP autoanalyzer (Siemens). Insulin and leptin were determined by ELISA kits (DRG Instruments, Marburg, Germany). Blood pressure was measured using an automated digital oscillometric device (Omron model M6 Comfort, Omron Corporation, Tokyo, Japan). Insulin resistance (HOMA-IR) was estimated by the homeostasis model assessment index as [glucose (mg/dL) × insulin (µU/mL)]/405; and insulin sensitivity, by the quantitative insulin sensitivity check index (QUICKI) as 1/[log insulin (µU/mL) + log glucose (mg/dL)].
2.4. Serum Fatty Acid Analysis
Fatty acids analysis was performed by gas chromatography (GC) using a Varian CP-3800 gas chromatograph with a flame ionization detector (Varian, Inc., Palo Alto, CA, USA). Fatty acid methyl esters (FAMEs) were obtained based on the method developed by Lepage and Roy [12]. Two mL of a 4:1 (v/v) methanol:benzene solution were added to 200 μL of serum samples plus 25 μL of methyl heptadecanoate, the internal standard. After mixing carefully, 200 μL of acetyl chloride were slowly incorporated while stirring. Tubes were firmly closed and subjected to methanolysis at 100 °C for 1 h. Once tubes were cooled, 5 mL of potassium carbonate solution (6% w/v) were added to stop the reaction and to neutralize the mixture. Tubes were stirred and centrifuged (1000 g, 10 min) to separate the two resulting phases. The upper phase was transferred to GC vials and injected into the gas chromatograph. The separation of the FAMEs was carried out on a BPX70 capillary column (30 × 0.25 × 0.25) from SGE Analytical Science (Melbourne, Australia). Fatty acid peak areas and concentrations were determined using the Empover 3 software (Waters Corporation, Milford, MA, USA). For statistical analyses, data were expressed as percentage of total fatty acids.
The following saturated fatty acids (SFA) were analyzed: myristic acid (MIR, C14:0), palmitic acid (PAL, C16:0), and stearic acid (STE, C18:0). Measured monounsaturated fatty acids (MUFA) were: ELA, palmitoleic acid (POA, C16:1n-7), and oleic acid (OA, C18:1n-9). Finally, analyzed PUFA were: LA, dihommo γ-linolenic acid (DGLA, C20:3n-6), AA, γ-linolenic acid (GLA, C18:3n-6), ALA, EPA, and DHA.
2.5. Statistical Analysis
The distribution of the variables was analyzed by the Kolmogorov-Smirnov test, and natural log-transformed data were used for statistical analysis when it was possible. However, several variables could not be normalized: STE, ELA, OA, MUFA, n-6, and the ratios OA/STE, LA/OA, ALA/LA, GLA/LA, EPA/ALA, DHA/AA, PUFA/SFA, and PUFA/MUFA. The data were expressed as median (interquartile range), except for the proportion of subjects in each gender; age; n-3 supplementation; smoking habits; education level; and physical activity groups, which were expressed as n (%).
Differences between diet type groups were studied by independent samples t-test or Mann-Whitney’s U test for normally distributed and non-normally distributed variables, respectively. The studied subjects were classified into three groups according to the following cut-off levels: n-6/ n-3 ≤ 10; n-6/n-3 > 10 and ≤20; n-6/n-3 > 20. Differences among them were studied by χ2 tests or Kruskal-Wallis tests. The significance level was set at p < 0.05, and all the statistical analyses were performed with SPSS 24.0 for Windows (IBM, Armonk, NY, USA).
3. Results
3.1. Characteristics of the Participants
Characteristics of the studied population are described in Table 1. The study was completed by 104 volunteers, of which 49 were LO-vegetarians (11 men and 38 women) and 55 were vegans (12 men and 43 women). The majority of the studied individuals were young, with a median age of 30 years, non-smokers, had a bachelor’s degree, and exhibited moderate physical activity. Only nine volunteers were n-3 supplement users (four LO-vegetarians and five vegans). There were no significant differences between LO-vegetarians and vegans in terms of BMI, waist circumference, body fat, abdominal fat, glucose, insulin, leptin, Hcy, TC, HDLc, LDLc, TAG, and cardiometabolic indexes (TC/HDLc, LDLc/HDLc. TAG/HDLc, HOMA-IR, QUICKI, and HOMA-B). SBP was similar in both groups, although DBP was slightly lower in vegans than in LO-vegetarians (p = 0.047).

Table 1.
Characteristics of the studied population.
3.2. Serum Fatty Acids and Main Cardiometabolic Indexes
Total serum fatty acids for the whole population (median, interquartile range) were 2005.8 and 607.6 µg/mL, without significant differences between women and men. Table 2 presents the percentiles of serum fatty acids percentage. Major serum fatty acids were LA, OA and PAL. In contrast, the trans-fatty acid status indicator ELA was very low. Table 3 shows the differences of the types of vegetarian diets and n-3 supplementation on serum fatty acids. Vegans compared with LO-vegetarians had significantly higher OA (p = 0.010), OA/STE (p = 0.047), MUFA (p = 0.018), and AA/(EPA+DHA) (p = 0.026), but lower ELA (p = 0.003) and n-3 (p = 0.048) levels. All other parameters were not significantly different between the two vegetarian diet groups.
Table 2.
Percentiles of fatty acid percentages and main cardiometabolic indexes.
Table 3.
Fatty acid profiles according to vegetarian diet type and use of n-3 supplements.
Users of n-3 supplements showed higher total n-3 (p = 0.045), EPA (p = 0.024) EPA/AA (p = 0.026), EPA/ALA (p = 0.028), and lower n-6/n-3 (p = 0.039) compared to non-users. No other significant differences between n-3 supplement users and non-users were observed.
3.3. LO-vegetarians and Vegans Classification According to n-6/n-3 Ratio
Volunteers were classified into three groups according to their n6/n3 ratio: <10, ≥10 to 20, and >20 (Table 4). Gender distribution neither varied among groups nor were there any differences in physical activity or anthropometric and body fat parameters. There were significantly higher proportions of LO-vegetarians and n-3 supplement users (p = 0.032 and 0.017, respectively, χ2 test) in the lowest and middle n-6/n-3 groups compared to the n-6/n-3 > 20 group. Concerning the cardiometabolic markers, no significant differences among n-6/n-3 groups were observed for glucose, lipid and hormone levels (insulin, leptin), but serum Hcy was significantly lower in the n-6/n-3 < 10 group than in the other groups (p = 0.003). The level of the monounsaturated fatty acid POA was higher in the n6/n3 < 10 group (p = 0.024) while the n-6 LA and the n-3 fatty acids ALA, EPA and DHA were the main contributors to the differences among the n-6/n-3 groups.
Table 4.
Classification of volunteers according to n-6/n-3 ratio.
The analysis of the FFQ data confirms that participants in the LO-vegetarian group consumed milk, eggs and their derived products while vegans did not declare any consumption of these products. Concerning the culinary fat, most of the vegetarians consumed olive oil several times per day (Table 5). Table 5 shows the frequency of consumption of nuts, seeds, oils, and other fat-rich foods of the subjects classified according to n-6/n-3 groups. Flax-seeds were more frequently consumed in the n-6/n-3 < 10 group but the differences were marginally significant (p = 0.056) and no other differences were observed. Figure 1 presents serum ALA and DHA according to frequency of consumption of flax-seeds. Serum ALA increases as flax-seeds intake increases while no variation in serum DHA was observed in relation to the consumption of this food item.
Table 5.
Frequency of consumption of foods according to n-6/n-3 ratio.
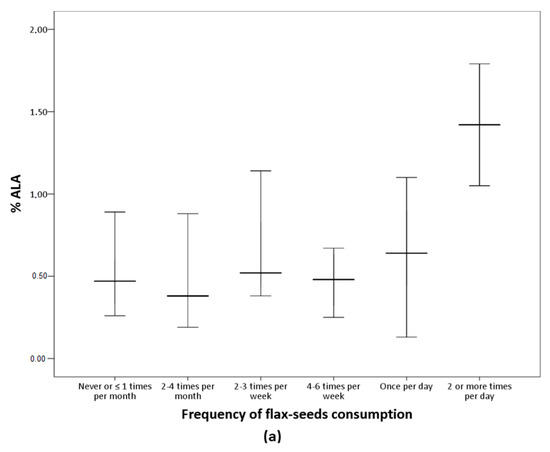
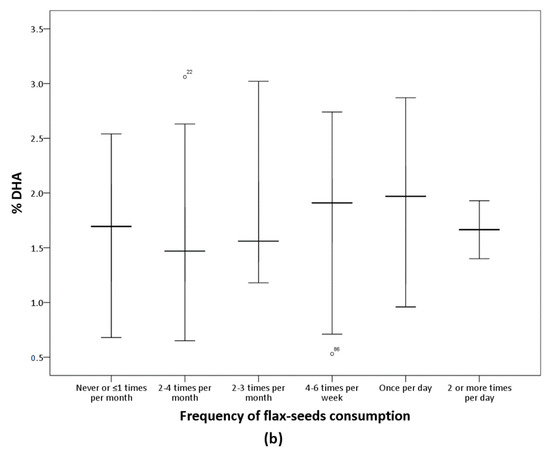
Figure 1.
Percentage of ALA and DHA according to flax-seeds frequency of consumption. Median values and interquartile ranges are presented. (a) Significant differences among groups by Kruskal-Wallis (p = 0.001). (b) The differences among groups were not significant (p = 0.145).
4. Discussion
In this study, serum fatty acids profiles of Spanish vegetarians are presented for the first time. Participants were healthy young adults, with similar sample sizes of LO-vegetarians and vegans, and less than 10% of the volunteers consumed n-3 supplements. Lifestyle habits, body composition, physical activity, and cardiometabolic markers indicate that this population has low cardiovascular risk and high insulin sensibility.
The major serum fatty acid was LA, followed by OA and PAL; while levels of n-3 PUFA, except for ALA, were low in comparison with the data reported for general population [13]. These results clearly show an inadequate n-6/n-3 ratio, indicating a metabolic imbalance. While the results of LA and n-3 levels are consistent with other reports of vegetarians [5,14], OA levels were remarkably high in comparison to other countries, representing about 20–25% of the total serum fatty acids. For instance, OA values of vegetarians in China, South India and Australia were around 1%, 7%, and 10%, respectively [15,16,17]. This is certainly due to the high olive oil consumption characteristic of the Mediterranean diet in Spain. Consistently, this oil was consumed by the volunteers several times per day (Table 5) and our OA levels were similar to those of the Spanish PREDIMED study at baseline point [13,18].
Moreover, vegans presented higher OA (and consistently higher MUFA and OA/STE) and lower ELA, the trans isomer of OA, compared to LO-vegetarians. This trans fatty acid is a marker of ultra-processed food, e.g., margarine, chocolate, potato flakes, potato fries, breakfast cereals, etc. [19], which would suggest a more unfavorable diet in LO-vegetarians than vegans. However, the values obtained in our vegetarian population, either LO-vegetarians or vegans, were much lower than those of other European populations. In this regard, plasma ELA was about three times higher in the EPIC cohort [20,21]. The results of the FFQ of the present study confirm that the frequency of consumption of industrial processed food was similar in LO-vegetarians and vegans, except for food items that contained eggs and milk whose consumption was declared null by the vegans. Natural ELA is present in ruminant’s milk, and thus the consumption of milk and dairy products may have contributed to the slightly higher ELA in LO-vegetarians in comparison with vegans [22]. Nevertheless, the generally low ELA levels obtained in the present study suggest a low consumption of ultra-processed food in both LO-vegetarians and vegans.
Vegans presented lower n-3 levels than LO-vegetarians, which can be mainly attributed to their lower percentage of DHA; but the fatty acid profiles did not markedly differ between these groups. In fact, and consistently with other studies in vegetarians [5], PUFAs were near 50% of all fatty acids, and LA (C18:2n6) was the major PUFA independently of subject’s classification. Therefore, there was an imbalance in n-6/n-3, except for the subjects who consumed supplements of n-3 fatty acids (Table 3).
The metabolic changes induced by the elimination of the main sources of n-3 PUFA, fish and their respective products, from the diet should be briefly commented. It has been demonstrated that the n-6 and n-3 pathways are interconnected. The essential fatty acids LA and ALA are precursors of the n-6 and n-3 PUFA families, respectively. These fatty acids compete for the same enzymes Δ6 and Δ5 desaturases and elongases, and the Δ6 desaturase constitutes the rate-limiting enzyme, presenting higher affinity for ALA than LA [23]. However, under the high LA consumption conditions observed in the present study, the n-6 pathway predominates in detriment of the n-3 pathway [24]. Consistently, the observed ALA/LA ratios indicate that ALA levels (n-3) were approximately 100 times lower than those of LA (n-6). Moreover, results of EPA/ALA and DHA/ALA confirm the low intake of both EPA and DHA, typical of vegetarian diets, suggesting that the production of these fatty acids from ALA was very limited. In agreement, the overall calculated efficiency of conversion from ALA to DHA is lower than 1% or even 0.01%, depending on the used models [23,25,26]. Interestingly, consumption of n-3 supplements (by less than 10% of the total volunteers) was associated with an increase of the EPA levels and the EPA/ALA and EPA/AA ratios without a parallel rise in DHA. This can be explained by the poor enzymatic efficiency in the DHA production from EPA and ALA, and by the composition of the n-3 supplements consumed. In this line, Brenna et al. summarized the change in blood n-3 PUFAs after the consumption of supplements containing ALA or EPA [27], and concluded that the intake of these fatty acids cannot increase serum DHA. Therefore, present results reflect an inadequate supplementation practice. We observed that the n-3 supplements used were very diverse, ranging from supplements containing DHA specially designed for vegetarians to EPA+DHA combinations manufactured from fish or mixtures of n-3, n-6, n-9, and n-7. Indeed, when volunteers were classified according to the n-6/n-3 ratio, only one third of the subjects included in the n-6/n-3 < 10 were n-3 supplements users.
The cardiometabolic risk markers (glucose, lipids, insulin, the insulin resistance/sensitivity indexes, leptin and Hcy) studied according to the n-6/n-3 classification, confirm that this vegetarian population exhibits a low cardiometabolic risk, in agreement with other authors [28,29]. Moreover, Hcy, which constitutes an independent factor for cardiovascular disease [30], was lower in the n-6/n-3 < 10 group compared to the others. This result cannot be attributed to vitamin B12 deficiency, since we confirmed that 75% of the participants consumed vitamin B12 supplements, as previously described [3,31], and vitamin B12-supplemented subjects were equally distributed among the n-6/n-3 groups. In fact, an inverse relationship between n-3 and Hcy has been observed in different studies [17,32]. Bertasd et al. [33] observed that self-reported fish intake was negatively associated with Hcy plasma concentrations in a large cohort of Norwegian people, and another study found that n-3 supplement consumption (3,6 g/day) during 3 months, decreased Hcy in treated dyslipemic diabetics in comparison with a placebo [34].
The higher POA in the group n-6/n-3 < 10 may be related to a higher intake of this fatty acid or may also reflect the Δ9 desaturase activity that converts PAL into POA [35]. In this group, higher ALA, EPA and DHA were shown together with lower n-6 PUFA LA, as expected. Concerning the results of the different fatty acid ratios, lower serum EPA/AA has been related with increased risk of coronary heart disease in a Japanese cohort of adults [36]. In another study, a ratio of EPA/AA lower than 0.40 was associated with adverse cardiac events in coronary patients [37]; and although our population was healthy, the observed results are much lower than this cut-off value. Other ratios such as the DHA/AA appear to be less valuable as markers of cardiovascular risk [38]. Therefore, we conclude that the vegetarians of the present study were at low cardiometabolic risk but most of them have an imbalance n-6/n-3, and low levels of EPA and particularly DHA.
As the group with n-6/n-3 < 10 included consumers and non-consumers of n-3 supplements, the influence of any specific food item intake on serum long-chain n-3 fatty acids was evaluated. We observed similar consumption patterns of nuts and oils in the three n-6/n-3 groups while among the seeds, results suggest an improvement of the n-6/n-3 ratio associated with higher frequency of consumption of flax-seeds. In fact, these seeds are rich in ALA, and consistently, results showed higher serum ALA concentration with higher intake of flax-seeds (Figure 1). However, there was no rise in serum DHA as flax-seed intake increased. This is according to studies reporting that the intake of ALA-rich foods is insufficient to increase serum DHA [23,26,27]. Moreover, this coincides with the results discussed above regarding n-3 supplementation effects on DHA. Altogether, results suggested that the n-3 supplementation increased EPA but not DHA, and the intake of specific foods was insufficient to increase DHA serum levels.
There are many aspects of the relationship between plant-based diets and health that remain unknown. A recent meta-analysis on the effect of vegetarian diets on major cardiovascular outcomes, found very low evidence of associations of these diets with reduction of coronary heart disease incidence (atherosclerosis and/or myocardial infarction) and mortality, but no association with overall cardiovascular disease mortality and stroke mortality [39]. The specific effects of n-3 fatty acids on heart and circulatory disease was evaluated in a Cochrane systematic review. The review provides moderate- and high-quality evidence that increasing the intake of long-chain n-3 fatty acids, mainly from supplements, does not benefit heart health or reduce the risk of stroke or mortality from any cause, and found low-quality evidence suggesting that increasing plant-based ALA may be slightly protective for some heart and circulatory diseases [40]. However, although studies on vegetarians were not excluded in this review, the available information was very limited.
This opens new research lines, as long-chain n-3 fatty acids are relevant in lipid metabolism, lipogenesis and β-oxidation and may be implicated in reducing cardiovascular events. Therefore, further studies are needed to establish if preformed DHA supplements should be widely recommended to vegetarians. At present, ALA and LA are the two fatty acids accepted as essential, but perhaps this should be re-evaluated for the vegetarian and whole population. On one hand, more research should be done on the design of safe and bioavailable DHA sources of plant origin, i.e., marine algae; on the other hand, measurements of cardiometabolic markers should be complemented with functional markers, such as blood hemodynamic, visual and brain function tests, to be used in controlled and well-designed interventions in vegetarian and non-vegetarian volunteers.
This study presents several limitations. The volunteers were LO-vegetarians and vegans but no control group of meat and fish eaters was included. Dietary assessment was carried out by an FFQ and details of quantities of food or nutrients ingested are not known. Apart from that, this is the first study that evaluates lifestyle habits, body composition, cardiometabolic risk markers, and serum fatty acid profile of Spanish vegetarians.
5. Conclusions
Fatty acid profile of Spanish LO-vegetarians and vegans is characterized by high levels of LA and OA, as olive oil is widely consumed in this Mediterranean population. However, levels of long-chain n-3 fatty acids are very low, and consumption of n-3 supplements is associated with an increase in EPA but not DHA. Similarly, frequent consumption of ALA-rich seeds is reflected in serum ALA levels, but further conversion to EPA and DHA is undetected.
Author Contributions
M.P.V., funding acquisition; analytical determinations E.G.-M.; A.G.-N., and B.Z.; A.M.S., E.G.-M.; A.G.-N., data analysis and statistics; A.M.S. draft manuscript preparation; M.P.V., manuscript review and editing. All authors approved the final version of the manuscript.
Funding
The study was supported by a research project financed by Zamdeh Laboratories (Veggunn study).
Acknowledgments
E.G.-M. contract was funded by a Development of Industrial Doctorate project from the Community of Madrid (IND2018/BIO-9554). A.G.-N. contract was funded by the Youth Employment Initiative (YEI) from the European Social Fund (ESF). Laura Barrios of CTI-CSIC is acknowledged for technical support and Miriam A. Martínez for English revision.
Conflicts of Interest
Authors declare the absence of conflicts of interest. The funders had no role in the design of the study; in the collection, analyses, or interpretation of data; in the writing of the manuscript, or in the decision to publish the results.
References
- Kahleova, H.; Levin, S.; Barnard, N. Cardio-Metabolic Benefits of Plant-Based Diets. Nutrients 2017, 9, 848. [Google Scholar] [CrossRef] [PubMed]
- Garcia-Maldonado, E.; Gallego-Narbón, A.; Vaquero, M.P. Are vegetarian diets nutritionally adequate? A revision of the scientific evidence. Nutr. Hosp. 2019, 36, 723–734. [Google Scholar] [CrossRef]
- Gallego-Narbón, A.; Zapatera, B.; Barrios, L.; Vaquero, M.P. Vitamin B12 and folate status in Spanish lacto-ovo vegetarians and vegans. J. Nutr. Sci. 2019, 8, e7. [Google Scholar] [CrossRef] [PubMed]
- Saini, R.K.; Keum, Y.S. Omega-3 and omega-6 polyunsaturated fatty acids: Dietary sources, metabolism, and significance—A review. Life Sci. 2018, 203, 255–267. [Google Scholar] [CrossRef] [PubMed]
- Rosell, M.S.; Lloyd-Wright, Z.; Appleby, P.N.; Allen, N.E.; Key, T.J. Long-chain n–3 polyunsaturated fatty acids in plasma in British meat-eating, vegetarian, and vegan men. Am. J. Clin. Nutr. 2005, 82, 327–334. [Google Scholar] [CrossRef] [PubMed]
- Zárate, R.; El Jaber-Vazdekis, N.; Tejera, N.; Rodríguez, C.; Pérez, J.A. Significance of long chain polyunsaturated fatty acids in human health. Clin. Transl. Med. 2017, 6, 25. [Google Scholar] [CrossRef] [PubMed]
- Simopoulos, A. The importance of the ratio of omega-6/omega-3 essential fatty acids. Biomed. Pharmacother. 2002, 56, 365–379. [Google Scholar] [CrossRef]
- European Food Safety Authority. Panel on Dietetic Products, Nutrition, Allergies; Scientific Opinion on Dietary Reference Values for fats, including saturated fatty acids, polyunsaturated fatty acids, monounsaturated fatty acids, trans fatty acids, and cholesterol. EFSA J. 2010, 8, 1461. [Google Scholar] [CrossRef]
- Sheppard, K.W.; Cheatham, C.L. Omega-6/omega-3 fatty acid intake of children and older adults in the U.S.: Dietary intake in comparison to current dietary recommendations and the Healthy Eating Index. Lipids Health. Dis. 2018, 17, 43. [Google Scholar] [CrossRef]
- Baylin, A.; Campos, H. The use of fatty acid biomarkers to reflect dietary intake. Curr. Opin. Lipidol. 2006, 17, 22–27. [Google Scholar] [CrossRef]
- Skeaff, C.M.; McKenzie, J.E.; Hodson, L. Dietary-Induced Changes in Fatty Acid Composition of Human Plasma, Platelet, and Erythrocyte Lipids Follow a Similar Time Course. J. Nutr. 2006, 136, 565–569. [Google Scholar] [CrossRef]
- Lepage, G.; Roy, C.C. Direct transesterification of all classes of lipids in a one-step reaction. J. Lipid Res. 1986, 27, 114–120. [Google Scholar] [PubMed]
- Mayneris-Perxachs, J.; Guerendiain, M.; Castellote, A.I.; Estruch, R.; Covas, M.I.; Fitó, M.; Salas-Salvadó, J.; Martinez-Gonzalez, M.A.; Arós, F.; Lamuela-Raventos, R.M.; et al. Plasma fatty acid composition, estimated desaturase activities, and their relation with the metabolic syndrome in a population at high risk of cardiovascular disease. Clin. Nutr. 2014, 33, 90–97. [Google Scholar] [CrossRef] [PubMed]
- Davis, B.C.; Kris-Etherton, P.M. Achieving optimal essential fatty acid status in vegetarians: current knowledge and practical implications. Am. J. Clin. Nutr. 2003, 78, 640S–646S. [Google Scholar] [CrossRef] [PubMed]
- Manjari, V.; Suresh, Y.; Devi, M.S.; Das, U. Oxidant stress, anti-oxidants and essential fatty acids in South Indian vegetarians and non-vegetarians. Prostaglandins, Leukot. Essent. Fat. Acids 2001, 64, 53–59. [Google Scholar] [CrossRef] [PubMed]
- Mann, N.; Pirotta, Y.; O’Connell, S.; Li, D.; Kelly, F.; Sinclair, A. Fatty acid composition of habitual omnivore and vegetarian diets. Lipids 2006, 41, 637–646. [Google Scholar] [CrossRef]
- Huang, T.; Yu, X.; Shou, T.; Wahlqvist, M.L.; Li, D. Associations of plasma phospholipid fatty acids with plasma homocysteine in Chinese vegetarians. Br. J. Nutr. 2013, 109, 1688–1694. [Google Scholar] [CrossRef]
- Sala-Vila, A.; Harris, W.S.; Cofán, M.; Pérez-Heras, A.M.; Pintó, X.; Lamuela-Raventós, R.M.; Covas, M.I.; Estruch, R.; Ros, E. Determinants of the omega-3 index in a Mediterranean population at increased risk for CHD. Br. J. Nutr. 2011, 106, 425–431. [Google Scholar] [CrossRef]
- Costa, N.; Cruz, R.; Graça, P.; Breda, J.; Casal, S. Trans fatty acids in the Portuguese food market. Food Control 2016, 64, 128–134. [Google Scholar] [CrossRef]
- Chajès, V.; Biessy, C.; Ferrari, P.; Romieu, I.; Freisling, H.; Huybrechts, I.; Scalbert, A.; De Mesquita, B.B.; Romaguera, D.; Gunter, M.J.; et al. Plasma Elaidic Acid Level as Biomarker of Industrial Trans Fatty Acids and Risk of Weight Change: Report from the EPIC Study. PLoS ONE 2015, 10, e0118206. [Google Scholar] [CrossRef]
- Matejcic, M.; Lesueur, F.; Biessy, C.; Renault, A.; Mebirouk, N.; Yammine, S.; Keski-Rahkonen, P.; Li, K.; Hémon, B.; Weiderpass, E.; et al. Circulating plasma phospholipid fatty acids and risk of pancreatic cancer in a large European cohort. Int. J. Cancer 2018, 143, 2437–2448. [Google Scholar] [CrossRef]
- Sommerfeld, M. Trans unsaturated fatty acids in natural products and processed foods. Prog. Lipid Res. 1983, 22, 221–233. [Google Scholar] [CrossRef]
- Burdge, G.C.; Calder, P.C. Conversion of α-linolenic acid to longer-chain polyunsaturated fatty acids in human adults. Reprod. Nutr. Dev. 2005, 45, 581–597. [Google Scholar] [CrossRef]
- Alwan, N.A.; Hamamy, H.; Alwan, N. Maternal Iron Status in Pregnancy and Long-Term Health Outcomes in the Offspring. J. Pediatr. Genet. 2015, 4, 111–123. [Google Scholar]
- Domenichiello, A.F.; Kitson, A.P.; Bazinet, R.P. Is docosahexaenoic acid synthesis from α-linolenic acid sufficient to supply the adult brain? Prog. Lipid Res. 2015, 59, 54–66. [Google Scholar] [CrossRef]
- Plourde, M.; Cunnane, S.C. Extremely limited synthesis of long chain polyunsaturates in adults: implications for their dietary essentiality and use as supplements. Appl. Physiol. Nutr. Metab. 2007, 32, 619–634. [Google Scholar] [CrossRef]
- Brenna, J.T.; Salem, N.; Sinclair, A.J.; Cunnane, S.C. α-Linolenic acid supplementation and conversion to n-3 long-chain polyunsaturated fatty acids in humans. Prostaglandins, Leukot. Essent. Fat. Acids 2009, 80, 85–91. [Google Scholar] [CrossRef] [PubMed]
- Mezzano, D.; Kosiel, K.; Martínez, C.; Cuevas, A.; Panes, O.; Aranda, E.; Strobel, P.; Pérez, D.D.; Pereira, J.; Rozowski, J.; et al. Cardiovascular risk factors in vegetarians. Normalization of hyperhomocysteinemia with vitamin B(12) and reduction of platelet aggregation with n-3 fatty acids. Thromb. Res. 2000, 100, 153–160. [Google Scholar] [CrossRef]
- Huang, T.; Yang, B.; Zheng, J.; Li, G.; Wahlqvist, M.L.; Li, D. Cardiovascular Disease Mortality and Cancer Incidence in Vegetarians: A Meta-Analysis and Systematic Review. Ann. Nutr. Metab. 2012, 60, 233–240. [Google Scholar] [CrossRef]
- Eckel, R.H.; Cornier, M.-A. Update on the NCEP ATP-III emerging cardiometabolic risk factors. BMC Med. 2014, 12, 115. [Google Scholar] [CrossRef]
- Gallego-Narbón, A.; Zapatera, B.; Álvarez, I.; Vaquero, M.P. Methylmalonic Acid Levels and their Relation with Cobalamin Supplementation in Spanish Vegetarians. Plant Foods Hum. Nutr. 2018, 73, 166–171. [Google Scholar] [CrossRef] [PubMed]
- Obersby, D.; Chappell, D.C.; Dunnett, A.; Tsiami, A.A. Plasma total homocysteine status of vegetarians compared with omnivores: a systematic review and meta-analysis. Br. J. Nutr. 2013, 109, 785–794. [Google Scholar] [CrossRef] [PubMed]
- Berstad, P.; Konstantinova, S.V.; Refsum, H.; Nurk, E.; Vollset, S.E.; Tell, G.S.; Ueland, P.M.; Drevon, C.A.; Ursin, G. Dietary fat and plasma total homocysteine concentrations in 2 adult age groups: the Hordaland Homocysteine Study. Am. J. Clin. Nutr. 2007, 85, 1598–1605. [Google Scholar] [CrossRef][Green Version]
- Zeman, M.; Žák, A.; Vecka, M.; Tvrzická, E.; Písaříková, A.; Staňková, B. N-3 fatty acid supplementation decreases plasma homocysteine in diabetic dyslipidemia treated with statin–fibrate combination. J. Nutr. Biochem. 2006, 17, 379–384. [Google Scholar] [CrossRef] [PubMed]
- Wu, J.H.; Lemaitre, R.N.; Imamura, F.; King, I.B.; Song, X.; Spiegelman, D.; Siscovick, D.S.; Mozaffarian, D. Fatty acids in the de novo lipogenesis pathway and risk of coronary heart disease: The Cardiovascular Health Study. Am. J. Clin. Nutr. 2011, 94, 431–438. [Google Scholar] [CrossRef] [PubMed]
- Ninomiya, T.; Nagata, M.; Hata, J.; Hirakawa, Y.; Ozawa, M.; Yoshida, D.; Ohara, T.; Kishimoto, H.; Mukai, N.; Fukuhara, M.; et al. Association between ratio of serum eicosapentaenoic acid to arachidonic acid and risk of cardiovascular disease: The Hisayama Study. Atherosclerosis 2013, 231, 261–267. [Google Scholar] [CrossRef] [PubMed]
- Domei, T.; Yokoi, H.; Kuramitsu, S.; Soga, Y.; Arita, T.; Ando, K.; Shirai, S.; Kondo, K.; Sakai, K.; Goya, M.; et al. Ratio of Serum n-3 to n-6 Polyunsaturated Fatty Acids and the Incidence of Major Adverse Cardiac Events in Patients Undergoing Percutaneous Coronary Intervention. Circ. J. 2012, 76, 423–429. [Google Scholar] [CrossRef] [PubMed]
- Nelson, J.R.; Raskin, S. The eicosapentaenoic acid:arachidonic acid ratio and its clinical utility in cardiovascular disease. Postgrad. Med. 2019, 131, 268–277. [Google Scholar] [CrossRef]
- Glenn, A.J.; Viguiliouk, E.; Seider, M.; Boucher, B.A.; Khan, T.A.; Blanco Mejia, S.; Jenkins, D.J.A.; Kahleová, H.; Rahelić, D.; Salas-Salvadó, J.; et al. Relation of Vegetarian Dietary Patterns with Major Cardiovascular Outcomes: A Systematic Review and Meta-Analysis of Prospective Cohort Studies. Front. Nutr. 2019, 6, 80. [Google Scholar] [CrossRef]
- Abdelhamid, A.S.; Brown, T.J.; Brainard, J.S.; Biswas, P.; Thorpe, G.C.; Moore, H.J.; Deane, K.H.; AlAbdulghafoor, F.K.; Summerbell, C.D.; Worthington, H.V.; et al. Omega-3 fatty acids for the primary and secondary prevention of cardiovascular disease. Cochrane Database Syst. Rev. 2018, 7, CD003177. [Google Scholar] [PubMed]
© 2019 by the authors. Licensee MDPI, Basel, Switzerland. This article is an open access article distributed under the terms and conditions of the Creative Commons Attribution (CC BY) license (http://creativecommons.org/licenses/by/4.0/).