Non-Milk Extrinsic Sugars Intake and Food and Nutrient Consumption Patterns among Adolescents in the UK National Diet and Nutrition Survey, Years 2008–16


Abstract
:1. Introduction
2. Materials and Methods
2.1. The National Diet and Nutrition Survey Rolling Programme
2.2. Dietary Information
2.3. Characteristics
2.4. Statistical Analyses
2.5. Research Ethics
3. Results
3.1. Foods
3.2. Nutrients
4. Discussion
Strengths and Limitations
5. Conclusions
Supplementary Materials
Author Contributions
Funding
Acknowledgments
Conflicts of Interest
References
- Public Health England. PHE Obesity. Available online: https://www.gov.uk/guidance/phe-data-and-analysis-tools#obesity-diet-and-physical-activity (accessed on 14 July 2019).
- World Health Organization. Guideline: Sugars Intake for Adults and Children, Obesity and Overweight: Fact Sheet No 311; WHO: Geneva, Switzerland, 2015. [Google Scholar]
- Simmonds, M.; Llewellyn, A.; Owen, C.G.; Woolacott, N. Predicting adult obesity from childhood obesity: A systematic review and meta-analysis. Obes. Rev. 2016, 17, 95–107. [Google Scholar] [CrossRef] [PubMed]
- Swan, G.E.; Powell, N.A.; Knowles, B.L.; Bush, M.T.; Levy, L.B. A definition of free sugars for the UK. Public Health Nutr. 2018, 21, 1636–1638. [Google Scholar] [CrossRef] [PubMed] [Green Version]
- Kant, A.K. Reported consumption of low-nutrient-density foods by American children and adolescents: Nutritional and health correlates, NHANES III, 1988 to 1994. Arch. Pediatr. Adolesc. Med. 2003, 157, 789–796. [Google Scholar] [CrossRef] [PubMed]
- Kant, A.K. Consumption of energy-dense, nutrient-poor foods by adult Americans: Nutritional and health implications. The third National Health and Nutrition Examination Survey, 1988–1994. Am. J. Clin. Nutr. 2000, 72, 929–936. [Google Scholar] [CrossRef] [PubMed]
- Te-Morenga, L.; Mallard, S.; Mann, J. Dietary sugars and body weight: Systematic review and meta-analyses of randomised controlled trials and cohort studies. BMJ 2013, 346. [Google Scholar] [CrossRef] [PubMed]
- Department of Health. Committee on Medical Aspects of Food Policy. Panel on Dietary Reference Values. Dietary Reference Values For Food Energy And Nutrients For the United Kingdom; HMSO: London, UK, 1991; p. xxv.
- Scientific Advisory Committee on Nutrition. SACN Carbohydrates and Health Report; TSO: London, UK, 2015. [Google Scholar]
- Gibson, S.A. Dietary sugars intake and micronutrient adequacy: A systematic review of the evidence. Nutr. Res. Rev. 2007, 20, 121–131. [Google Scholar] [CrossRef]
- Rennie, K.L.; Livingstone, M.B.E. Associations between dietary added sugar intake and micronutrient intake: A systematic review. Br. J. Nutr. 2007, 97, 832–841. [Google Scholar] [CrossRef]
- Gibson, S.A. Do diets high in sugars compromise micronutrient intakes? Micronutrient intakes in the Dietary and Nutritional Survey of British Adults according to dietary concentration of ‘added’, ‘non-milk extrinsic’ or ‘total’ sugars. J. Hum. Nutr. Diet. 1997, 10, 125–133. [Google Scholar] [CrossRef]
- British Nutrition Foundation. New Recommendations for Free Sugars and Fibre-the Scale of the Challenge. Available online: https://www.nutrition.org.uk/nutritioninthenews/headlines/newrecommendationsfibresugars.html (accessed on 14 July 2019).
- National Diet and Nutrition Survey Results from Years 1, 2, 3 and 4 (combined) of the Rolling Programme (2008/2009–2011/2012). Available online: https://www.gov.uk/government/statistics/national-diet-and-nutrition-survey-results-from-years-1-to-4-combined-of-the-rolling-programme-for-2008-and-2009-to-2011-and-2012 (accessed on 14 July 2019).
- Whitton, C.; Nicholson, S.K.; Roberts, C.; Prynne, C.J.; Pot, G.K.; Olson, A.; Fitt, E.; Cole, D.; Teucher, B.; Bates, B.; et al. National Diet and Nutrition Survey: UK food consumption and nutrient intakes from the first year of the rolling programme and comparisons with previous surveys. Br. J. Nutr. 2011, 106, 1899–1914. [Google Scholar] [CrossRef]
- MRC Elsie Widdowson Laboratory. MRC Elsie Widdowson Laboratory, National Diet and Nutrition Survey Years 1–8, 2008/09–2015/16. [Data Collection], 11th ed.; UK Data Service: London, UK, 2018. [Google Scholar]
- Henry, C. Basal metabolic rate studies in humans: Measurement and development of new equations. Public Health Nutr. 2005, 8, 1133–1152. [Google Scholar] [CrossRef]
- Goldberg, G.R.; Black, A.E.; Jebb, S.A.; Cole, T.J.; Murgatroyd, P.R.; Coward, W.A.; Prentice, A.M. Critical evaluation of energy intake data using fundamental principles of energy physiology: 1. Derivation of cut-off limits to identify under-recording. Eur. J. Clin. Nutr. 1991, 45, 569–581. [Google Scholar] [PubMed]
- Drewnowski, A.; Rehm, C.D. Consumption of added sugars among US children and adults by food purchase location and food source. Am. J. Clin. Nutr. 2014, 100, 901–907. [Google Scholar] [CrossRef] [PubMed] [Green Version]
- Newens, K.; Walton, J. A review of sugar consumption from nationally representative dietary surveys across the world. J. Hum. Nutr. Diet. 2015, 29, 225–240. [Google Scholar] [CrossRef] [PubMed] [Green Version]
- Sluik, D.; van Lee, L.; Engelen, A.I.; Feskens, E.J.M. Total, Free, and Added Sugar Consumption and Adherence to Guidelines: The Dutch National Food Consumption Survey 2007–2010. Nutrients 2016, 8, 70. [Google Scholar] [CrossRef] [PubMed]
- Louie, J.C.; Tapsell, L.C. Association between intake of total vs added sugar on diet quality: A systematic review. Nutr. Rev. 2015, 73, 837–857. [Google Scholar] [CrossRef]
- Rugg-Gunn, A.J.; Fletcher, E.S.; Matthews, J.N.; Hackett, A.F.; Moynihan, P.J.; Kelly, S.; Adams, J.; Mathers, J.C.; Adamson, A. Changes in consumption of sugars by English adolescents over 20 years 1. Public Health Nutr. 2007, 10, 354–363. [Google Scholar] [CrossRef]
- British Nutrition Foundation. Let’s Take Another Look at Sugar. Available online: https://www.nutrition.org.uk/nutritioninthenews/headlines/letstakeanotherlookatsugar.html (accessed on 4 March 2015).
- Public Health England. Eatwell Plate. Available online: https://assets.publishing.service.gov.uk/government/uploads/system/uploads/attachment_data/file/528193/Eatwell_guide_colour.pdf (accessed on 28 June 2019).
- Alexy, U.; Sichert-Hellert, W.; Kersting, M. Fortification masks nutrient dilution due to added sugars in the diet of children and adolescents. J. Nutr. 2002, 132, 2785–2791. [Google Scholar] [CrossRef]
- Albar, S.A.; Alwan, N.A.; Evans, C.E.; Cade, J.E. Is there an association between food portion size and BMI among British adolescents? Br. J. Nutr. 2014, 112, 841–851. [Google Scholar] [CrossRef] [Green Version]
- Malik, V.S.; Pan, A.; Willett, W.C.; Hu, F.B. Sugar-sweetened beverages and weight gain in children and adults: A systematic review and meta-analysis. Am. J. Clin. Nutr. 2013, 98, 1084–1102. [Google Scholar] [CrossRef]
- Greenwood, D.C.; Threapleton, D.E.; Evans, C.E.; Cleghorn, C.L.; Nykjaer, C.; Woodhead, C.; Burley, V.J. Association between sugar-sweetened and artificially sweetened soft drinks and type 2 diabetes: Systematic review and dose-response meta-analysis of prospective studies. Br. J. Nutr. 2014, 112, 725–734. [Google Scholar] [CrossRef]
- Imamura, F.; O’Connor, L.; Ye, Z.; Mursu, J.; Hayashino, Y.; Bhupathiraju, S.N.; Forouhi, N.G. Consumption of sugar sweetened beverages, artificially sweetened beverages, and fruit juice and incidence of type 2 diabetes: Systematic review, meta-analysis, and estimation of population attributable fraction. BMJ 2015, 351, 3576. [Google Scholar] [CrossRef] [PubMed]
- Maersk, M.; Belza, A.; Holst, J.J.; Fenger-Gron, M.; Pedersen, S.B.; Astrup, A.; Richelsen, B. Satiety scores and satiety hormone response after sucrose-sweetened soft drink compared with isocaloric semi-skimmed milk and with non-caloric soft drink: A controlled trial. Eur. J. Clin. Nutr. 2012, 66, 523–529. [Google Scholar] [CrossRef] [PubMed]
- Schwingshackl, L.; Hoffmann, G. Long-term effects of low glycemic index/load vs. high glycemic index/load diets on parameters of obesity and obesity-associated risks: A systematic review and meta-analysis. Nutr. Metab. Cardiovasc. Dis. 2013, 23, 699–706. [Google Scholar] [CrossRef] [PubMed]
- Volk, B.M.; Kunces, L.J.; Freidenreich, D.J.; Kupchak, B.R.; Saenz, C.; Artistizabal, J.C.; Fernandez, M.L.; Bruno, R.S.; Maresh, C.M.; Kraemer, W.J.; et al. Effects of step-wise increases in dietary carbohydrate on circulating saturated Fatty acids and palmitoleic Acid in adults with metabolic syndrome. PLoS ONE 2014, 9, 113605. [Google Scholar] [CrossRef]
- Schwimmer, J.B.; Ugalde-Nicalo, P.; Welsh, J.A.; Angeles, J.E.; Cordero, M.; Harlow, K.E.; Alazraki, A.; Durelle, J.; Knight-Scott, J.; Newton, K.P.; et al. Effect of a Low Free Sugar Diet vs Usual Diet on Nonalcoholic Fatty Liver Disease in Adolescent Boys: A Randomized Clinical Trial. JAMA 2019, 321, 256–265. [Google Scholar] [CrossRef]
- Public Health England. Sugar Reduction and Wider Reformulation. Available online: https://www.gov.uk/government/collections/sugar-reduction (accessed on 5 June 2019).
- Wang, Y.C.; Vine, S.M. Caloric effect of a 16-ounce (473-mL) portion-size cap on sugar-sweetened beverages served in restaurants. Am. J. Clin. Nutr. 2013, 98, 430–435. [Google Scholar] [CrossRef] [Green Version]
- Bertino, M.; Beauchamp, G.K.; Engelman, K. Long-term reduction in dietary sodium alters the taste of salt. Am. J. Clin. Nutr. 1982, 36, 1134–1144. [Google Scholar] [CrossRef] [Green Version]
- Beauchamp, G.K.; Bertino, M.; Engelman, K. Modification of salt taste. Ann. Intern. Med. 1983, 98, 763–769. [Google Scholar] [CrossRef]
- Mattes, R.D. The taste for salt in humans. Am. J. Clin. Nutr. 1997, 65, 692S–697S. [Google Scholar] [CrossRef] [Green Version]
- Wise, P.M.; Nattress, L.; Flammer, L.J.; Beauchamp, G.K. Reduced dietary intake of simple sugars alters perceived sweet taste intensity but not perceived pleasantness. Am. J. Clin. Nutr. 2016, 103, 50–60. [Google Scholar] [CrossRef]
- Public Health England. Sugar Reduction: The Evidence for Action. 2015 14 July. Available online: https://www.gov.uk/government/publications/sugar-reduction-from-evidence-into-action (accessed on 14 July 2019).
- Public Health England. NDNS: Results from Years 7 and 8 (Combined). Available online: https://www.gov.uk/government/statistics/ndns-results-from-years-7-and-8-combined (accessed on 5 July 2019).
- Macdiarmid, J.; Blundell, J. Assessing dietary intake: Who, what and why of under-reporting. Nutr. Res. Rev. 1998, 11, 231–253. [Google Scholar] [CrossRef] [PubMed] [Green Version]
- Poppitt, S.D.; Swann, D.; Black, A.E.; Prentice, A.M. Assessment of selective under-reporting of food intake by both obese and non-obese women in a metabolic facility. Int. J. Obes. 1998, 22, 303–311. [Google Scholar] [CrossRef] [Green Version]


| Variables * | N | TOTAL | Quantiles of Non-Milk Extrinsic Sugars Consumption (% of Total Energy/Day) | Wald/Chi2 p-Value | ||||
|---|---|---|---|---|---|---|---|---|
| ≤5 | >5–10 | >10–15 | >15–20 | >20 | ||||
| No. of participants, n (%) | 2587 | - | 112 (4%) | 470 (17%) | 795 (34%) | 699 (27%) | 511 (18%) | - |
| Age, years | 2587 | 15 (14, 15) | 15 (14, 15) | 14 (14, 15) | 15 (14, 15) | 15 (14, 15) | 15 (14, 15) | 0.33 |
| Female, % | 2587 | 49 (46, 51) | 55 (43, 67) | 50 (44, 56) | 51 (47, 55) | 46 (41, 50) | 47 (41, 52) | 0.37 |
| Body Mass Index, kg/m2 | 2493 | 22 (21, 22) | 24 (23, 25) | 22 (21, 22) | 22 (21, 22) | 22 (21, 22) | 22 (21, 22) | 0.29 |
| Normal weight, % | 1620 | 66 (63, 69) | 51 (38, 64) | 66 (59, 71) | 64 (60, 69) | 69 (64, 73) | 69 (64, 75) | 0.09 |
| Overweight, % | 349 | 13 (12, 15) | 15 (8, 26) | 12 (9, 16) | 14 (11, 17) | 14 (11, 18) | 12 (9, 17) | |
| Obese, % | 524 | 21 (18, 23) | 34 (24, 47) | 23 (18, 28) | 22 (18, 26) | 17 (14, 21) | 18 (14, 23) | |
| Waist circumference, cm | 1870 | 76 (75, 76) | 81 (77, 85) | 75 (74, 77) | 76 (74, 77) | 75 (74, 76) | 75 (73, 77) | 0.10 |
| Waist-to-hip ratio | 1869 | 0.81 (0.80, 0.81) | 0.82 (0.80, 0.85) | 0.81 (0.80, 0.82) | 0.80 (0.80, 0.81) | 0.81 (0.80, 0.81) | 0.80 (0.79, 0.81) | 0.42 |
| Dieting | 2586 | 7 (5, 8) | 21 (13, 33) | 7 (4, 10) | 6 (4, 9) | 7 (5, 10) | 3 (2, 6) | <0.01 |
| Achieving 5-a-day F & V | 2587 | 8 (7, 10) | 7 (3, 18) | 10 (7, 15) | 9 (7, 12) | 8 (6, 11) | 6 (4, 9) | 0.33 |
| Under-reporters † | 2587 | 55 (52, 57) | 79 (68, 88) | 65 (59, 71) | 54 (49, 58) | 49 (44, 54) | 49 (43, 54) | <0.01 |
| Have longstanding illness | 2587 | 16 (14, 18) | 21 (12, 33) | 15 (11, 21) | 15 (12, 18) | 19 (15, 23) | 13 (9, 17) | 0.18 |
| Socio-economic status of parent | ||||||||
| Professional/Managerial, % | 1032 | 42 (40, 45) | 39 (27, 52) | 44 (38, 50) | 41 (36, 45) | 45 (40, 50) | 39 (34, 45) | |
| Intermediate, % | 552 | 23 (21, 25) | 19 (11, 30) | 22 (17, 27) | 24 (20, 28) | 24 (20, 29) | 23 (18, 28) | 0.53 |
| Routine/Manual, % | 875 | 35 (32, 37) | 42 (30, 55) | 34 (29, 40) | 35 (31, 40) | 31 (26, 36) | 38 (33, 44) | |
| Ethnic groups | ||||||||
| White, % | 2309 | 83 (81, 85) | 69 (54, 80) | 79 (72, 84) | 81 (77, 85) | 88 (84, 92) | 86 (80, 90) | <0.01 |
| Non-white, % | 276 | 17 (15, 19) | 31 (20, 46) | 21 (16, 28) | 19 (15, 23) | 12 (8, 16) | 14 (10, 20) | |
| Total Energy (TE), kcal/day | 2587 | 1761 (1734, 1788) | 1390 (1258, 1523) | 1593 (1542, 1644) | 1778 (1735, 1821) | 1830 (1777, 1884) | 1872 (1800, 1944) | <0.01 |
| Non-milk extrinsic sugars (NMES) | 2587 | 72 (70, 74) | 13 (12, 15) | 34 (33, 35) | 60 (58, 62) | 85 (82, 88) | 122 (116, 127) | <0.01 |
| NMES, % of TE | 2587 | 14.9 (14.5, 15.2) | 3.5 (3.2, 3.8) | 8.0 (7.8, 8.2) | 12.6 (12.5, 12.8) | 17.4 (17.2, 17.5) | 24.5 (24.0, 25.1) | <0.01 |
| Variables | Total | Consumers | Quantiles of Non-Milk Extrinsic Sugars Consumption (% of Total Energy/Day) | ||||
|---|---|---|---|---|---|---|---|
| n (%) | ≤5 | >5–10 | >10–15 | >15–20 | >20 | ||
| No. of participants, n (%) | 2587 (100%) | 112 (4%) | 470 (17%) | 795 (34%) | 699 (27%) | 511 (18%) | |
| Food Groups | |||||||
| Carbohydrate rich foods | |||||||
| Pasta, rice and other cereals *** | 104 (98, 110) | 2265 (90%) | 130 (93, 167) | 119 (103, 135) | 107 (96 117) | 99 (87, 110) | 88 (75, 101) |
| White bread | 56 (53, 59) | 2274 (87%) | 44 (29, 58) | 58 (50, 65) | 56 (50, 62) | 60 (54, 66) | 52 (45, 58) |
| Wholemeal, brown, granary, wheatgerm bread *** | 21 (19, 23) | 1153 (46%) | 34 (19,49) | 26 (19, 33) | 25 (20, 29) | 16 (13, 20) | 14 (10, 18) |
| High fibre breakfast cereals ** | 13 (12, 15) | 963 (37%) | 20 (7, 34) | 14 (9, 19) | 16 (12, 19) | 12 (9, 15) | 9 (6, 12) |
| Other breakfast cereals | 10 (9, 11) | 1146 (46%) | 8 (3, 12) | 10 (7, 12) | 10 (8, 12) | 11 (9, 13) | 11 (8, 14) |
| Biscuits *** | 17 (16, 19) | 1697 (67%) | 7 (4, 11) | 15 (12, 18) | 17 (15, 20) | 19 (17, 22) | 20 (14, 26) |
| Buns, cakes, pastries and fruit pies *** | 20 (18, 22) | 1352 (53%) | 3 (1, 4) | 12 (9, 14) | 21 (17, 23) | 23 (19, 27) | 25 (19, 31) |
| Puddings | 11 (9, 13) | 579 (24%) | 7 (1, 12) | 8 (4, 12) | 11 (8, 14) | 12 (9, 15) | 11 (7, 16) |
| Dairy products | |||||||
| Milk | 132 (122, 142) | 2137 (81%) | 147 (57, 237) | 141 (114, 167) | 138 (120, 155) | 131 (111, 151) | 112 (92, 132) |
| Cheese *** | 11 (10, 12) | 1486 (60%) | 8 (5, 12) | 13 (10, 15) | 13 (11, 14) | 10 (8, 12) | 8 (6, 10) |
| Yogurt, fromage frais and other dairy desserts ** | 20 (18, 22) | 933 (37%) | 10 (3, 17) | 19 (14, 25) | 22 (17, 27) | 22 (18, 26) | 17 (13, 22) |
| Ice cream *** | 9 (7, 10) | 698 (26%) | 2 (−1, 5) | 5 (3, 7) | 9 (6, 12) | 10 (8, 13) | 11 (8, 14) |
| Egg and egg dishes | 12 (11, 15) | 896 (36%) | 21 (6, 37) | 14 (10, 18) | 14 (10, 17) | 10 (8, 13) | 12 (8, 15) |
| Total fat spreads | 8 (7, 8) | 2103 (80%) | 9 (6, 11) | 8 (7, 9) | 8 (7, 9) | 8 (7, 9) | 7 (5, 8) |
| Potato and potato products | |||||||
| Chips, fried roast potatoes and potato dishes | 50 (47, 53) | 2022 (78%) | 42 (22, 61) | 43 (36, 50) | 53 (47, 59) | 52 (47, 57) | 51 (44, 59) |
| Other potatoes, potato salads and dishes | 31 (28, 34) | 1474 (54%) | 34 (17, 52) | 32 (25, 38) | 34 (29, 39) | 31 (26, 35) | 25 (20, 30) |
| Crisps and savoury snacks ** | 13 (12, 13) | 1775 (69%) | 10 (4, 15) | 11 (9, 13) | 12 (10, 13) | 14 (12, 16) | 13 (11, 16) |
| Sugar, preserves and confectionery | |||||||
| Sugars, preservatives and sweet spreads *** | 7 (6, 7) | 1553 (61%) | 2 (0, 3) | 4 (3, 5) | 6 (5, 8) | 8 (7, 10) | 9 (7, 11) |
| Sugar confectionery *** | 7 (6, 8) | 848 (33%) | 1 (0, 1) | 2 (1, 3) | 4 (3, 5) | 8 (6, 10) | 15 (12, 19) |
| Chocolate confectionery *** | 12 (11, 13) | 1498 (56%) | 3 (1, 4) | 6 (5, 8) | 10 (9, 12) | 15 (12, 17) | 18 (14, 21) |
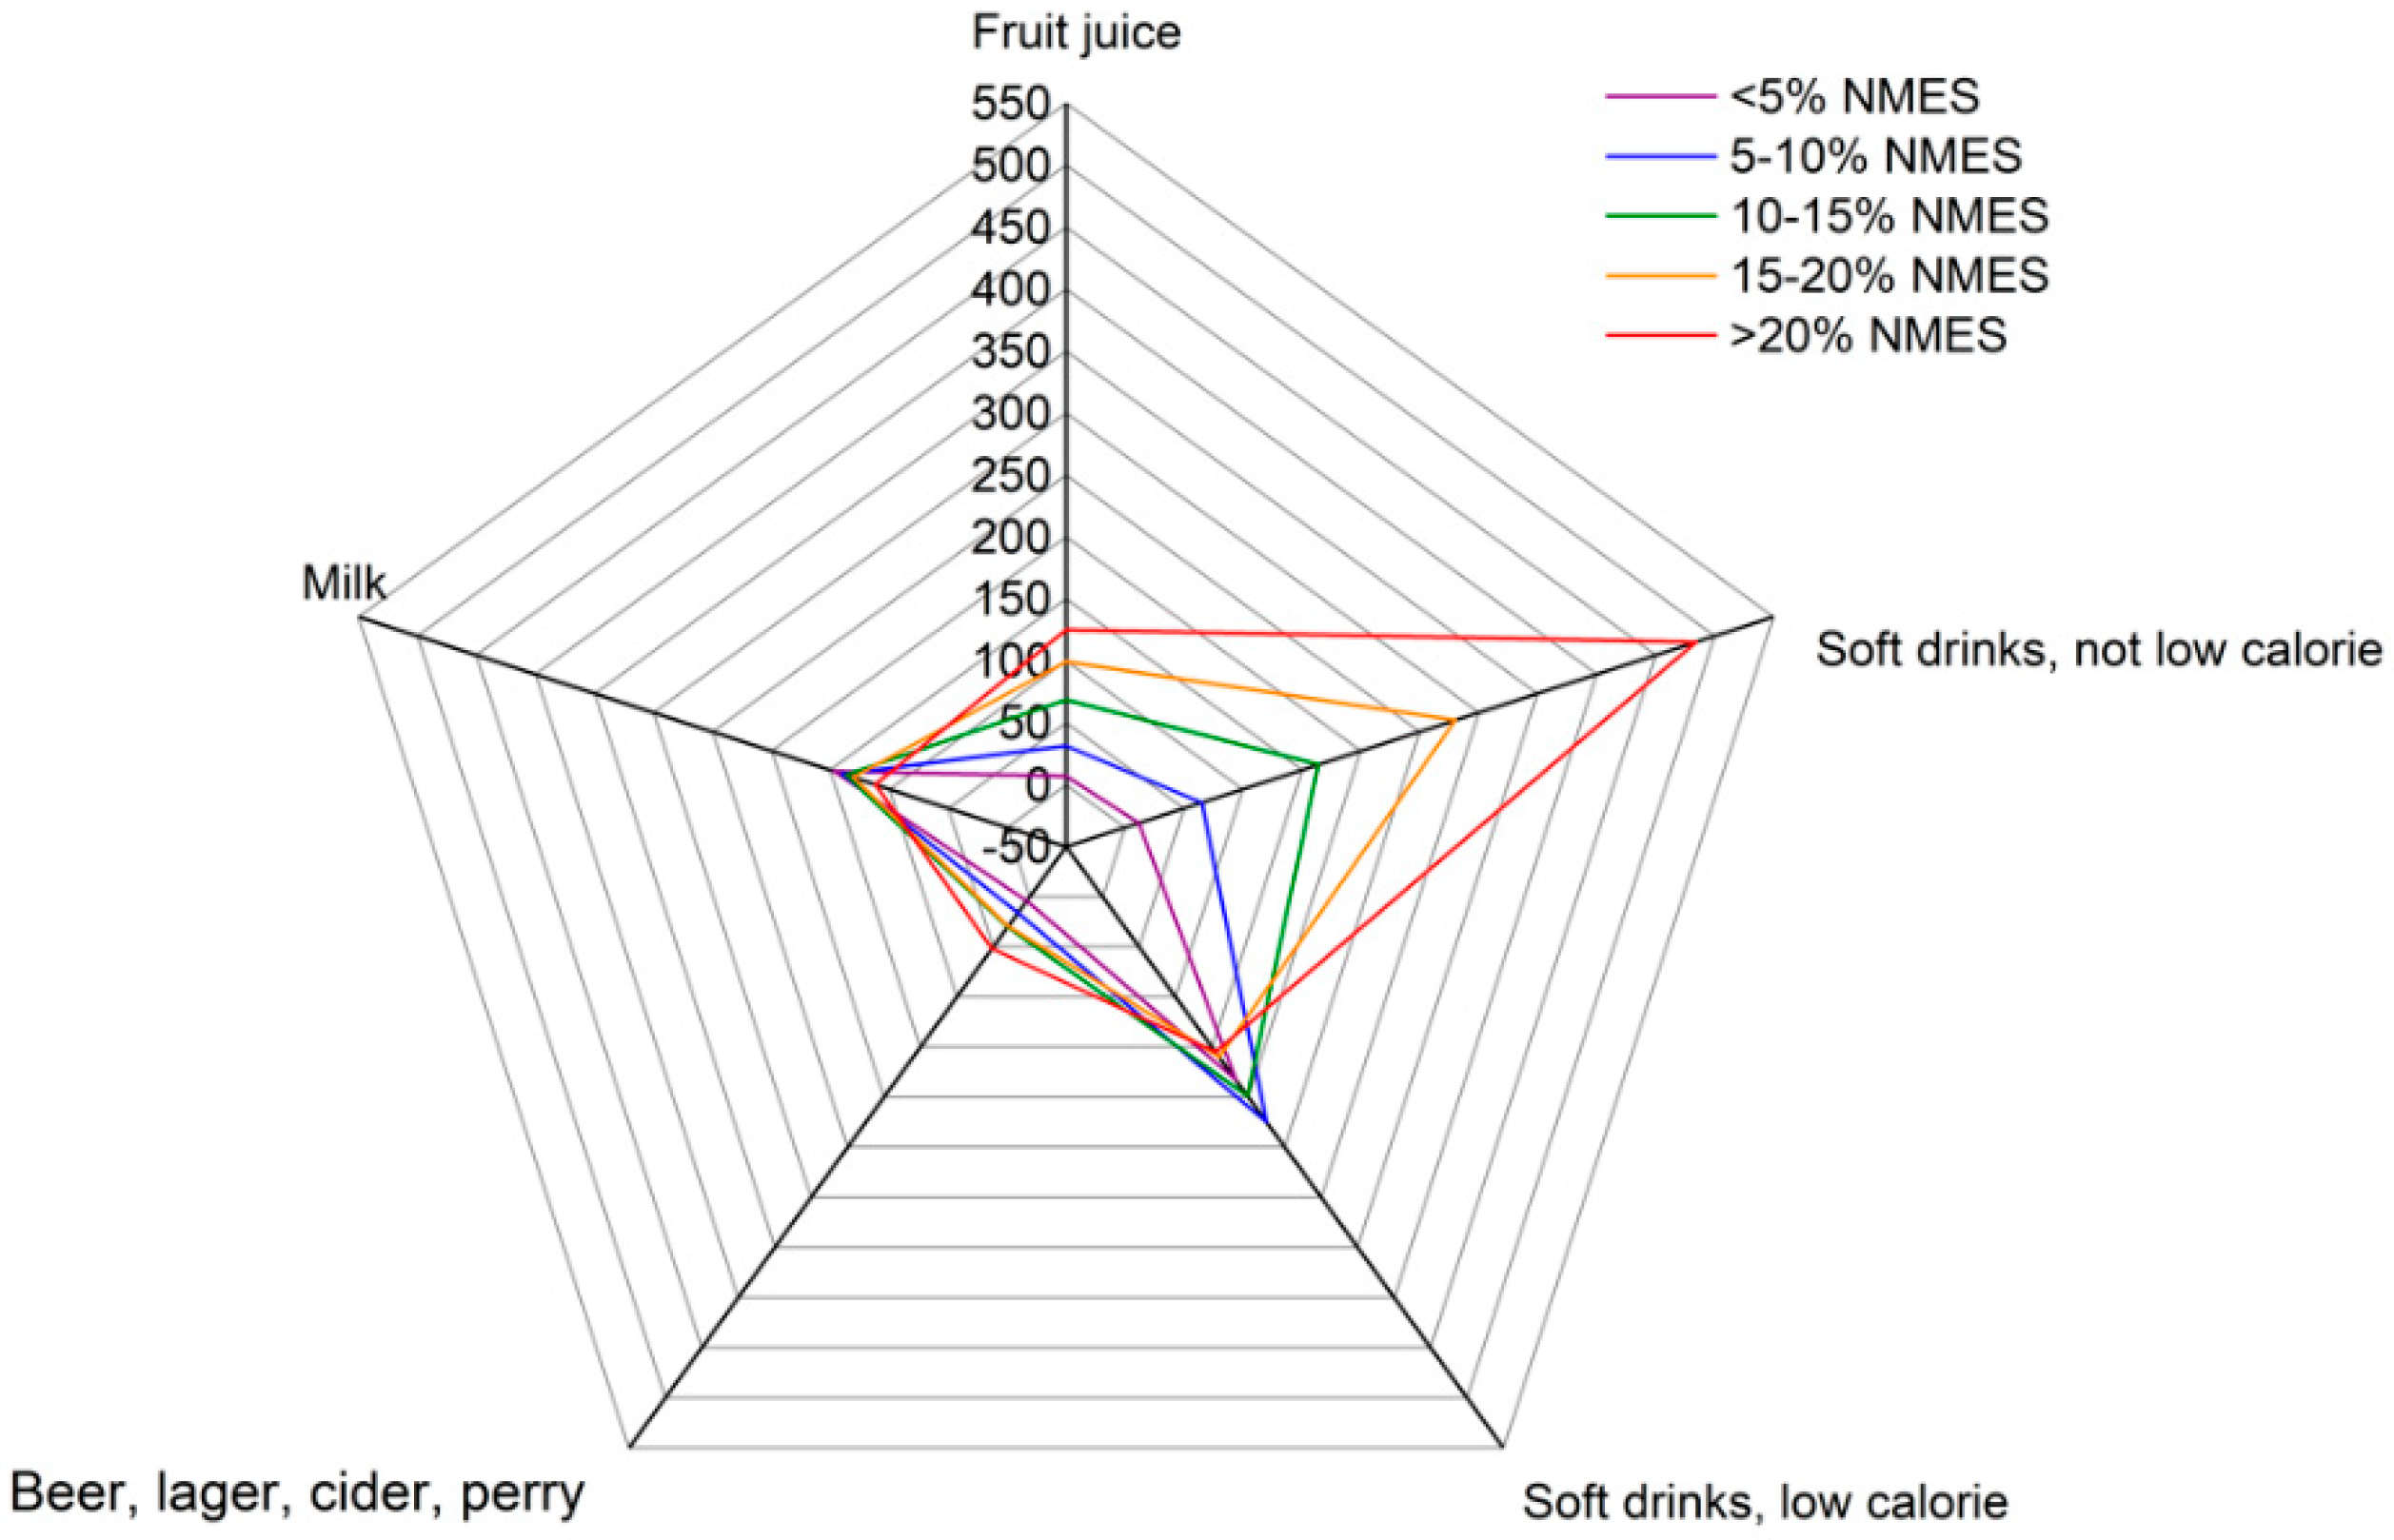
| Beverages | |||||||
| Fruit juice *** | 78 (69, 87) | 1218 (49%) | 7 (1, 13) | 31 (23, 39) | 68 (57, 80) | 99 (82, 117) | 125 (91, 160) |
| Soft drinks, not low calorie *** | 230 (213, 247) | 1957 (75%) | 12 (2, 21) | 65 (52, 78) | 164 (143, 185) | 280 (251, 308) | 484 (432, 535) |
| Soft drinks, low calorie ** | 184 (165, 202) | 1454 (54%) | 183 (71, 294) | 225 (179, 271) | 199 (162, 237) | 160 (131, 189) | 151 (114, 189) |
| Beer, lager, cider and perry *** | 31 (19, 42) | 2408 (93%) | 4 (−3, 11) | 16 (−1, 34) | 30 (13, 47) | 29 (10, 49) | 52 (18, 98) |
| Disaggregated Food Groups † | |||||||
| Total Fruit | 59 (54, 63) | 2169 (83%) | 53 (30, 75) | 69 (54, 83) | 61 (53, 69) | 55 (47, 63) | 51 (40, 62) |
| Total vegetables *** | 112 (107, 117) | 2570 (95%) | 115 (92, 138) | 119 (107, 138) | 121 (113, 130) | 110 (101, 119) | 89 (80, 98) |
| Total meat | 97 (93, 101) | 2500 (96%) | 99 (72, 125) | 97 (87, 106) | 99 (92, 106) | 98 (91, 105) | 91 (83, 99) |
| Total fish *** | 12 (11, 14) | 1214 (50%) | 18 (10, 25) | 16 (10, 22) | 12 (10, 15) | 11 (9, 13) | 8 (6, 11) |
| Variables | Total | Quantiles of Non-Milk Extrinsic Sugars Consumption (% of Total Energy/Day) | p-Value | ||||
|---|---|---|---|---|---|---|---|
| ≤5 | >5–10 | >10–15 | >15–20 | >20 | |||
| No. of participants, n | 2587 (100%) | 112 (4%) | 470 (17%) | 795 (34%) | 699 (27%) | 511 (18%) | |
| Macronutrients | |||||||
| Total Energy (TE), kcal/day | 1761 (1726, 1797) | 1390 (1216, 1565) | 1593 (1526, 1661) | 1778 (1721, 1835) | 1830 (1760, 1901) | 1872 (1777, 1967) | <0.01 |
| Food Energy (FE), kcal/day | 1750 (1714, 1785) | 1389 (1215, 1563) | 1585 (1519, 1652) | 1765 (1709, 1822) | 1820 (1750, 1890) | 1855 (1761, 1949) | <0.01 |
| Total Energy (TE), kJ/day | 7417 (7268, 7569) | 5854 (5120, 6588) | 6707 (6425, 6988) | 7485 (7247, 7723) | 7708 (7412, 8002) | 7890 (7490, 8290) | <0.01 |
| Food Energy (FE), kJ/day | 7369 (7221, 7516) | 5847 (5114, 6581) | 6672 (6393, 6950) | 7432 (7195, 7668) | 7664 (7370, 7958) | 7821 (7426, 8216) | <0.01 |
| Protein (g) | 66 (64, 67) | 66 (54, 78) | 68 (64, 71) | 68 (66, 71) | 65 (63, 68) | 60 (57, 63) | <0.01 |
| Fat, % of TE | 34 (33, 34) | 35 (33, 37) | 35 (34, 36) | 35 (34, 35) | 33 (33, 34) | 31 (30, 32) | <0.01 |
| CHO, % of TE | 51 (50, 51) | 46 (44, 48) | 48 (47, 48) | 49 (49, 50) | 52 (51, 52) | 56 (55, 56) | <0.01 |
| Total sugars | 101 (98, 104) | 38 (32 45) | 64 (61, 68) | 91 (87, 94) | 114 (111, 119) | 149 (140, 156) | <0.01 |
| Total sugars, % of TE | 21 (21, 22) | 10 (9, 12) | 15 (15 16) | 19 (19, 20) | 24 (23, 24) | 30 (29, 31) | <0.01 |
| Non-milk extrinsic sugars (NMES) | 72 (69, 74) | 13 (11, 15) | 34 (32, 35) | 60 (58, 62) | 85 (81, 88) | 122 (115, 128) | <0.01 |
| NMES, % of TE | 15 (15, 15) | 4 (3, 4) | 8 (8, 8) | 13 (12, 13) | 17 (17, 18) | 25 (24, 25) | <0.01 |
| AOAC fibre (g) | 16 (15, 16) | 15 (13, 17) | 16 (15, 17) | 17 (16, 17) | 16 (15, 16) | 14 (13, 15) | <0.01 |
| Non-starch polysaccharides (NSP) (g) | 12 (12, 12) | 11 (10, 13) | 12 (11, 13) | 12 (12, 13) | 12 (11, 12) | 10 (9, 11) | <0.01 |
| Alcohol (g) | 1.7 (1.2, 2.1) | 0.2 (−0.1, 0.5) | 1.2 (0.2, 2.0) | 1.8 (0.8, 2.8) | 1.5 (0.7, 2.2) | 2.4 (0.8, 3.9) | <0.01 |
| Micronutrients | |||||||
| Vitamin A, µg/day | 624 (590, 680) | 495 (376, 614) | 653 (548, 759) | 634 (588, 682) | 624 (557, 690) | 610 (537, 683) | 0.07 |
| Thiamin, mg/day | 1.4 (1.4, 1.4) | 1.3 (1.1, 1.5) | 1.4 (1.3, 1.4) | 1.5 (1.4, 1.5) | 1.4 (1.4, 1.5) | 1.3 (1.3, 1.4) | 0.01 |
| Riboflavin, mg/day | 1.4 (1.4, 1.5) | 1.3 (0.9, 1.6) | 1.4 (1.3, 1.5) | 1.5 (1.4, 1.5) | 1.4 (1.4, 1.5) | 1.4 (1.3, 1.5) | 0.30 |
| Niacin equivalents, mg/day | 32 (31, 33) | 31 (26, 36) | 32 (30, 34) | 33 (32, 34) | 32 (30, 33) | 31 (29, 33) | 0.40 |
| Vitamin B6, mg/day | 1.9 (1.8, 1.9) | 1.6 (1.3, 1.9) | 1.7 (1.6, 1.9) | 1.8 (1.7, 1.9) | 1.9 (1.8, 2.0) | 2.1 (1.8, 2.4) | <0.01 |
| Vitamin B12, µg/day | 4.2 (4.0, 4.4) | 4.0 (3.0, 5.0) | 4.4 (4.0, 4.7) | 4.3 (4.0, 4.6) | 4.1 (3.8, 4.4) | 4.1 (3.7, 4.5) | 0.37 |
| Folate, µg/day | 205 (200, 211) | 181 (153, 209) | 201 (186, 216) | 214 (196, 220) | 208 (197, 220) | 194 (181, 206) | <0.01 |
| Vitamin C, mg/day | 80 (76, 83) | 51 (40, 63) | 61 (55, 68) | 78 (72, 84) | 84 (78, 90) | 99 (88, 111) | <0.01 |
| Vitamin D, µg/day | 2.2 (2.1, 2.3) | 2.1 (1.7, 2.5) | 2.2 (2.1, 2.4) | 2.3 (2.1, 2.5) | 2.1 (2.0, 2.2) | 1.9 (1.7, 2.2) | <0.01 |
| Vitamin E, mg/day | 8.8 (8.5, 9.1) | 7.7 (6.8, 8.5) | 8.5 (8.0, 9.0) | 9.3 (8.8, 9.7) | 8.9 (8.5, 9.3) | 8.3 (7.7, 8.9) | <0.01 |
| Iron, mg/day | 9.5 (9.3, 9.7) | 8.3 (6.9, 9.6) | 9.3 (8.9, 9.7) | 9.9 (9.5, 10.2) | 9.6 (9.2, 10.0) | 9.0 (8.4, 9.5) | <0.01 |
| Calcium, mg/day | 782 (758, 805) | 664 (525, 804) | 774 (722, 826) | 812 (772, 853) | 788 (746, 830) | 750 (693, 808) | 0.03 |
| Magnesium, mg/day | 210 (205, 214) | 189 (162, 216) | 207 (195, 219) | 217 (209, 225) | 211 (203, 219) | 201 (190, 211) | <0.01 |
| Potassium, mg/day | 2305 (2255, 2355) | 2024 (1710, 2339) | 2211 (2098, 2324) | 2391 (2300, 2484) | 2355 (2265, 2445) | 2224 (2105, 2344) | <0.01 |
| Zinc, mg/day | 7.3 (7.2, 7.5) | 7.2 (6.0, 8.3) | 7.7 (7.2, 8.2) | 7.7 (7.4, 8.0) | 7.2 (6.9, 7.5) | 6.6 (6.2, 7.0) | <0.01 |
| Iodine, mg/day | 124 (119, 129) | 105 (80, 130) | 128 (115, 140) | 130 (119, 141) | 122 (114, 130) | 118 (108, 129) | 0.07 |
| Sodium, mg/day | 2114 (2063, 2164) | 1898 (1631, 2165) | 2052 (1944, 2161) | 2185 (2096, 2274) | 2150 (2049, 2250) | 2038 (1908, 2168) | 0.01 |
| Variables | Total | Quantiles of Non-Milk Extrinsic Sugars Consumption (% of Total Energy/Day) | |||||
|---|---|---|---|---|---|---|---|
| ≤5 | >5–10 | >10–15 | >15–20 | >20 | p-Value | ||
| No. of participants, n | 2587 (100%) | 112 (4%) | 470 (17%) | 795 (34%) | 699 (27%) | 511 (18%) | |
| Micronutrients | |||||||
| Vitamin A, µg/day | 16 (13, 18) | 21 (12, 35) | 16 (11, 24) | 12 (9, 17) | 18 (13, 23) | 17 (12, 25) | 0.09 |
| Riboflavin, mg/day | 16 (13, 18) | 39 (23, 56) | 20 (15, 27) | 13 (9, 17) | 13 (9, 17) | 16 (11, 22) | <0.01 |
| Vitamin B12, µg/day | 2 (1, 3) | 5 (2, 13) | 1 (1, 3) | 1 (0, 4) | 1 (0, 3) | 2 (1, 6) | 0.31 |
| Folate, µg/day | 7 (5, 9) | 12 (5, 26) | 6 (3, 11) | 5 (3, 8) | 6 (4, 10) | 12 (7, 18) | 0.03 |
| Vitamin C, mg/day | 1 (1, 2) | 4 (1, 19) | 2 (1, 6) | 0 (0, 2) | 1 (0, 5) | 2 (1, 5) | 0.11 |
| Iron, mg/day | 28 (25, 31) | 44 (29, 61) | 30 (23, 37) | 25 (20, 30) | 25 (20, 31) | 33 (26, 41) | 0.01 |
| Calcium, mg/day | 15 (13, 17) | 31 (18, 49) | 18 (13, 25) | 10 (7, 14) | 13 (10, 18) | 18 (13, 25) | <0.01 |
| Magnesium, mg/day | 39 (36, 42) | 51 (35, 67) | 45 (37, 52) | 33 (28, 38) | 37 (31, 43) | 44 (37, 52) | <0.01 |
| Potassium, mg/day | 25 (22, 28) | 37 (23, 55) | 30 (23, 38) | 22 (17, 27) | 21 (17, 27) | 29 (22, 36) | 0.01 |
| Zinc, mg/day | 19 (16, 21) | 27 (15, 44) | 19 (13, 26) | 13 (10, 17) | 19 (14, 25) | 27 (21, 35) | <0.01 |
| Iodine, mg/day | 18 (16, 21) | 37 (22, 54) | 21 (15, 28) | 14 (10, 18) | 16 (12, 21) | 22 (16, 28) | <0.01 |
© 2019 by the authors. Licensee MDPI, Basel, Switzerland. This article is an open access article distributed under the terms and conditions of the Creative Commons Attribution (CC BY) license (http://creativecommons.org/licenses/by/4.0/).
Share and Cite
Lai, H.T.; Hutchinson, J.; Evans, C.E.L. Non-Milk Extrinsic Sugars Intake and Food and Nutrient Consumption Patterns among Adolescents in the UK National Diet and Nutrition Survey, Years 2008–16. Nutrients 2019, 11, 1621. https://doi.org/10.3390/nu11071621
Lai HT, Hutchinson J, Evans CEL. Non-Milk Extrinsic Sugars Intake and Food and Nutrient Consumption Patterns among Adolescents in the UK National Diet and Nutrition Survey, Years 2008–16. Nutrients. 2019; 11(7):1621. https://doi.org/10.3390/nu11071621
Chicago/Turabian StyleLai, Heidi T., Jayne Hutchinson, and Charlotte E. L. Evans. 2019. "Non-Milk Extrinsic Sugars Intake and Food and Nutrient Consumption Patterns among Adolescents in the UK National Diet and Nutrition Survey, Years 2008–16" Nutrients 11, no. 7: 1621. https://doi.org/10.3390/nu11071621