Total and Subtypes of Dietary Fat Intake and Its Association with Components of the Metabolic Syndrome in a Mediterranean Population at High Cardiovascular Risk

 , ,
, ,  , , , , , , , , , , , , ,
  , , , , , and add
Show full author list
, , , , , and add
Show full author list
Abstract
:
1. Introduction
2. Methods
2.1. Study Design
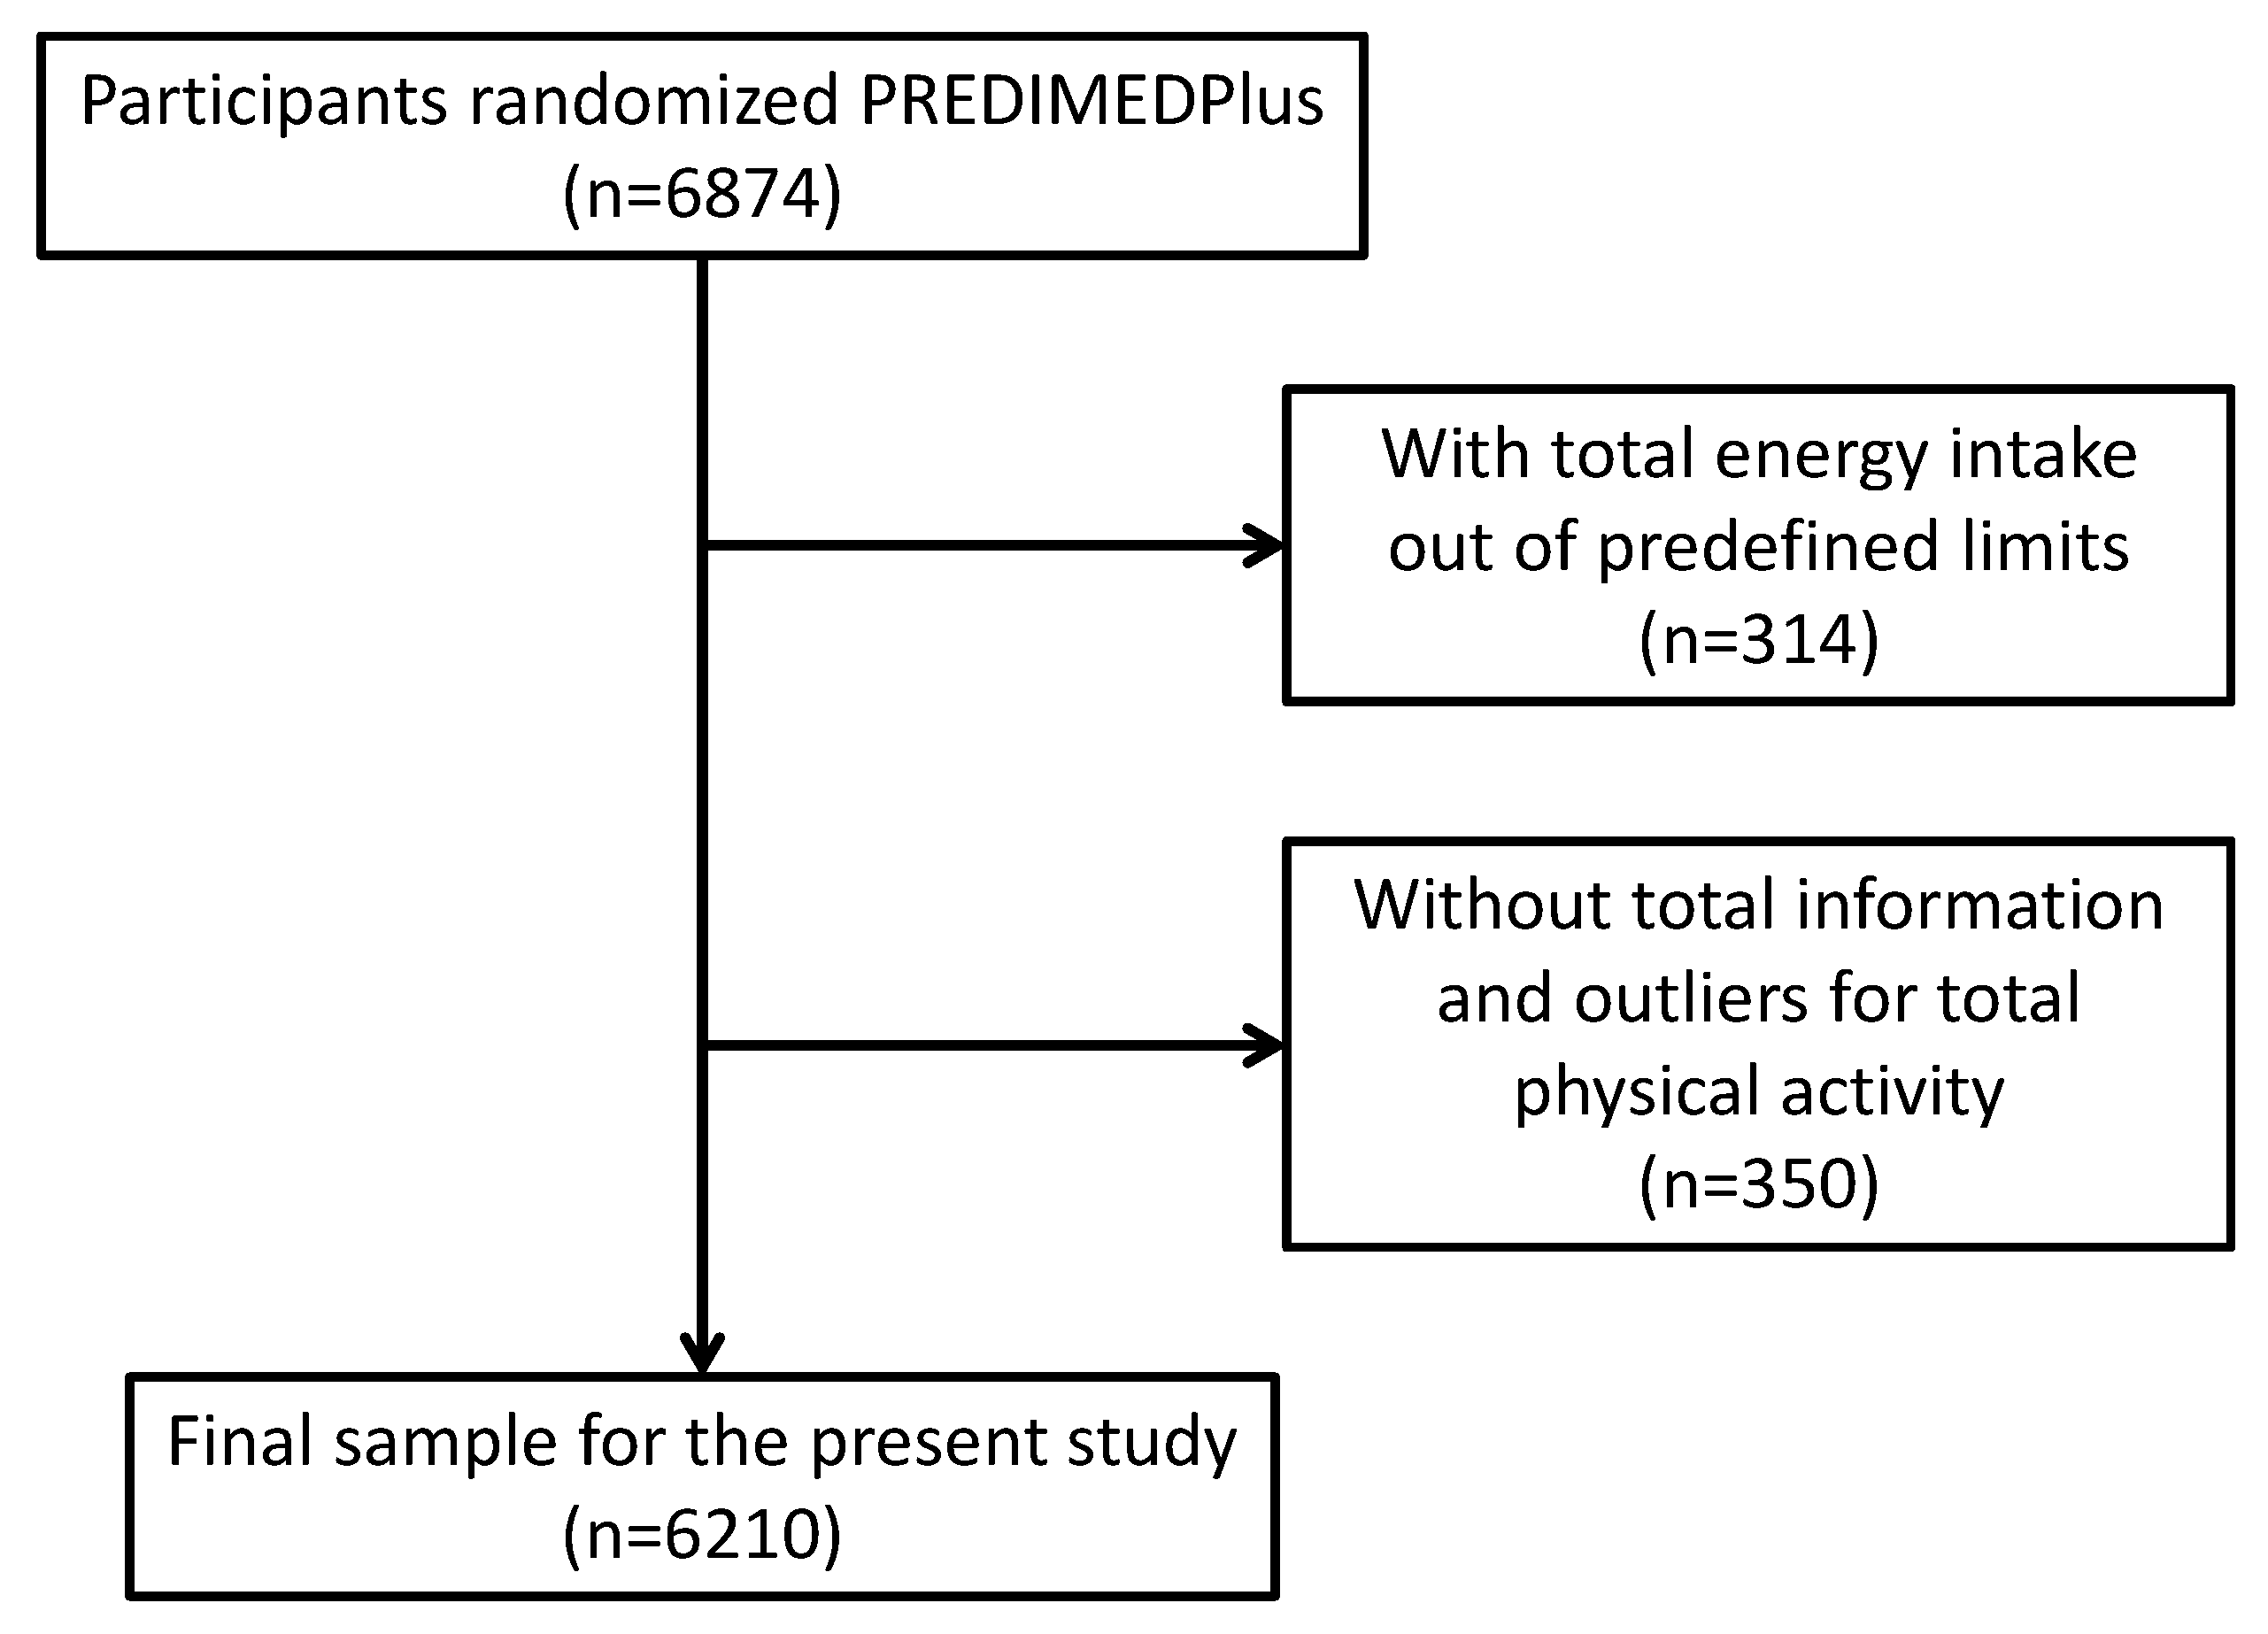
2.2. Participants, Recruitment, and Randomization
2.3. Ethics
2.4. Dietary Assessment
2.5. Determination of Fat Intake
2.6. Physical Activity
2.7. Anthropometric and Blood Pressure Measurements
2.8. Blood Collection and Analysis
2.9. Other Health Outcomes
2.10. Statistical Analyses
3. Results
4. Discussion
5. Strengths and Limitations
6. Conclusions
Author Contributions
Funding
Acknowledgments
Conflicts of Interest
Abbreviations
References
- Rowley, W.R.; Bezold, C.; Arikan, Y.; Byrne, E.; Krohe, S. Diabetes 2030: Insights from yesterday, today, and future trends. Popul. Health Manag. 2017, 20, 6–12. [Google Scholar] [CrossRef] [PubMed]
- Kelly, T.; Yang, W.; Chen, C.S.; Reynolds, K.; He, J. Global burden of obesity in 2005 and projections to 2030. Int. J. Obes. 2008, 32, 1431–1437. [Google Scholar] [CrossRef] [PubMed] [Green Version]
- RTI International. Projections of Cardiovascular Disease Prevalence and Costs: 2015–2035. Available online: https://healthmetrics.heart.org/wp-content/uploads/2017/10/Projections-of-Cardiovascular-Disease.pdf (accessed on 10 December 2018).
- Riaz, H.; Khan, M.S.; Siddiqi, T.J.; Usman, M.S.; Shah, N.; Goyal, A.; Khan, S.S.; Mookadam, F.; Krasuski, R.A.; Ahmed, H. Association Between Obesity and Cardiovascular Outcomes: A Systematic Review and Meta-analysis of Mendelian Randomization Studies. JAMA Netw. Open 2018, 1, e183788. [Google Scholar] [CrossRef] [PubMed]
- Mozaffarian, D.; Ludwig, D.S. The 2015 US dietary guidelines: Lifting the ban on total dietary fat. JAMA 2015, 313, 2421–2422. [Google Scholar] [CrossRef] [PubMed]
- Billingsley, H.E.; Carbone, S.; Lavie, C.J. Dietary Fats and Chronic Noncommunicable Diseases. Nutrients 2018, 10, 1385. [Google Scholar] [CrossRef]
- Siri-Tarino, P.W.; Sun, Q.; Hu, F.B.; Krauss, R.M. Meta-analysis of prospective cohort studies evaluating the association of saturated fat with cardiovascular disease. Am. J. Clin. Nutr. 2010, 91, 535–546. [Google Scholar] [CrossRef] [PubMed] [Green Version]
- Harcombe, Z.; Baker, J.S.; Di Nicolantonio, J.J.; Grace, F.; Davies, B. Evidence from randomised controlled trials does not support current dietary fat guidelines: A systematic review and meta-analysis. Open Heart 2016, 3, e000409. [Google Scholar] [CrossRef]
- The United States Department of Health & Human Services; The U.S. Department of Agriculture. 2015–2020 Dietary Guidelines for Americans. 2015. Available online: https://health.gov/dietaryguidelines/2015/guidelines/ (accessed on 10 December 2018).
- Bach-Faig, A.; Berry, E.M.; Lairon, D.; Reguant, J.; Trichopoulou, A.; Dernini, S.; Medina, F.X.; Battino, M.; Belahsen, R.; Miranda, G.; et al. Mediterranean Diet Foundation Expert Group.Mediterranean diet pyramid today. Sci. Cult. Updates Public Health Nutr. 2011, 14, 2274–2284. [Google Scholar] [CrossRef]
- Malakou, E.; Linardakis, M.; Armstrong, M.E.G.; Zannidi, D.; Foster, C.; Johnson, L.; Papadaki, A. The Combined Effect of Promoting the Mediterranean Diet and Physical Activity on Metabolic Risk Factors in Adults: A Systematic Review and Meta-Analysis of Randomised Controlled Trials. Nutrients 2018, 10, 1577. [Google Scholar] [CrossRef]
- Bloomfield, H.E.; Greer, N.; Kane, R.; Wilt, T.J. Effects on Health Outcomes of a Mediterranean Diet With No Restriction on Fat Intake. Ann. Intern. Med. 2017, 166, 378–379. [Google Scholar] [CrossRef]
- Estruch, R.; Ros, E.; Salas-Salvadó, J.; Covas, M.I.; Corella, D.; Arós, F.; Gómez-Gracia, E.; Ruiz-Gutiérrez, V.; Fiol, M.; Lapetra, J.; et al. Primary prevention of cardiovascular disease with a Mediterranean diet. N. Engl. J. Med. 2013, 368, 1279–1290. [Google Scholar] [CrossRef] [PubMed]
- Martínez-González, M.A.; Buil-Cosiales, P.; Corella, D.; Bulló, M.; Fitó, M.; Vioque, J.; Romaguera, D.; Martínez, J.A.; Wärnberg, J.; López-Miranda, J.; et al. Cohort Profile: Design and methods of the PREDIMED-Plus randomized trial. Int. J. Epidemiol. 2018. [Google Scholar] [CrossRef] [PubMed]
- Alberti, K.G.; Eckel, R.H.; Grundy, S.M.; Zimmet, P.Z.; Cleeman, J.I.; Donato, K.A.; Fruchart, J.C.; James, W.P.; Loria, C.M.; Smith, S.C., Jr. Harmonizing the metabolic syndrome: A joint interim statement of the International Diabetes Federation Task Force on Epidemiology and Prevention; National Heart, Lung, and Blood Institute; American Heart Association; World Heart Federation; International Atherosclerosis Society; and International Association for the Study of Obesity. Circulation 2009, 120, 1640–1645. [Google Scholar] [PubMed]
- Sánchez-Tainta, A.; Zazpe, I.; Bes-Rastrollo, M.; Salas-Salvadó, J.; Bullo, M.; Sorlí, J.V.; Corella, D.; Covas, M.I.; Arós, F.; Gutierrez-Bedmar, M.; et al. Nutritional adequacy according to carbohydrates and fat quality. Eur. J. Nutr. 2016, 55, 93–106. [Google Scholar] [CrossRef] [PubMed]
- Fernández-Ballart, J.D.; Piñol, J.L.; Zazpe, I.; Corella, D.; Carrasco, P.; Toledo, E.; Pérez-Bauer, M.; Martínez-González, M.A.; Salas-Salvadó, J.; Martín-Moreno, J.M. Relative validity of a semi-quantitative food-frequency questionnaire in an elderly Mediterranean population of Spain. Br. J. Nutr. 2010, 103, 1808–1816. [Google Scholar] [Green Version]
- Martin-Moreno, J.M.; Boyle, P.; Gorgojo, L.; Maisonneuve, P.; Fernandez-Rodriguez, J.C.; Salvini, S.; Willett, W.C. Development and validation of a food frequency questionnaire in Spain. Int. J. Epidemiol. 1993, 22, 512–519. [Google Scholar] [CrossRef] [PubMed]
- de la Fuente-Arrillaga, C.; Ruiz, Z.V.; Bes-Rastrollo, M.; Sampson, L.; Martínez-González, M.A. Reproducibility of an FFQ validated in Spain. Public Health Nutr. 2010, 13, 1364–1372. [Google Scholar] [CrossRef]
- The National Academies of Sciences Engineering Medicine, Institute of Medicine (US). Food and Nutrition Board. Dietary Reference Intakes (DRIs): Estimated Average Requirements Values. Available online: http://nationalacademies.org/hmd/~/media/Files/Activity%20Files/Nutrition/DRI-Tables/1_%20EARs.pdf?la=en (accessed on 6 November 2018).
- The National Academies of Sciences Engineering Medicine, Institute of Medicine (US). Food and Nutrition Board. Dietary Reference Intakes (DRIs): Recommended Dietary Allowance and Adequate Intake Values, Vitamins and Elements. Available online: http://nationalacademies.org/hmd/~/media/Files/Activity%20Files/Nutrition/DRI-Tables/2_%20RDA%20and%20AI%20Values_Vitamin%20and%20Elements.pdf?la=en (accessed on 6 November 2018).
- Institute of Medicine (US). Dietary Reference Intakes for Vitamin D and Calcium; Ross, A.C., Taylor, C.L., Yaktine, A.L., Del Valle, H.B., Eds.; National Academies Press: Washington, DC, USA, 2011; Available online: https://www.ncbi.nlm.nih.gov/books/NBK56070/ (accessed on 6 November 2018).
- Institute of Medicine (US); Subcommittee on Interpretation and Uses of Dietary Reference Intakes; Institute of Medicine (US) Standing Committee on the Scientific Evaluation of Dietary Reference Intakes. DRI Dietary Reference Intakes: Applications in Dietary Assessment; National Academies Press: Washington, DC, USA, 2000; Available online: https://www.ncbi.nlm.nih.gov/books/NBK222872/ (accessed on 6 November 2018).
- Signorello, L.B.; Munro, H.M.; Buchowski, M.S.; Schlundt, D.G.; Cohen, S.S.; Hargreaves, M.K.; Blot, W.J. Estimating nutrient intake from a food frequency questionnaire: Incorporating the elements of race and geographic region. Am. J. Epidemiol. 2009, 170, 104–111. [Google Scholar] [CrossRef]
- Schröder, H.; Fitó, M.; Estruch, R.; Martínez-González, M.A.; Corella, D.; Salas-Salvadó, J.; Lamuela-Raventós, R.; Ros, E.; Salaverría, I.; Fiol, M.; et al. A short screener is valid for assessing Mediterranean diet adherence among older Spanish men and women. J. Nutr. 2011, 141, 1140–1145. [Google Scholar] [CrossRef]
- Topolski, T.D.; LoGerfo, J.; Patrick, D.L.; Williams, B.; Walwick, J.; Patrick, M.B. The Rapid Assessment of Physical Activity (RAPA) among older adults. Prev. Chronic Dis. 2006, 3, A118. [Google Scholar]
- Molina, L.; Sarmiento, M.; Peñafiel, J.; Donaire, D.; Garcia-Aymerich, J.; Gomez, M.; Ble, M.; Ruiz, S.; Frances, A.; Schröder, H.; et al. Validation of the Regicor Short Physical Activity Questionnaire for the Adult Population. PLoS ONE 2017, 12, e0168148. [Google Scholar] [CrossRef] [PubMed]
- Elosua, R.; Garcia, M.; Aguilar, A.; Molina, L.; Covas, M.I.; Marrugat, J. Validation of the Minnesota Leisure Time Physical Activity Questionnaire In Spanish Women. Investigators of the MARATDON Group. Med. Sci. Sports Exerc. 2000, 32, 1431–1437. [Google Scholar] [CrossRef] [PubMed]
- Elosua, R.; Marrugat, J.; Molina, L.; Pons, S.; Pujol, E. Validation of the Minnesota Leisure Time Physical Activity Questionnaire in Spanish men. Am. J. Epidemiol. 1994, 139, 1197–1209. [Google Scholar] [CrossRef] [PubMed]
- Ainsworth, B.E.; Haskell, W.L.; Herrmann, S.D.; Meckes, N.; Bassett, D.R., Jr.; Tudor-Locke, C.; Greer, J.L.; Vezina, J.; Whitt-Glover, M.C.; Leon, A.S. 2011 Compendium of Physical Activities: A second update of codes and MET values. Med. Sci. Sports Exerc. 2011, 43, 1575–1581. [Google Scholar] [CrossRef] [PubMed]
- Rosique-Esteban, N.; Díaz-López, A.; Martínez-González, M.A.; Corella, D.; Goday, A.; Martínez, J.A.; Romaguera, D.; Vioque, J.; Arós, F.; Garcia-Rios, A.; et al. Leisure-time physical activity, sedentary behaviors, sleep, and cardiometabolic risk factors at baseline in the PREDIMED-PLUS intervention trial: A cross-sectional analysis. PLoS ONE. 2017, 12, e0172253. [Google Scholar] [CrossRef] [PubMed]
- Willet, W.C. Nutritional Epidemiology, 2nd ed.; Oxford University Press: New York, NY, USA, 1998. [Google Scholar]
- Willet, W.C.; Howe, G.R.; Kushi, L.W. Adjustment for total energy intake in epidemiologic studies. Am. J. Clin. Nutr. 1997, 65, 1220S–1228S. [Google Scholar] [CrossRef] [PubMed]
- Feskens, E.J.; Virtanen, S.M.; Räsänen, L.; Tuomilehto, J.; Stengård, J.; Pekkanen, J.; Nissinen, A.; Kromhout, D. Dietary factors determining diabetes and impaired glucose tolerance. A 20-year follow-up of the Finnish and Dutch cohorts of the Seven Countries Study. Diabetes Care 1995, 18, 1104–1112. [Google Scholar] [CrossRef] [PubMed]
- Narasimhan, S.; Nagarajan, L.; Vaidya, R.; Gunasekaran, G.; Rajagopal, G.; Parthasarathy, V.; Unnikrishnan, R.; Anjana, R.M.; Mohan, V.; Sudha, V. Dietary fat intake and its association with risk ofselectedcomponents of the metabolic syndrome among rural South Indians. Indian J. Endocrinol. Metab. 2016, 20, 47–54. [Google Scholar]
- Thanopoulou, A.C.; Karamanos, B.G.; Angelico, F.V.; Assaad-Khalil, S.H.; Barbato, A.F.; Del Ben, M.P.; Djordjevic, P.B.; Dimitrijevic-Sreckovic, V.S.; Gallotti, C.A.; Katsilambros, N.L.; et al. Dietary fatintake as risk factor for the development of diabetes: Multinational, multicenter study of the Mediterranean Group for the Study of Diabetes (MGSD). Diabetes Care 2003, 26, 302–307. [Google Scholar] [CrossRef]
- van de Laar, F.A.; van de Lisdonk, E.H.; Lucassen, P.L.; Tigchelaar, J.M.; Meyboom, S.; Mulder, J.; van den Hoogen, H.J.; Rutten, G.E.; van Weel, C. Fat intake in patients newly diagnosed with type 2 diabetes: A 4-year follow-up study in general practice. Br. J. Gen. Pract. 2004, 54, 177–182. [Google Scholar]
- Hu, F.B.; van Dam, R.M.; Liu, S. Diet and risk of Type II diabetes: The role of types of fat and carbohydrate. Diabetologia 2001, 44, 805–817. [Google Scholar] [CrossRef] [PubMed]
- Salmerón, J.; Hu, F.B.; Manson, J.E.; Stampfer, M.J.; Colditz, G.A.; Rimm, E.B.; Willett, W.C. Dietary fat intake and risk of type 2 diabetes in women. Am. J. Clin. Nutr. 2001, 73, 1019–1026. [Google Scholar] [CrossRef] [PubMed]
- Meyer, K.A.; Kushi, L.H.; Jacobs, D.R.; Folsom, A.R. Dietary fat and incidence of type 2 diabetes in older Iowa women. Diabetes Care 2001, 24, 1528–1535. [Google Scholar] [CrossRef] [PubMed]
- Alhazmi, A.; Stojanovski, E.; McEvoy, M.; Garg, M.L. Macronutrient intake and type 2 diabetes risk in middle-aged Australian women. Resultsfrom the Australian Longitudinal Study on Women’s Health. Public Health Nutr. 2014, 17, 1587–1594. [Google Scholar] [CrossRef] [PubMed]
- Guasch-Ferré, M.; Becerra-Tomás, N.; Ruiz-Canela, M.; Corella, D.; Schröder, H.; Estruch, R.; Ros, E.; Arós, F.; Gómez-Gracia, E.; Fiol, M.; et al. Total and subtypes of dietary fatintake and risk oftype 2 diabetes mellitus in the Prevención con Dieta Mediterránea (PREDIMED) study. Am. J. Clin. Nutr. 2017, 105, 723–735. [Google Scholar] [CrossRef] [PubMed]
- Sánchez-Íñigo, L.; Navarro-González, D.; Pastrana-Delgado, J.; Fernández-Montero, A.; Martínez, J.A. Association of triglycerides and new lipid markers with the incidence of hypertension in a Spanish cohort. J. Hypertens. 2016, 34, 1257–1265. [Google Scholar] [CrossRef] [PubMed]
- Navarro-González, D.; Sánchez-Íñigo, L.; Pastrana-Delgado, J.; Fernández-Montero, A.; Martinez, J.A. Triglyceride-glucose index (TyG index) in comparison with fasting plasma glucose improved diabetes prediction in patients with normal fasting glucose: The Vascular-Metabolic CUN cohort. Prev. Med. 2016, 86, 99–105. [Google Scholar] [CrossRef]
- Navarro-González, D.; Sánchez-Íñigo, L.; Fernández-Montero, A.; Pastrana-Delgado, J.; Martinez, J.A. TyG Index Change Is More Determinant for Forecasting Type 2 Diabetes Onset Than Weight Gain. Medicine 2016, 95, e3646. [Google Scholar] [CrossRef]
- Sánchez-Íñigo, L.; Navarro-González, D.; Fernández-Montero, A.; Pastrana-Delgado, J.; Martínez, J.A. The TyG index may predict the development of cardiovascular events. Eur. J. Clin. Investig. 2016, 46, 189–197. [Google Scholar] [CrossRef]
- Siri-Tarino, P.W.; Chiu, S.; Bergeron, N.; Krauss, R.M. Saturated Fats Versus Polyunsaturated Fats Versus Carbohydrates for Cardiovascular Disease Prevention and Treatment. Ann. Rev. Nutr. 2015, 35, 517–543. [Google Scholar] [CrossRef] [Green Version]
- de Souza, R.J.; Mente, A.; Maroleanu, A.; Cozma, A.I.; Ha, V.; Kishibe, T.; Uleryk, E.; Budylowski, P.; Schünemann, H.; Beyene, J.; et al. Intake of saturated and trans-unsaturatedfattyacids and risk of all cause mortality, cardiovascular disease, and type2diabetes: Systematicreview and meta-analysis of observationalstudies. BMJ 2015, 351, h3978. [Google Scholar] [CrossRef] [PubMed]
- Yubero-Serrano, E.M.; Delgado-Lista, J.; Tierney, A.C.; Perez-Martinez, P.; Garcia-Rios, A.; Alcala-Diaz, J.F.; Castaño, J.P.; Tinahones, F.J.; Drevon, C.A.; Defoort, C.; et al. Insulin resistance determines a differential response to changes in dietary fat modification on metabolic syndrome risk factors: The LIPGENE study. Am. J. Clin. Nutr. 2015, 102, 1509–1517. [Google Scholar] [CrossRef] [PubMed]
- Imamura, F.; Micha, R.; Wu, J.H.; de Oliveira Otto, M.C.; Otite, F.O.; Abioye, A.I.; Mozaffarian, D. Effects of SaturatedFat, PolyunsaturatedFat, MonounsaturatedFat, and CarbohydrateonGlucose-InsulinHomeostasis: A SystematicReview and Meta-analysis of Randomised Controlled Feeding Trials. PLoS Med. 2016, 13, e1002087. [Google Scholar] [CrossRef] [PubMed]
- Via, M.A.; Mechanick, J.I. Nutrition in Type 2 Diabetes and the Metabolic Syndrome. Med. Clin. 2016, 100, 1285–1302. [Google Scholar] [CrossRef] [PubMed]
- Ebbesson, S.O.; Tejero, M.E.; Nobmann, E.D.; Lopez-Alvarenga, J.C.; Ebbesson, L.; Romenesko, T.; Carter, E.A.; Resnick, H.E.; Devereux, R.B.; MacCluer, J.W.; et al. Fatty acid consumption and metabolic syndrome components: The GOCADAN study. J. Cardiometab. Syndr. 2007, 2, 244–249. [Google Scholar] [CrossRef]
- Hekmatdoost, A.; Mirmiran, P.; Hosseini-Esfahani, F.; Azizi, F. Dietary fatty acid composition and metabolic syndrome in Tehranian adults. Nutrition 2011, 27, 1002–1007. [Google Scholar] [CrossRef] [PubMed]
- Shab-Bidar, S.; Hosseini-Esfahani, F.; Mirmiran, P.; Hosseinpour-Niazi, S.; Azizi, F. Metabolic syndrome profiles, obesity measures and intake of dietary fatty acids in adults: Tehran Lipid and Glucose Study. J. Hum. Nutr. Diet. 2014, 27, 98–108. [Google Scholar] [CrossRef]
- Hosseinpour-Niazi, S.; Mirmiran, P.; Fallah-ghohroudi, A.; Azizi, F. Combined effect of unsaturated fatty acids and saturated fatty acids on the metabolic syndrome: Tehran lipid and glucose study. J. Health Popul. Nutr. 2015, 33, 5. [Google Scholar] [CrossRef]
- Mensink, R.P. Effects of Saturated Fatty Acids on Serum Lipids and Lipoproteins: A Systematic Review and Regression Analysis; World Health Organization: Geneva, Switzerland, 2016. [Google Scholar]
- Noel, S.E.; Newby, P.K.; Ordovas, J.M.; Tucker, K.L. Adherence to an (n-3) fatty acid/fish intake pattern is inversely associated with metabolic syndrome among Puerto Rican adults in the Greater Boston area. J. Nutr. 2010, 14, 1846–1854. [Google Scholar] [CrossRef]
- Cicero, A.F.; Derosa, G.; Di Gregori, V.; Bove, M.; Gaddi, A.V.; Borghi, C. Omega 3 polyunsaturated fatty acids supplementation and blood pressure levels in hypertriglyceridemic patients with untreated normal-high blood pressure and with or without metabolic syndrome: A retrospective study. Clin. Exp. Hypertens. 2010, 32, 137–144. [Google Scholar] [CrossRef]
- Mirmiran, P.; Hosseinpour-Niazi, S.; Naderi, Z.; Bahadoran, Z.; Sadeghi, M.; Azizi, F. Association between interaction and ratio of ω-3 and ω-6 polyunsaturated fatty acid and the metabolic syndrome in adults. Nutrition 2012, 28, 856–863. [Google Scholar] [CrossRef] [PubMed]
- Jiménez-Gómez, Y.; Marín, C.; Peérez-Martínez, P.; Hartwich, J.; Malczewska-Malec, M.; Golabek, I.; Kiec-Wilk, B.; Cruz-Teno, C.; Rodríguez, F.; Gómez, P.; et al. A low-fat, high-complex carbohydrate diet supplemented with long-chain (n-3) fatty acids alters the postprandial lipoprotein profile in patients with metabolic syndrome. J. Nutr. 2010, 140, 1595–1601. [Google Scholar] [CrossRef] [PubMed]
- Paniagua, J.A.; Pérez-Martinez, P.; Gjelstad, I.M.; Tierney, A.C.; Delgado-Lista, J.; Defoort, C.; Blaak, E.E.; Risérus, U.; Drevon, C.A.; Kiec-Wilk, B.; et al. A low-fat high-carbohydrate diet supplemented with long-chain n-3 PUFA reduces the risk of the metabolic syndrome. Atherosclerosis 2011, 218, 443–450. [Google Scholar] [CrossRef] [PubMed]
- Baxheinrich, A.; Stratmann, B.; Lee-Barkey, Y.H.; Tschoepe, D.; Wahrburg, U. Effects of a rapeseed oil-enriched hypoenergetic diet with a high content of α-linolenic acid on body weight and cardiovascular risk profile in patients with the metabolic syndrome. Br. J. Nutr. 2012, 108, 682–691. [Google Scholar] [CrossRef] [PubMed]
- Tierney, A.C.; McMonagle, J.; Shaw, D.I.; Gulseth, H.L.; Helal, O.; Saris, W.H.M.; Paniagua, J.A.; Gołabek-Leszczyñska, I.; Defoort, C.; Williams, C.M.; et al. Effects of dietary fat modification on insulin sensitivity and on other risk factors of the metabolic syndrome FLIPGENE: A European randomized dietary intervention study. Int. J. Obes. 2011, 35, 800–809. [Google Scholar] [CrossRef] [PubMed]
- Miller, M.; Sorkin, J.D.; Mastella, L.; Sutherland, A.; Rhyne, J.; Donnelly, P.; Simpson, K.; Goldberg, A.P. Poly is more effective than monounsaturated fat for dietary management in the metabolic syndrome: The muffin study. J. Clin. Lipidol. 2016, 10, 996–1003. [Google Scholar] [CrossRef] [Green Version]
- Wang, D.D.; Hu, F.B. Dietary Fat and Risk of Cardiovascular Disease: Recent Controversies and Advances. Ann. Rev. Nutr. 2017, 37, 423–446. [Google Scholar] [CrossRef]
- Salas-Salvadó, J.; Márquez-Sandoval, F.; Bulló, M. Conjugated linoleic acid intake in humans: A systematic review focusing on its effect on body composition, glucose, and lipid metabolism. Crit. Rev. Food Sci. Nutr. 2006, 46, 479–488. [Google Scholar] [CrossRef]
- Farvid, M.S.; Ding, M.; Pan, A.; Sun, Q.; Chiuve, S.E.; Steffen, L.M.; Willett, W.C.; Hu, F.B. Dietary linoleic acid and risk of coronary heart disease: A systematic review and meta-analysis of prospective cohort studies. Circulation 2014, 130, 1568–1578. [Google Scholar] [CrossRef]
- Yanai, H.; Katsuyama, H.; Hamasaki, H.; Abe, S.; Tada, N.; Sako, A. Effects of Dietary FatIntake on HDLMetabolism. J. Clin. Med. Res. 2015, 7, 145–149. [Google Scholar] [CrossRef]
- Micha, R.; Wallace, S.K.; Mozaffarian, D. Red and processed meat consumption and risk of incident coronary heart disease, stroke, and diabetes mellitus: A systematic review and meta-analysis. Circulation 2010, 121, 2271–2283. [Google Scholar] [CrossRef] [PubMed]
- Hooper, L.; Martin, N.; Abdelhamid, A.; Davey Smith, G. Reduction in saturated fat intake for cardiovascular disease. Cochrane Database Syst. Rev. 2015, CD011737. [Google Scholar] [CrossRef] [PubMed]
- Celis-Morales, C.; Livingstone, K.M.; Affleck, A.; Navas-Carretero, S.; San-Cristobal, R.; Martinez, J.A.; Marsaux, C.F.M.; Saris, W.H.M.; O’Donovan, C.B.; Forster, H.; et al. Food4Me Study. Correlates of overall and central obesity in adults from seven European countries: Findings from the Food4Me Study. Eur. J. Clin. Nutr. 2018, 72, 207–219. [Google Scholar] [CrossRef] [PubMed]
- Hooper, L.; Abdelhamid, A.; Bunn, D.; Brown, T.; Summerbell, C.D.; Skeaff, C.M. Effects of total fat intake on body weight. Cochrane Database Syst. Rev. 2015, CD011834. [Google Scholar] [CrossRef] [Green Version]
- Beulen, Y.; Martínez-González, M.A.; van de Rest, O.; Salas-Salvadó, J.; Sorlí, J.V.; Gómez-Gracia, E.; Fiol, M.; Estruch, R.; Santos-Lozano, J.M.; Schröder, H.; et al. Quality of Dietary Fat Intake and Body Weight and Obesity in a Mediterranean Population: Secondary Analyses within the PREDIMED Trial. Nutrients 2018, 10, 2011. [Google Scholar] [CrossRef] [PubMed]
- Kahn, R.; Buse, J.; Ferrannini, E.; Stern, M.; American Diabetes Association; European Association for the Study of Diabetes. The metabolic syndrome: Time for a critical appraisal: Joint statement from the American Diabetes Association and the European Association for the Study of Diabetes. Diabetes Care 2005, 28, 2289–2304. [Google Scholar] [CrossRef] [PubMed]
- Simmons, R.K.; Alberti, K.G.; Gale, E.A.; Colagiuri, S.; Tuomilehto, J.; Qiao, Q.; Ramachandran, A.; Tajima, N.; Brajkovich Mirchov, I.; Ben-Nakhi, A.; et al. The metabolic syndrome: Useful concept or clinical tool? Report of a WHO Expert Consultation. Diabetologia 2010, 53, 600–605. [Google Scholar] [CrossRef]
- Oda, E. Metabolic syndrome: Its history, mechanisms, and limitations. Acta Diabetol. 2012, 49, 89–95. [Google Scholar] [CrossRef]


| Total Fat | MUFAs | PUFAs | SFAs | |||||||||
|---|---|---|---|---|---|---|---|---|---|---|---|---|
| Q1 | Q5 | p Value | Q1 | Q5 | p Value | Q1 | Q5 | p Value | Q1 | Q5 | p Value | |
| Participants, n | 1294 | 1291 | 1312 | 1312 | 1312 | 1312 | 1312 | 1312 | ||||
| Age, years | 65.1 ± 5.0 | 64.7 ± 4.9 | 0.164 | 65.1 ± 5.0 | 64.8 ± 4.8 | 0.088 | 64.7 ±5.0 * | 65.3 ± 4.9 * | 0.016 | 65.2 ± 5.0 * | 64.5 ± 5.0 * | <0.001 |
| Women, % | 43.4 | 48.5 | <0.001 | 45.0 | 48.8 | 0.094 | 40.5 | 49.2 | <0.001 | 42.5 | 46.7 | <0.001 |
| BMI, kg/m2 | 32.4 ± 3.4 | 32.8 ± 3.5 NS | 0.005 | 32.4 ± 3.4 | 32.7 ± 3.6 | 0.226 | 32.6 ± 3.4 * | 32.3 ± 3.4 * | <0.001 | 32.3 ± 3.3 * | 32.8 ±3.5 * | <0.001 |
| Smoking habit, % | ||||||||||||
| Current | 11.6 | 12.0 | 0.820 | 11.1 | 12.0 | 0.446 | 14.1 | 11.5 | 0.002 | 11.2 | 12.5 | 0.021 |
| Former | 44.0 | 44.6 | 42.2 | 44.9 | 47.1 | 41.7 | 46.7 | 45.2 | ||||
| Never | 44.5 | 43.4 | 46.7 | 43.1 | 38.8 | 46.8 | 42.1 | 42.3 | ||||
| Education, % | ||||||||||||
| Primary | 52.3 | 42.6 | <0.001 | 52.8 | 44.5 | 0.001 | 46.2 | 48.7 | 0.268 | 50.3 | 40.3 | <0.001 |
| Secondary | 28.3 | 30.3 | 27.7 | 29.6 | 30.6 | 28.2 | 27.8 | 34.7 | ||||
| University or graduate | 19.4 | 27.1 | 19.5 | 25.9 | 23.2 | 23.1 | 21.9 | 25.0 | ||||
| Total physical activity, n † | 1213 | 1225 | 1226 | 1240 | 1225 | 1251 | 1235 | 1248 | ||||
| Total physical activity, MET·min/week † | 2394 ± 2024 | 2440 ± 1876 | 0.912 | 2396 ± 1965 * | 2486 ± 1883 * | 0.027 | 2322 ± 2019 | 2529 ± 1875 NS | 0.025 | 2628 ± 2042 * | 2281 ± 1918 * | <0.001 |
| Males | 2796 ± 2268 | 2632 ± 2029 | 0.233 | 2745 ± 2177 | 2744 ± 2029 | 0.146 | 2674 ± 2231 | 2838 ± 2088 | 0.366 | 3053 ± 2256 * | 2572 ± 2163 * | 0.001 |
| Females | 1868 ± 1500 * | 2233 ± 1672 * | 0.004 | 1970 ± 1569 * | 2213 ± 1673 * | 0.005 | 1799 ± 1513 * | 2205 ± 1559 * | <0.001 | 2039 ± 1518 | 1950 ± 1531 | 0.458 |
| MetS components, % | ||||||||||||
| High blood pressure | 93.0 | 91.7 | 0.328 | 92.5 | 91.3 | 0.300 | 92.8 | 92.0 | 0.724 | 92.5 | 91.3 | 0.495 |
| Hyperglycaemia | 73.9 | 80.3 | <0.001 | 74.0 | 80.0 | <0.001 | 73.3 | 75.6 | 0.014 | 73.2 | 78.3 | 0.032 |
| Hypertriglyceridemia | 58.7 | 56.6 | 0.139 | 57.0 | 56.0 | 0.889 | 56.8 | 55.2 | 0.111 | 57.9 | 53.4 | 0.120 |
| Low HDL-cholesterol | 38.7 | 44.4 | 0.004 | 40.4 | 44.7 | 0.171 | 40.9 | 46.3 | 0.015 | 40.2 | 42.1 | 0.068 |
| Abdominal obesity | 95.2 | 96.7 | 0.180 | 95.4 | 96.6 | 0.317 | 95.6 | 96.6 | 0.657 | 95.5 | 96.4 | 0.380 |
| Males | 92.0 | 94.3 | 0.387 | 92.2 | 94.0 | 0.386 | 93.1 | 94.2 | 0.704 | 92.6 | 93.8 | 0.503 |
| Females | 99.5 | 99.4 | 0.944 | 99.3 | 99.4 | 0.453 | 99.2 | 99.2 | 0.543 | 99.5 | 99.3 | 0.990 |
| Trans FA | Linoleic acid | Linolenic acid | ω-3 FA | |||||||||
| Participants, n | 1312 | 1312 | 1312 | 1312 | 1312 | 1312 | 1312 | 1312 | ||||
| Age, years | 65.8 ± 4.7 * | 64.0 ± 5.1 * | <0.001 | 64.6 ± 5.0 * | 65.4 ± 4.9 * | 0.001 | 63.9 ± 5.0 * | 65.6 ± 4.8 * | <0.001 | 65.1 ± 5.0 | 65.1 ± 4.8 | 0.345 |
| Women, n (%) | 60.9 | 37.6 | <0.001 | 40.2 | 48.2 | <0.001 | 29.9 | 56.6 | <0.001 | 47.6 | 51.2 | 0.217 |
| BMI, kg/m2 | 32.3 ± 3.4 | 32.6 ± 3.5 | 0.074 | 32.6 ± 3.4 | 32.3 ± 3.3 NS | 0.020 | 32.7 ± 3.4 * | 32.1 ± 3.3 * | <0.001 | 32.7 ± 3.4 | 32,5 ± 3.4 | 0.387 |
| Smoking habit, n (%) | ||||||||||||
| Current | 8.9 | 14.0 | <0.001 | 14.0 | 12.2 | 0.007 | 16.7 | 9.5 | <0.001 | 14.4 | 10.3 | 0.003 |
| Former | 39.7 | 47.0 | 47.1 | 41.8 | 49.6 | 39.4 | 42.4 | 45.1 | ||||
| Never | 51.4 | 39.0 | 39.0 | 46.0 | 33.8 | 51.1 | 43.2 | 44.6 | ||||
| Education, n (%) | ||||||||||||
| Primary | 57.0 | 41.3 | <0.001 | 44.1 | 50.5 | 0.003 | 46.6 | 50.1 | 0.286 | 54.2 | 47.2 | <0.001 |
| Secondary | 24.6 | 31.6 | 30.8 | 28.1 | 29.9 | 27.6 | 27.4 | 27.8 | ||||
| University or graduate | 18.4 | 27.1 | 25.2 | 21.4 | 23.5 | 22.3 | 18.3 | 25.0 | ||||
| Total physical activity, n † | 1248 | 1230 | 1229 | 1249 | 1216 | 1251 | 1237 | 1253 | ||||
| Total physical activity, MET·min/week † | 2572 ± 1924 | 2373 ± 1977 | 0.075 | 2445 ± 2098 | 2499 ± 1884 | 0.130 | 2454 ± 2099 * | 2621 ± 1961 * | 0.002 | 2227 ± 1952 * | 2673 ± 2038 * | <0.001 |
| Males | 3107 ± 2208 * | 2580 ± 2168* | <0.001 | 2801 ± 2332 | 2852 ± 2095 | 0.491 | 2695 ± 2241 * | 3080 ± 2230 * | 0.015 | 2657 ± 2168 | 2983 ± 2341 NS | 0.048 |
| Females | 2225 ± 1624 * | 2027 ± 1550 * | 0.006 | 1908 ± 1539 | 2114 ± 1534 | 0.191 | 1852 ± 1541 * | 2262 ± 1636 * | <0.001 | 1744 ± 1541 * | 2372 ± 1639 * | <0.001 |
| MetS components, n (%) | ||||||||||||
| High blood pressure | 91.9 | 92.3 | 0.108 | 92.9 | 92.0 | 0.313 | 92.9 | 91.6 | 0.566 | 91.8 | 91.5 | 0.068 |
| Hyperglycaemia | 76.2 | 75.2 | 0.232 | 73.4 | 75.2 | 0.047 | 74.1 | 75.8 | 0.373 | 74.0 | 79.0 | 0.020 |
| Hypertriglyceridemia | 55.2 | 55.6 | 0.611 | 55.6 | 56.4 | 0.847 | 57.2 | 53.2 | 0.186 | 59.1 | 50.8 | <0.001 |
| Low HDL-cholesterol | 43.5 | 42.2 | 0.863 | 39.9 | 47.0 | <0.001 | 41.5 | 44.7 | 0.586 | 45.8 | 41.1 | 0.147 |
| Abdominal obesity | 95.9 | 95.7 | 0.360 | 95.6 | 96.3 | 0.850 | 94.4 | 97.0 | 0.009 | 95.8 | 97.1 | 0.179 |
| Males | 90.6 | 93.7 | 0.170 | 93.1 | 93.5 | 0.948 | 92.2 | 94.0 | 0.414 | 92.6 | 94.7 | 0.338 |
| Females | 99.2 | 99.2 | 0.587 | 99.2 | 99.2 | 0.479 | 99.7 | 99.2 | 0.343 | 99.4 | 99.4 | 0.210 |
| Total Fat | MUFAs | PUFAs | SFAs | |||||||||
|---|---|---|---|---|---|---|---|---|---|---|---|---|
| Q1 | Q5 | p Value | Q1 | Q5 | p Value | Q1 | Q5 | p Value | Q1 | Q5 | p Value | |
| Participants, n | 1294 | 1291 | 1312 | 1312 | 1312 | 1312 | 1312 | 1312 | ||||
| Energy intake, kcal/day | 2446 ± 579 * | 2432 ± 509 * | <0.001 | 2415 ± 594 * | 2417 ± 516 * | <0.001 | 2539 ± 534 * | 2498 ± 517 * | <0.001 | 2532 ± 533 * | 2456 ± 551 * | <0.001 |
| Carbohydrate intake, % total energy | 48.6 ± 5.4 * | 33.3 ± 4.3 * | <0.001 | 48.0 ± 5.6 * | 34.1 ± 4.9 * | <0.001 | 45.7 ± 6.5 * | 37.7 ± 6.2 * | <0.001 | 46.3 ± 6.3 * | 36.0 ± 5.7 * | <0.001 |
| Protein intake, % total energy | 16.7 ± 3.0 * | 15.9 ± 2.5 * | <0.001 | 17.0 ± 3.0 * | 15.7 ± 2.4 * | <0.001 | 16.3 ± 2.7 * | 16.2 ± 2.7 * | <0.001 | 15.9± 2.7 * | 16.7 ± 2.7 * | <0.001 |
| Fat intake, % total energy | 30.5 ± 2.9 * | 48.5 ± 3.3 * | <0.001 | 31.4 ± 3.9 * | 47.6 ± 4.1 * | <0.001 | 33.7 ± 5.1 * | 43.7 ±5.9 * | <0.001 | 33.5 ± 5.1 * | 44.8 ± 5.5 * | <0.001 |
| PUFA, % total energy | 5.0 ± 1.3 * | 7.8 ± 2.0 * | <0.001 | 5.5 ± 1.9 * | 7.4 ± 1.6 * | <0.001 | 4.3 ± 0.5 * | 9.1 ± 1.5 * | <0.001 | 6.0 ± 1.8 * | 6.4 ± 1.8 * | <0.001 |
| MUFA, % total energy | 14.8 ± 2.2 * | 26.2 ± 3.5 * | <0.001 | 14.3 ± 1.8 * | 26.9 ± 2.9 * | <0.001 | 17.0 ± 3.2 * | 22.2 ± 5.0 * | <0.001 | 17.5 ± 4.1 * | 22.7 ± 4.4 * | <0.001 |
| SFA, % total energy | 8.2 ± 1.5 * | 11.7 ± 1.9 * | <0.001 | 8.7 ± 1.8 * | 11.0 ± 1.9 * | <0.001 | 9.6 ± 2.2 * | 10.0 ± 1.8 * | <0.001 | 7.5 ± 0.9 * | 12.8 ± 1.4 * | <0.001 |
| Trans FA, g/day | 0.52 ± 0.3 * | 0.71 ± 0.5 * | <0.001 | 0.57 ± 0.4 * | 0.63 ± 0.4 * | <0.001 | 0.66 ± 0.4 * | 0.59 ± 0.4 * | <0.001 | 0.39 ± 0.3 * | 0.94 ± 0.5 * | <0.001 |
| Linoleic acid, g/day | 11.1 ± 4.5 * | 17.4 ± 6.4 * | <0.001 | 12.0 ± 5.7 * | 16.3 ± 5.4 * | <0.001 | 9.8 ± 3.1 * | 20.8 ± 5.5 * | <0.001 | 13.7 ± 5.4 * | 14.3 ± 5.8 * | <0.001 |
| Linolenic acid, g/day | 1.2 ± 0.6 * | 1.8 ± 0.8 * | <0.001 | 1.3 ± 0.7 * | 1.7 ± 0.7 * | <0.001 | 1.1 ± 0.3 * | 2.3 ± 0.8 * | <0.001 | 1.4 ± 0.7 * | 1.6 ± 0.6 * | <0.001 |
| ω-3 FA, g/day | 1.48 ± 0.9 * | 1.65 ± 0.9 * | <0.001 | 1.52 ± 0.9 * | 1.61 ± 0.8 * | 0.001 | 1.39 ± 0.8 * | 1.72 ± 0.89 * | <0.001 | 1.59 ± 0.9 | 1.55 ± 0.8 | 0.360 |
| FQI, score | 2.4 ± 0.5 * | 3.0 ± 0.7 * | <0.001 | 2.29 ± 0.5 * | 3.15 ± 0.7 * | <0.001 | 2.26 ± 0.5 * | 3.16 ± 0.7 * | <0.001 | 3.12 ± 0.7 * | 2.24 ± 0.4 * | <0.001 |
| Cholesterol (mg/day) | 365 ± 113 * | 399 ± 119 * | <0.001 | 378 ± 122 | 383 ± 115 | 0.182 | 394 ± 134 * | 381 ± 111 * | <0.001 | 346 ± 106 * | 438 ± 125 * | <0.001 |
| Fibre intake (g/day) | 29 ± 10.0 * | 23.8 ± 7.7 * | <0.001 | 27.9 ± 9.2 * | 25.0 ± 8.4 * | <0.001 | 26.6 ± 9.0 * | 28.3 ± 9.1 * | <0.001 | 31.2 ± 10.3 * | 22.6 ± 7.2 * | <0.001 |
| Trans FA | Linoleic acid | Linolenic acid | ω-3 FA | |||||||||
| Participants, n | 1312 | 1312 | 1312 | 1312 | 1312 | 1312 | 1312 | 1312 | ||||
| Energy intake, kcal/day | 2001 ± 467 * | 2739 ± 522 * | <0.001 | 2541 ± 528 * | 2489 ± 518 * | <0.001 | 2894 ± 419 * | 2271 ± 517 * | <0.001 | 2176 ± 549 * | 2517 ± 520 * | <0.001 |
| Carbohydrate intake, % total energy | 46.3 ± 6.3 * | 36.0 ± 5.7 * | <0.001 | 44.9 ± 6.7 * | 38.0 ± 6.2 * | <0.001 | 44.4 ± 6.5 | 38.0 ± 6.4 | <0.001 | 43.0 ± 7.2 * | 39.1 ± 6.3 * | <0.001 |
| Protein intake, % total energy | 17.1 ± 3.2 * | 16.0 ± 2.5 * | <0.001 | 16.8 ± 3.0 * | 15.9 ± 2.5 * | <0.001 | 15.2 ± 2.2 | 17.2 ± 2.9 | <0.001 | 15.5 ± 2.8 * | 17.8 ± 2.6 * | <0.001 |
| Fat intake, % total energy | 38.1 ± 7.2 * | 40.9 ± 6.0 * | <0.001 | 34.0 ± 5.4 * | 43.7 ± 5.9 * | <0.001 | 34.0 ± 5.4 | 43.7 ± 5.9 | <0.001 | 38.5 ± 7.0 * | 40.1 ± 6.2 * | <0.001 |
| PUFA, % total energy | 6.4 ± 2.0 * | 6.3 ± 1.7 * | 0.044 | 4.4 ± 0.6 * | 9.1 ± 1.6 * | <0.001 | 5.4 ± 1.5 | 8.5 ± 1.7 | <0.001 | 6.0 ± 2.0 * | 6.8 ± 1.8 * | <0.001 |
| MUFA, % total energy | 20.6 ± 5.3 | 20.6 ± 4.2 | 0.581 | 17.1 ± 3.3 * | 22.2 ± 5.0 * | <0.001 | 18.2 ± 3.8 | 21.8 ± 5.0 | <0.001 | 20.1 ± 4.9 * | 20.7 ± 4.5 * | 0.003 |
| SFA, % total energy | 7.5 ± 0.9 * | 12.8 ± 1.4 * | <0.001 | 9.7 ± 2.3 * | 10.0 ± 1.8 * | <0.001 | 9.4 ± 1.8 | 9.9 ± 2.1 | <0.001 | 9.8 ± 2.1 | 9.9 ± 1.9 | 0.168 |
| Trans FA, g/day | 0.18 ± 0.1 * | 1.18 ± 0.4 * | <0.001 | 0.65 ± 0.4 * | 0.62 ± 0.4 * | <0.001 | 0.70 ± 0.4 * | 0.52 ± 0.4 * | <0.001 | 0.57 ± 0.4 * | 0.58 ± 0.4 * | 0.015 |
| Linoleic acid, g/day | 11.4 ± 5.1 * | 16.1 ± 6.1 * | <0.001 | 9.6 ± 2.9 * | 20.9 ± 5.4 * | <0.001 | 14.2 ± 5.3 * | 17.5 ± 5.7 * | <0.001 | 12.5 ± 5.8 * | 14.4 ± 5.6 * | <0.001 |
| Linolenic acid, g/day | 1.3 ± 0.7 * | 1.7 ± 0.7 * | <0.001 | 1.1 ± 0.3 * | 2.2 ± 0.8 * | <0.001 | 1.2 ± 0.3 * | 2.3 ± 0.8 * | <0.001 | 1.2 ± 0.7 * | 1.7 ± 0.7 * | <0.001 |
| ω-3 FA, g/day | 1.54 ± 0.9 * | 1.56 ± 0.8 * | 0.170 | 1.62 ± 0.9 * | 1.58 ± 0.9 * | 0.009 | 1.56 ± 0.8 * | 1.69 ± 0.9 * | <0.001 | 0.63 ± 0.2 * | 2.92 ± 0.4 * | <0.001 |
| FQI, score | 3.25 ± 0.7 * | 2.29 ± 0.5 * | <0.001 | 2.25 ± 0.5 * | 3.14 ± 0.7 * | <0.001 | 2.51 ± 0.5 * | 3.08 ± 0.7 * | <0.001 | 2.67 ± 0.7 * | 2.78 ± 0.6 * | <0.001 |
| Cholesterol (mg/day) | 300 ± 90 * | 461 ± 124 * | <0.001 | 406 ± 135 * | 376 ± 111 * | <0.001 | 427 ± 140 * | 361 ± 106 * | <0.001 | 305 ± 100 * | 445 ± 116 * | <0.001 |
| Fibre intake (g/day) | 26.2 ± 9.0 | 25.8 ± 8.4 | 0.784 | 27.1 ± 9.1 * | 27.6 ± 9.1 * | <0.001 | 28.1 ± 9.0 * | 28.0 ± 9.2 * | <0.001 | 23.1 ± 8.2 * | 28.7 ± 9.1 * | <0.001 |
| Total Fat | MUFAs | PUFAs | SFAs | |||||||||
|---|---|---|---|---|---|---|---|---|---|---|---|---|
| Q1 | Q5 | p Value | Q1 | Q5 | p Value | Q1 | Q5 | p Value | Q1 | Q5 | p Value | |
| Participants, n | 1294 | 1291 | 1312 | 1312 | 1312 | 1312 | 1312 | 1312 | ||||
| Dietary items | ||||||||||||
| Fruits, g/day | 420 ± 259 * | 305 ± 170 * | <0.001 | 404 ± 239 * | 327 ± 183 * | <0.001 | 383 ± 238 * | 370 ± 205 * | <0.001 | 444 ± 258 * | 289 ± 172 * | <0.001 |
| Vegetables, g/day | 333 ± 149 * | 310 ± 128 * | <0.001 | 331 ± 148 * | 320 ± 132 * | 0.001 | 319 ± 144 * | 340 ± 138 * | <0.001 | 356 ± 154 * | 292 ± 129 * | <0.001 |
| Legumes, g/day | 22 ± 13 * | 19 ± 10 * | <0.001 | 22 ± 13 * | 20 ± 10 * | <0.001 | 20 ± 12 * | 21 ± 11 * | 0.004 | 23 ± 13 * | 19 ± 10 * | <0.001 |
| Olive oil, g/day | 27 ± 13 * | 55 ± 14 * | <0.001 | 23 ± 10 * | 57 ± 13 * | <0.001 | 36 ± 15 * | 41 ± 19 * | <0.001 | 38 ± 16 * | 43 ± 18 * | <0.001 |
| Nuts, g/day | 10 ± 12 * | 22 ± 23 * | <0.001 | 10 ± 12 * | 24 ± 24 * | <0.001 | 5 ± 6 * | 34 ± 23 * | <0.001 | 17 ± 20 * | 13 ± 15 * | <0.001 |
| Total fish, g/day | 97 ± 49 * | 105 ± 47 * | <0.001 | 99 ± 50 | 103 ± 46 NS | 0.022 | 94 ± 46 * | 107 ± 48 * | <0.001 | 104 ± 50 * | 99 ± 47 * | 0.017 |
| Total cereals, g/day | 203 ± 95 * | 110 ± 52 * | <0.001 | 190 ± 94 * | 118 ± 59 * | <0.001 | 196 ± 91 * | 138 ± 69 * | <0.001 | 208 ± 93 * | 118 ± 60 * | <0.001 |
| Dairy products, g/day | 402 ± 226 * | 302 ± 177 * | <0.001 | 406 ± 220 * | 292 ± 175 * | <0.001 | 418 ± 223 * | 324 ± 197 * | <0.001 | 348 ± 226 * | 267 ± 202 * | <0.001 |
| Total meat, g/day | 136 ± 57 * | 156 ± 61 * | <0.001 | 140 ± 59 * | 148 ± 58 * | <0.001 | 152 ± 59 * | 146 ± 59 * | <0.001 | 130 ± 52 * | 172 ± 62 * | <0.001 |
| Cookies, g/day | 30 ± 35 * | 25 ± 27 * | <0.001 | 32 ± 35 * | 23 ± 25 * | <0.001 | 36 ± 39 * | 25 ± 27 * | <0.001 | 23 ± 27 * | 35 ± 35 * | <0.001 |
| Alcohol, g/day | 15 ± 20 * | 8 ± 11 * | <0.001 | 13 ± 18 * | 9 ± 12 * | <0.001 | 16 ± 20 * | 9 ± 13 * | <0.001 | 16 ± 20 * | 9 ± 12 * | <0.001 |
| 17-item MedDiet Q, score | 8.27 ± 2.62 * | 8.56 ± 2.69 * | 0.005 | 8.19 ± 2.67 * | 8.88 ± 2.61 * | <0.001 | 7.68 ± 2.57 * | 9.07 ± 2.73 * | <0.001 | 9.09 ± 2.67 * | 7.65 ± 2.54 * | <0.001 |
| Trans FA | Linoleic acid | Linolenic acid | ω-3 FA | |||||||||
| Participants, n | 1312 | 1312 | 1312 | 1312 | 1312 | 1312 | 1312 | 1312 | ||||
| Dietary items | ||||||||||||
| Fruits, g/day | 379 ± 207 * | 334 ± 198 * | <0.001 | 390 ± 239 * | 365 ± 206 * | <0.001 | 383 ± 237 * | 378 ± 216 * | <0.001 | 321 ± 209 * | 392 ± 229 * | <0.001 |
| Vegetables, g/day | 332 ± 137 * | 309 ± 134 * | <0.001 | 335 ± 150 * | 330 ± 137 * | 0.001 | 326 ± 143 * | 347 ± 139 * | <0.001 | 269 ± 125 * | 377 ± 145 * | <0.001 |
| Legumes, g/day | 20 ± 12 | 21 ± 11 | 0.730 | 21 ± 12 | 21 ± 11 | 0.061 | 22 ± 12 * | 21 ± 11 * | <0.001 | 19 ± 11 * | 23 ± 12 * | <0.001 |
| Olive oil, g/day | 39 ± 17 | 40 ± 18 | 0.154 | 35 ± 15 * | 42 ± 19 * | <0.001 | 42 ± 17 * | 39 ± 17 * | <0.001 | 37 ± 18 * | 42 ± 17 * | <0.001 |
| Nuts, g/day | 15 ± 18 | 15 ± 17 | 0.293 | 5 ± 7 * | 32 ± 24 * | <0.001 | 9 ± 12 * | 33 ± 20 * | <0.001 | 11 ± 16 * | 18 ± 19 * | <0.001 |
| Total fish, g/day | 100 ± 49 | 101 ± 49 | 0.243 | 105 ± 51 * | 101 ± 47 * | 0.002 | 102 ± 51 * | 105 ± 46 * | <0.001 | 50 ± 23 * | 162 ± 37 * | <0.001 |
| Total cereals, g/day | 135 ± 74 * | 163 ± 80 * | <0.001 | 191 ± 90 * | 138 ± 70 * | <0.001 | 213 ± 88 * | 128 ± 68 * | <0.001 | 145 ± 81 | 152 ± 75 | 0.140 |
| Dairy products, g/day | 322 ± 213 * | 388 ± 204 * | <0.001 | 411 ± 225 * | 326 ± 196 * | <0.001 | 391 ± 222 * | 329 ± 199 * | <0.001 | 353 ± 214 | 349 ± 202 | 0.082 |
| Total meat, g/day | 112 ± 44 * | 170 ± 63 * | <0.001 | 156 ± 59 * | 144 ± 58 * | <0.001 | 161 ± 61 * | 141 ± 57 * | <0.001 | 128 ± 58 * | 156 ± 60 * | <0.001 |
| Cookies, g/day | 16 ± 24 * | 43 ± 38 * | <0.001 | 33 ± 38 * | 27 ± 29 * | <0.001 | 41 ± 41 * | 21 ± 25 * | <0.001 | 27 ± 32 * | 24 ± 27 * | 0.001 |
| Alcohol, g/day | 7 ± 12 * | 13 ± 16 * | <0.001 | 16 ± 19 * | 9 ± 12 * | <0.001 | 19 ± 21 * | 7 ± 11 * | <0.001 | 10 ± 15 * | 11 ± 14 * | 0.030 |
| 17-item MedDiet Q, score | 9.82 ± 2.49 * | 7.50 ± 2.59 * | <0.001 | 7.97 ± 2.58 * | 8.86 ± 2.76 * | <0.001 | 7.67 ± 2.62 * | 9.49 ± 2.59 * | <0.001 | 7.64 ± 2.57 * | 9.46 ± 2.59 * | <0.001 |
| Quintiles | p Value | |||||
|---|---|---|---|---|---|---|
| 1 | 2 | 3 | 4 | 5 | ||
| Total fat | ||||||
| High blood pressure | 1.00 (ref.) | 0.99 (0.73, 1.35) | 0.81 (0.61, 1.10) | 0.96 (0.71, 1.30) | 0.94 (0.69, 1.27) | 0.615 |
| Hyperglycemia | 1.00 (ref.) | 0.94 (0.78, 1.12) | 1.13 (0,94, 1.36) | 1.23 (1.02, 1.48) | 1.55 (1.28, 1.88) | <0.001 |
| Hypertriglyceridemia | 1.00 (ref.) | 0.81 (0.69, 0.95) | 0.88 (0.74, 1.03) | 0.87 (0.74, 1.02) | 0.90 (0.76, 1.06) | 0.153 |
| Low HDL-c | 1.00 (ref.) | 1.06 (0.90, 1.25) | 1.19 (1.01, 1.40) | 1.20 (1.02, 1.42) | 1.14 (0.96, 1.34) | 0.133 |
| Abdominal obesity | 1.00 (ref.) | 1.19 (0.81, 1.75) | 1.33 (0.90, 1.98) | 1.60 (1.06, 2.43) | 1.75 (1.15, 2.68) | 0.065 |
| MUFAs | ||||||
| High blood pressure | 1.00 (ref.) | 1.17 (0.86, 1.59) | 0.99 (0.73, 1.33) | 0.87 (0.65, 1.17) | 0.97 (0.72, 1.31) | 0.429 |
| Hyperglycemia | 1.00 (ref.) | 0.97 (0.81, 1.16) | 0.98 (0.81, 1.17) | 1.26 (1.04, 1.52) | 1.45 (1.19, 1.75) | <0.001 |
| Hypertriglyceridemia | 1.00 (ref.) | 0.93 (0.79, 1.09) | 0.91 (0.78, 1.07) | 0.99 (0.84, 1.16) | 0.98 (0.83, 1.15) | 0.741 |
| Low HDL-c | 1.00 (ref.) | 1.07 (0.91, 1.26) | 1.10 (0.94, 1.30) | 1.18 (1.00, 1.38) | 1.14 (0.97, 1.34) | 0.359 |
| Abdominal obesity | 1.00 (ref.) | 1.12 (0.76, 1.66) | 1.08 (0.73, 1.60) | 1.58 (1.04, 2.42) | 1.54 (1.01, 3.34) | 0.111 |
| PUFAs | ||||||
| High blood pressure | 1.00 (ref.) | 0.94 (0.69, 1.28) | 0.89 (0.65, 1.20) | 0.87 (0.64, 1.17) | 0.93 (0.69, 1.27) | 0.902 |
| Hyperglycemia | 1.00 (ref.) | 1.02 (0.85, 1.23) | 1.23 (1.02, 1.48) | 1.23 (1.02, 1.49) | 1.10 (0.91, 1.33) | 0.084 |
| Hypertriglyceridemia | 1.00 (ref.) | 1.10 (0.93, 1.29) | 0.92 (0.78, 1.08) | 1.12 (0.95, 1.33) | 1.05 (0.89, 1.24) | 0.105 |
| Low HDL-c | 1.00 (ref.) | 0.96 (0.81, 1.13) | 0.96 (0.82, 1.14) | 1.11 (0.94, 1.31) | 1.12 (0.95, 1.32) | 0.160 |
| Abdominal obesity | 1.00 (ref.) | 1.05 (0.70, 1.58) | 1.13 (0.74, 1.71) | 1.06 (0.71, 1.60) | 1.31 (0.86, 2.00) | 0.771 |
| SFAs | ||||||
| High blood pressure | 1.00 (ref.) | 0.86 (0.64, 1.15) | 1.10 (0.81, 1.50) | 1.08 (0.80, 1.47) | 0.95 (0.70, 1.28) | 0.432 |
| Hyperglycemia | 1.00 (ref.) | 1.17 (0.97, 1.41) | 1.25 (1.04, 1.51) | 1.35 (1.12, 1.63) | 1.58 (1.31, 1.92) | <0.001 |
| Hypertriglyceridemia | 1.00 (ref.) | 0.96 (0.81, 1.13) | 0.83 (0.71, 0.98) | 0.85 (0.72, 1.00) | 0.74 (0.63, 0.87) | 0.003 |
| Low HDL-c | 1.00 (ref.) | 1.12 (0.95, 1.32) | 1.00 (0.84, 1.18) | 1.12 (0.94, 1.32) | 0.94 (0.79, 1.11) | 0.137 |
| Abdominal obesity | 1.00 (ref.) | 1.07 (0.72, 1.61) | 1.40 (0.91, 2.16) | 1.02 (0.68, 1.53) | 1.33 (0.87, 2.02) | 0.404 |
| Trans FA | ||||||
| High blood pressure | 1.00 (ref.) | 0.97 (0.72, 1.30) | 1.27 (0.92, 1.74) | 0.87 (0.64, 1.18) | 1.14 (0.81, 1.60) | 0.114 |
| Hyperglycemia | 1.00 (ref.) | 0.94 (0.78, 1.14) | 1.17 (0.96, 1.43) | 1.03 (0.84, 1.26) | 1.12 (0.90, 1.38) | 0.191 |
| Hypertriglyceridemia | 1.00 (ref.) | 0.93 (0.79, 1.09) | 0.93 (0.79, 1.10) | 0.95 (0.80, 1.13) | 0.81 (0.68, 0.98) | 0.246 |
| Low HDL-c | 1.00 (ref.) | 0.99 (0.84, 1.16) | 1.02 (0.87, 1.21) | 0.92 (0.78, 1.10) | 0.89 (0.74, 1.07) | 0.489 |
| Abdominal obesity | 1.00 (ref.) | 1.68 (1.07, 2.64) | 1.28 (0.84, 1.95) | 1.34 (0.87, 2.07) | 1.44 (0.91, 2.30) | 0.256 |
| Linoleic acid | ||||||
| High blood pressure | 1.00 (ref.) | 0.98 (0.72, 1.34) | 0.77 (0.57, 1.04) | 0.93 (0.68, 1.26) | 0.91 (0.67, 1.23) | 0.423 |
| Hyperglycemia | 1.00 (ref.) | 1.08 (0.91, 1.32) | 1.17 (0.97, 1.41) | 1.24 (1.03, 1.50) | 1.08 (0.90, 1.30) | 0.222 |
| Hypertriglyceridemia | 1.00 (ref.) | 1.00 (0.85, 1.18) | 1.05 (0.89, 1.24) | 1.14 (0.97, 1.35) | 1.12 (0.95, 1.32) | 0.354 |
| Low HDL-c | 1.00 (ref.) | 0.90 (0.76, 1.06) | 1.08 (0.91, 1.27) | 1.14 (0.97, 1.34) | 1.18 (1.00, 1.39) | 0.009 |
| Abdominal obesity | 1.00 (ref.) | 1.14 (0.75, 1.73) | 1.11 (0.74, 1.69) | 1.12 (0.75, 1.69) | 1.19 (0.79, 1.79) | 0.939 |
| Linolenic acid | ||||||
| High blood pressure | 1.00 (ref.) | 0.83 (0.61, 1.13) | 0.82 (0.59, 1.15) | 0.99 (0.69, 1.40) | 0.82 (0.59, 1.14) | 0.488 |
| Hyperglycemia | 1.00 (ref.) | 1.05 (0.86, 1.27) | 1.17 (0.95, 1.44) | 1.08 (0.87, 1.34) | 1.03 (0.84, 1.26) | 0.614 |
| Hypertriglyceridemia | 1.00 (ref.) | 1.10 (0.92, 1.30) | 1.12 (0.94, 1.35) | 1.09 (0.91, 1.32) | 1.05 (0.88, 1.26) | 0.744 |
| Low HDL-c | 1.00 (ref.) | 1.00 (0.84, 1.19) | 0.97 (0.80, 1.16) | 0.94 (0.78, 1.14) | 1.04 (0.87, 1.25) | 0.822 |
| Abdominal obesity | 1.00 (ref.) | 1.54 (1.02, 2.33) | 1.36 (0.87, 2.12) | 1.20 (0.77, 1.89) | 1.53 (0.98, 2.41) | 0.219 |
| ω-3 FA | ||||||
| High blood pressure | 1.00 (ref.) | 0.97 (0.73, 1.30) | 1.45 (1.06, 1.99) | 0.93 (0.69, 1.25) | 1.03 (0.76, 1.40) | 0.048 |
| Hyperglycemia | 1.00 (ref.) | 1.13 (0.94, 1.36) | 1.02 (0.85, 1.23) | 1.08 (0.89, 1.30) | 1.33 (1.09, 1.62) | 0.036 |
| Hypertriglyceridemia | 1.00 (ref.) | 0.86 (0.73, 1.02) | 0.97 (0.82, 1.14) | 0.91 (0.77, 1.08) | 0.77 (0.65, 0.91) | 0.016 |
| Low HDL-c | 1.00 (ref.) | 0.91 (0.77, 1.07) | 0.86 (0.73, 1.01) | 0.97 (0.82, 1.14) | 0.84 (0.71, 1.00) | 0.175 |
| Abdominal obesity | 1.00 (ref.) | 1.22 (0.81, 1.86) | 1.05 (0.70, 1.57) | 0.93 (0.62, 1.40) | 1.50 (0.95, 2.38) | 0.237 |
© 2019 by the authors. Licensee MDPI, Basel, Switzerland. This article is an open access article distributed under the terms and conditions of the Creative Commons Attribution (CC BY) license (http://creativecommons.org/licenses/by/4.0/).
Share and Cite
Julibert, A.; Bibiloni, M.d.M.; Bouzas, C.; Martínez-González, M.Á.; Salas-Salvadó, J.; Corella, D.; Zomeño, M.D.; Romaguera, D.; Vioque, J.; Alonso-Gómez, Á.M.; et al. Total and Subtypes of Dietary Fat Intake and Its Association with Components of the Metabolic Syndrome in a Mediterranean Population at High Cardiovascular Risk. Nutrients 2019, 11, 1493. https://doi.org/10.3390/nu11071493
Julibert A, Bibiloni MdM, Bouzas C, Martínez-González MÁ, Salas-Salvadó J, Corella D, Zomeño MD, Romaguera D, Vioque J, Alonso-Gómez ÁM, et al. Total and Subtypes of Dietary Fat Intake and Its Association with Components of the Metabolic Syndrome in a Mediterranean Population at High Cardiovascular Risk. Nutrients. 2019; 11(7):1493. https://doi.org/10.3390/nu11071493
Chicago/Turabian StyleJulibert, Alicia, Maria del Mar Bibiloni, Cristina Bouzas, Miguel Ángel Martínez-González, Jordi Salas-Salvadó, Dolores Corella, Maria Dolors Zomeño, Dora Romaguera, Jesús Vioque, Ángel M. Alonso-Gómez, and et al. 2019. "Total and Subtypes of Dietary Fat Intake and Its Association with Components of the Metabolic Syndrome in a Mediterranean Population at High Cardiovascular Risk" Nutrients 11, no. 7: 1493. https://doi.org/10.3390/nu11071493