Aerobic Exercise Training with Brisk Walking Increases Intestinal Bacteroides in Healthy Elderly Women

 ,
,
Abstract
:1. Introduction
2. Materials and Methods
2.1. Subjects
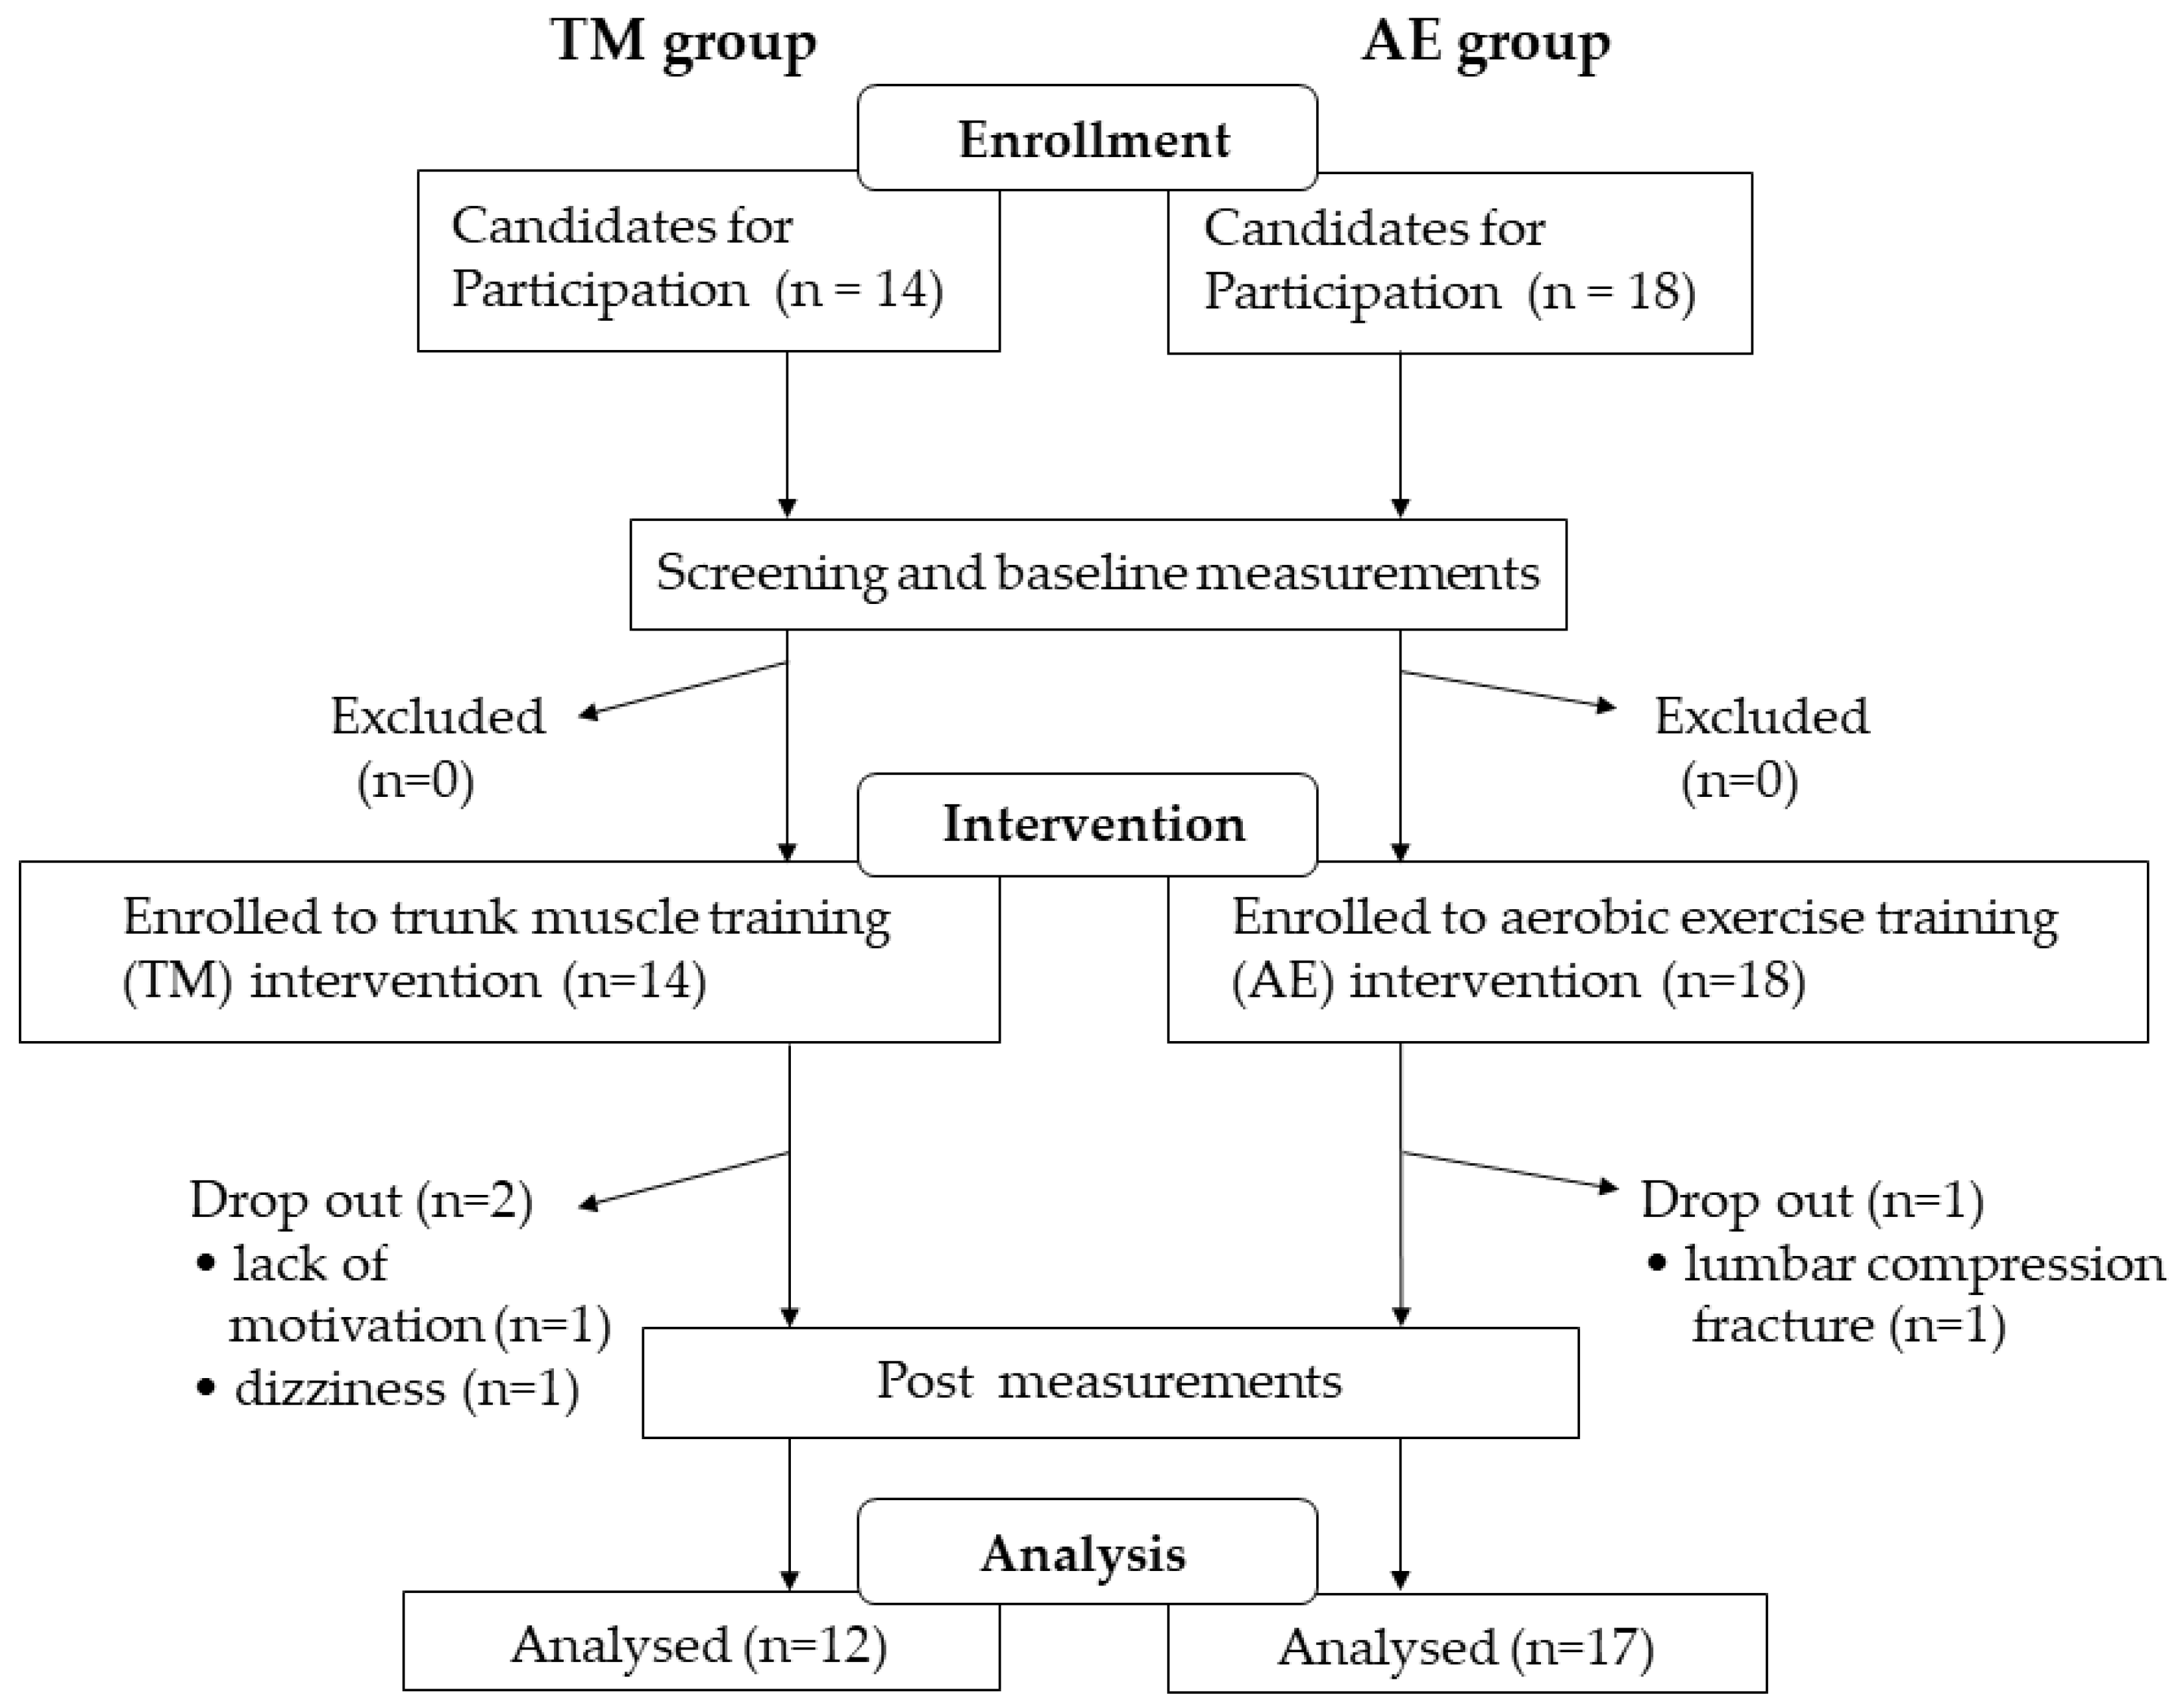
2.2. Study Design
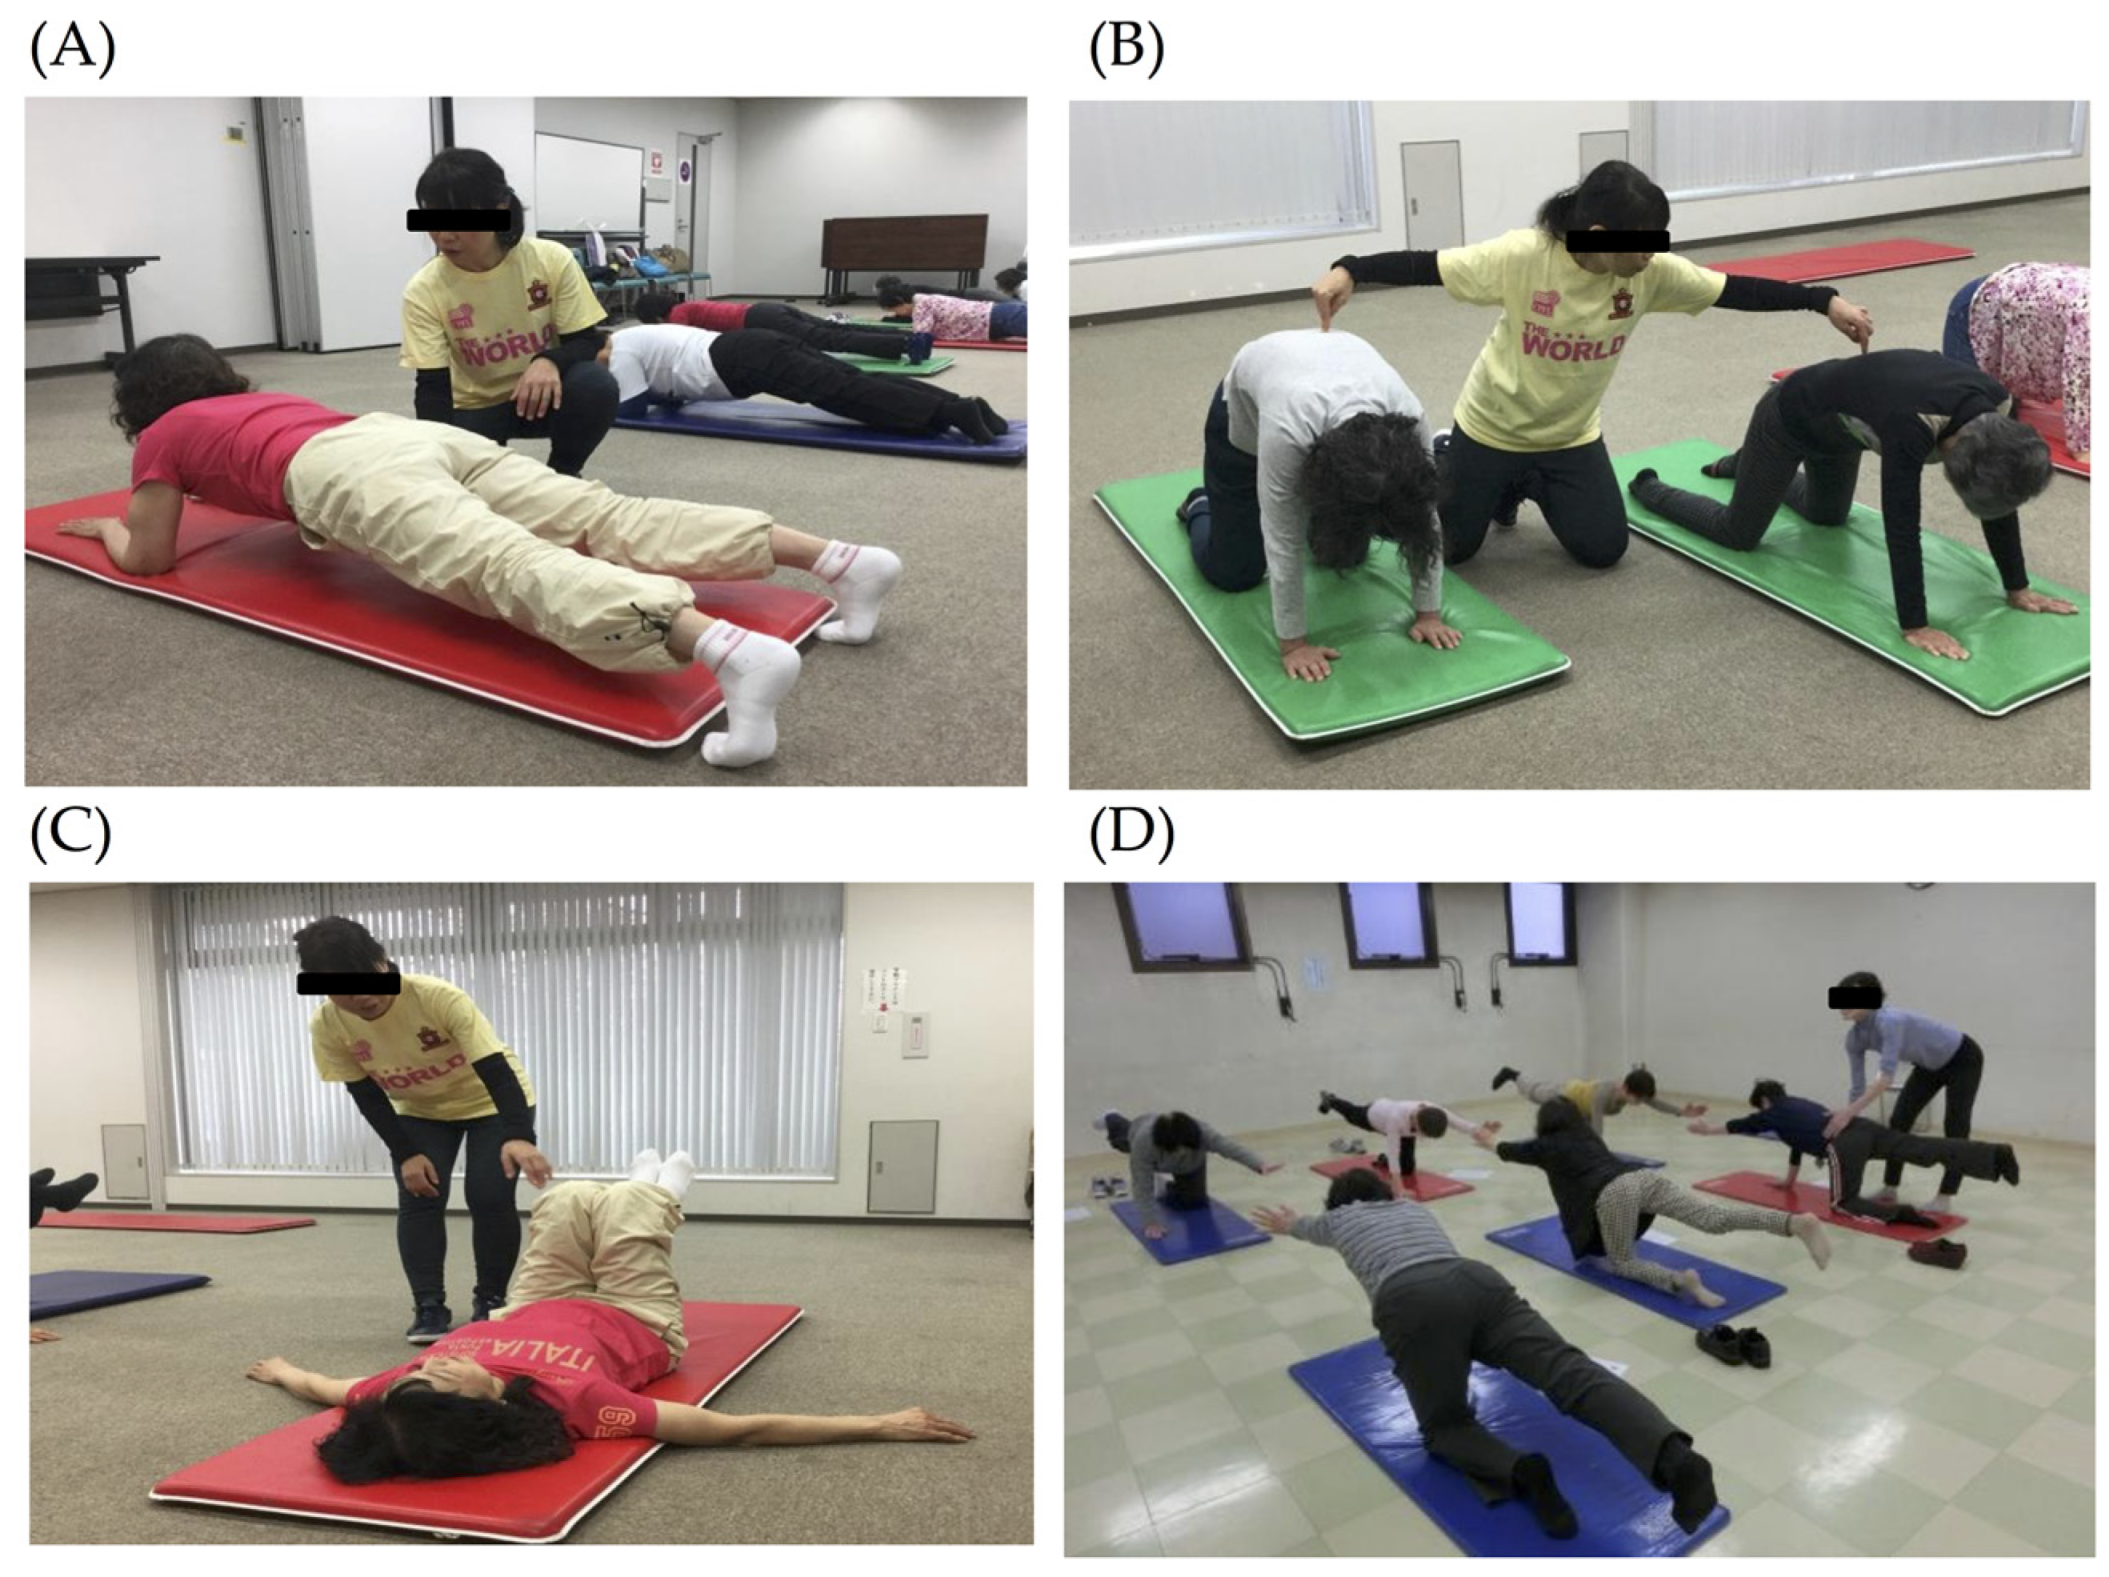
2.3. Exercise Intervention
2.4. Analysis of Intestinal Microbiota
2.5. Anthropometrical Measurements
2.6. Physiological Performance
2.7. Daily Physical Activity Level
2.8. Laboratory Measurements
2.9. Nutrient Intake
2.10. Defecation Assessment
2.11. Statistical Analyses
3. Results
3.1. Clinical Characteristics of the Subjects
3.2. Changes in Body Composition, Muscle Strength, Physical Performance, and Daily Physical Activity Following the Intervention
3.3. Changes in Laboratory Measurements Following the Intervention
3.4. Changes in Nutrient Intake and Defecation Pattern Following the Intervention
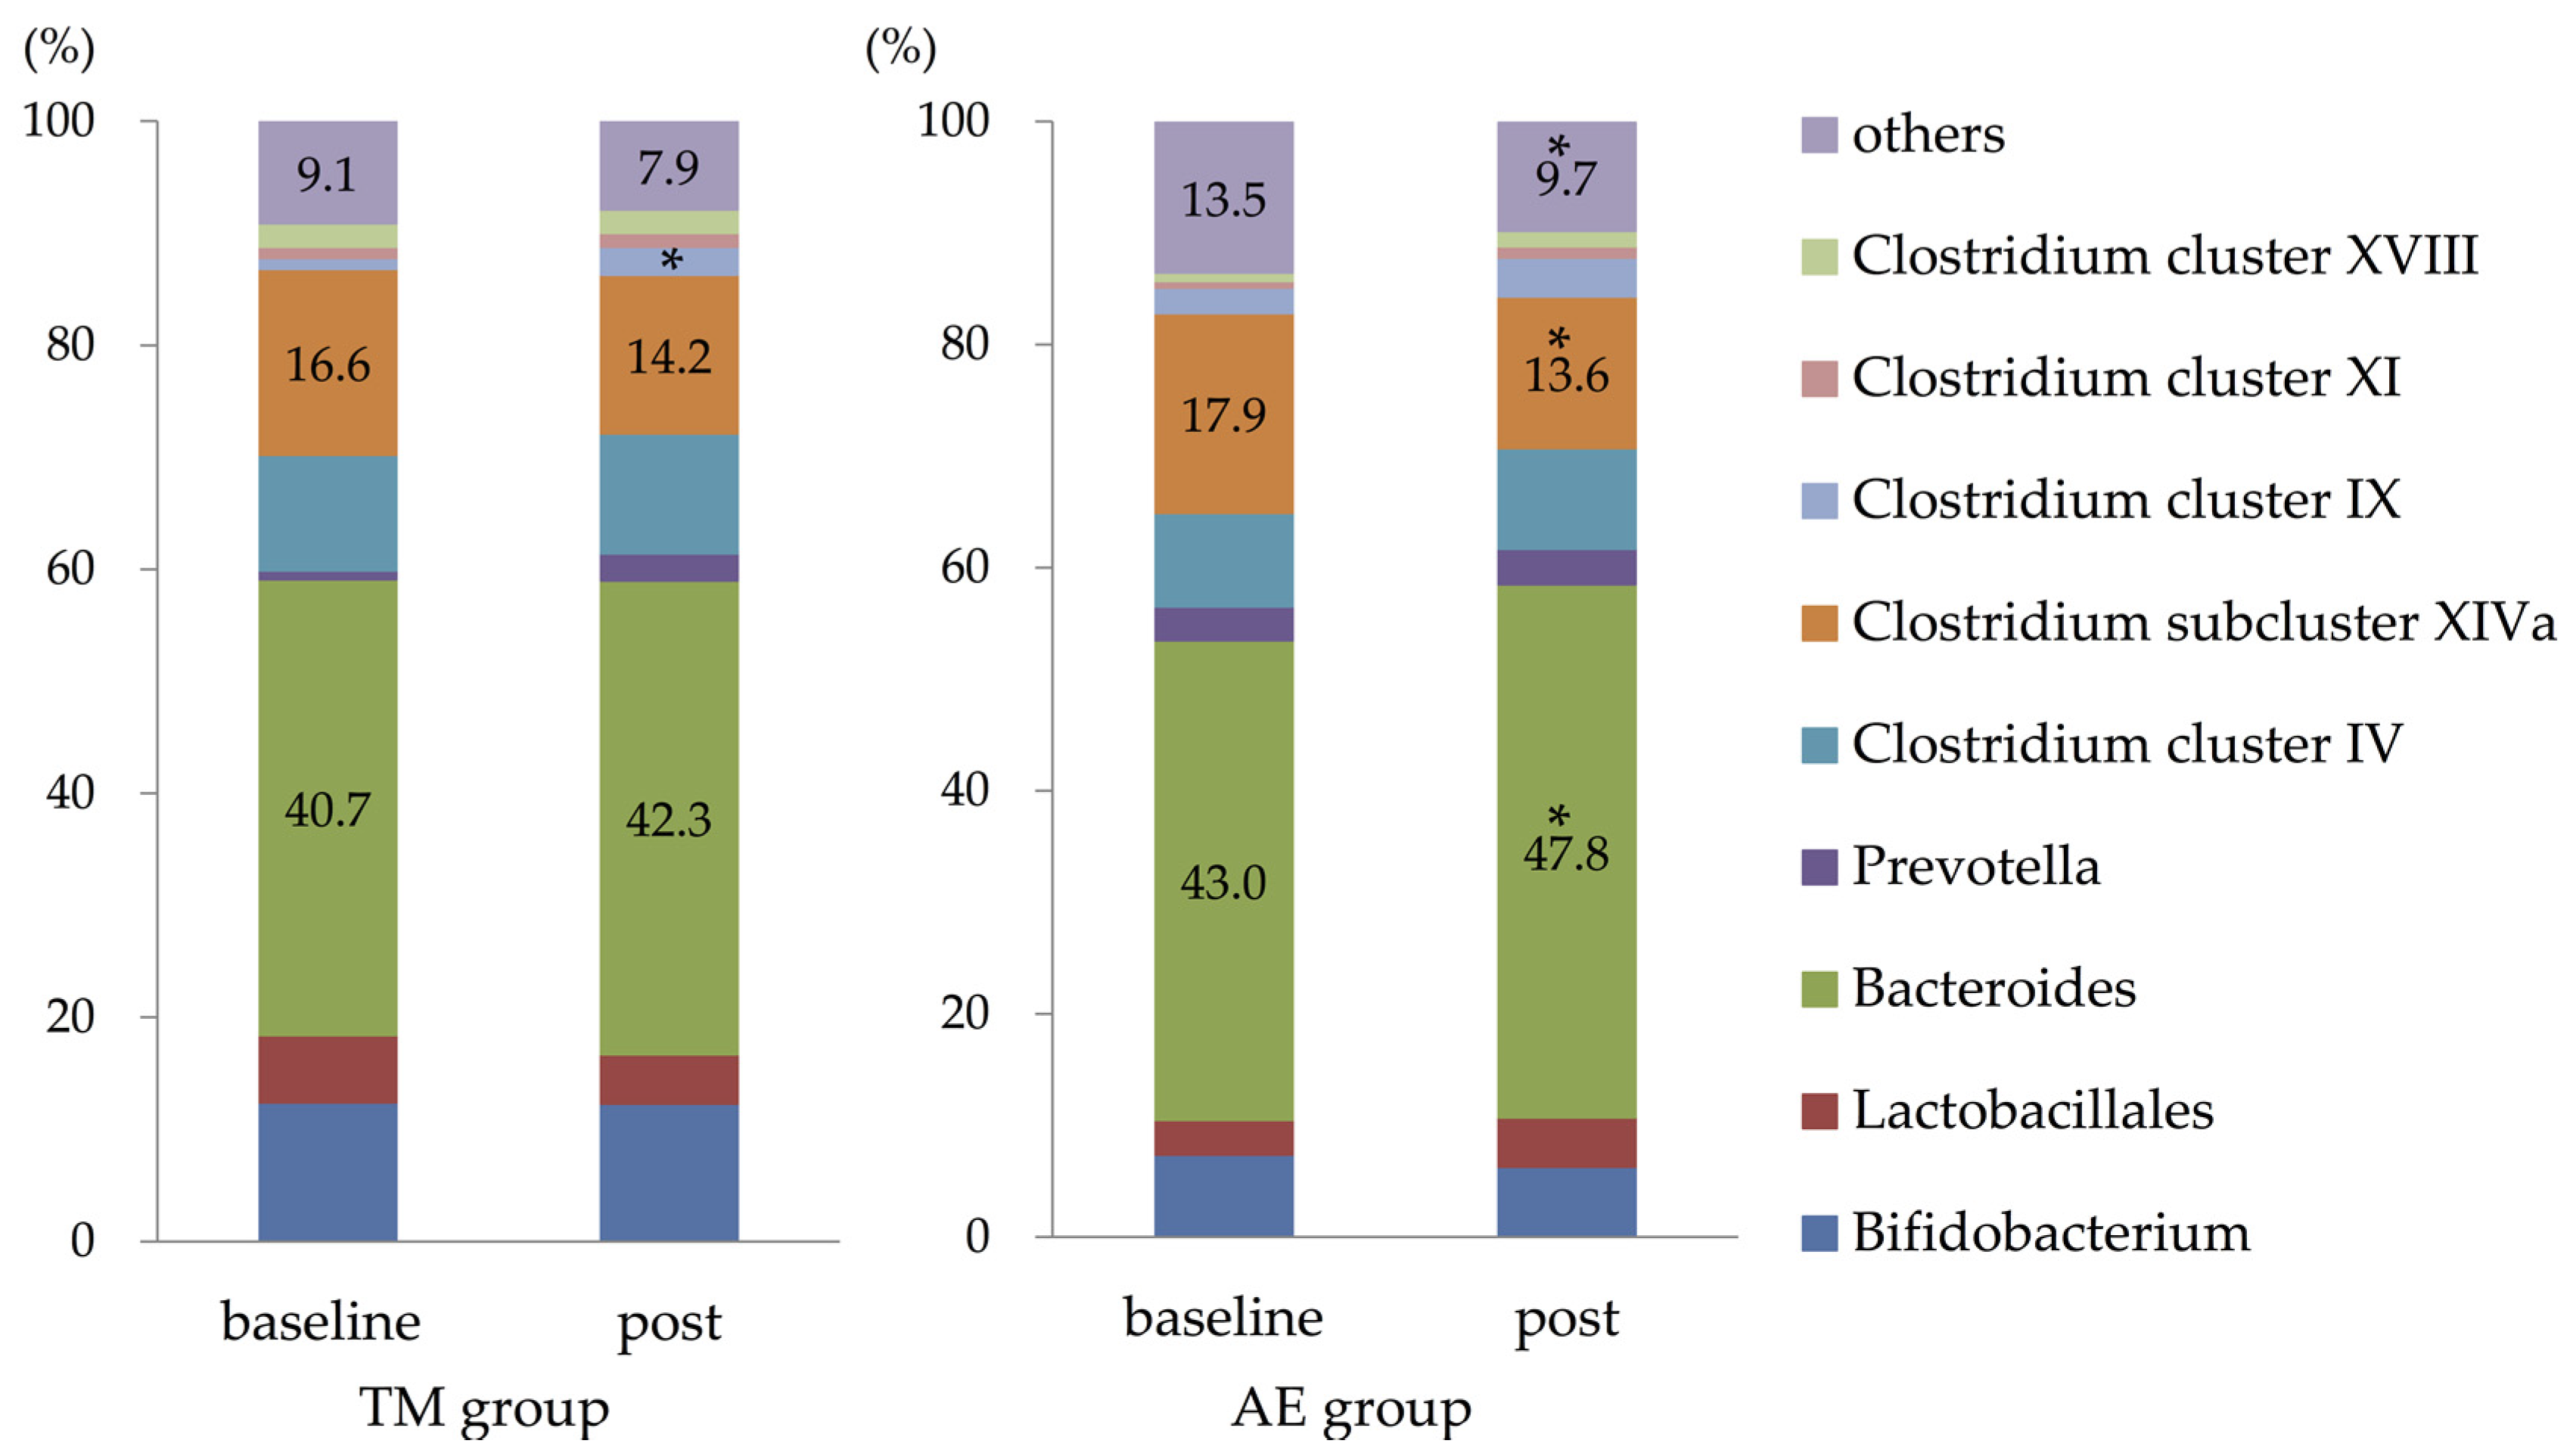
3.5. Composition of Intestinal Microbiota
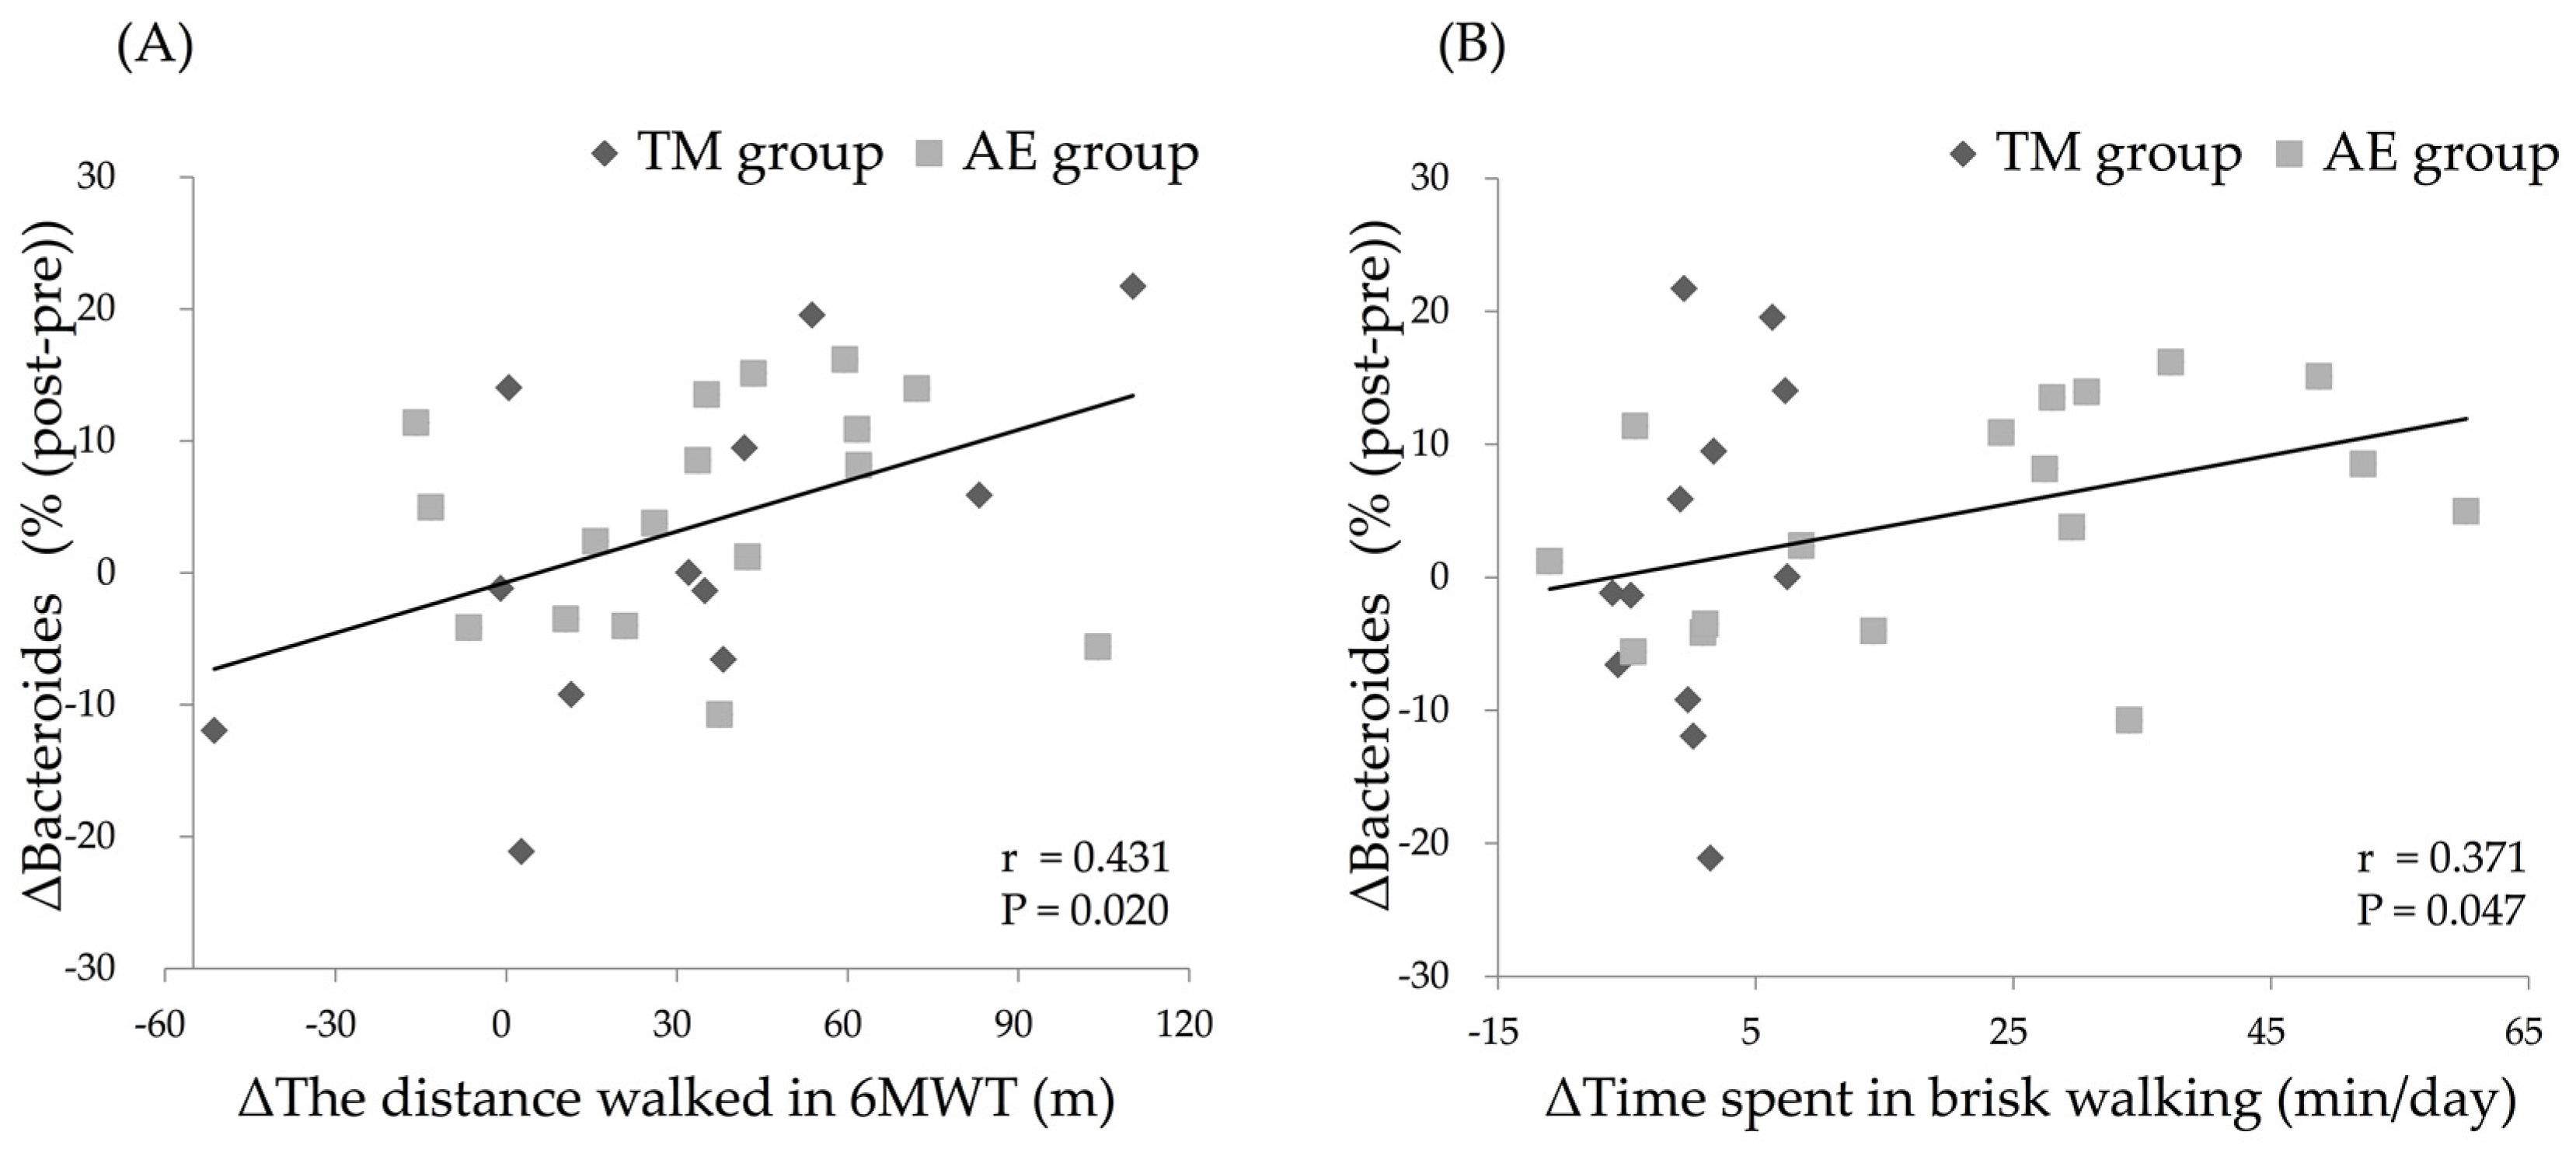
3.6. Relationship between Changes in the Parameters and Change in the Relative Abundance of Intestinal Bacteroides after the Intervention
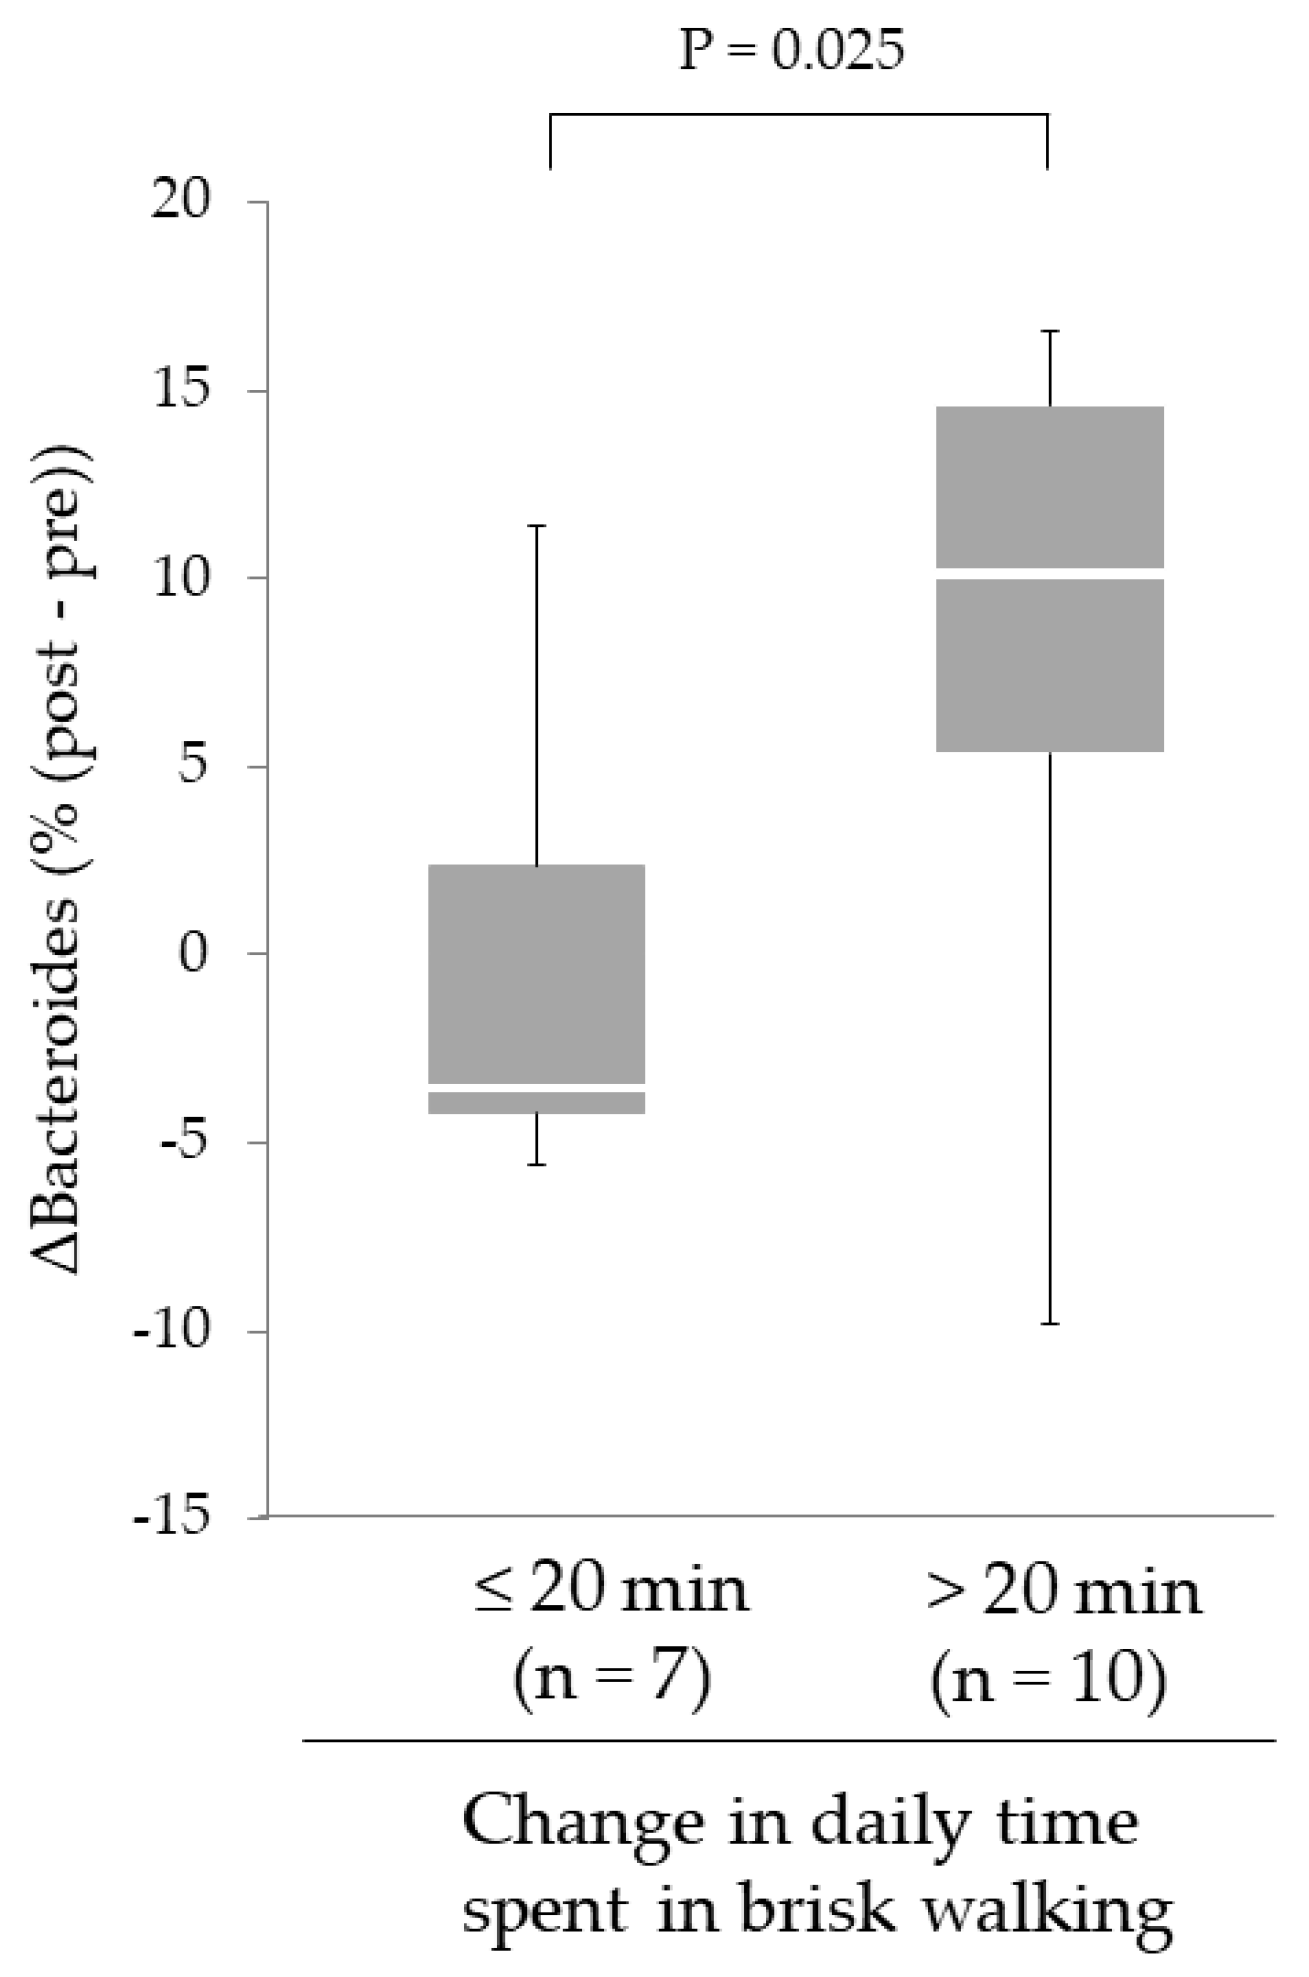
3.7. Effect of Increased Daily Physical Activity on Changes in the Relative Abundance of Intestinal Bacteroides Following the Intervention in the AE Group
4. Discussion
5. Conclusions
Supplementary Materials
Author Contributions
Funding
Acknowledgments
Conflicts of Interest
References
- Zhu, L.; Liu, W.; Alkhouri, R.; Baker, R.D.; Bard, J.E.; Quigley, E.M.; Baker, S.S. Structural changes in the gut microbiome of constipated patients. Physiol. Genom. 2014, 46, 679–686. [Google Scholar] [CrossRef]
- Turnbaugh, P.J.; Ley, R.E.; Mahowald, M.A.; Magrini, V.; Mardis, E.R.; Gordon, J.I. An obesity-associated gut microbiome with increased capacity for energy harvest. Nature 2006, 444, 1027–1031. [Google Scholar] [CrossRef] [PubMed]
- Larsen, N.; Vogensen, F.K.; van den Berg, F.W.; Nielsen, D.S.; Andreasen, A.S.; Pedersen, B.K.; Al-Soud, W.A.; Sorensen, S.J.; Hansen, L.H.; Jakobsen, M. Gut microbiota in human adults with type 2 diabetes differs from non-diabetic adults. PLoS ONE 2010, 5, e9085. [Google Scholar] [CrossRef] [PubMed]
- Sobhani, I.; Tap, J.; Roudot-Thoraval, F.; Roperch, J.P.; Letulle, S.; Langella, P.; Corthier, G.; Tran Van Nhieu, J.; Furet, J.P. Microbial dysbiosis in colorectal cancer (CRC) patients. PLoS ONE 2011, 6, e16393. [Google Scholar] [CrossRef]
- Emoto, T.; Yamashita, T.; Sasaki, N.; Hirota, Y.; Hayashi, T.; So, A.; Kasahara, K.; Yodoi, K.; Matsumoto, T.; Mizoguchi, T.; et al. Analysis of Gut Microbiota in Coronary Artery Disease Patients: A Possible Link between Gut Microbiota and Coronary Artery Disease. J. Atheroscler. Thromb. 2016, 23, 908–921. [Google Scholar] [CrossRef]
- Tamboli, C.P.; Neut, C.; Desreumaux, P.; Colombel, J.F. Dysbiosis as a prerequisite for IBD. Gut 2004, 53, 1057. [Google Scholar] [PubMed]
- Cenit, M.C.; Sanz, Y.; Codoner-Franch, P. Influence of gut microbiota on neuropsychiatric disorders. World J. Gastroenterol. 2017, 23, 5486–5498. [Google Scholar] [CrossRef]
- Woodmansey, E.J.; McMurdo, M.E.; Macfarlane, G.T.; Macfarlane, S. Comparison of compositions and metabolic activities of fecal microbiotas in young adults and in antibiotic-treated and non-antibiotic-treated elderly subjects. Appl. Environ. Microbiol. 2004, 70, 6113–6122. [Google Scholar] [CrossRef]
- Dicksved, J.; Halfvarson, J.; Rosenquist, M.; Järnerot, G.; Tysk, C.; Apajalahti, J.; Engstrand, L.; Jansson, J.K. Molecular analysis of the gut microbiota of identical twins with Crohn’s disease. ISME J. 2008, 2, 716–727. [Google Scholar] [CrossRef]
- Salminen, S.; Gibson, G.R.; McCartney, A.L.; Isolauri, E. Influence of mode of delivery on gut microbiota composition in seven year old children. Gut 2004, 53, 1388–1389. [Google Scholar] [CrossRef] [PubMed]
- David, L.A.; Maurice, C.F.; Carmody, R.N.; Gootenberg, D.B.; Button, J.E.; Wolfe, B.E.; Ling, A.V.; Devlin, A.S.; Varma, Y.; Fischbach, M.A.; et al. Diet rapidly and reproducibly alters the human gut microbiome. Nature 2014, 505, 559–563. [Google Scholar] [CrossRef]
- Takahashi, H.; Kuriyama, S.; Tsubono, Y.; Nakaya, N.; Fujita, K.; Nishino, Y.; Shibuya, D.; Tsuji, I. Time spent walking and risk of colorectal cancer in Japan: The Miyagi Cohort study. Eur. J. Cancer Prev. 2007, 16, 403–408. [Google Scholar] [CrossRef]
- Brown, J.C.; Rhim, A.D.; Manning, S.L.; Brennan, L.; Mansour, A.I.; Rustgi, A.K.; Damjanov, N.; Troxel, A.B.; Rickels, M.R.; Ky, B.; et al. Effects of exercise on circulating tumor cells among patients with resected stage I-III colon cancer. PLoS ONE 2018, 13, e0204875. [Google Scholar] [CrossRef]
- Queipo-Ortuno, M.I.; Seoane, L.M.; Murri, M.; Pardo, M.; Gomez-Zumaquero, J.M.; Cardona, F.; Casanueva, F.; Tinahones, F.J. Gut microbiota composition in male rat models under different nutritional status and physical activity and its association with serum leptin and ghrelin levels. PLoS ONE 2013, 8, e65465. [Google Scholar] [CrossRef]
- Allen, J.M.; Berg Miller, M.E.; Pence, B.D.; Whitlock, K.; Nehra, V.; Gaskins, H.R.; White, B.A.; Fryer, J.D.; Woods, J.A. Voluntary and forced exercise differently alters the gut microbiome in C57BL/6J mice. J. Appl. Physiol. 2015, 118, 1059–1066. [Google Scholar] [CrossRef]
- Denou, E.; Marcinko, K.; Surette, M.G.; Steinberg, G.R.; Schertzer, J.D. High-intensity exercise training increases the diversity and metabolic capacity of the mouse distal gut microbiota during diet-induced obesity. Am. J. Physiol. Endocrinol. Metab. 2016, 310, E982–E993. [Google Scholar] [CrossRef]
- Clarke, S.F.; Murphy, E.F.; O’Sullivan, O.; Lucey, A.J.; Humphreys, M.; Hogan, A.; Hayes, P.; O’Reilly, M.; Jeffery, I.B.; Wood-Martin, R.; et al. Exercise and associated dietary extremes impact on gut microbial diversity. Gut 2014, 63, 1913–1920. [Google Scholar] [CrossRef]
- Yang, Y.; Shi, Y.; Wiklund, P.; Tan, X.; Wu, N.; Zhang, X.; Tikkanen, O.; Zhang, C.; Munukka, E.; Cheng, S. The Association between Cardiorespiratory Fitness and Gut Microbiota Composition in Premenopausal Women. Nutrients 2017, 9, 792. [Google Scholar] [CrossRef]
- Estaki, M.; Pither, J.; Baumeister, P.; Little, J.P.; Gill, S.K.; Ghosh, S.; Ahmadi-Vand, Z.; Marsden, K.R.; Gibson, D.L. Cardiorespiratory fitness as a predictor of intestinal microbial diversity and distinct metagenomic functions. Microbiome 2016, 4, 42. [Google Scholar] [CrossRef]
- Mahnic, A.; Rupnik, M. Different host factors are associated with patterns in bacterial and fungal gut microbiota in Slovenian healthy cohort. PLoS ONE 2018, 13, e0209209. [Google Scholar] [CrossRef]
- Murtaza, N.; Burke, L.M.; Vlahovich, N.; Charlesson, B.; O’Neill, H.; Ross, M.L.; Campbell, K.L.; Krause, L.; Morrison, M. The Effects of Dietary Pattern during Intensified Training on Stool Microbiota of Elite Race Walkers. Nutrients 2019, 11, 261. [Google Scholar] [CrossRef]
- Sakaki, S.; Takahashi, T.; Matsumoto, J.; Kubo, K.; Matsumoto, T.; Hishinuma, R.; Terabe, Y.; Ando, H. Characteristics of physical activity in patients with critical limb ischemia. J. Phys. Ther. Sci. 2016, 28, 3454–3457. [Google Scholar] [CrossRef]
- Moriyama, N.; Urabe, Y.; Onoda, S.; Maeda, N.; Oikawa, T. Effect of Two month Intervention to Improve Physical Activity of Evacuees in Temporary Housing after the Great East Japan Earthquake: Pilot Study. Int. J. Community Med. Health. Educ. 2017, 7, 528. [Google Scholar]
- Hosomi, K.; Ohno, H.; Murakami, H.; Natsume-Kitatani, Y.; Tanisawa, K.; Hirata, S.; Suzuki, H.; Nagatake, T.; Nishino, T.; Mizuguchi, K.; et al. Method for preparing DNA from feces in guanidine thiocyanate solution affects 16S rRNA-based profiling of human microbiota diversity. Sci. Rep. 2017, 7, 4339. [Google Scholar] [CrossRef]
- Nagashima, K.; Hisada, T.; Sato, M.; Mochizuki, J. Application of new primer-enzyme combinations to terminal restriction fragment length polymorphism profiling of bacterial populations in human feces. Appl. Environ. Microbiol. 2003, 69, 1251–1262. [Google Scholar] [CrossRef]
- Nagashima, K.; Mochizuki, J.; Hisada, T.; Suzuki, S.; Shimoura, K. Phylogenetic analysis of 16S ribosomal RNA gene sequences from Human fecal microbiota and improved utility of terminal restriction fragment length polymorphism profiling. Biosci. Microflora 2006, 25, 99–107. [Google Scholar] [CrossRef]
- Koyama, Y.; Ishikawa, S.; Sukigara, S. Trunk Fitness of Female University Student evaluated by modified Kraus-Weber Test. J. Ibaraki Christian Univ. II Soc. Nat. Sci. 2007, 41, 211–220. (In Japanese) [Google Scholar]
- Kraus, H.; Hirschland, R. Minimum muscular fitness of the school children. Res. Quart. 1954, 25, 178–188. [Google Scholar] [CrossRef]
- ATS Committee on Proficiency Standards for Clinical Pulmonary Function Laboratories. ATS statement: Guidelines for the six-minute walk test. Am. J. Respir. Crit. Care Med. 2002, 166, 111–117. [Google Scholar] [CrossRef]
- Cahalin, L.P.; Mathier, M.A.; Semigran, M.J.; Dec, G.W.; DiSalvo, T.G. The six-minute walk test predicts peak oxygen uptake and survival in patients with advanced heart failure. Chest 1996, 110, 325–332. [Google Scholar] [CrossRef]
- Ross, R.M.; Murthy, J.N.; Wollak, I.D.; Jackson, A.S. The six minute walk test accurately estimates mean peak oxygen uptake. BMC. Pulm. Med. 2010, 10, 31. [Google Scholar] [CrossRef] [PubMed]
- Garber, C.E.; Blissmer, B.; Deschenes, M.R.; Franklin, B.A.; Lamonte, M.J.; Lee, I.M.; Nieman, D.C.; Swain, D.P. American College of Sports Medicine. American College of Sports Medicine position stand. Quantity and quality of exercise for developing and maintaining cardiorespiratory, musculoskeletal, and neuromotor fitness in apparently healthy adults: Guidance for prescribing exercise. Med. Sci. Sports Exerc. 2011, 43, 1334–1359. [Google Scholar] [PubMed]
- Yokoyama, H.; Emoto, M.; Fujiwara, S.; Motoyama, K.; Morioka, T.; Komatsu, M.; Tahara, H.; Shoji, T.; Okuno, Y.; Nishizawa, Y. Quantitative insulin sensitivity check index and the reciprocal index of homeostasis model assessment in normal range weight and moderately obese type 2 diabetic patients. Diabetes Care 2003, 26, 2426–2432. [Google Scholar] [CrossRef] [PubMed]
- Matthews, D.R.; Hosker, J.P.; Rudenski, A.S.; Naylor, B.A.; Treacher, D.F.; Turner, R.C. Homeostasis model assessment: Insulin resistance and beta-cell function from fasting plasma glucose and insulin concentrations in man. Diabetologia 1985, 28, 412–419. [Google Scholar] [CrossRef]
- Tsubono, Y.; Takamori, S.; Kobayashi, M.; Takahashi, T.; Iwase, Y.; Iitoi, Y.; Akabane, M.; Yamaguchi, M.; Tsugane, S. A data-based approach for designing a semiquantitative food frequency questionnaire for a population-based prospective study in Japan. J. Epidemiol. 1996, 6, 45–53. [Google Scholar] [CrossRef] [PubMed]
- McMillan, S.C.; Williams, F.A. Validity and reliability of the Constipation Assessment Scale. Cancer Nurs. 1989, 12, 183–188. [Google Scholar] [CrossRef] [PubMed]
- Fukai, K.; Sugita, A.; Tanaka, M. A developmental study of the Japanese version of the constipation assessment scale. Jpn. J. Nurs. Res. 1995, 28, 201–208. [Google Scholar]
- Allen, J.M.; Mailing, L.J.; Niemiro, G.M.; Moore, R.; Cook, M.D.; White, B.A.; Holscher, H.D.; Woods, J.A. Exercise Alters Gut Microbiota Composition and Function in Lean and Obese Humans. Med. Sci. Sports. Exerc. 2018, 50, 747–757. [Google Scholar] [CrossRef]
- Aoyagi, Y.; Shephard, R.J. Habitual physical activity and health in the elderly: The Nakanojo Study. Geriatr. Gerontol. Int. 2010, 10, S236–S243. [Google Scholar]
- Shephard, R.J.; Park, H.; Park, S.; Aoyagi, Y. Objective Longitudinal Measures of Physical Activity and Bone Health in Older Japanese: The Nakanojo Study. J. Am. Geriatr. Soc. 2017, 65, 800–807. [Google Scholar] [CrossRef]
- Park, S.; Park, H.; Togo, F.; Watanabe, E.; Yasunaga, A.; Yoshiuchi, K.; Shephard, R.J.; Aoyagi, Y. Year-long physical activity and metabolic syndrome in older Japanese adults: Cross-sectional data from the Nakanojo Study. J. Gerontol. A. Biol. Sci. Med. Sci. 2008, 63, 1119–1123. [Google Scholar] [CrossRef] [PubMed]
- Volianitis, S.; McConnell, A.K.; Koutedakis, Y.; McNaughton, L.; Backx, K.; Jones, D.A. Inspiratory muscle training improves rowing performance. Med. Sci. Sports. Exerc. 2001, 33, 803–809. [Google Scholar] [CrossRef] [PubMed]
- Tottey, W.; Feria-Gervasio, D.; Gaci, N.; Laillet, B.; Pujos, E.; Martin, J.F.; Sebedio, J.L.; Sion, B.; Jarrige, J.F.; Alric, M.; et al. Colonic Transit Time Is a Driven Force of the Gut Microbiota Composition and Metabolism: In Vitro Evidence. J. Neurogastroenterol. Motil. 2017, 23, 124–134. [Google Scholar] [CrossRef] [PubMed]
- Abbas, A.; Wilding, G.E.; Sitrin, M.D. Does Colonic Transit Time Affect Colonic pH? J. Gastroenterol. Hepatol. Res. 2014, 3, 1103–1107. [Google Scholar] [CrossRef]
- Oettle, G.J. Effect of moderate exercise on bowel habit. Gut 1991, 32, 8, 941–944. [Google Scholar] [CrossRef]
- De Schryver, A.M.; Keulemans, Y.C.; Peters, H.P.; Akkermans, L.M.; Smout, A.J.; De Vries, W.R.; van Berge-Henegouwen, G.P. Effects of regular physical activity on defecation pattern in middle-aged patients complaining of chronic constipation. Scand. J. Gastroenterol. 2005, 40, 422–429. [Google Scholar] [CrossRef]
- Matsumoto, M.; Inoue, R.; Tsukahara, T.; Ushida, K.; Chiji, H.; Matsubara, N.; Hara, H. Voluntary running exercise alters microbiota composition and increases n-butyrate concentration in the rat cecum. Biosci. Biotechnol. Biochem. 2008, 72, 572–576. [Google Scholar] [CrossRef]
- Walker, A.W.; Duncan, S.H.; McWilliam Leitch, E.C.; Child, M.W.; Flint, H.J. pH and peptide supply can radically alter bacterial populations and short-chain fatty acid ratios within microbial communities from the human colon. Appl. Environ. Microbiol. 2005, 71, 3692–3700. [Google Scholar] [CrossRef] [PubMed]
- Duncan, S.H.; Louis, P.; Thomson, J.M.; Flint, H.J. The role of pH in determining the species composition of the human colonic microbiota. Environ. Microbiol. 2009, 11, 2112–2122. [Google Scholar] [CrossRef]
- Mazmanian, S.K.; Round, J.L.; Kasper, D.L. A microbial symbiosis factor prevents intestinal inflammatory disease. Nature 2008, 453, 620–625. [Google Scholar] [CrossRef]
- Shukla, R.; Ghoshal, U.; Dhole, T.N.; Ghoshal, U.C. Fecal Microbiota in Patients with Irritable Bowel Syndrome Compared with Healthy Controls Using Real-Time Polymerase Chain Reaction: An Evidence of Dysbiosis. Dig. Dis. Sci. 2015, 60, 2953–2962. [Google Scholar] [CrossRef]
- Kirjavainen, P.V.; Arvola, T.; Salminen, S.J.; Isolauri, E. Aberrant composition of gut microbiota of allergic infants: A target of bifidobacterial therapy at weaning? Gut 2002, 51, 51–55. [Google Scholar] [CrossRef]
- Ley, R.E.; Turnbaugh, P.J.; Klein, S.; Gordon, J.I. Microbial ecology: Human gut microbes associated with obesity. Nature 2006, 444, 1022–1023. [Google Scholar] [CrossRef]
- Santacruz, A.; Collado, M.C.; Garcia-Valdes, L.; Segura, M.T.; Martin-Lagos, J.A.; Anjos, T.; Marti-Romero, M.; Lopez, R.M.; Florido, J.; Campoy, C.; et al. Gut microbiota composition is associated with body weight, weight gain and biochemical parameters in pregnant women. Br. J. Nutr. 2010, 104, 83–92. [Google Scholar] [CrossRef]
- Vlasova, A.N.; Kandasamy, S.; Chattha, K.S.; Rajashekara, G.; Saif, L.J. Comparison of probiotic lactobacilli and bifidobacteria effects, immune responses and rotavirus vaccines and infection in different host species. Vet. Immunol. Immunopathol. 2016, 172, 72–84. [Google Scholar] [CrossRef]
- Lahtinen, S.J.; Tammela, L.; Korpela, J.; Parhiala, R.; Ahokoski, H.; Mykkänen, H.; Salminen, S.J. Probiotics modulate the Bifidobacterium microbiota of elderly nursing home residents. Age (Dordr.) 2009, 31, 59–66. [Google Scholar] [CrossRef]
- Bressa, C.; Bailen-Andrino, M.; Perez-Santiago, J.; González-Soltero, R.; Pérez, M.; Montalvo-Lominchar, M.G.; Maté-Muñoz, J.L.; Domínguez, R.; Moreno, D.; Larrosa, M. Differences in gut microbiota profile between women with active lifestyle and sedentary women. PLoS ONE 2017, 12, e0171352. [Google Scholar] [CrossRef]


| Total | TM Group | AE Group | ||
|---|---|---|---|---|
| n | 29 | 12 | 17 | |
| Age | (years) | 70 (66–75) | 70 (66–77) | 70 (66–75) |
| BW | (kg) | 51.8 (47.8–56.5) | 49.8 (48.3–56.8) | 52.0 (46.9–56.0) |
| BMI | (kg/m2) | 21.4 (18.8–23.1) | 20.6 (18.7–24.0) | 21.7 (18.9–23.1) |
| Body fat | (%) | 29.0 (23.6–32.7) | 26.6 (22.9–32.2) | 30.6 (25.1–33.0) |
| SBP | (mmHg) | 141 (120–152) | 129 (114–151) | 142 (124–154) |
| DBP | (mmHg) | 82 (74–92) | 81 (74–86) | 85 (74–93) |
| Present illness | n (%) | |||
| No | 17 (58.6) | 9 (75.0) | 8 (47.1) | |
| Yes | 12 (41.4) | 3 (25.0) | 9 (52.9) | |
| Past history | n (%) | |||
| No | 15 (51.7) | 7 (58.3) | 8 (47.1) | |
| Yes | 14 (48.3) | 5 (41.7) | 9 (52.9) | |
| Medication | n (%) | |||
| No | 19 (65.5) | 10 (83.3) | 9 (52.9) | |
| Yes | 10 (34.5) | 2 (16.7) | 8 (47.1) |
| TM Group (n = 12) | AE Group (n = 17) | ||||
|---|---|---|---|---|---|
| Baseline | Post | Baseline | Post | ||
| BMI | (kg/m2) | 20.6 (18.7–24.0) | 20.8 (18.8–23.8) | 21.7 (18.9–23.1) | 21.3 (18.8–23.5) |
| Body fat | (%) | 26.6 (22.9–32.2) | 27.4 (23.7–31.9) | 30.6 (25.1–33.0) | 28.6 (25.1–33.75) |
| Leg muscle mass | (kg) | 8.08 (7.06–8.29) | 7.82 (6.80–8.16) | 7.29 (7.03–8.08) | 7.44 (7.12–8.25) |
| K-W test score | (/40) | 15.5 (8.5–24.8) | 27.5 (22.0–31.8) * | 13.0 (9.0–16.5) | 21.0 (15.5–29.0) * |
| Quad. muscle strength | (kg) | 22.7 (20.1–29.2) | 23.5 (22.1–30.8) | 26.2 (19.9–32.5) | 24.8 (20.6–29.2) |
| MSL | (cm) | 111.6 (107.6–123.2) | 111.5 (107.0–125.5) | 112.9 (108.9–120.0) | 113.1 (104.3–119.5) |
| TUG | (sec) | 6.19 (5.60–6.77) | 5.80 (5.40–6.50) | 6.14 (5.50–6.80) | 5.87 (5.59–6.42) |
| Single-leg standing | (sec) | 28.6 (12.3–120.0) | 70.9 (32.3–120.0) | 98.5 (39.9–120.0) | 120.0 (79.0–120.0) |
| 6MWD | (m) | 540.8 (521.0–570.0) | 567.5 (538.0–627.6) * | 550.0 (510.9–579.7) | 582.7 (541.0–618.7) * |
| Number of steps | (steps/day) | 6348 (5256–7267) | 6438 (4443–8073) | 7869 (6456–10246) | 10297 (7396–14117) * |
| Time spent in brisk walking | (min/day) | 10 (2–15) | 9 (2–17) | 16 (8–30) | 45 (16–52) * |
| Total EE | (kcal/day) | 1561.0 (1418.3–1672.8) | 1561.5 (1406.3–1613.3) * | 1598.0 (1478.0–1724.0) | 1633.0 (1469.5–1844.0) * |
| Exercise-induced EE | (kcal/day) | 125.5 (99.5–140.0) | 125.5 (85.5–154.0) | 161.0 (118.5–211.5) | 228.0 (153.5–318.0) * |
| FPG | (mmol/L) | 5.9 (5.5–7.0) | 5.7 (5.3–6.8) | 5.8 (5.2–6.1) | 5.3 (5.1–6.3) |
| TG | (mmol/L) | 1.08 (0.87–1.27) | 1.07 (0.91–1.54) | 0.89 (0.75–1.17) | 1.06 (0.91–1.53) |
| LDL-C | (mmol/L) | 3.45 (3.23–3.77) | 3.40 (2.95–4.25) | 3.72 (3.25–4.19) | 3.72 (3.21–4.24) |
| HDL-C | (mmol/L) | 1.60 (1.27–2.26) | 1.66 (1.29–2.43) | 1.73 (1.42–2.03) | 1.68 (1.44–2.06) |
| Insulin | (pmol/L) | 29.8 (21.7–33.7) | 32.3 (25.8–60.4) | 38.0 (26.2–54.5) | 40.2 (25.1–59.6) |
| HOMA-IR | 1.10 (0.74–1.45) | 1.14 (0.86–2.55) | 1.36 (0.84–2.05) | 1.31 (0.80–2.32) | |
| TM Group (n = 12) | AE Group (n = 17) | ||||
|---|---|---|---|---|---|
| Baseline | Post | Baseline | Post | ||
| Nutrient intake | |||||
| Total energy | (kcal/day) | 1863 (1827–1908) | 1878 (1839–1942) | 1874 (1795–1956) | 1828 (1796–1942) |
| Carbohydrates | (g/day) | 244.8 (237.6–252.7) | 248.0 (243.0–255.3) | 246.7 (240.8–258.1) | 243.4 (238.9–255.2) |
| Protein | (g/day) | 76.5 (74.2–83.1) | 76.8 (74.4–84.2) | 75.6 (71.6–82.9) | 75.3 (71.8–82.1) |
| Lipid | (g/day) | 59.2 (57.8–60.5) | 59.9 (59.1–64.5) | 58.9 (56.2–64.0) | 58.5 (55.8–63.9) |
| Saturated fat | (g/day) | 17.1 (16.7–17.7) | 17.7 (16.7–20.0) | 17.7 (16.1–19.1) | 16.9 (16.0–19.1) |
| Fiber | (g/day) | 17.6 (17.1–17.9) | 18.2 (17.3–18.8) | 17.6 (17.2–18.5) | 17.7 (17.0–18.2) |
| Defecation pattern | |||||
| CAS-J | (/16) | 3.50 (2.25–5.75) | 3.50 (2.00–5.75) | 2.00 (1.00–4.50) | 2.00 (0.00–3.00) * |
| Abdomen appears distended or swollen | (/2) | 0.0 (0.0–1.0) | 0.0 (0.0–1.0) | 0.0 (0.0–1.0) | 0.0 (0.0–0.0) |
| Amount of flatus | (/2) | 1.0 (0.0–1.0) | 1.0 (0.0–2.0) | 0.0 (0.0–1.0) | 0.0 (0.0–1.0) |
| Frequency of defecation | (/2) | 0.0 (0.0–1.0) | 0.0 (0.0–1.0) | 0.0 (0.0–1.0) | 0.0 (0.0–0.5) |
| Rectum appears to be filled with feces | (/2) | 1.0 (0.0–1.0) | 0.0 (0.0–0.8) * | 0.0 (0.0–1.0) | 0.0 (0.0–0.0) |
| Pain of the anus during defecation | (/2) | 0.0 (0.0–1.0) | 0.0 (0.0–0.8) | 0.0 (0.0–0.5) | 0.0 (0.0–0.0) |
| Amount of feces | (/2) | 0.0 (0.0–0.8) | 0.0 (0.0–1.0) | 0.0 (0.0–0.0) | 0.0 (0.0–0.0) |
| Ease of defecation | (/2) | 0.5 (0.0–1.0) | 0.0 (0.0–1.0) | 0.0 (0.0–1.0) | 0.0 (0.0–1.0) * |
| Diarrhea or watery stools | (/2) | 0.0 (0.0–1.0) | 0.0 (0.0–0.0) | 0.0 (0.0–1.0) | 0.0 (0.0–0.0) |
| Related Factors | Correlation Coefficient | p Value |
|---|---|---|
| Age | −0.343 | 0.068 |
| Pre-Bacteroides | −0.519 | 0.004 * |
| ΔK-W test score | 0.327 | 0.083 |
| Δ6MWD | 0.431 | 0.020 * |
| ΔNumber of steps | 0.210 | 0.275 |
| ΔTime spent in brisk walking | 0.371 | 0.047 * |
| ΔTotal EE | 0.216 | 0.261 |
| ΔExercise-induced EE | 0.250 | 0.191 |
| ΔCAS-J | 0.071 | 0.715 |
© 2019 by the authors. Licensee MDPI, Basel, Switzerland. This article is an open access article distributed under the terms and conditions of the Creative Commons Attribution (CC BY) license (http://creativecommons.org/licenses/by/4.0/).
Share and Cite
Morita, E.; Yokoyama, H.; Imai, D.; Takeda, R.; Ota, A.; Kawai, E.; Hisada, T.; Emoto, M.; Suzuki, Y.; Okazaki, K. Aerobic Exercise Training with Brisk Walking Increases Intestinal Bacteroides in Healthy Elderly Women. Nutrients 2019, 11, 868. https://doi.org/10.3390/nu11040868
Morita E, Yokoyama H, Imai D, Takeda R, Ota A, Kawai E, Hisada T, Emoto M, Suzuki Y, Okazaki K. Aerobic Exercise Training with Brisk Walking Increases Intestinal Bacteroides in Healthy Elderly Women. Nutrients. 2019; 11(4):868. https://doi.org/10.3390/nu11040868
Chicago/Turabian StyleMorita, Emiko, Hisayo Yokoyama, Daiki Imai, Ryosuke Takeda, Akemi Ota, Eriko Kawai, Takayoshi Hisada, Masanori Emoto, Yuta Suzuki, and Kazunobu Okazaki. 2019. "Aerobic Exercise Training with Brisk Walking Increases Intestinal Bacteroides in Healthy Elderly Women" Nutrients 11, no. 4: 868. https://doi.org/10.3390/nu11040868