Homocysteine Metabolism in Children and Adolescents: Influence of Age on Plasma Biomarkers and Correspondent Genotype Interactions

 and
and
Abstract
:1. Introduction
2. Materials and Methods
2.1. Subjects
2.2. Anthropometric Data
2.3. Blood Sample Collection and Biochemical Analyses
2.4. Genotype Analyses
2.5. Statistical Analysis
3. Results
3.1. Anthropometric and Biochemical Parameters
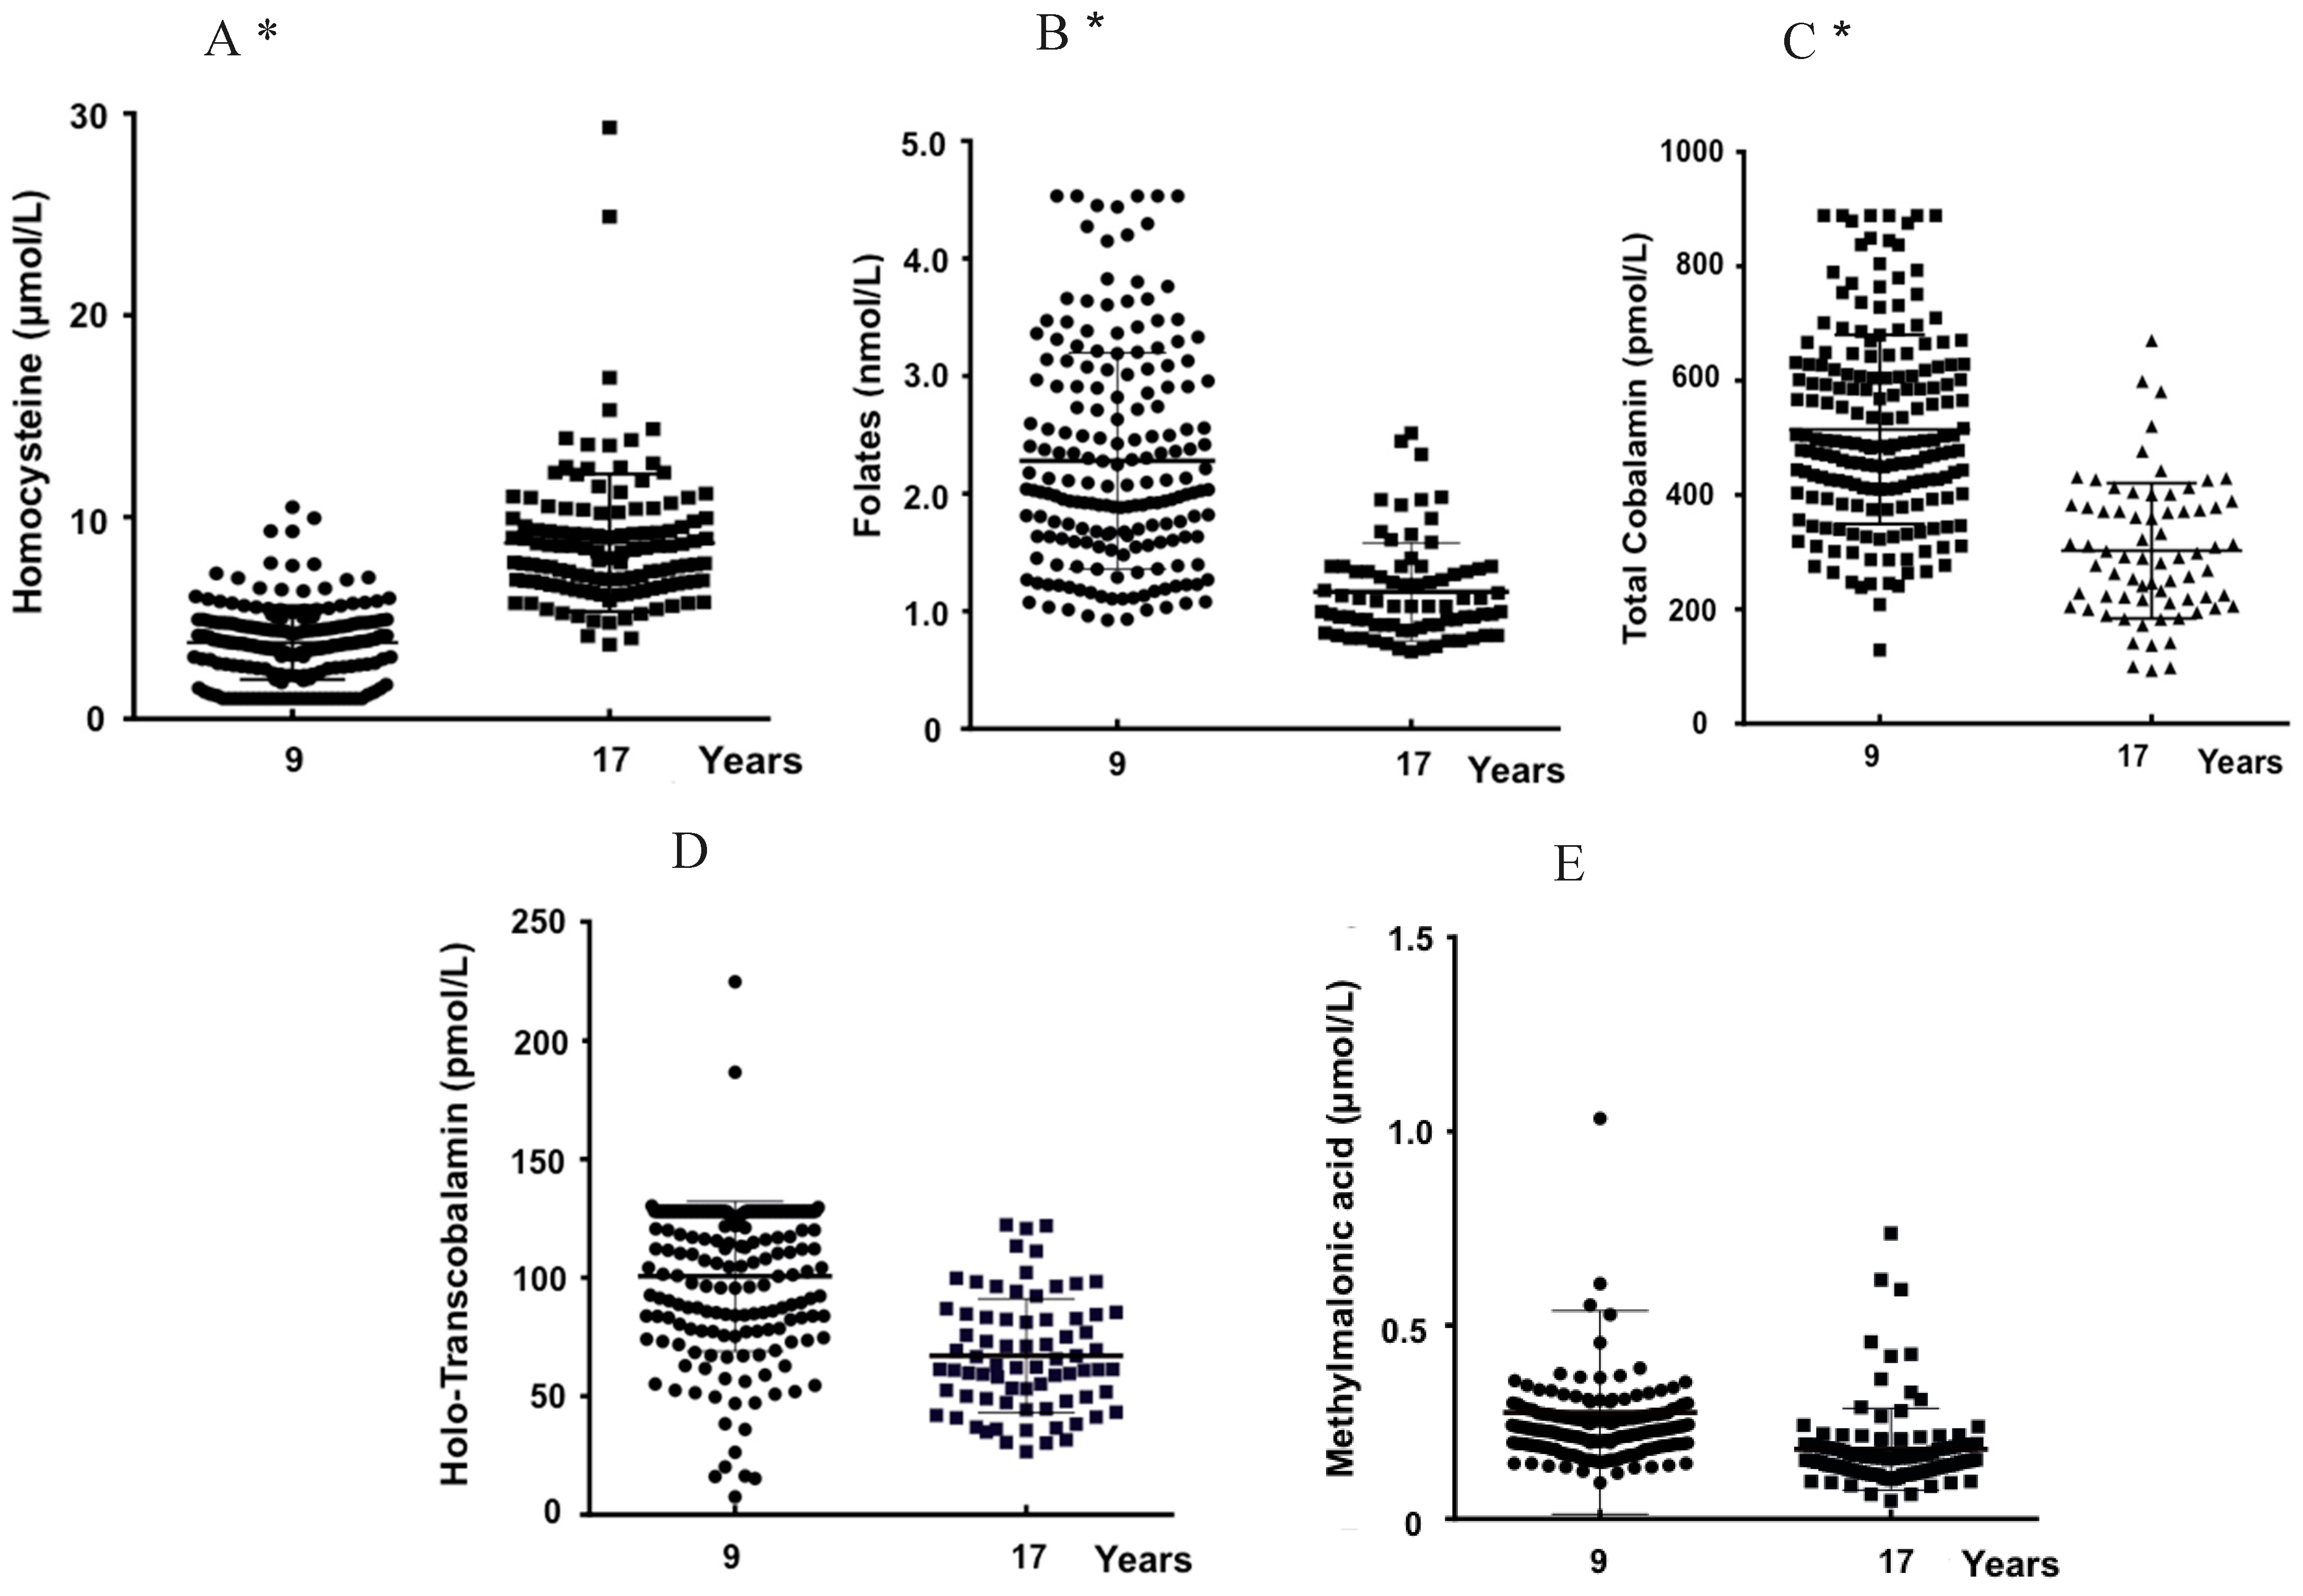
3.2. Age and Plasma Biomarkers
3.3. Genotypes, Age, and Biomarkers
4. Discussion
5. Conclusions
Author Contributions
Funding
Acknowledgments
Conflicts of Interest
References
- Ducker, G.S.; Rabinowitz, J.D. One-Carbon Metabolism in Health and Disease. Cell Metab. 2017, 25, 27–42. [Google Scholar] [CrossRef] [PubMed]
- Ho, V.; Massey, T.E.; King, W.D. Effects of methionine synthase and methylenetetrahydrofolate reductase gene polymorphisms on markers of one-carbon metabolism. Genes Nutr. 2013, 8, 571–580. [Google Scholar] [CrossRef] [PubMed]
- Bacalini, M.G.; Friso, S.; Olivieri, F.; Pirazzini, C.; Giuliani, C.; Capri, M.; Santoro, A.; Franceschi, C.; Garagnani, P. Present and future of anti-ageing epigenetic diets. Mech. Ageing Dev. 2014, 136–137, 101–115. [Google Scholar] [CrossRef] [PubMed]
- Fiorito, G.; Guarrera, S.; Valle, C.; Ricceri, F.; Russo, A.; Grioni, S.; Mattiello, A.; Di Gaetano, C.; Rosa, F.; Modica, F.; et al. B-vitamins intake, DNA-methylation of One Carbon Metabolism and homocysteine pathway genes and myocardial infarction risk: The EPICOR study. Nutr. Metab. Cardiovasc. Dis. 2014, 24, 483–488. [Google Scholar] [CrossRef] [PubMed]
- Cascalheira, J.F.; Goncalves, M.; Barroso, M.; Castro, R.; Palmeira, M.; Serpa, A.; Dias-Cabral, A.C.; Domingues, F.C.; Almeida, S. Association of the transcobalamin II gene 776C --> G polymorphism with Alzheimer’s type dementia: Dependence on the 5,10-methylenetetrahydrofolate reductase 1298A --> C polymorphism genotype. Ann. Clin. Biochem. 2015, 52, 448–455. [Google Scholar] [CrossRef] [PubMed]
- Cascalheira, J.F.; Joao, S.S.; Pinhancos, S.S.; Castro, R.; Palmeira, M.; Almeida, S.; Domingues, F.C. Serum homocysteine: Interplay with other circulating and genetic factors in association to Alzheimer’s type dementia. Clin. Biochem. 2009, 42, 783–790. [Google Scholar] [CrossRef] [PubMed]
- Finkelstein, J.D. Methionine metabolism in mammals. J. Nutr. Biochem. 1990, 1, 228–237. [Google Scholar] [CrossRef]
- Selhub, J. Homocysteine metabolism. Annu. Rev. Nutr. 1999, 19, 217–246. [Google Scholar] [CrossRef]
- Castro, R.; Rivera, I.; Blom, H.J.; Jakobs, C.; Tavares de Almeida, I. Homocysteine metabolism, hyperhomocysteinaemia and vascular disease: An overview. J. Inherit. Metab. Dis. 2006, 29, 3–20. [Google Scholar] [CrossRef]
- Esse, R.; Barroso, M.; Tavares de Almeida, I.; Castro, R. The Contribution of Homocysteine Metabolism Disruption to Endothelial Dysfunction: State-of-the-Art. Int. J. Mol. Sci. 2019, 20, 867. [Google Scholar] [CrossRef]
- Handy, D.E.; Castro, R.; Loscalzo, J. Epigenetic modifications: Basic mechanisms and role in cardiovascular disease. Circulation 2011, 123, 2145–2156. [Google Scholar] [CrossRef] [PubMed]
- Regec, A.; Quadros, E.V.; Platica, O.; Rothenberg, S.P. The cloning and characterization of the human transcobalamin II gene. Blood 1995, 85, 2711–2719. [Google Scholar] [PubMed]
- Klee, G.G. Cobalamin and folate evaluation: Measurement of methylmalonic acid and homocysteine vs. vitamin B(12) and folate. Clin Chem. 2000, 46, 1277–1283. [Google Scholar] [PubMed]
- Cacciapuoti, F. Hyper-homocysteinemia: A novel risk factor or a powerful marker for cardiovascular diseases? Pathogenetic and therapeutical uncertainties. J. Thromb. Thrombolysis 2011, 32, 82–88. [Google Scholar] [CrossRef] [PubMed]
- Fowler, B.; Schutgens, R.B.; Rosenblatt, D.S.; Smit, G.P.; Lindemans, J. Folate-responsive homocystinuria and megaloblastic anaemia in a female patient with functional methionine synthase deficiency (cblE disease). J. Inherit. Metab. Dis. 1997, 20, 731–741. [Google Scholar] [CrossRef] [PubMed] [Green Version]
- Castro, R.; Barroso, M.; Rocha, M.; Esse, R.; Ramos, R.; Ravasco, P.; Rivera, I.; de Almeida, I.T. The TCN2 776CNG polymorphism correlates with vitamin B(12) cellular delivery in healthy adult populations. Clin. Biochem. 2010, 43, 645–649. [Google Scholar] [CrossRef] [PubMed]
- Nexo, E.; Hoffmann-Lucke, E. Holotranscobalamin, a marker of vitamin B-12 status: Analytical aspects and clinical utility. Am. J. Clin. Nutr. 2011, 94, 359S–365S. [Google Scholar] [CrossRef] [PubMed]
- Vogiatzoglou, A.; Oulhaj, A.; Smith, A.D.; Nurk, E.; Drevon, C.A.; Ueland, P.M.; Vollset, S.E.; Tell, G.S.; Refsum, H. Determinants of plasma methylmalonic acid in a large population: Implications for assessment of vitamin B12 status. Clin. Chem. 2009, 55, 2198–2206. [Google Scholar] [CrossRef] [PubMed]
- Hannibal, L.; Lysne, V.; Bjorke-Monsen, A.L.; Behringer, S.; Grunert, S.C.; Spiekerkoetter, U.; Jacobsen, D.W.; Blom, H.J. Biomarkers and Algorithms for the Diagnosis of Vitamin B12 Deficiency. Front. Mol. Biosci. 2016, 3, 27. [Google Scholar] [CrossRef]
- Bailey, R.L.; Durazo-Arvizu, R.A.; Carmel, R.; Green, R.; Pfeiffer, C.M.; Sempos, C.T.; Carriquiry, A.; Yetley, E.A. Modeling a methylmalonic acid-derived change point for serum vitamin B-12 for adults in NHANES. Am. J. Clin. Nutr. 2013, 98, 460–467. [Google Scholar] [CrossRef] [PubMed]
- Frosst, P.; Blom, H.J.; Milos, R.; Goyette, P.; Sheppard, C.A.; Matthews, R.G.; Boers, G.J.; den Heijer, M.; Kluijtmans, L.A.; van den Heuvel, L.P.; et al. A candidate genetic risk factor for vascular disease: A common mutation in methylenetetrahydrofolate reductase. Nat. Genet. 1995, 10, 111–113. [Google Scholar] [CrossRef] [PubMed]
- Trinh, B.N.; Ong, C.N.; Coetzee, G.A.; Yu, M.C.; Laird, P.W. Thymidylate synthase: A novel genetic determinant of plasma homocysteine and folate levels. Hum. Genet. 2002, 111, 299–302. [Google Scholar] [CrossRef] [PubMed]
- Dekou, V.; Gudnason, V.; Hawe, E.; Miller, G.J.; Stansbie, D.; Humphries, S.E. Gene-environment and gene-gene interaction in the determination of plasma homocysteine levels in healthy middle-aged men. Thromb. Haemost. 2001, 85, 67–74. [Google Scholar] [CrossRef] [PubMed]
- Kluijtmans, L.A.; van den Heuvel, L.P.; Boers, G.H.; Frosst, P.; Stevens, E.M.; van Oost, B.A.; den Heijer, M.; Trijbels, F.J.; Rozen, R.; Blom, H.J. Molecular genetic analysis in mild hyperhomocysteinemia: A common mutation in the methylenetetrahydrofolate reductase gene is a genetic risk factor for cardiovascular disease. Am. J. Hum. Genet. 1996, 58, 35–41. [Google Scholar] [PubMed]
- Klerk, M.; Verhoef, P.; Clarke, R.; Blom, H.J.; Kok, F.J.; Schouten, E.G.; MTHFR Studies Collaboration Group. MTHFR 677C-->T polymorphism and risk of coronary heart disease: A meta-analysis. JAMA 2002, 288, 2023–2031. [Google Scholar] [CrossRef] [PubMed]
- Chmurzynska, A.; Malinowska, A.M.; Twardowska-Rajewska, J.; Gawecki, J. Elderly women: Homocysteine reduction by short-term folic acid supplementation resulting in increased glucose concentrations and affecting lipid metabolism (C677T MTHFR polymorphism). Nutrition 2013, 29, 841–844. [Google Scholar] [CrossRef] [PubMed]
- Castro, R.; Rivera, I.; Ravasco, P.; Jakobs, C.; Blom, H.J.; Camilo, M.E.; de Almeida, I.T. 5,10-Methylenetetrahydrofolate reductase 677C-->T and 1298A-->C mutations are genetic determinants of elevated homocysteine. QJM 2003, 96, 297–303. [Google Scholar] [CrossRef] [PubMed]
- Ouyang, S.; Li, Y.; Liu, Z.; Chang, H.; Wu, J. Association between MTR A2756G and MTRR A66G polymorphisms and maternal risk for neural tube defects: A meta-analysis. Gene 2013, 515, 308–312. [Google Scholar] [CrossRef]
- Weisberg, I.; Tran, P.; Christensen, B.; Sibani, S.; Rozen, R. A second genetic polymorphism in methylenetetrahydrofolate reductase (MTHFR) associated with decreased enzyme activity. Mol. Genet. Metab. 1998, 64, 169–172. [Google Scholar] [CrossRef]
- Harmon, D.L.; Shields, D.C.; Woodside, J.V.; McMaster, D.; Yarnell, J.W.; Young, I.S.; Peng, K.; Shane, B.; Evans, A.E.; Whitehead, A.S. Methionine synthase D919G polymorphism is a significant but modest determinant of circulating homocysteine concentrations. Genet. Epidemiol. 1999, 17, 298–309. [Google Scholar] [CrossRef]
- Olteanu, H.; Munson, T.; Banerjee, R. Differences in the efficiency of reductive activation of methionine synthase and exogenous electron acceptors between the common polymorphic variants of human methionine synthase reductase. Biochemistry 2002, 41, 13378–13385. [Google Scholar] [CrossRef] [PubMed]
- Afman, L.A.; Lievers, K.J.; van der Put, N.M.; Trijbels, F.J.; Blom, H.J. Single nucleotide polymorphisms in the transcobalamin gene: Relationship with transcobalamin concentrations and risk for neural tube defects. Eur. J. Hum. Genet. 2002, 10, 433–438. [Google Scholar] [CrossRef] [PubMed]
- Lievers, K.J.; Kluijtmans, L.A.; Boers, G.H.; Verhoef, P.; den Heijer, M.; Trijbels, F.J.; Blom, H.J. Influence of a glutamate carboxypeptidase II (GCPII) polymorphism (1561C-->T) on plasma homocysteine, folate and vitamin B(12) levels and its relationship to cardiovascular disease risk. Atherosclerosis 2002, 164, 269–273. [Google Scholar] [CrossRef]
- Yazdanpanah, M.; Chan, P.C.; Evrovski, J.; Romaschin, A.; Cole, D.E. An improved assay for plasma methylmalonic acid using chemical ionization gas chromatography mass spectrometry. Clin. Biochem. 2003, 36, 617–620. [Google Scholar] [CrossRef]
- Brouns, R.; Ursem, N.; Lindemans, J.; Hop, W.; Pluijm, S.; Steegers, E.; Steegers-Theunissen, R. Polymorphisms in genes related to folate and cobalamin metabolism and the associations with complex birth defects. Prenat Diagn. 2008, 28, 485–493. [Google Scholar] [CrossRef] [PubMed]
- Blom, H.J.; Smulders, Y. Overview of homocysteine and folate metabolism. With special references to cardiovascular disease and neural tube defects. J. Inherit. Metab. Dis. 2011, 34, 75–81. [Google Scholar] [CrossRef] [PubMed]
- Doets, E.L.; Ueland, P.M.; Tell, G.S.; Vollset, S.E.; Nygard, O.K.; Van’t Veer, P.; de Groot, L.C.; Nurk, E.; Refsum, H.; Smith, A.D.; et al. Interactions between plasma concentrations of folate and markers of vitamin B(12) status with cognitive performance in elderly people not exposed to folic acid fortification: The Hordaland Health Study. Br. J. Nutr. 2014, 111, 1085–1095. [Google Scholar] [CrossRef] [PubMed]
- Joseph, J.; Handy, D.E.; Loscalzo, J. Quo vadis: Whither homocysteine research? Cardiovasc. Toxicol. 2009, 9, 53–63. [Google Scholar] [CrossRef] [PubMed]
- Novakovic, R.; Cavelaars, A.E.; Bekkering, G.E.; Roman-Vinas, B.; Ngo, J.; Gurinovic, M.; Glibetić, M.; Nikolić, M.; Golesorkhi, M.; Medina, M.W.; et al. Micronutrient intake and status in Central and Eastern Europe compared with other European countries, results from the EURRECA network. Public Health Nutr. 2013, 16, 824–840. [Google Scholar] [CrossRef] [PubMed]
- Strand, T.A.; Taneja, S.; Kumar, T.; Manger, M.S.; Refsum, H.; Yajnik, C.S.; Bhandari, N. Vitamin B-12, folic acid, and growth in 6- to 30-month-old children: A randomized controlled trial. Pediatrics 2015, 135, e918–e926. [Google Scholar] [CrossRef] [PubMed]
- Green, R.; Allen, L.H.; Bjorke-Monsen, A.L.; Brito, A.; Gueant, J.L.; Miller, J.W.; Molloy, A.M.; Nexo, E.; Stabler, S.; Toh, B.H.; et al. Vitamin B12 deficiency. Nat. Rev. Dis. Primers 2017, 3, 17040. [Google Scholar] [CrossRef] [PubMed]
- Hogeveen, M.; van Beynum, I.; van Rooij, A.; Kluijtmans, L.; den Heijer, M.; Blom, H. Methylmalonic acid values in healthy Dutch children. Eur. J. Nutr. 2008, 47, 26–31. [Google Scholar] [CrossRef] [PubMed]
- Iglesia, I.; Doets, E.L.; Bel-Serrat, S.; Roman, B.; Hermoso, M.; Pena Quintana, L.; García-Luzardo, M.R.; Santana-Salguero, B.; García-Santos, Y.; Vucic, V.; et al. Physiological and public health basis for assessing micronutrient requirements in children and adolescents. The EURRECA network. Matern. Child Nutr. 2010, 6, 84–99. [Google Scholar] [CrossRef] [PubMed] [Green Version]
- Mensink, G.B.; Fletcher, R.; Gurinovic, M.; Huybrechts, I.; Lafay, L.; Serra-Majem, L.; Szponar, L.; Tetens, I.; Verkaik-Kloosterman, J.; Baka, A.; et al. Mapping low intake of micronutrients across Europe. Br. J. Nutr. 2013, 110, 755–773. [Google Scholar] [CrossRef] [PubMed] [Green Version]
- Roman Vinas, B.; Ribas Barba, L.; Ngo, J.; Gurinovic, M.; Novakovic, R.; Cavelaars, A.; de Groot, L.C.; van’t Veer, P.; Matthys, C.; Serra Majem, L. Projected prevalence of inadequate nutrient intakes in Europe. Ann. Nutr. Metab. 2011, 59, 84–95. [Google Scholar] [CrossRef] [PubMed]
- De Laet, C.; Wautrecht, J.C.; Brasseur, D.; Dramaix, M.; Boeynaems, J.M.; Decuyper, J.; Kahn, A. Plasma homocysteine concentration in a Belgian school-age population. Am. J. Clin. Nutr. 1999, 69, 968–972. [Google Scholar] [CrossRef] [PubMed]
- Jacques, P.F.; Rosenberg, I.H.; Rogers, G.; Selhub, J.; Bowman, B.A.; Gunter, E.W.; Wright, J.D.; Johnson, C.L. Serum total homocysteine concentrations in adolescent and adult Americans: Results from the third National Health and Nutrition Examination Survey. Am. J. Clin. Nutr. 1999, 69, 482–489. [Google Scholar] [CrossRef] [PubMed]
- Must, A.; Jacques, P.F.; Rogers, G.; Rosenberg, I.H.; Selhub, J. Serum total homocysteine concentrations in children and adolescents: Results from the third National Health and Nutrition Examination Survey (NHANES III). J. Nutr. 2003, 133, 2643–2649. [Google Scholar] [CrossRef] [PubMed]
- van Beynum, I.M.; den Heijer, M.; Thomas, C.M.; Afman, L.; Oppenraay-van Emmerzaal, D.; Blom, H.J. Total homocysteine and its predictors in Dutch children. Am. J. Clin. Nutr. 2005, 81, 1110–1116. [Google Scholar] [CrossRef]
- Ganji, V.; Kafai, M.R. Population Reference Values for Serum Methylmalonic Acid Concentrations and Its Relationship with Age, Sex, Race-Ethnicity, Supplement Use, Kidney Function and Serum Vitamin B12 in the Post-Folic Acid Fortification Period. Nutrients 2018, 10, 74. [Google Scholar] [CrossRef]
- Jimenez, L.; Stamm, D.A.; Depaula, B.; Duggan, C.P. Is Serum Methylmalonic Acid a Reliable Biomarker of Vitamin B12 Status in Children with Short Bowel Syndrome: A Case Series. J. Pediatr. 2018, 192, 259–261. [Google Scholar] [CrossRef] [PubMed]
- Molloy, A.M.; Pangilinan, F.; Mills, J.L.; Shane, B.; O’Neill, M.B.; McGaughey, D.M.; Velkova, A.; Abaan, H.O.; Ueland, P.M.; McNulty, H.; et al. A Common Polymorphism in HIBCH Influences Methylmalonic Acid Concentrations in Blood Independently of Cobalamin. Am. J. Hum. Genet. 2016, 98, 869–882. [Google Scholar] [CrossRef] [PubMed] [Green Version]
- Candito, M.; Rivet, R.; Herbeth, B.; Boisson, C.; Rudigoz, R.C.; Luton, D.; Journel, H.; Oury, J.F.; Roux, F.; Saura, R.; et al. Nutritional and genetic determinants of vitamin B and homocysteine metabolisms in neural tube defects: A multicenter case-control study. Am. J. Med. Genet. A 2008, 146A, 1128–1133. [Google Scholar] [CrossRef]
- Freitas, A.I.; Mendonca, I.; Guerra, G.; Brion, M.; Reis, R.P.; Carracedo, A.; Brehm, A. Methylenetetrahydrofolate reductase gene, homocysteine and coronary artery disease: The A1298C polymorphism does matter. Inferences from a case study (Madeira, Portugal). Thromb. Res. 2008, 122, 648–656. [Google Scholar] [CrossRef] [PubMed]
- Kluijtmans, L.A.; Young, I.S.; Boreham, C.A.; Murray, L.; McMaster, D.; McNulty, H.; Strain, J.J.; McPartlin, J.; Scott, J.M.; Whitehead, A.S. Genetic and nutritional factors contributing to hyperhomocysteinemia in young adults. Blood 2003, 101, 2483–2488. [Google Scholar] [CrossRef] [PubMed] [Green Version]
- Wilcken, B.; Bamforth, F.; Li, Z.; Zhu, H.; Ritvanen, A.; Renlund, M.; Stoll, C.; Alembik, Y.; Dott, B.; Czeizel, A.E.; et al. Geographical and ethnic variation of the 677C>T allele of 5,10 methylenetetrahydrofolate reductase (MTHFR): Findings from over 7000 newborns from 16 areas world wide. J. Med. Genet. 2003, 40, 619–625. [Google Scholar] [CrossRef] [PubMed]
- Gaughan, D.J.; Kluijtmans, L.A.; Barbaux, S.; McMaster, D.; Young, I.S.; Yarnell, J.W.; Evans, A.; Whitehead, A.S. The methionine synthase reductase (MTRR) A66G polymorphism is a novel genetic determinant of plasma homocysteine concentrations. Atherosclerosis 2001, 157, 451–456. [Google Scholar] [CrossRef]


| Males | Females | p ϕ | p Ψ | |||||||||
|---|---|---|---|---|---|---|---|---|---|---|---|---|
| N | 9-Year-Old | N | 17-Year-Old | p1 | N | 9-Years-Old | N | 17-Year-Old | p2 | |||
| tHcy (µM) | 107 | 3.8 ± 1.8 | 52 | 10.2 ± 4.0 | <0.001 | 88 | 3.8 ± 1.9 | 67 | 7.5 ± 2.2 | <0.001 | 0.811 | <0.001 |
| Folates (nM) | 96 | 22.9 ± 9.1 | 39 | 11.1 ± 3.5 | <0.001 | 80 | 22.8 ± 9.5 | 37 | 12.2 ± 4.7 | <0.001 | 0.969 | 0.229 |
| tCbl (pM) | 104 | 502.1 ± 163.1 | 35 | 286.5 ± 97.2 | <0.001 | 83 | 530.6 ± 168.2 | 36 | 318.0 ± 135.3 | <0.001 | 0.243 | 0.265 |
| Holo-TC (pM) | 99 | 103.2 ± 28.5 | 38 | 69.9 ± 25 | <0.001 | 80 | 97.4 ± 35.1 | 37 | 62.4 ± 24.8 | <0.001 | 0.226 | 0.196 |
| MMA (µM) | 99 | 0.30 ± 0.31 | 48 | 0.21 ± 0.14 | 0.082 | 85 | 0.25 ± 0.19 | 62 | 0.18 ± 0.16 | <0.001 | 0.211 | 0.087 |
| SNP | Genotype | Allele Frequency (%) | |||
|---|---|---|---|---|---|
| MTHFR | CC | CT | TT | C | T |
| C677T (n = 565) | 295 (52.2%) | 218 (38.6%) | 52 (9.2%) | 71.5 | 28.5 |
| MTHFR | AA | AC | CC | A | C |
| A1298C (n = 565) | 301 (53.3%) | 196 (34.7%) | 68 (12.0%) | 70.6 | 29.4 |
| TCNII | AA | AG | GG | A | G |
| A67G (n = 301) | 252 (83.7%) | 43 (14.3%) | 6 (2%) | 90.9 | 9.1 |
| TCNII | CC | CG | GG | C | G |
| C776G (n = 292) | 83 (28.4%) | 141 (48.3%) | 68 (23.3%) | 52.6 | 47.4 |
| MTR | AA | AG | GG | A | G |
| A2756G (n = 218) | 128 (58.7%) | 82 (37.6%) | 8 (3.7%) | 77.5 | 22.5 |
| MTRR | AA | AG | GG | A | G |
| A66G (n = 246) | 75 (30.5%) | 114 (46.3%) | 57 (23.2%) | 53.7 | 46.3 |
| 9-Year-Old | |||||
|---|---|---|---|---|---|
| SNP | tHcy (µmol/L) | Folate (nmol/L) | Holo-TC (pmol/L) | tCbl (pmol/L) | MMA (µmol/L) |
| MTHFRC677T | |||||
| CC | 3.7 ± 1.9 (n = 115) | 23.1 ± 9.0 (n = 109) | 101.8 ± 30.2 (n = 108) | 502.2 ± 156.3 (n = 110) | 0.274 ± 0.300 (n = 107) |
| CT | 3.7 ± 1.7 (n = 65) | 23.4 ± 9.7 (n = 60) | 100.0 ± 33.7 (n = 59) | 527.6 ± 178.6 (n = 63) | 0.270 ± 0.198 (n = 62) |
| TT | 4.5 ± 1.8 (n = 15) | 17.4 ± 7.1 (n = 14) | 92.7 ± 35.41 (n = 12) | 555.3 ± 176.2 (n = 14) | 0.295 ± 0.210 (n = 15) |
| MTHFRA1298C | |||||
| AA | 3.7 ± 1.8 (n = 101) | 23.4 ± 10.1 (n = 97) | 101.3 ± 33.7 (n = 93) | 511.1 ± 157.8 (n = 98) | 0.284 ± 0.252 (n = 97) |
| AC | 3.8 ± 1.8 (n = 59) | 22.1 ± 8.4 (n = 52) | 98.2 ± 27.2 (n = 53) | 544.5 ± 186.9 (n = 57) | 0.225 ± 0.599 (n = 56) |
| CC | 3.8 ± 2.0 (n = 35) | 22.1 ± 7.8 (n = 34) | 102.6 ± 33.0 (n = 33) | 472.9 ± 141.2 (n = 32) | 0.334 ± 0.448 (n = 31) |
| TCN2A67G | |||||
| AA | 3.9 ± 1.8 (n = 146) | 22.8 ± 9.5 (n = 137) | 101.2 ± 29.9 (n = 117) | 523.0 ± 168.2 (n = 127) | 0.277 ± 0.238 (n = 139) |
| AG | 3.2 ± 2.0 (n = 37) | 22.1 ± 7.9 (n = 35) | 92.1 ± 26.4 (n = 33) | 489.8 ± 178.8 (n = 35) | 0.221 ± 0.054 (n = 35) |
| GG | 3.7 ± 2.4 (n = 5) | 26.1 ± 8.3 (n = 5) | 87.9 ± 40.6 (n = 3) | 561.2 ± 100.3 (n = 3) | 0.153 ± 0.043 (n = 4) |
| TCN2C776G | |||||
| CC | 4.0 ± 1.8 (n = 59) | 22.5 ± 8.7 (n = 54) | 96.8 ± 29.2 (n = 48) | 496.8 ± 171.8 (n = 56) | 0.241 ± 0.063 (n = 55) |
| CG | 3.6 ± 1.9 (n = 74) | 21.5 ± 9.4 (n = 70) | 101.2 ± 29.8 (n = 64) | 525.1 ± 160.7 (n = 69) | 0.281 ± 0.306 (n = 70) |
| GG | 3.8 ± 2.0 (n = 42) | 23.8 ± 8.9 (n = 40) | 98.0 ± 29.7 (n = 61) | 529. 8 ± 182.1 (n = 40) | 0.287 ± 0.267 (n = 40) |
| MTRA2756G | |||||
| AA | 3.9 ± 1.5 (n = 70) | 23.8 ± 10.2 (n = 64) | 102.2 ± 25.4 (n = 63) | 538.9 ± 188.8 (n = 68) | 0.251 ± 0.084 (n = 67) |
| AG | 3.7 ± 1.7 (n = 44) | 23.6 ± 9.4 (n = 43) | 99.0 ± 33.7 (n = 44) | 531.0 ± 152.8 (n = 39) | 0.325 ± 0.403 (n = 42) |
| GG | 4.8 ± 3.3 (n = 2) | 21.7 ± 7.6 (n = 2) | 87.4 ± 28.2 (n = 2) | 467.7 ± 33.4 (n = 2) | 0.234 ± 0.044 (n = 2) |
| MTRRA66G | |||||
| AA | 3.9 ± 1.8 (n = 36) | 24.8 ± 9.8 (n = 33) | 109.0 ± 32.0 (n = 35) | 530.8 ± 180.8 (n = 34) | 0.257 ± 0.159 (n = 35) |
| AG | 3.8 ± 1.6 (n = 60) | 21.8 ± 9.1 (n = 55) | 100.4 ± 34.7 (n = 55) | 537.0 ± 165.7 (n = 56) | 0.262 ± 0.242 (n = 56) |
| GG | 4.0 ± 1.8 (n = 30) | 22.9 ± 9.1 (n = 27) | 100.4 ± 25.8 (n = 26) | 513.8 ± 183.8 (n = 28) | 0.354 ± 0.461 (n = 29) |
| 17-Year-Old | |||||
|---|---|---|---|---|---|
| SNP | tHcy (µmol/L) | Folate (nmol/L) | Holo-TC (pmol/L) | tCbl (pmol/L) | MMA (µmol/L) |
| MTHFR C677T | |||||
| CC | 8.4± 2.4 (n = 62)* | 11.9 ± 3.4 (n = 34) | 71.9 ± 26.3 (n = 33) | 307.6 ± 114.2 (n = 32) | 0.170 ± 0.101 (n = 55) |
| CT | 8.8± 3.9 (n = 48)* | 11.8 ± 5.1 (n = 34) | 63.8 ± 24.3 (n = 34) | 305.4 ± 124.2 (n = 32) | 0.175 ± 0.092 (n = 39) |
| TT | 11.3 ± 5.0 (n = 12)* | 9.0 ± 9.2 (n = 7) | 51.4 ± 19.1 (n = 7) | 250.6 ± 124.4 (n = 6) | 0.252 ± 0.161 (n = 10) |
| MTHFR A1298C | |||||
| AA | 9.4 ± 3.0 (n = 58) | 11.6 ± 4.3 (n = 35) | 69.5 ± 27.9 (n = 35) | 320.4 ± 131.6 (n = 33) | 0.190 ± 0.114 (n = 47) |
| AC | 8.5 ± 4.0 (n = 46) | 11.2 ± 3.7 (n = 25) | 63.2 ± 19.1 (n = 25) | 292.0 ± 100.7 (n = 23) | 0.162 ± 0.067 (n = 41) |
| CC | 7.9 ± 3.1 (n = 18) | 12.2 ± 4.9 (n = 15) | 63.7 ± 28.5 (n = 14) | 273.5 ± 115.9 (n = 14) | 0.197 ± 0.155 (n = 16) |
| TCN2 A67G | |||||
| AA | 8.7 ± 3.5 (n = 105) | 12.0 ± 4.4 (n = 62) | 66.2 ± 25.5 (n = 61) | 298.8 ± 119.6 (n = 58) | 0.183 ± 0.113 (n = 90) |
| AG | 10.3 ± 2.5 (n = 6) | 9.6 ± 2.6 (n = 4) | 68.1 ± 30.1 (n = 4) | 286.1 ± 71.5 (n = 4) | 0.146 ± 0.010 (n = 5) |
| GG | (n = 1) | - | - | - | (n = 1) |
| TCN2 C776G | |||||
| CC | 8.9 ± 2.4 (n = 24) | 9.6 ± 4.5 (n = 13) | 73.2 ± 28.8 (n = 13) | 292.0 ± 107.8 (n = 13) | 0.154 ± 0.073 (n = 21) |
| CG | 8.8 ± 3.2 (n = 66) | 12.5 ± 4.5 (n = 44) | 65.8 ± 25.1 (n = 44) | 314.5 ± 125.2 (n = 41) | 0.194 ± 0.128 (n = 55) |
| GG | 8.9 ± 5.0 (n = 26) | 10.4 ± 3.5 (n = 14) | 63.7 ± 24.5 (n = 13) | 279.8 ± 131.0 (n = 12) | 0.175 ± 0.074 (n = 23) |
| MTR A2756G | |||||
| AA | 8.6 ± 2.4 (n = 57) | 11.9 ± 4.5 (n = 35) | 68.7 ± 28.8 (n = 34) | 333.0 ± 126.3 (n = 31)* | 0.188 ± 0.124 (n = 50) |
| AG | 8.6 ± 2.7 (n = 38) | 11.6 ± 4.2 (n = 22) | 67.1 ± 20.8 (n = 22) | 283.1 ± 96.9 (n = 22)* | 0.165 ± 0.062 (n = 31) |
| GG | 10.1 ± 7.3 (n = 6) | 10.5 ± 3.0 (n = 5) | 61.1 ± 31.8 (n = 5) | 200.2 ± 112.3 (n = 5)* | 0.230 ± 0.193 (n = 6) |
| MTRR A66G | |||||
| AA | 8.8 ± 3.8 (n = 38) | 11.3 ± 3.9 (n = 24) | 64.3 ± 27.8 (n = 24) | 337.4 ± 138.6 (n = 22) | 0.193 ± 0.141 (n = 33) |
| AG | 8.6 ± 2.5 (n = 54) | 12.0 ± 4.7 (n = 33) | 68.9 ± 27.5 (n = 32) | 282.8 ± 110.2 (n = 31) | 0.178 ± 0.076 (n = 48) |
| GG | 8.8 ± 2.4 (n = 27) | 11.4 ± 3.8 (n = 16) | 65.6 ± 17.3 (n = 16) | 297.4 ± 106.2 (n = 15) | 0.165 ± 0.107 (n = 22) |
© 2019 by the authors. Licensee MDPI, Basel, Switzerland. This article is an open access article distributed under the terms and conditions of the Creative Commons Attribution (CC BY) license (http://creativecommons.org/licenses/by/4.0/).
Share and Cite
Caldeira-Araújo, H.; Ramos, R.; Florindo, C.; Rivera, I.; Castro, R.; Tavares de Almeida, I. Homocysteine Metabolism in Children and Adolescents: Influence of Age on Plasma Biomarkers and Correspondent Genotype Interactions. Nutrients 2019, 11, 646. https://doi.org/10.3390/nu11030646
Caldeira-Araújo H, Ramos R, Florindo C, Rivera I, Castro R, Tavares de Almeida I. Homocysteine Metabolism in Children and Adolescents: Influence of Age on Plasma Biomarkers and Correspondent Genotype Interactions. Nutrients. 2019; 11(3):646. https://doi.org/10.3390/nu11030646
Chicago/Turabian StyleCaldeira-Araújo, Helena, Ruben Ramos, Cristina Florindo, Isabel Rivera, Rita Castro, and Isabel Tavares de Almeida. 2019. "Homocysteine Metabolism in Children and Adolescents: Influence of Age on Plasma Biomarkers and Correspondent Genotype Interactions" Nutrients 11, no. 3: 646. https://doi.org/10.3390/nu11030646