Theoretical Food and Nutrient Composition of Whole-Food Plant-Based and Vegan Diets Compared to Current Dietary Recommendations

 , , , ,
Abstract
:1. Introduction
2. Materials and Methods
2.1. Sources of Frequently Consumed Foods
2.2. Selection of Recipes and Meal Plans
2.3. Comparison of Mean Food and Nutrient Data
3. Results
4. Discussion
5. Conclusions
Supplementary Materials
Author Contributions
Funding
Acknowledgments
Conflicts of Interest
References
- Campbell, T.C.; Campbell, T.M., II. The China Study: Revised and Expanded Edition: The Most Comprehensive Study of Nutrition Ever Conducted and the Startling Implications for Diet, Weight Loss, and Long-Term Health; BenBella Books, Inc.: Dallas, TX, USA, 2016. [Google Scholar]
- McDougall, J. Dr. McDougall’s Health and Wellness Center. Available online: https://www.drmcdougall.com/ (accessed on 24 February 2019).
- Campbell, T.C.; Esselstyn, C.B. Forks over Knives: The Plant-Based Way to Health; The Experiment: New York, NY, USA, 2011. [Google Scholar]
- Greger, M. NutritionFacts.org. Available online: https://nutritionfacts.org/ (accessed on 20 February 2019).
- Physicians Committee for Responsible Medicine. Available online: http://www.pcrm.org/ (accessed on 24 February 2019).
- Esselstyn, C.B. Prevent and Reverse Heart Disease: The Revolutionary, Scientifically Proven, Nutrition-Based Cure; Penguin: New York, NY, USA, 2008. [Google Scholar]
- How Many Adults in the US are Vegetarian and Vegan? Available online: http://www.vrg.org/nutshell/Polls/2016_adults_veg.htm (accessed on 30 July 2018).
- Conrad, Z.; Karlsen, M.; Chui, K.; Jahns, L. Diet quality on meatless days: National Health and Nutrition Examination Survey (NHANES), 2007–2012. Public Health Nutr. 2017. [Google Scholar] [CrossRef] [PubMed]
- Macknin, M.; Kong, T.; Weier, A.; Worley, S.; Tang, A.S.; Alkhouri, N.; Golubic, M. Plant-Based, No-Added-Fat or American Heart Association Diets: Impact on Cardiovascular Risk in Obese Children with Hypercholesterolemia and Their Parents. J. Pediatr. 2015, 166, 953–959.e953. [Google Scholar] [CrossRef]
- Patrick-Goudreau, C. The Joy of Vegan Baking: The Compassionate Cooks’ Traditional Treats and Sinful Sweets; Fair Winds Press: Beverly, MA, USA, 2007. [Google Scholar]
- Baroni, L.; Goggi, S.; Battaglino, R.; Berveglieri, M.; Fasan, I.; Filippin, D.; Griffith, P.; Rizzo, G.; Tomasini, C.; Tosatti, M.A.; et al. Vegan Nutrition for Mothers and Children: Practical Tools for Healthcare Providers. Nutrients 2018, 11, 5. [Google Scholar] [CrossRef] [PubMed]
- Baroni, L.; Goggi, S.; Battino, M. Planning Well-Balanced Vegetarian Diets in Infants, Children, and Adolescents: The VegPlate Junior. J. Acad. Nutr. Diet. 2018. [Google Scholar] [CrossRef] [PubMed]
- Melina, V.; Craig, W.; Levin, S. Position of the Academy of Nutrition and Dietetics: Vegetarian Diets. J. Acad. Nutr. Diet. 2016, 116, 1970–1980. [Google Scholar] [CrossRef]
- Baroni, L.; Goggi, S.; Battino, M. VegPlate: A Mediterranean-Based Food Guide for Italian Adult, Pregnant, and Lactating Vegetarians. J. Acad. Nutr. Diet. 2018, 118, 2235–2243. [Google Scholar] [CrossRef] [PubMed]
- Menal-Puey, S.; Marques-Lopes, I. Development of a Food Guide for the Vegetarians of Spain. J. Acad. Nutr. Diet. 2017, 117, 1509–1516. [Google Scholar] [CrossRef]
- Agnoli, C.; Baroni, L.; Bertini, I.; Ciappellano, S.; Fabbri, A.; Papa, M.; Pellegrini, N.; Sbarbati, R.; Scarino, M.L.; Siani, V.; et al. Position paper on vegetarian diets from the working group of the Italian Society of Human Nutrition. Nutr. Metab. Cardiovasc. Dis. 2017, 27, 1037–1052. [Google Scholar] [CrossRef]
- Martinez Steele, E.; Baraldi, L.G.; Louzada, M.L.; Moubarac, J.C.; Mozaffarian, D.; Monteiro, C.A. Ultra-processed foods and added sugars in the US diet: Evidence from a nationally representative cross-sectional study. BMJ Open 2016, 6, e009892. [Google Scholar] [CrossRef] [PubMed]
- Engel, M.G.; Kern, H.J.; Brenna, J.T.; Mitmesser, S.H. Micronutrient Gaps in Three Commercial Weight-Loss Diet Plans. Nutrients 2018, 10, 108. [Google Scholar] [CrossRef]
- Rizzo, N.S.; Jaceldo-Siegl, K.; Sabate, J.; Fraser, G.E. Nutrient profiles of vegetarian and nonvegetarian dietary patterns. J. Acad. Nutr. Diet. 2013, 113, 1610–1619. [Google Scholar] [CrossRef] [PubMed]
- Schwarz, J.; Dschietzig, T.; Schwarz, J.; Dura, A.; Nelle, E.; Watanabe, F.; Wintgens, K.F.; Reich, M.; Armbruster, F.P. The influence of a whole food vegan diet with Nori algae and wild mushrooms on selected blood parameters. Clin. Lab. 2014, 60, 2039–2050. [Google Scholar] [CrossRef] [PubMed]
- Zava, T.T.; Zava, D.T. Assessment of Japanese iodine intake based on seaweed consumption in Japan: A literature-based analysis. Thyroid Res. 2011, 4, 14. [Google Scholar] [CrossRef] [PubMed]
- Leung, A.M.; Lamar, A.; He, X.; Braverman, L.E.; Pearce, E.N. Iodine status and thyroid function of Boston-area vegetarians and vegans. J. Clin. Endocrinol. Metab. 2011, 96, E1303–E1307. [Google Scholar] [CrossRef] [PubMed]
- Calton, J.B. Prevalence of micronutrient deficiency in popular diet plans. J. Int. Soc. Sports Nutr. 2010, 7, 24. [Google Scholar] [CrossRef] [Green Version]
- Ma, Y.; Pagoto, S.L.; Griffith, J.A.; Merriam, P.A.; Ockene, I.S.; Hafner, A.R.; Olendzki, B.C. A dietary quality comparison of popular weight-loss plans. J. Am. Diet. Assoc. 2007, 107, 1786–1791. [Google Scholar] [CrossRef] [PubMed]
- Karlsen, M.C.; Lichtenstein, A.H.; Economos, C.D.; Folta, S.C.; Rogers, G.; Jacques, P.F.; Livingston, K.A.; Rancaño, K.M.; McKeown, N.M. Web-Based Recruitment and Survey Methodology to Capture Followers of Popular Diets: The Adhering to Dietary Approaches for Personal Taste (ADAPT) Feasibility Survey. Curr. Dev. Nutr. 2018, in press. [Google Scholar] [CrossRef]
- United States Department of Agriculture. Sample Two-Week Menus. Available online: https://www.choosemyplate.gov/budget-sample-two-week-menus (accessed on 24 February 2019).
- United States Department of Agriculture. Sample Menus for a 2000 Calorie Food Pattern. Available online: https://archive.org/details/CAT31303185 (accessed on 24 February 2019).
- Schakel, S.F. Maintaining a nutrient Database in a Changing Marketplace: Keeping Pace with Changing Food Products—A Research Perspective; Elsevier: Amsterdam, The Netherlands, 2001. [Google Scholar]
- US Department of Health and Human Services. 2015–2020 Dietary Guidelines for Americans; USDA: Washington, DC, USA, 2015.
- Dietary Reference Intakes (DRIs): Summary Tables; Food and Nutrition Board, Institute of Medicine, National Academies: Washington, DC, USA, 2011.
- Dietary Guidelines Advisory Committee. Scientific Report of the 2015 Dietary Guidelines Advisory Committee: Advisory Report to the Secretary of Health and Human Services and the Secretary of Agriculture; U.S. Department of Agriculture, Agricultural Research Service: Washington, DC, USA, 2015.
- HEI-2010 Total and Component Scores for Children, Adults, and Older Adults During 2011–2012 Prevention; U.S. Department of Agriculture: Alexandria, VA, USA, 2011.
- Drewnowski, A.; Rehm, C.D. Consumption of added sugars among US children and adults by food purchase location and food source. Am. J. Clin. Nutr. 2014, 100, 901–907. [Google Scholar] [CrossRef]
- What We Eat in America, NHANES 2013–2014, Individuals 2 Years and over (Excluding Breast-Fed Children), Day 1. Available online: www.ars.usda.gov/nea/bhnrc/fsrg (accessed on 13 March 2019).
- Johnson, R.K.; Appel, L.J.; Brands, M.; Howard, B.V.; Lefevre, M.; Lustig, R.H.; Sacks, F.; Steffen, L.M.; Wylie-Rosett, J. Dietary sugars intake and cardiovascular health: A scientific statement from the American Heart Association. Circulation 2009, 120, 1011–1020. [Google Scholar] [CrossRef]
- Sacks, F.M.; Lichtenstein, A.H.; Wu, J.H.; Appel, L.J.; Creager, M.A.; Kris-Etherton, P.M.; Miller, M.; Rimm, E.B.; Rudel, L.L.; Robinson, J.G. Dietary fats and cardiovascular disease: A presidential advisory from the American Heart Association. Circulation 2017, 136, e1–e23. [Google Scholar] [CrossRef]
- Eckel, R.H.; Jakicic, J.M.; Ard, J.D.; de Jesus, J.M.; Houston Miller, N.; Hubbard, V.S.; Lee, I.M.; Lichtenstein, A.H.; Loria, C.M.; Millen, B.E.; et al. 2013 AHA/ACC guideline on lifestyle management to reduce cardiovascular risk: A report of the American College of Cardiology/American Heart Association Task Force on Practice Guidelines. J. Am. Coll. Cardiol. 2014, 63, 2960–2984. [Google Scholar] [CrossRef]
- What We Eat in America, NHANES 2007–2010, Individuals 1 Year and Over (Excluding Breast-Fed Children and Pregnant or lactating Females), Dietary Intake Data; Food Surveys Research Group, Beltsville Human Nutrition Research Center, Agricultural Research Service, U.S. Department of Agriculture: Beltsville, MD, USA, 2010.
- Kantor, E.D.; Rehm, C.D.; Du, M.; White, E.; Giovannucci, E.L. Trends in Dietary Supplement Use Among US Adults From 1999–2012. JAMA 2016, 316, 1464–1474. [Google Scholar] [CrossRef] [PubMed]
- Del Valle, H.B.; Yaktine, A.L.; Taylor, C.L.; Ross, A.C. Dietary Reference Intakes for Calcium And Vitamin D; National Academies Press: Washington, DC, USA, 2011. [Google Scholar]
- United States Department of Agriculture: Agricultural Research Service. National Nutrient Database for Standard Reference; Release 27; United States Department of Agriculture: Agricultural Research Service: Beltsville, MD, USA, 2014.
- Devries, S.; Dalen, J.E.; Eisenberg, D.M.; Maizes, V.; Ornish, D.; Prasad, A.; Sierpina, V.; Weil, A.T.; Willett, W. A deficiency of nutrition education in medical training. Am. J. Med. 2014, 127, 804–806. [Google Scholar] [CrossRef] [PubMed]
- Stote, K.S.; Radecki, S.V.; Moshfegh, A.J.; Ingwersen, L.A.; Baer, D.J. The number of 24 h dietary recalls using the US Department of Agriculture’s automated multiple-pass method required to estimate nutrient intake in overweight and obese adults. Public Health Nutr. 2011, 14, 1736–1742. [Google Scholar] [CrossRef] [PubMed]
- Mathieu, S.; Dorard, G. Vegetarianism and veganism lifestyle: Motivation and psychological dimensions associated with selective diet. Presse Med. 2016, 45, 726–733. [Google Scholar] [CrossRef] [PubMed]


| MyPlate | WFPB | % diff. versus MP 3 | |||
|---|---|---|---|---|---|
| Food Group Servings | Mean | SD | Mean | SD | |
| Total vegetables (cup) | 2.5 | 0.9 | 7.0 | 2.8 | +180 |
| Green leafy vegetables (cup) | 0.8 | 0.7 | 2.7 | 1.9 | +238 |
| Legumes (cup) | 0.5 | 0.6 | 2.8 | 1.4 | +460 |
| Whole fruits (cup) | 1.1 | 0.6 | 2.2 | 1.1 | +100 |
| Whole grains (oz) | 3.4 | 1.4 | 7.9 | 2.3 | +132 |
| Refined grains (oz) | 3.4 | 1.6 | 0.9 | 1.2 | −74 |
| Nuts and seeds (oz) | 0.3 | 0.5 | 0.9 | 0.9 | +200 |
| Nut and seed butters (oz) | 0.5 | 0.8 | 0.4 | 0.8 | −20 |
| Dairy (cups) | 3.1 | 0.5 | 0.3 | 0.4 | −90 |
| Eggs (oz) | 0.7 | 0.7 | 0.0 | 0.0 | −100 |
| Poultry (oz) | 0.4 | 1.2 | 0.0 | 0.0 | −100 |
| Seafood (oz) | 1.2 | 1.6 | 0.0 | 0.0 | −100 |
| Red meat (oz) | 1.2 | 1.4 | 0.0 | 0.0 | −100 |
| Meat alternatives (oz) | 0.4 | 1.1 | 2.9 | 4.7 | +625 |
| HEI-2015 Score | 100 | -- | 88 | -- | −12 |
| MyPlate | WFPB | % diff versus MP 3 | |||
|---|---|---|---|---|---|
| Mean | SD | Mean | SD | ||
| Energy (kcal) | 2000 | -- | 2000 | -- | -- |
| Fat (g) | 64 | 11 | 38 | 13 | −41 |
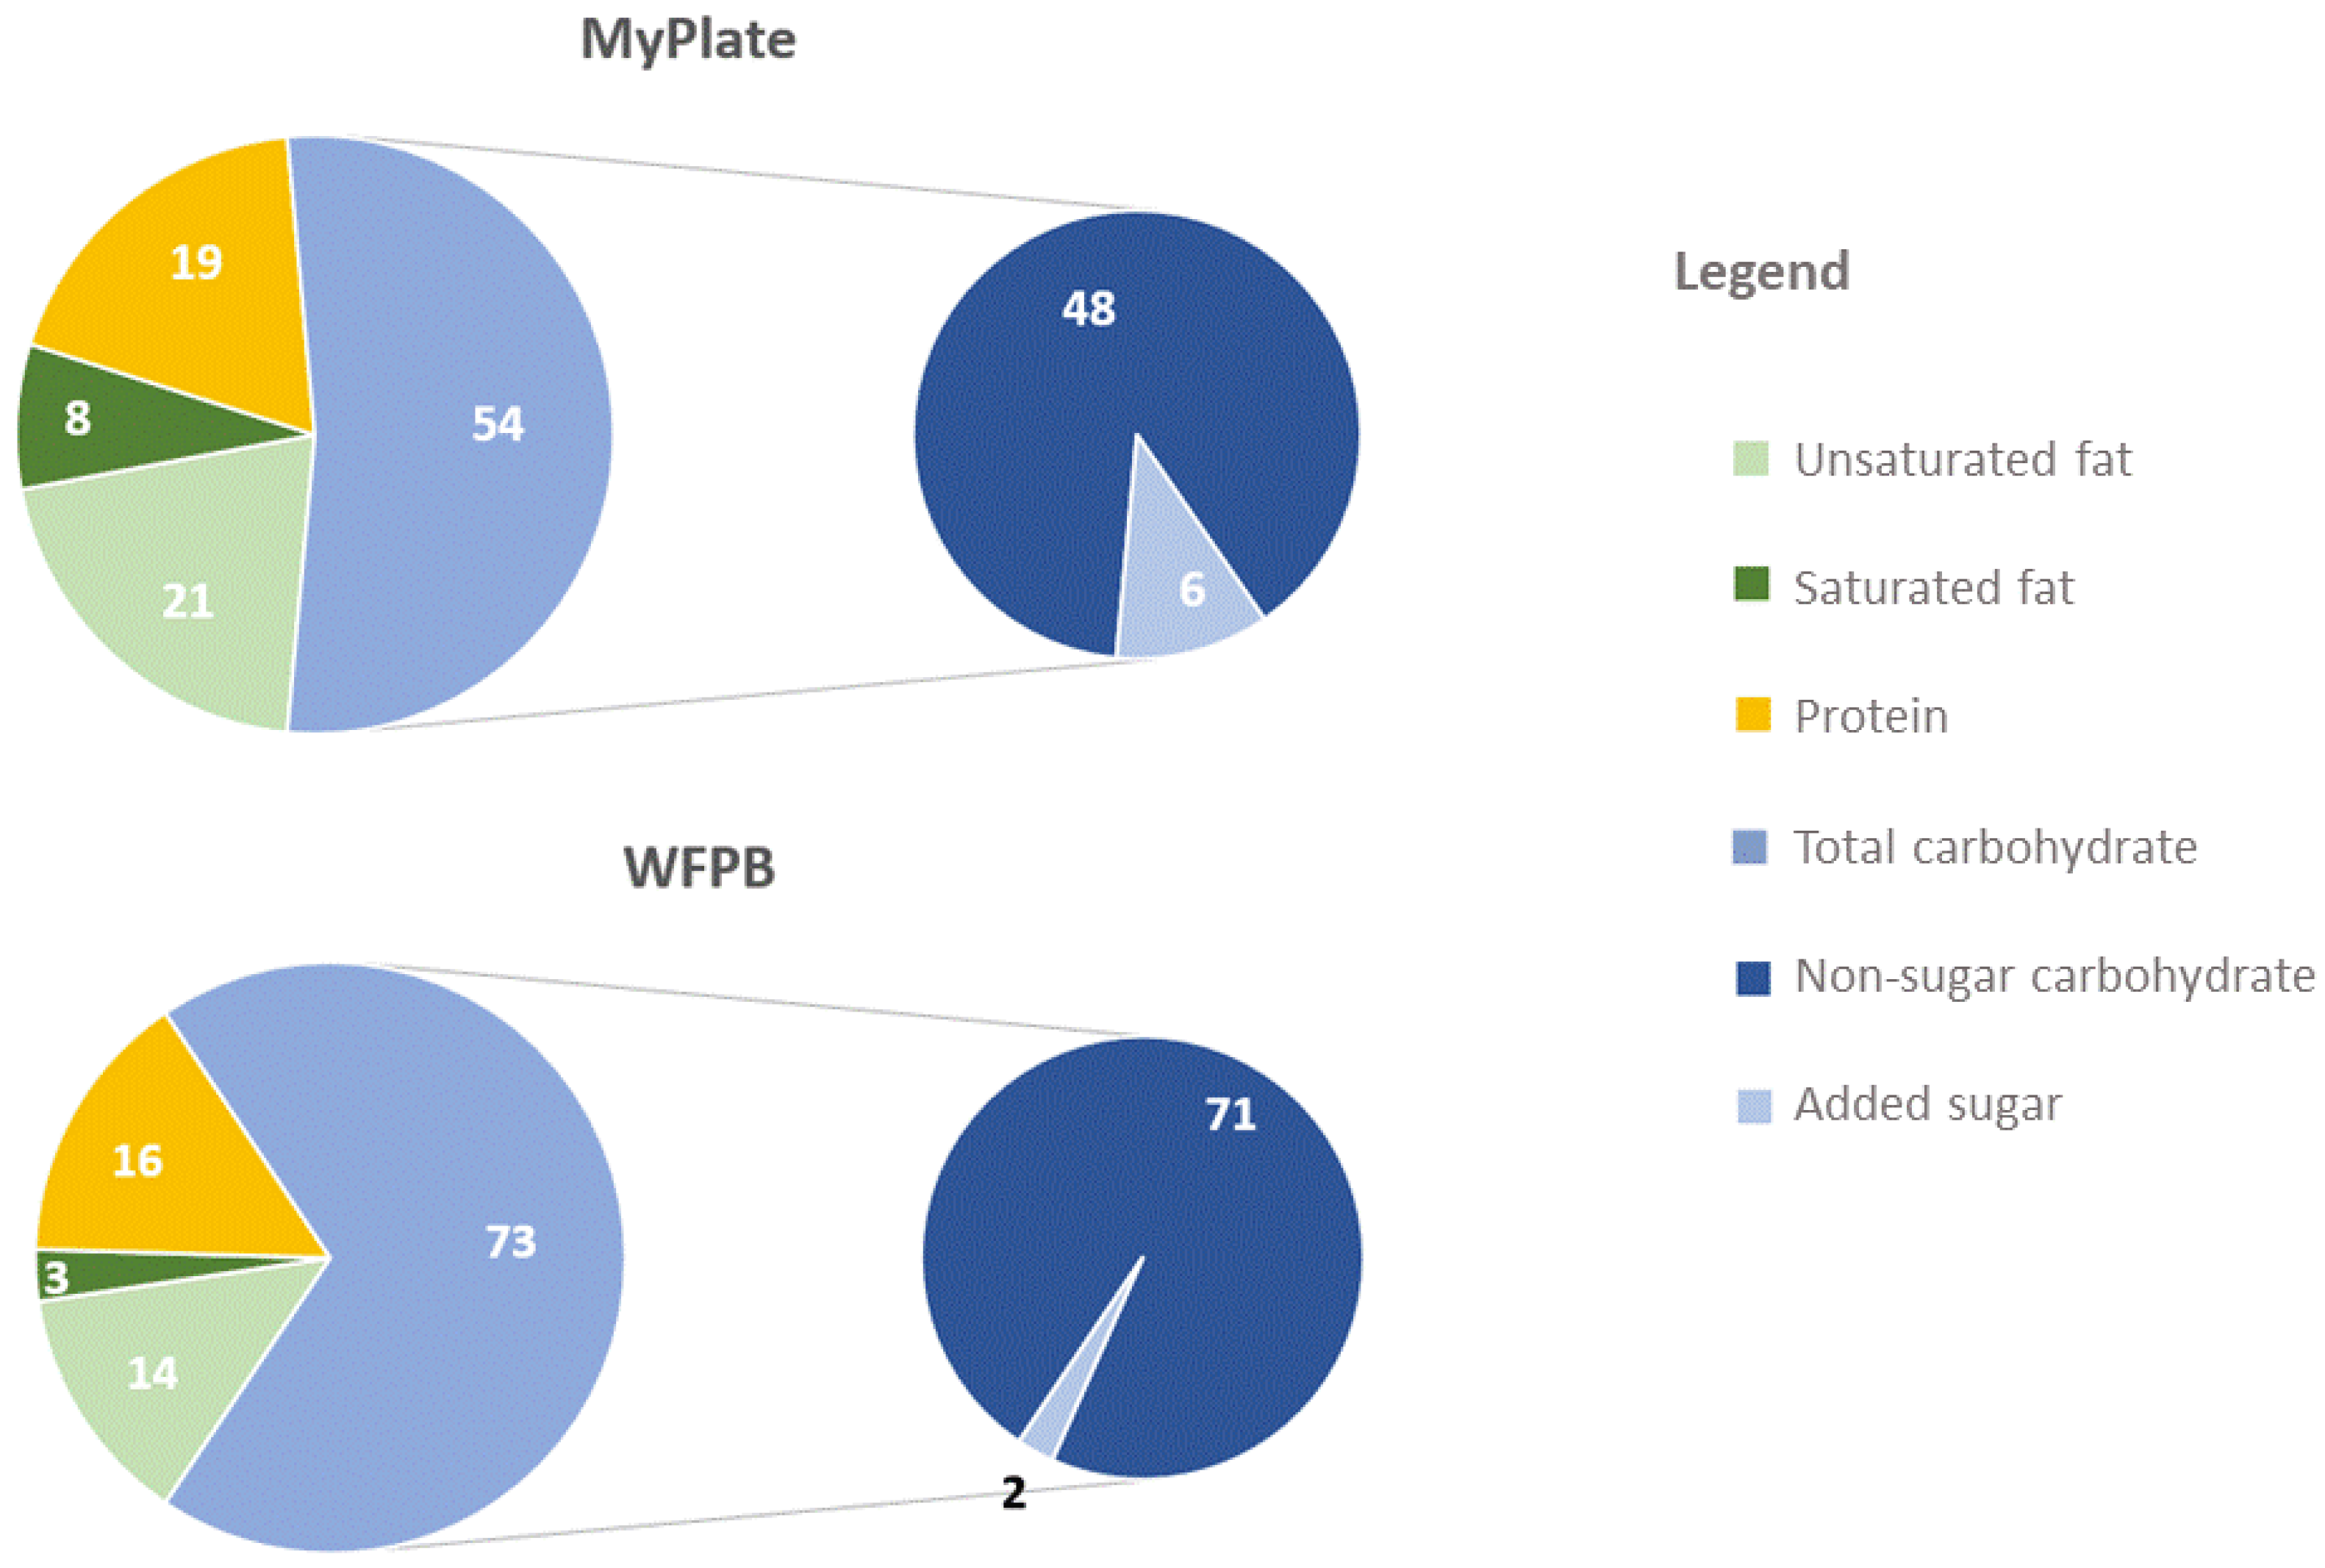
| Total fat (% energy) | 29 | 5 | 17 | 6 | −41 |
| Saturated fat (% energy) | 8 | 2 | 3 | 1 | −66 |
| MUFA (% energy) | 11 | 2 | 6 | 3 | −46 |
| PUFA (% energy) | 8 | 2 | 6 | 2 | −21 |
| Unsat:sat fat ratio | 3 | 1 | 5 | 1 | +88 |
| CHO (g) | 272 | 29 | 365 | 34 | +34 |
| CHO (% energy) | 54 | 6 | 73 | 7 | +34 |
| Added sugars (g) | 26 | 15 | 9 | 10 | −64 |
| Added sugars (% energy) | 6 | 3 | 2 | 2 | −65 |
| Protein (g) | 96 | 11 | 81 | 12 | −15 |
| Protein (% energy) | 19 | 2 | 16 | 2 | −15 |
| Animal protein (% energy) | 12 | 2 | 0 | 0 | −100 |
| Plant protein (% energy) | 7 | 1 | 16 | 2 | +127 |
| Fiber (g) | 28 | 5 | 70 | 9 | +146 |
| Micronutrients | |||||
| Dietary vitamin A activity (RAE, µg) | 1344 | 703 | 1824 | 1042 | +36 |
| Total vitamin D 4 (calciferol, µg) | 10 | 5 | 25 | 15 | +141 |
| Dietary vitamin D 5 (calciferol, µg) | 10 | 5 | 1 | 1 | −91 |
| Dietary vitamin E (Alpha-Tocopherol mg) | 15 | 5 | 20 | 5 | +35 |
| Total vitamin B124 (µg) | 6 | 3 | 904 | 241 | +14,349 |
| Dietary vitamin B126 (µg) | 6 | 3 | 3 | 5 | −54 |
| Dietary folate equivalents (µg) | 458 | 135 | 935 | 272 | +104 |
| Dietary vitamin C (mg) | 134 | 64 | 239 | 152 | +78 |
| Dietary calcium (mg) | 1434 | 247 | 959 | 273 | −33 |
| Dietary magnesium(mg) | 419 | 59 | 711 | 75 | +70 |
| Dietary potassium (mg) | 4071 | 583 | 5387 | 1009 | +32 |
| Dietary iron (mg) | 15 | 4 | 26 | 4 | +79 |
| Dietary sodium (mg) | 2301 | 661 | 2807 | 970 | +22 |
| Men | Women | |||||||||||
|---|---|---|---|---|---|---|---|---|---|---|---|---|
| RDA | Diff | EAR | Diff | AI | Diff | RDA | Diff | EAR | Diff | AI | Diff | |
| Vitamin A (μg) | 900 | +95 | 625 | +192 | - | - | 700 | +151 | 500 | +265 | - | - |
| Vitamin D 2 (μg) | 15 | +80 | 10 | +150 | - | - | 15 | +80 | 10 | +150 | - | - |
| Vitamin E (mg) | 15 | +33 | 12 | +67 | - | - | 15 | +33 | 12 | +67 | - | - |
| Folate total (μg) | 400 | +134 | 320 | +192 | - | - | 400 | +134 | 320 | +192 | - | - |
| Vitamin C (mg) | 90 | +177 | 75 | +219 | - | - | 75 | +232 | 60 | +298 | - | - |
| Calcium 3 (mg) | 1000 | −2 * | 800 | +20 | - | - | 1000–1200 | −18 * | 800–1000 | −4 * | - | - |
| Magnesium 4 (mg) | 400–420 | +69 | 330–350 | +103 | - | - | 310–320 | +122 | 255–265 | +168 | - | - |
| Iron 5 (mg) | 8 | +225 | 6 | +333 | - | - | 8–18 | +44 | 8.1–5 | +221 | - | - |
| Potassium (g) | - | - | - | - | 4.7 | +15 | - | - | - | - | 4.7 | +15 |
| Fiber 7 (g) | - | - | - | - | 30–38 | +84 | - | - | - | - | 21–25 | +180 |
| Sodium (g) | - | - | - | - | 2.3 | +22 * | - | - | - | - | 2.3 | +22 * |
| Dietary Guidelines for Americans (men and women) | - | - | - | - | - | - | - | - | ||||
| Saturated fat (% kcal) | <10% | - | −70 | - | - | |||||||
| Added sugar (% kcal) | <10% | - | −80 | - | ||||||||
© 2019 by the authors. Licensee MDPI, Basel, Switzerland. This article is an open access article distributed under the terms and conditions of the Creative Commons Attribution (CC BY) license (http://creativecommons.org/licenses/by/4.0/).
Share and Cite
Karlsen, M.C.; Rogers, G.; Miki, A.; Lichtenstein, A.H.; Folta, S.C.; Economos, C.D.; Jacques, P.F.; Livingston, K.A.; McKeown, N.M. Theoretical Food and Nutrient Composition of Whole-Food Plant-Based and Vegan Diets Compared to Current Dietary Recommendations. Nutrients 2019, 11, 625. https://doi.org/10.3390/nu11030625
Karlsen MC, Rogers G, Miki A, Lichtenstein AH, Folta SC, Economos CD, Jacques PF, Livingston KA, McKeown NM. Theoretical Food and Nutrient Composition of Whole-Food Plant-Based and Vegan Diets Compared to Current Dietary Recommendations. Nutrients. 2019; 11(3):625. https://doi.org/10.3390/nu11030625
Chicago/Turabian StyleKarlsen, Micaela C., Gail Rogers, Akari Miki, Alice H. Lichtenstein, Sara C. Folta, Christina D. Economos, Paul F. Jacques, Kara A. Livingston, and Nicola M. McKeown. 2019. "Theoretical Food and Nutrient Composition of Whole-Food Plant-Based and Vegan Diets Compared to Current Dietary Recommendations" Nutrients 11, no. 3: 625. https://doi.org/10.3390/nu11030625