Dietary Nutrients Involved in One-Carbon Metabolism and Colonic Mucosa-Associated Gut Microbiome in Individuals with an Endoscopically Normal Colon

 , , add
Show full author list
, , add
Show full author list
Abstract
:1. Introduction
2. Methods
2.1. Study Participants
2.2. Data Collection
2.3. Colonoscopy and Biopsy Acquirement
2.4. Microbial DNA Extraction and the 16S rRNA Gene Sequencing
2.5. Bioinformatics and Taxonomic Assignment
2.6. Statistical Analysis
3. Results
4. Discussion
5. Conclusions
Supplementary Materials
Author Contributions
Funding
Acknowledgments
Conflicts of Interest
References
- Ducker, G.S.; Rabinowitz, J.D. One-Carbon Metabolism in Health and Disease. Cell Metab. 2017, 25, 27–42. [Google Scholar] [CrossRef] [PubMed]
- Masri, O.A.; Chalhoub, J.M.; Sharara, A.I. Role of vitamins in gastrointestinal diseases. World J. Gastroenterol. 2015, 21, 5191–5209. [Google Scholar] [CrossRef]
- Le Marchand, L.; White, K.K.; Nomura, A.M.; Wilkens, L.R.; Selhub, J.S.; Tiirikainen, M.; Goodman, M.T.; Murphy, S.P.; Henderson, B.E.; Kolonel, L.N. Plasma levels of B vitamins and colorectal cancer risk: The multiethnic cohort study. Cancer Epidemiol. Biomark. Prev. 2009, 18, 2195–2201. [Google Scholar] [CrossRef]
- Ferreira, C.M.; Vieira, A.T.; Vinolo, M.A.; Oliveira, F.A.; Curi, R.; Martins Fdos, S. The central role of the gut microbiota in chronic inflammatory diseases. J. Immunol. Res. 2014, 2014, 689492. [Google Scholar] [CrossRef] [PubMed]
- Kennedy, P.J.; Cryan, J.F.; Dinan, T.G.; Clarke, G. Irritable bowel syndrome: A microbiome-gut-brain axis disorder? World J. Gastroenterol. 2014, 20, 14105–14125. [Google Scholar] [CrossRef]
- Gagniere, J.; Raisch, J.; Veziant, J.; Barnich, N.; Bonnet, R.; Buc, E.; Bringer, M.A.; Pezet, D.; Bonnet, M. Gut microbiota imbalance and colorectal cancer. World J. Gastroenterol. 2016, 22, 501–518. [Google Scholar] [CrossRef] [PubMed] [Green Version]
- Magnusdottir, S.; Ravcheev, D.; de Crecy-Lagard, V.; Thiele, I. Systematic genome assessment of B-vitamin biosynthesis suggests co-operation among gut microbes. Front. Genet. 2015, 6, 148. [Google Scholar] [CrossRef]
- Rowland, I.; Gibson, G.; Heinken, A.; Scott, K.; Swann, J.; Thiele, I.; Tuohy, K. Gut microbiota functions: metabolism of nutrients and other food components. Eur. J. Nutr. 2018, 57, 1–24. [Google Scholar] [CrossRef]
- Ikeda, M.; Hosotani, T.; Kurimoto, K.; Mori, T.; Ueda, T.; Kotake, Y.; Sakakibara, B. The differences of the metabolism related to vitamin B6-dependent enzymes among vitamin B6-deficient germ-free and conventional rats. J. Nutr. Sci. Vitaminol. (Tokyo) 1979, 25, 131–139. [Google Scholar] [CrossRef] [PubMed]
- Sumi, Y.; Miyakawa, M.; Kanzaki, M.; Kotake, Y. Vitamin B-6 deficiency in germfree rats. J. Nutr. 1977, 107, 1707–1714. [Google Scholar] [CrossRef]
- Davie, J.R. Inhibition of histone deacetylase activity by butyrate. J. Nutr. 2003, 133, 2485S–2493S. [Google Scholar] [CrossRef] [PubMed]
- Peserico, A.; Simone, C. Physical and functional HAT/HDAC interplay regulates protein acetylation balance. J. Biomed. Biotechnol. 2011, 2011, 371832. [Google Scholar] [CrossRef] [PubMed]
- Rodriguez-Melendez, R.; Zempleni, J. Regulation of gene expression by biotin (review). J. Nutr. Biochem. 2003, 14, 680–690. [Google Scholar] [CrossRef] [PubMed]
- Paul, B.; Barnes, S.; Demark-Wahnefried, W.; Morrow, C.; Salvador, C.; Skibola, C.; Tollefsbol, T.O. Influences of diet and the gut microbiome on epigenetic modulation in cancer and other diseases. Clin. Epigenet. 2015, 7, 112. [Google Scholar] [CrossRef] [PubMed]
- Guenther, P.M.; Reedy, J.; Krebs-Smith, S.M. Development of the Healthy Eating Index-2005. J. Am. Diet. Assoc. 2008, 108, 1896–1901. [Google Scholar] [CrossRef]
- Caporaso, J.G.; Lauber, C.L.; Walters, W.A.; Berg-Lyons, D.; Huntley, J.; Fierer, N.; Owens, S.M.; Betley, J.; Fraser, L.; Bauer, M.; et al. Ultra-high-throughput microbial community analysis on the Illumina HiSeq and MiSeq platforms. ISME J. 2012, 6, 1621–1624. [Google Scholar] [CrossRef] [PubMed] [Green Version]
- Human Microbiome Project Consortium. A framework for human microbiome research. Nature 2012, 486, 215–221. [Google Scholar] [CrossRef] [PubMed] [Green Version]
- Human Microbiome Project Consortium. Structure, function and diversity of the healthy human microbiome. Nature 2012, 486, 207–214. [Google Scholar] [CrossRef] [Green Version]
- Edgar, R.C. Search and clustering orders of magnitude faster than BLAST. Bioinformatics 2010, 26, 2460–2461. [Google Scholar] [CrossRef] [Green Version]
- Edgar, R.C. UPARSE: Highly accurate OTU sequences from microbial amplicon reads. Nat. Methods 2013, 10, 996–998. [Google Scholar] [CrossRef]
- Edgar, R.C.; Haas, B.J.; Clemente, J.C.; Quince, C.; Knight, R. UCHIME improves sensitivity and speed of chimera detection. Bioinformatics 2011, 27, 2194–2200. [Google Scholar] [CrossRef] [PubMed] [Green Version]
- Quast, C.; Pruesse, E.; Yilmaz, P.; Gerken, J.; Schweer, T.; Yarza, P.; Peplies, J.; Glockner, F.O. The SILVA ribosomal RNA gene database project: improved data processing and web-based tools. Nucleic Acids Res. 2013, 41, D590–D596. [Google Scholar] [CrossRef] [PubMed]
- Paradis, E. CJSK. APE: analyses of phylogenetics and evolution in R language. Bioinformatics 2004, 20, 289–290. [Google Scholar] [CrossRef]
- Jari Oksanen ea. vegan: Community Ecology Package. R Package Version 24-2. 2017. Available online: https://CRANR-projectorg/package=vegan (accessed on 1 February 2018).
- Whitney, M. On a Test of Whether one of Two Random Variables is Stochastically Larger than the Other. Ann. Math. Stat. 1947, 18, 50–60. [Google Scholar]
- Lozupone, C.; Lladser, M.E.; Knights, D.; Stombaugh, J.; Knight, R. UniFrac: An effective distance metric for microbial community comparison. ISME J. 2011, 5, 169–172. [Google Scholar] [CrossRef] [PubMed]
- Benjamini, Y.; Yekutieli, D. Quantitative trait Loci analysis using the false discovery rate. Genetics 2005, 171, 783–790. [Google Scholar] [CrossRef]
- Cho, E.; Willett, W.C.; Colditz, G.A.; Fuchs, C.S.; Wu, K.; Chan, A.T.; Zeisel, S.H.; Giovannucci, E.L. Dietary choline and betaine and the risk of distal colorectal adenoma in women. J. Natl. Cancer Inst. 2007, 99, 1224–1231. [Google Scholar] [CrossRef] [PubMed]
- Hanley, M.P.; Kadaveru, K.; Perret, C.; Giardina, C.; Rosenberg, D.W. Dietary Methyl Donor Depletion Suppresses Intestinal Adenoma Development. Cancer Prev. Res. (Phila.) 2016, 9, 812–820. [Google Scholar] [CrossRef] [PubMed]
- Ramirez de Molina, A.; Rodriguez-Gonzalez, A.; Gutierrez, R.; Martinez-Pineiro, L.; Sanchez, J.; Bonilla, F.; Rosell, R.; Lacal, J. Overexpression of choline kinase is a frequent feature in human tumor-derived cell lines and in lung, prostate, and colorectal human cancers. Biochem. Biophys. Res. Commun. 2002, 296, 580–583. [Google Scholar] [CrossRef] [Green Version]
- Bae, S.; Ulrich, C.M.; Neuhouser, M.L.; Malysheva, O.; Bailey, L.B.; Xiao, L.; Brown, E.C.; Cushing-Haugen, K.L.; Zheng, Y.; Cheng, T.Y.; et al. Plasma choline metabolites and colorectal cancer risk in the Women’s Health Initiative Observational Study. Cancer Res. 2014, 74, 7442–7452. [Google Scholar] [CrossRef] [Green Version]
- Guertin, K.A.; Li, X.S.; Graubard, B.I.; Albanes, D.; Weinstein, S.J.; Goedert, J.J.; Wang, Z.; Hazen, S.L.; Sinha, R. Serum Trimethylamine N-oxide, Carnitine, Choline, and Betaine in Relation to Colorectal Cancer Risk in the Alpha Tocopherol, Beta Carotene Cancer Prevention Study. Cancer Epidemiol. Biomark. Prev. 2017, 26, 945–952. [Google Scholar] [CrossRef]
- Ufnal, M.; Zadlo, A.; Ostaszewski, R. TMAO: A small molecule of great expectations. Nutrition 2015, 31, 1317–1323. [Google Scholar] [CrossRef] [PubMed]
- Mira-Pascual, L.; Cabrera-Rubio, R.; Ocon, S.; Costales, P.; Parra, A.; Suarez, A.; Moris, F.; Rodrigo, L.; Mira, A.; Collado, M.C. Microbial mucosal colonic shifts associated with the development of colorectal cancer reveal the presence of different bacterial and archaeal biomarkers. J. Gastroenterol. 2015, 50, 167–179. [Google Scholar] [CrossRef] [PubMed]
- Karlsson, F.H.; Tremaroli, V.; Nookaew, I.; Bergstrom, G.; Behre, C.J.; Fagerberg, B.; Nielsen, J.; Backhed, F. Gut metagenome in European women with normal, impaired and diabetic glucose control. Nature 2013, 498, 99–103. [Google Scholar] [CrossRef]
- Qin, J.; Li, Y.; Cai, Z.; Li, S.; Zhu, J.; Zhang, F.; Liang, S.; Zhang, W.; Guan, Y.; Shen, D.; et al. A metagenome-wide association study of gut microbiota in type 2 diabetes. Nature 2012, 490, 55–60. [Google Scholar] [CrossRef] [PubMed]
- Neyrinck, A.M.; Possemiers, S.; Verstraete, W.; De Backer, F.; Cani, P.D.; Delzenne, N.M. Dietary modulation of clostridial cluster XIVa gut bacteria (Roseburia spp.) by chitin-glucan fiber improves host metabolic alterations induced by high-fat diet in mice. J. Nutr. Biochem. 2012, 23, 51–59. [Google Scholar] [CrossRef] [PubMed]
- Borges-Canha, M.; Portela-Cidade, J.P.; Dinis-Ribeiro, M.; Leite-Moreira, A.F.; Pimentel-Nunes, P. Role of colonic microbiota in colorectal carcinogenesis: A systematic review. Rev. Esp. Enferm. Dig. 2015, 107, 659–671. [Google Scholar] [CrossRef] [PubMed]
- Khan, S.; Jena, G. The role of butyrate, a histone deacetylase inhibitor in diabetes mellitus: Experimental evidence for therapeutic intervention. Epigenomics 2015, 7, 669–680. [Google Scholar] [CrossRef]
- Krautkramer, K.A.; Kreznar, J.H.; Romano, K.A.; Vivas, E.I.; Barrett-Wilt, G.A.; Rabaglia, M.E.; Keller, M.P.; Attie, A.D.; Rey, F.E.; Denu, J.M. Diet-Microbiota Interactions Mediate Global Epigenetic Programming in Multiple Host Tissues. Mol. Cell 2016, 64, 982–992. [Google Scholar] [CrossRef]
- Grander, C.; Adolph, T.E.; Wieser, V.; Lowe, P.; Wrzosek, L.; Gyongyosi, B.; Ward, D.V.; Grabherr, F.; Gerner, R.R.; Pfister, A.; et al. Recovery of ethanol-induced Akkermansia muciniphila depletion ameliorates alcoholic liver disease. Gut 2018, 67, 891–901. [Google Scholar] [CrossRef]
- Niederreiter, L.; Adolph, T.E.; Tilg, H. Food, microbiome and colorectal cancer. Dig. Liver Dis. 2018, 50, 647–652. [Google Scholar] [CrossRef] [PubMed]
- Dooling, S.W.; Costa-Mattioli, M. Gut Bacteria Seize Control of the Brain to Prevent Epilepsy. Cell Host Microbe 2018, 24, 3–5. [Google Scholar] [CrossRef] [PubMed]
- Goker, M.; Gronow, S.; Zeytun, A.; Nolan, M.; Lucas, S.; Lapidus, A.; Hammon, N.; Deshpande, S.; Cheng, J.F.; Pitluck, S.; et al. Complete genome sequence of Odoribacter splanchnicus type strain (1651/6). Stand. Genom. Sci. 2011, 4, 200–209. [Google Scholar] [CrossRef] [PubMed]
- Martinez, I.; Lattimer, J.M.; Hubach, K.L.; Case, J.A.; Yang, J.; Weber, C.G.; Louk, J.A.; Rose, D.J.; Kyureghian, G.; Peterson, D.A.; et al. Gut microbiome composition is linked to whole grain-induced immunological improvements. ISME J. 2013, 7, 269–280. [Google Scholar] [CrossRef] [PubMed]
- Shao, T.; Shao, L.; Li, H.; Xie, Z.; He, Z.; Wen, C. Combined Signature of the Fecal Microbiome and Metabolome in Patients with Gout. Front. Microbiol. 2017, 8, 268. [Google Scholar] [CrossRef] [PubMed]
- Smith-Brown, P.; Morrison, M.; Krause, L.; Davies, P.S. Dairy and plant based food intakes are associated with altered faecal microbiota in 2 to 3 year old Australian children. Sci. Rep. 2016, 6, 32385. [Google Scholar] [CrossRef] [PubMed] [Green Version]
- Woting, A.; Pfeiffer, N.; Loh, G.; Klaus, S.; Blaut, M. Clostridium ramosum promotes high-fat diet-induced obesity in gnotobiotic mouse models. mBio 2014, 5, e01530-14. [Google Scholar] [CrossRef] [PubMed]
- Institute of Medicine. Dietary Reference Intakes for Thiamin, Riboflavin, Niacin, Vitamin B6, Folate, Vitamin B12, Panthothenic Acid, Biotin, and Choline; The National Academies Press: Washington, DC, USA, 1998. [Google Scholar]


| Characteristics | High B2 Diet | Low B2 Diet | p Value |
|---|---|---|---|
| (n = 17) | (n = 18) | ||
| Age, mean (SD) | 62.9 (4.8) | 61.3 (6.1) | 0.40 |
| Gender (Male) | 17 (100) | 17 (94.4) | 0.32 |
| Race | |||
| Non-Hispanic White | 13 (76.5) | 12 (66.6) | 0.60 |
| Hispanic White | 1 (5.9) | 3 (16.7) | |
| Black | 3 (17.6) | 3 (16.7) | |
| BMI (kg/m2), mean (SD) | 33.6 (6.5) | 33.9 (6.6) | 0.87 |
| BMI, categorical | |||
| <30 | 4 (23.5) | 6 (33.3) | 0.52 |
| ≥30 | 13 (76.5) | 12 (66.7) | |
| Hypertension | 14 (82.4) | 12 (66.7) | 0.29 |
| Diabetes | 9 (52.9) | 8 (44.4) | 0.62 |
| Smoking status | |||
| Never | 9 (52.9) | 5 (27.8) | 0.30 |
| Past | 3 (17.6) | 4 (22.2) | |
| Current | 5 (29.4) | 9 (50.0) | |
| Alcohol drinking | |||
| Never | 6 (35.3) | 2 (11.1) | 0.16 |
| Past | 5 (29.4) | 11 (61.1) | |
| Current | 5 (29.4) | 5 (27.8) | |
| HEI total Scores 1 | 63.3 (9.4) | 57.8 (8.6) | 0.08 |
| Segments site | |||
| Cecum | 10 (18.5) | 7 (15.6) | 0.92 |
| Ascending | 9 (16.7) | 9 (20.0) | |
| Transverse | 8 (14.8) | 4 (8.9) | |
| Descending | 6 (11.1) | 5 (11.1) | |
| Sigmoid | 11 (20.4) | 12 (26.7) | |
| Rectum | 10 (18.5) | 8 (17.8) |
| Nutrient | Genus | Mean Relative Abundance (%) (95% Confidence Interval) | ||
|---|---|---|---|---|
| High Intake | Low Intake | FDR p-Value | ||
| Folate | Faecalibacterium | 10.79 (8.63, 12.95) | 6.14 (3.67, 8.60) | 0.006 |
| Lachnospiraceae (UncO8895) | 3.26 (1.52, 5.00) | 9.47 (5.85, 13.09) | <0.001 | |
| Lachnospiraceae (Unc94789) | 1.89 (1.21, 2.56) | 4.04 (2.46, 5.61) | 0.025 | |
| Akkermansia | 4.31 (2.45, 6.18) | 1.18 (−0.75, 3.11) | <0.001 | |
| Subdoligranulum | 2.36 (1.85, 2.88) | 1.22 (0.83, 1.60) | 0.006 | |
| Erysipelatoclostridium | 0.96 (0.12, 1.79) | 1.92 (0.63, 3.20) | 0.002 | |
| Alistipes | 1.80 (1.22, 2.37) | 0.54 (0.20, 0.87) | <0.001 | |
| Haemophilus | 1.83 (1.15, 2.51) | 0.44 (0.08, 0.80) | 0.006 | |
| Desulfovibrio | 1.31 (0.68, 1.94) | 0.13 (0.03, 0.22) | 0.032 | |
| Prevotellaceae (Unc04zvf) | 1.05 (0.49, 1.62) | 0.31 (−0.13, 0.75) | 0.025 | |
| Odoribacterium | 0.62 (0.45, 0.79) | 0.10 (0.04, 0.17) | <0.001 | |
| Dialister | 0.28 (0.16, 0.40) | 0.03 (0, 0.06) | <0.001 | |
| Vitamin B2 | Faecalibacterium | 11.32 (9.11, 13.53) | 5.92 (3.60, 8.24) | <0.001 |
| Lachnospiraceae (UncO8895) | 2.04 (1.09, 2.98) | 10.38 (6.78, 13.98) | <0.001 | |
| Escherichia/Shigella | 3.83 (1.77, 5.89) | 6.39 (3.93, 8.84) | 0.027 | |
| Lachnospiraceae (Unc94789) | 1.97 (1.22, 2.73) | 3.74 (2.31, 5.17) | 0.019 | |
| Akkermansia | 4.67 (2.7, 6.65) | 1.03 (−0.72, 2.78) | <0.001 | |
| Roseburia | 3.24 (2.38, 4.11) | 1.75 (1.03, 2.47) | 0.039 | |
| Lachnoclostridium | 1.51 (0.99, 2.04) | 2.32 (1.73, 2.90) | 0.034 | |
| Subdoligranulum | 2.53 (2.00, 3.06) | 1.11 (0.76, 1.47) | <0.001 | |
| Erysipelatoclostridium | 0.14 (0.03, 0.25) | 2.82 (1.33, 4.30) | <0.001 | |
| Alistipes | 1.85 (1.28, 2.43) | 0.58 (0.18, 0.99) | <0.001 | |
| Desulfovibrio | 1.27 (0.64, 1.90) | 0.29 (−0.07, 0.64) | 0.022 | |
| Prevotellaceae (Unc04zvf) | 1.13 (0.53, 1.73) | 0.28 (−0.12, 0.68) | 0.009 | |
| Barnesiella | 0.88 (0.58, 1.17) | 0.30 (0.02, 0.59) | 0.042 | |
| Odoribacterium | 0.61 (0.46, 0.77) | 0.16 (0.02, 0.30) | <0.001 | |
| Dialister | 0.30 (0.18, 0.43) | 0.03 (0, 0.06) | <0.001 | |
| Vitamin B6 | Faecalibacterium | 10.76 (8.72, 12.80) | 5.94 (3.25, 8.62) | 0.003 |
| Lachnospiraceae (UncO8895) | 5.11 (2.57, 7.64) | 6.93 (4.10, 9.76) | 0.039 | |
| Escherichia/Shigella | 3.70 (1.77, 5.63) | 7.00 (4.33, 9.66) | 0.005 | |
| Lachnospiraceae (Unc94789) | 1.67 (1.03, 2.32) | 4.49 (2.89, 6.09) | <0.001 | |
| Akkermansia | 3.87 (2.11, 5.63) | 1.70 (−0.50, 3.90) | 0.010 | |
| Lachnoclostridium | 1.34 (0.99, 1.69) | 2.72 (1.93, 3.51) | 0.005 | |
| Subdoligranulum | 2.25 (1.75, 2.75) | 1.33 (0.89, 1.77) | 0.024 | |
| Erysipelatoclostridium | 1.12 (0.22, 2.01) | 1.72 (0.50, 2.95) | 0.015 | |
| Alistipes | 1.65 (1.15, 2.14) | 0.70 (0.13, 1.27) | <0.001 | |
| Prevotellaceae (Unc04zvf) | 1.12 (0.54, 1.69) | 0.17 (−0.17, 0.51) | 0.010 | |
| Barnesiella | 0.81 (0.55, 1.08) | 0.31 (−0.02, 0.64) | 0.023 | |
| Odoribacterium | 0.56 (0.42, 0.71) | 0.17 (0, 0.33) | <0.001 | |
| Dialister | 0.28 (0.16, 0.39) | 0.02 (0, 0.05) | <0.001 | |
| Bifidobacterium | 0.26 (0.11, 0.41) | 0.02 (0.01, 0.03) | 0.024 | |
| Vitamin B12 | Bacteroides | 24.51 (20.46, 28.57) | 34.65 (29.76, 39.54) | 0.016 |
| Faecalibacterium | 12.66 (10.10, 15.22) | 4.84 (3.42, 6.26) | <0.001 | |
| Lachnospiraceae (UncO8895) | 2.39 (1.38, 3.40) | 9.47 (5.99, 12.95) | 0.026 | |
| Akkermansia | 5.04 (2.99, 7.10) | 0.87 (−0.76, 2.50) | <0.001 | |
| Roseburia | 3.38 (2.50, 4.27) | 1.70 (1.00, 2.39) | 0.007 | |
| Lachnoclostridium | 1.56 (0.99, 2.13) | 2.22 (1.67, 2.76) | 0.046 | |
| Erysipelatoclostridium | 0.19 (0.06, 0.32) | 2.59 (1.18, 4.00) | 0.001 | |
| Alistipes | 1.85 (1.23, 2.47) | 0.67 (0.29, 1.05) | <0.001 | |
| Haemophilus | 1.84 (1.14, 2.54) | 0.63 (0.15, 1.11) | 0.026 | |
| Odoribacterium | 0.53 (0.36, 0.69) | 0.28 (0.12, 0.44) | 0.026 | |
| Dialister | 0.31 (0.17, 0.44) | 0.04 (0, 0.08) | <0.001 | |
| Folate | Vitamin B2 | Vitamin B6 | Vitamin B12 | |
|---|---|---|---|---|
| R2 | R2 | R2 | R2 | |
| Increase with more consumption | ||||
| Faecalibacterium | 13% | 6% | 13% | |
| Akkermansia | 9% | |||
| Subdoligranulum | 11% | |||
| Alistipes | 7% | 20% | 15% | |
| Haemophilus | 7% | |||
| Roseburia | 6% | |||
| Parabacteroides | 8% | |||
| Decrease with more consumption | ||||
| Bacteroides | 5% | 6% | 15% | |
| Erysipelatoclostridium | 8% | |||
| Fusobacterium | 7% | |||
| Lachnospiraceae (UncO8895) | 8% | 8% | 5% |
| Prevalence (%) | Median Relative Count 1 | |||||
|---|---|---|---|---|---|---|
| Nutrients | Phylum | High | Low | High | Low | Fold Change (95% CI) 2 |
| Total choline | Proteobacteria | 100 | 100 | 137 | 102 | 0.63 (0.48–0.83) |
| Firmicutes | 100 | 100 | 752 | 789 | 1.19 (1.02–1.39) | |
| Methionine | Proteobacteria | 100 | 100 | 113 | 112 | 0.66 (0.49–0.91) |
| Firmicutes | 100 | 100 | 752 | 797 | 1.42 (1.18–1.71) | |
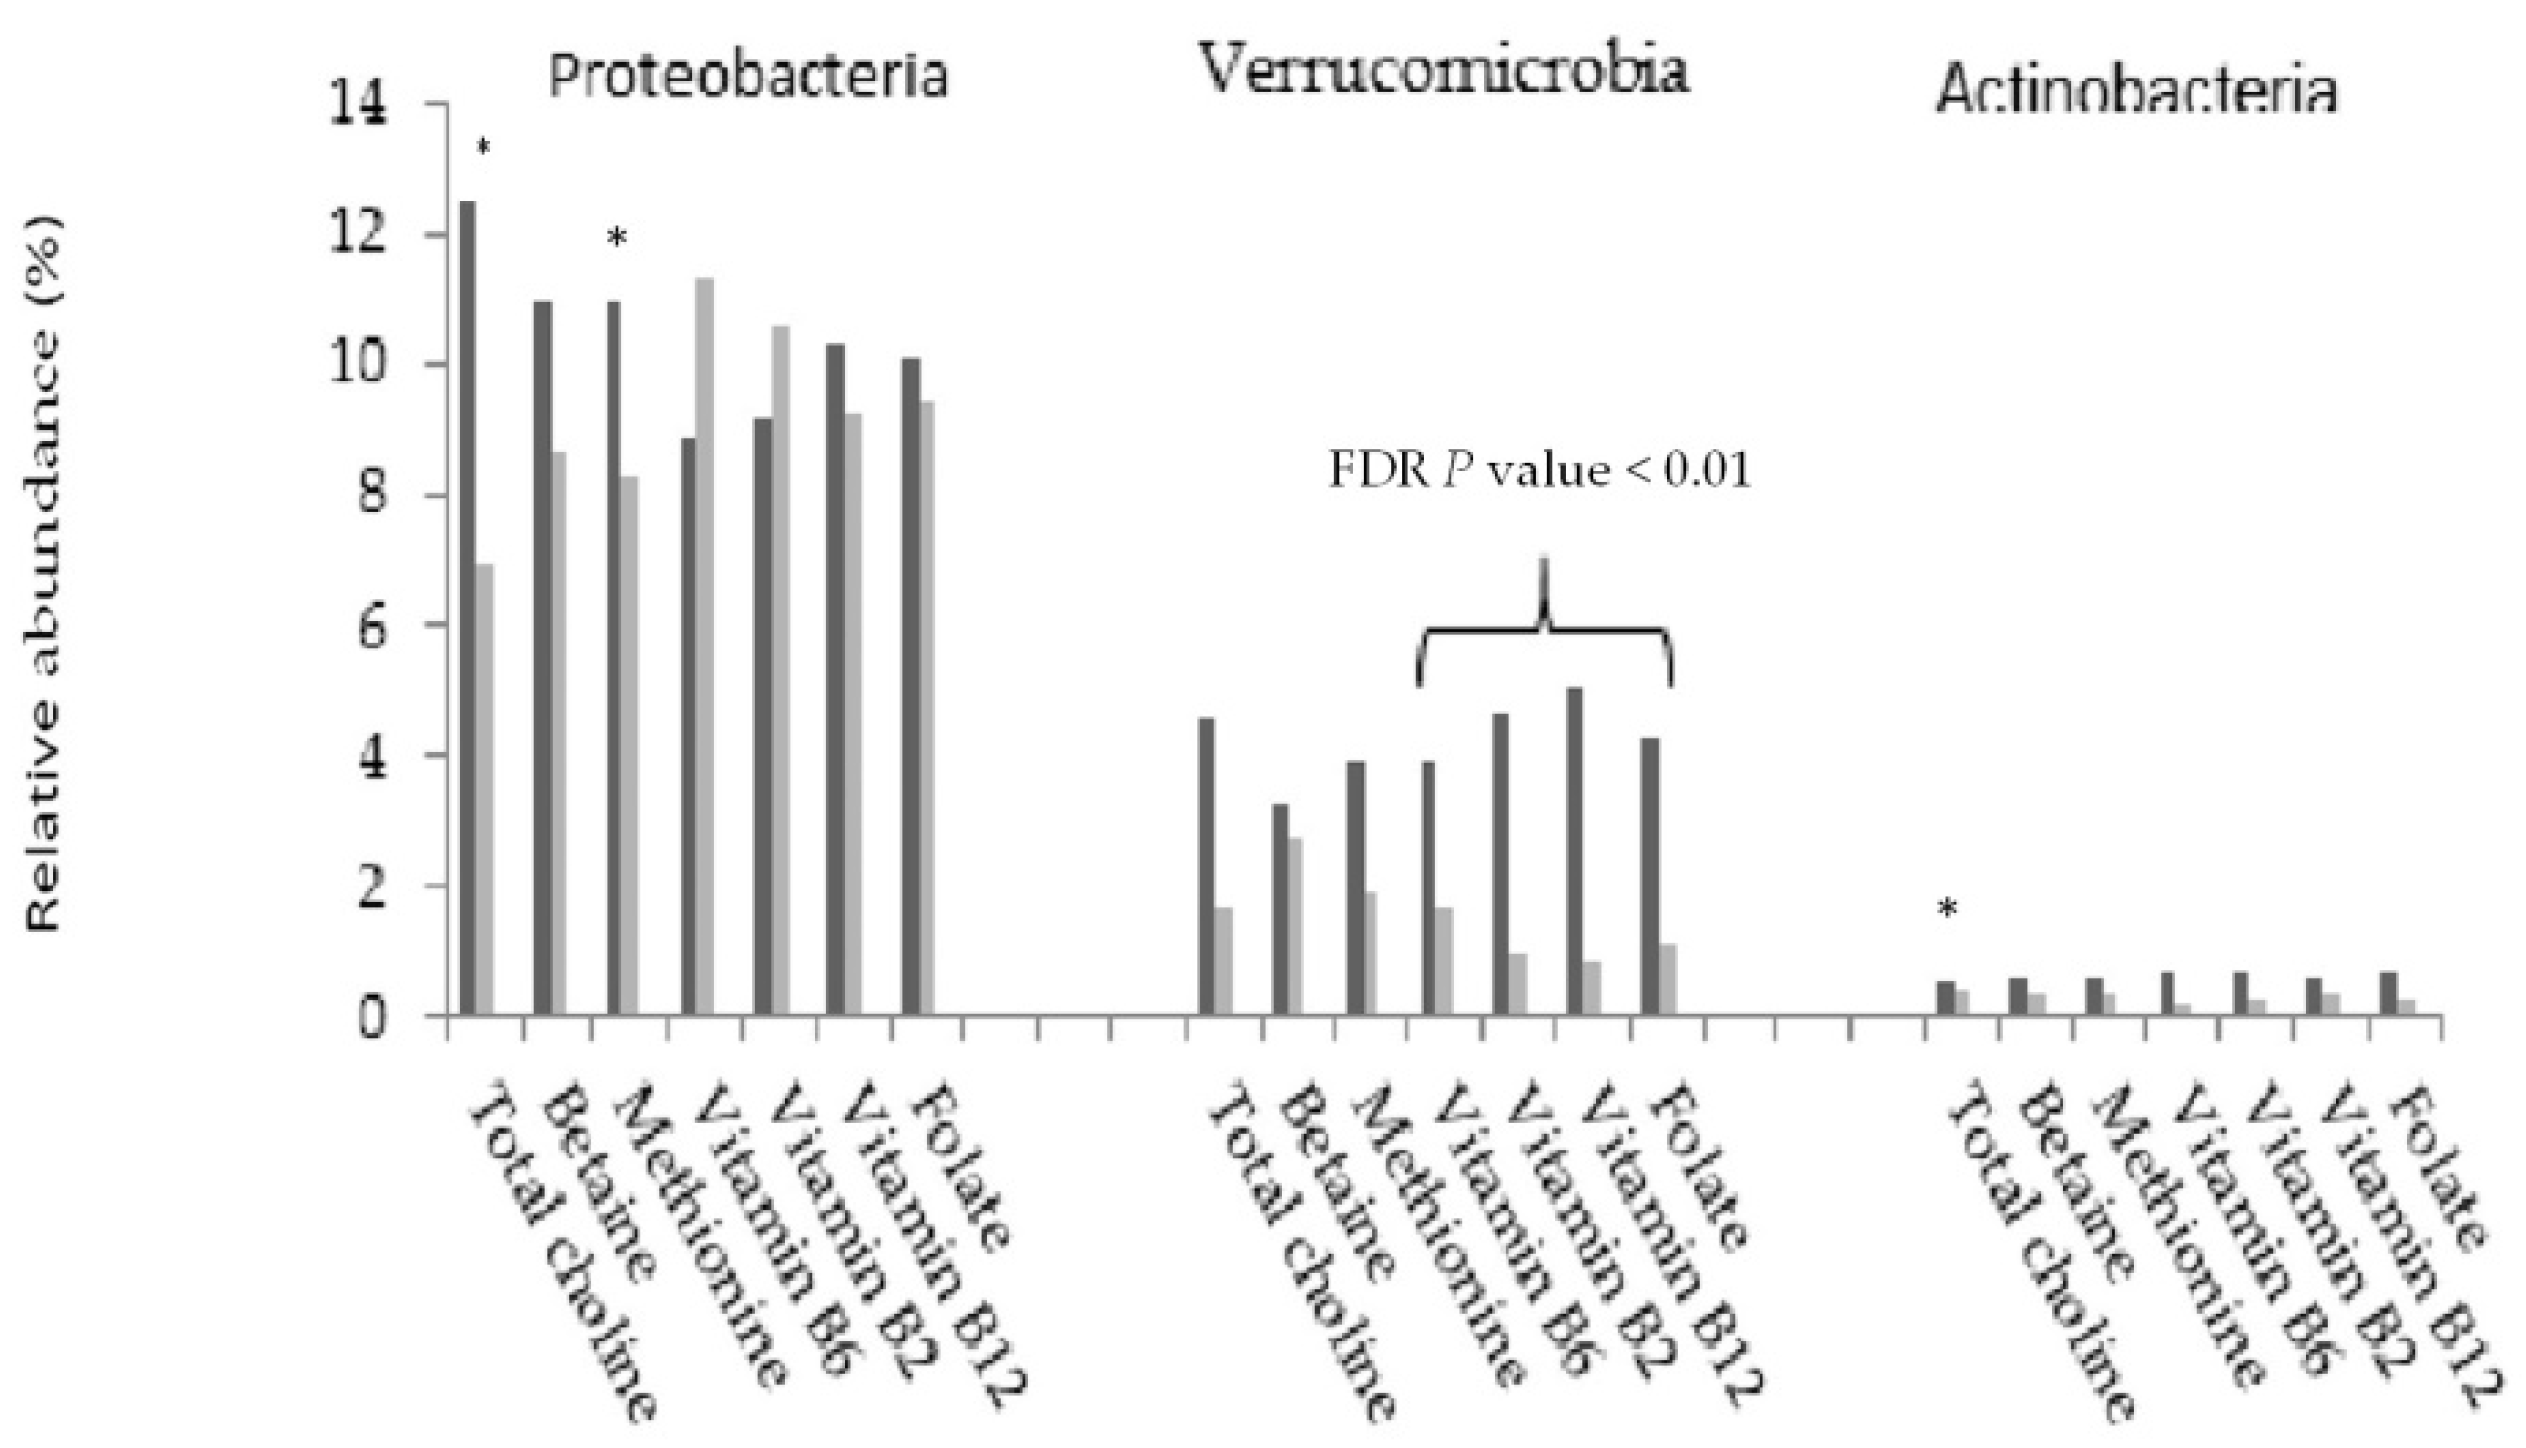
| Folate | Verrucomicrobia | 76.2 | 26.5 | 13.3 | 0 | 0.24 (0.06–0.96) |
| Vitamin B2 | Verrucomicrobia | 79.2 | 34.1 | 21.1 | 0 | 0.47 (0.11–1.97) |
| Vitamin B6 | Verrucomicrobia | 70.7 | 41 | 17.4 | 0 | 0.75 (0.25–2.20) |
| Genus | ||||||
| Vitamin B2 | Odoribacter | 77.4 | 38.6 | 10.4 | 0 | 0.10 (0.05–0.20) |
| Roseburia | 96.2 | 86.4 | 46.6 | 10.2 | 0.24 (0.13–0.42) | |
| Faecalibacterium | 100 | 86.4 | 181 | 38.1 | 0.56 (0.32–0.97) | |
| Erysipelatoclostridium | 28.3 | 70.5 | 0 | 4.35 | 24.8 (9.25–66.62) | |
| Dialister | 56.6 | 9.1 | 1.41 | 0 | 0.06 (0.02–0.18) | |
| Akkermansia | 79.2 | 34.1 | 22.6 | 0 | 0.16 (0.03–0.99) | |
| Vitamin B6 | Odoribacter | 72.4 | 41 | 8.02 | 0 | 0.28 (0.12–0.61) |
| Roseburia | 94.8 | 87.2 | 42.6 | 10.7 | 0.29 (0.15–0.57) | |
| Faecalibacterium | 100 | 84.6 | 170 | 30.8 | 0.67 (0.35–1.29) | |
| Erysipelatoclostridium | 36.2 | 64.1 | 0 | 2.43 | 0.91 (0.38–2.18) | |
| Dialister | 50 | 12.8 | 0.23 | 0 | 0.14 (0.05–0.34) | |
| Akkermansia | 70.7 | 41 | 15.9 | 0 | 0.65 (0.25–1.71) | |
| Vitamin B12 | Odoribacter | 72.9 | 46.9 | 9.96 | 0 | 0.69 (0.46–1.02) |
| Roseburia | 97.9 | 85.7 | 51.9 | 7.39 | 0.42 (0.29–0.60) | |
| Faecalibacterium | 97.9 | 89.8 | 220 | 30.6 | 0.49 (0.34–0.71) | |
| Erysipelatoclostridium | 31.3 | 63.3 | 0 | 2.1 | 1.35 (1.00–1.83) | |
| Dialister | 58.3 | 12.2 | 1.49 | 0 | 0.37 (0.25–0.55) | |
| Akkermansia | 83.3 | 34.7 | 26.8 | 0 | 0.81 (0.62–1.05) | |
| Folate | Odoribacter | 74.6 | 32.4 | 5.26 | 0 | 0.23 (0.12–0.44) |
| Roseburia | 92.1 | 91.2 | 46.1 | 7.45 | 1.21 (0.69–2.11) | |
| Faecalibacterium | 100 | 82.4 | 146 | 72.6 | 0.57 (0.35–0.93) | |
| Erysipelatoclostridium | 38.1 | 64.7 | 0 | 5.24 | 1.59 (0.75–3.39) | |
| Dialister | 49.2 | 8.8 | 0 | 0 | 0.19 (0.08–0.48) | |
| Akkermansia | 76.2 | 26.5 | 6.55 | 0 | 0.28 (0.09–0.89) | |
© 2019 by the authors. Licensee MDPI, Basel, Switzerland. This article is an open access article distributed under the terms and conditions of the Creative Commons Attribution (CC BY) license (http://creativecommons.org/licenses/by/4.0/).
Share and Cite
Gurwara, S.; Ajami, N.J.; Jang, A.; Hessel, F.C.; Chen, L.; Plew, S.; Wang, Z.; Graham, D.Y.; Hair, C.; White, D.L.; et al. Dietary Nutrients Involved in One-Carbon Metabolism and Colonic Mucosa-Associated Gut Microbiome in Individuals with an Endoscopically Normal Colon. Nutrients 2019, 11, 613. https://doi.org/10.3390/nu11030613
Gurwara S, Ajami NJ, Jang A, Hessel FC, Chen L, Plew S, Wang Z, Graham DY, Hair C, White DL, et al. Dietary Nutrients Involved in One-Carbon Metabolism and Colonic Mucosa-Associated Gut Microbiome in Individuals with an Endoscopically Normal Colon. Nutrients. 2019; 11(3):613. https://doi.org/10.3390/nu11030613
Chicago/Turabian StyleGurwara, Shawn, Nadim J. Ajami, Albert Jang, Frances C. Hessel, Liang Chen, Sarah Plew, Zhensheng Wang, David Y. Graham, Clark Hair, Donna L. White, and et al. 2019. "Dietary Nutrients Involved in One-Carbon Metabolism and Colonic Mucosa-Associated Gut Microbiome in Individuals with an Endoscopically Normal Colon" Nutrients 11, no. 3: 613. https://doi.org/10.3390/nu11030613