Lycopene-Rich Extract from Red Guava (Psidium guajava L.) Decreases Plasma Triglycerides and Improves Oxidative Stress Biomarkers on Experimentally-Induced Dyslipidemia in Hamsters

 , , , , , ,
  and
and
Abstract
:1. Introduction
2. Materials and Methods
2.1. Obtaining of the Lycopene-Rich Extract from Psidium guajava
2.2. Ethical Aspects
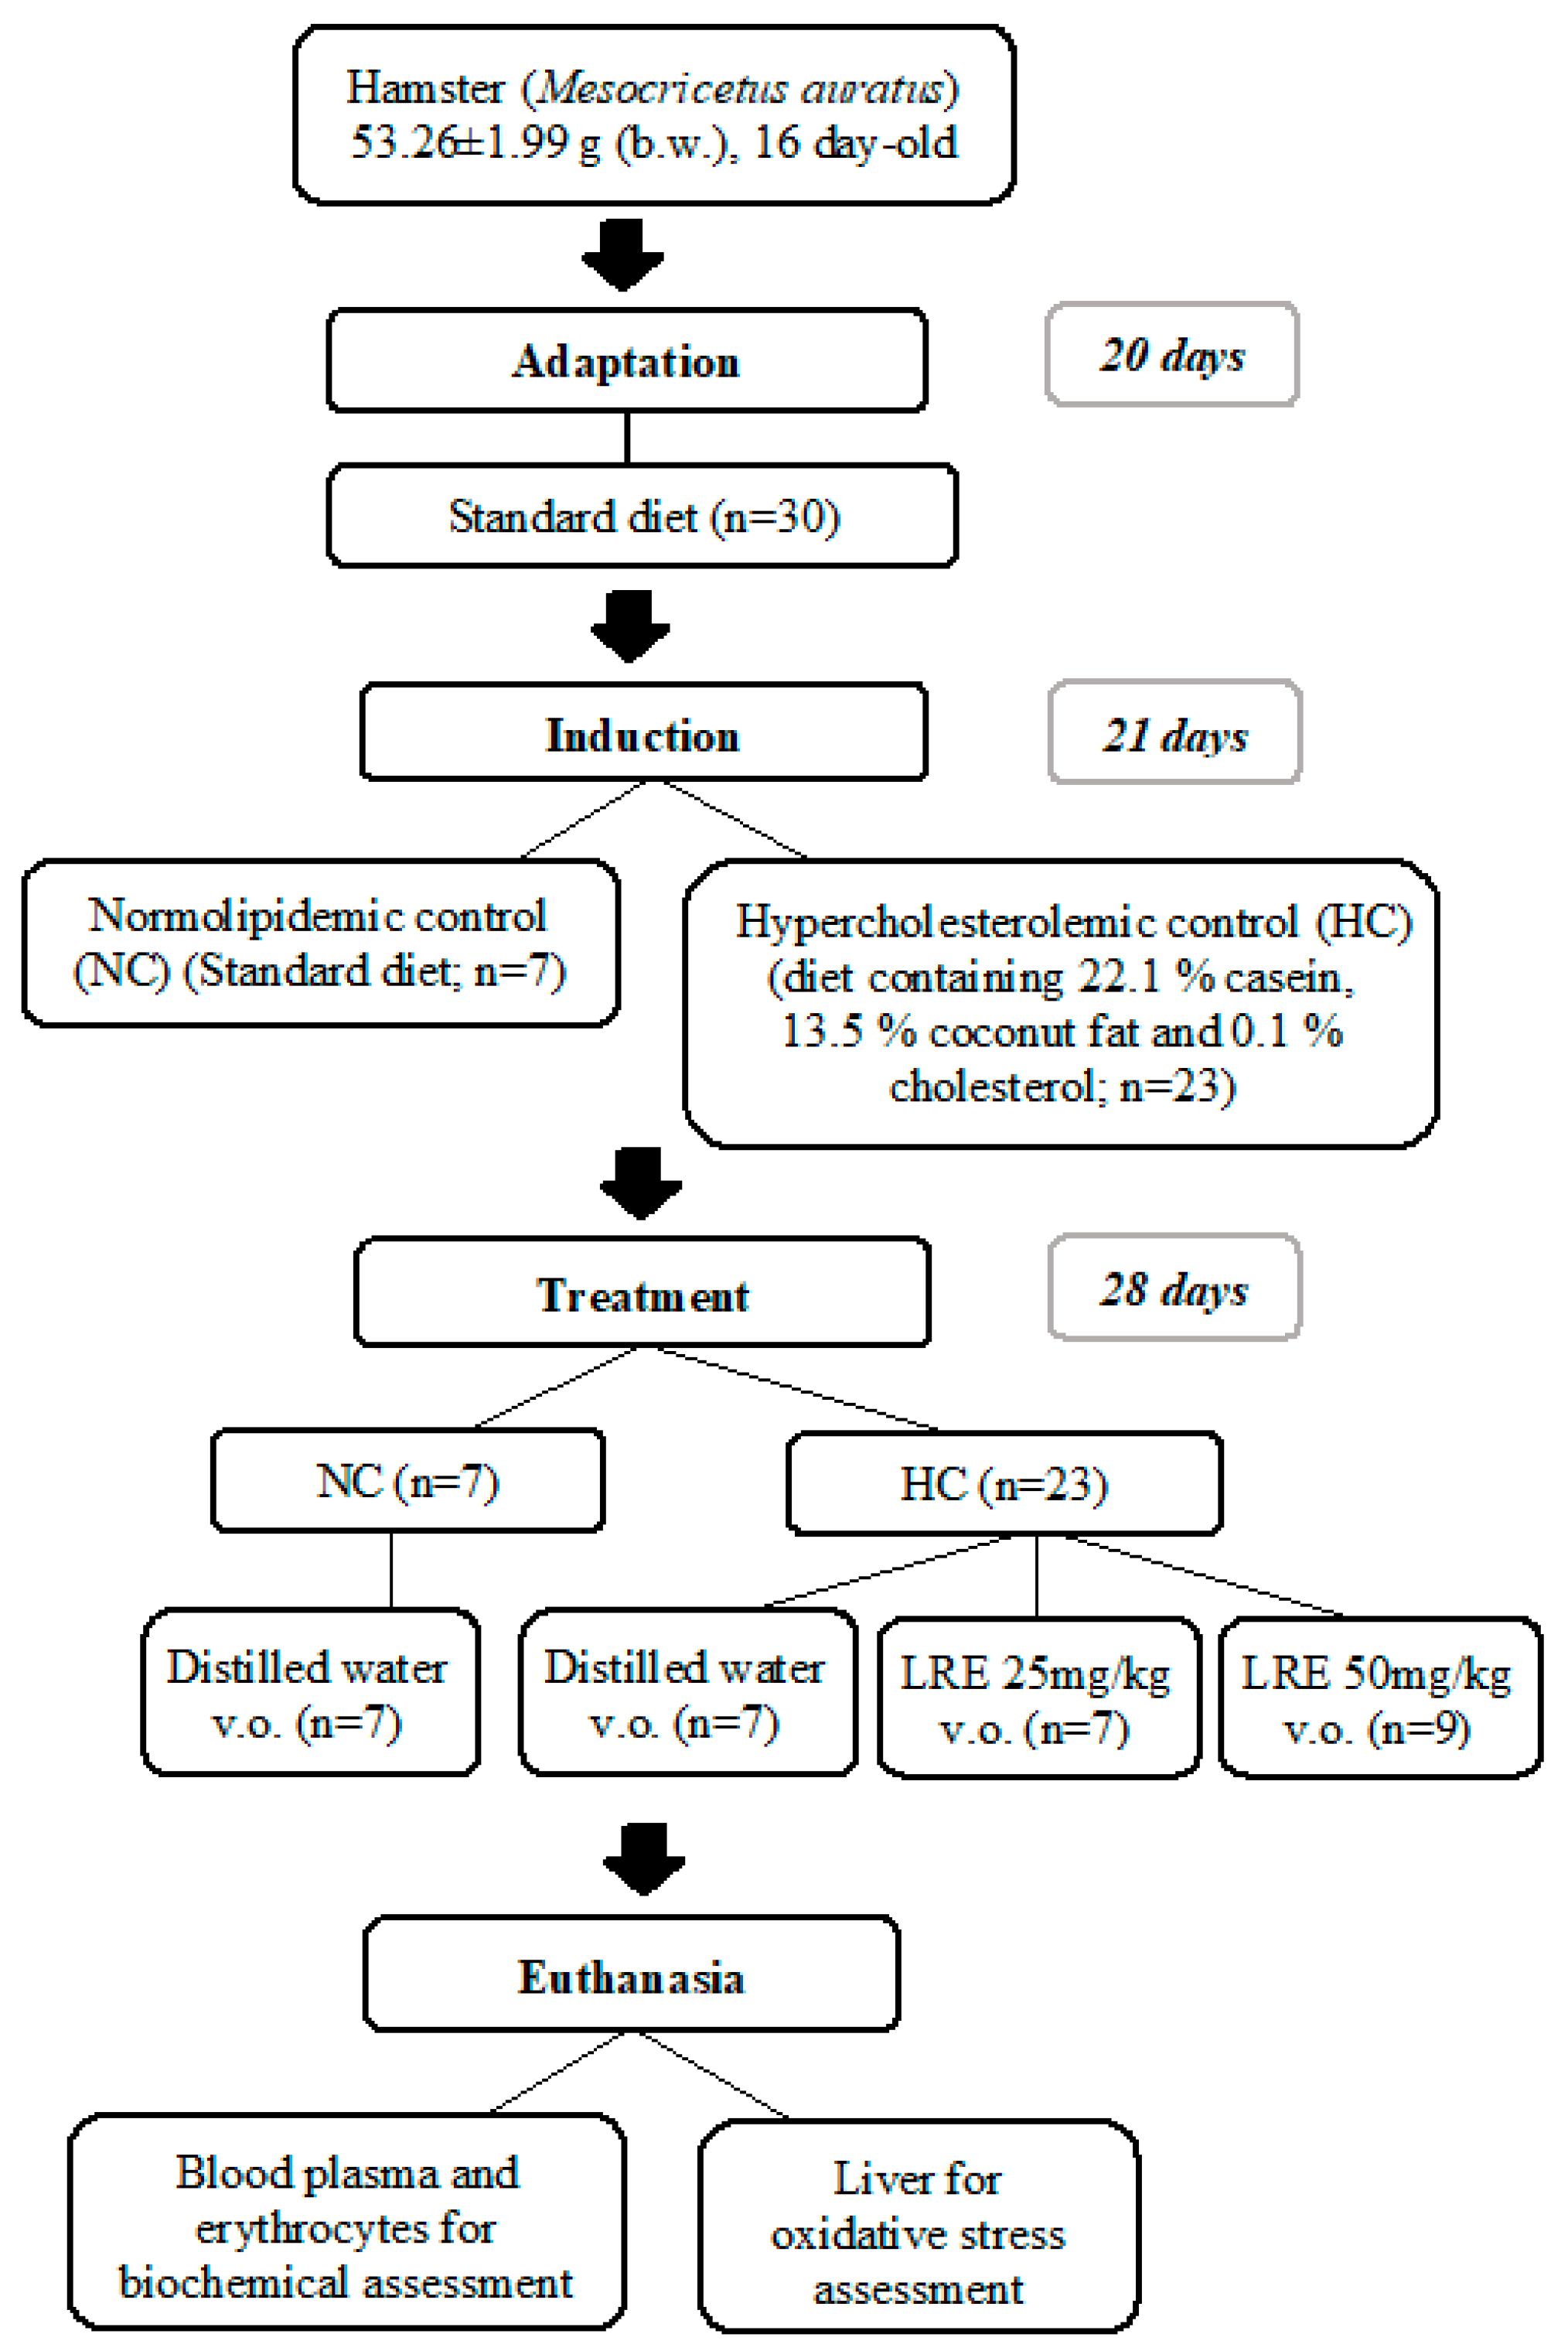
2.3. Experimental Model of Dyslipidemia
2.4. Determination of the Lipid Profile
2.5. Atherogenic Indexes
2.6. Determination of Oxidative Stress Biomarkers
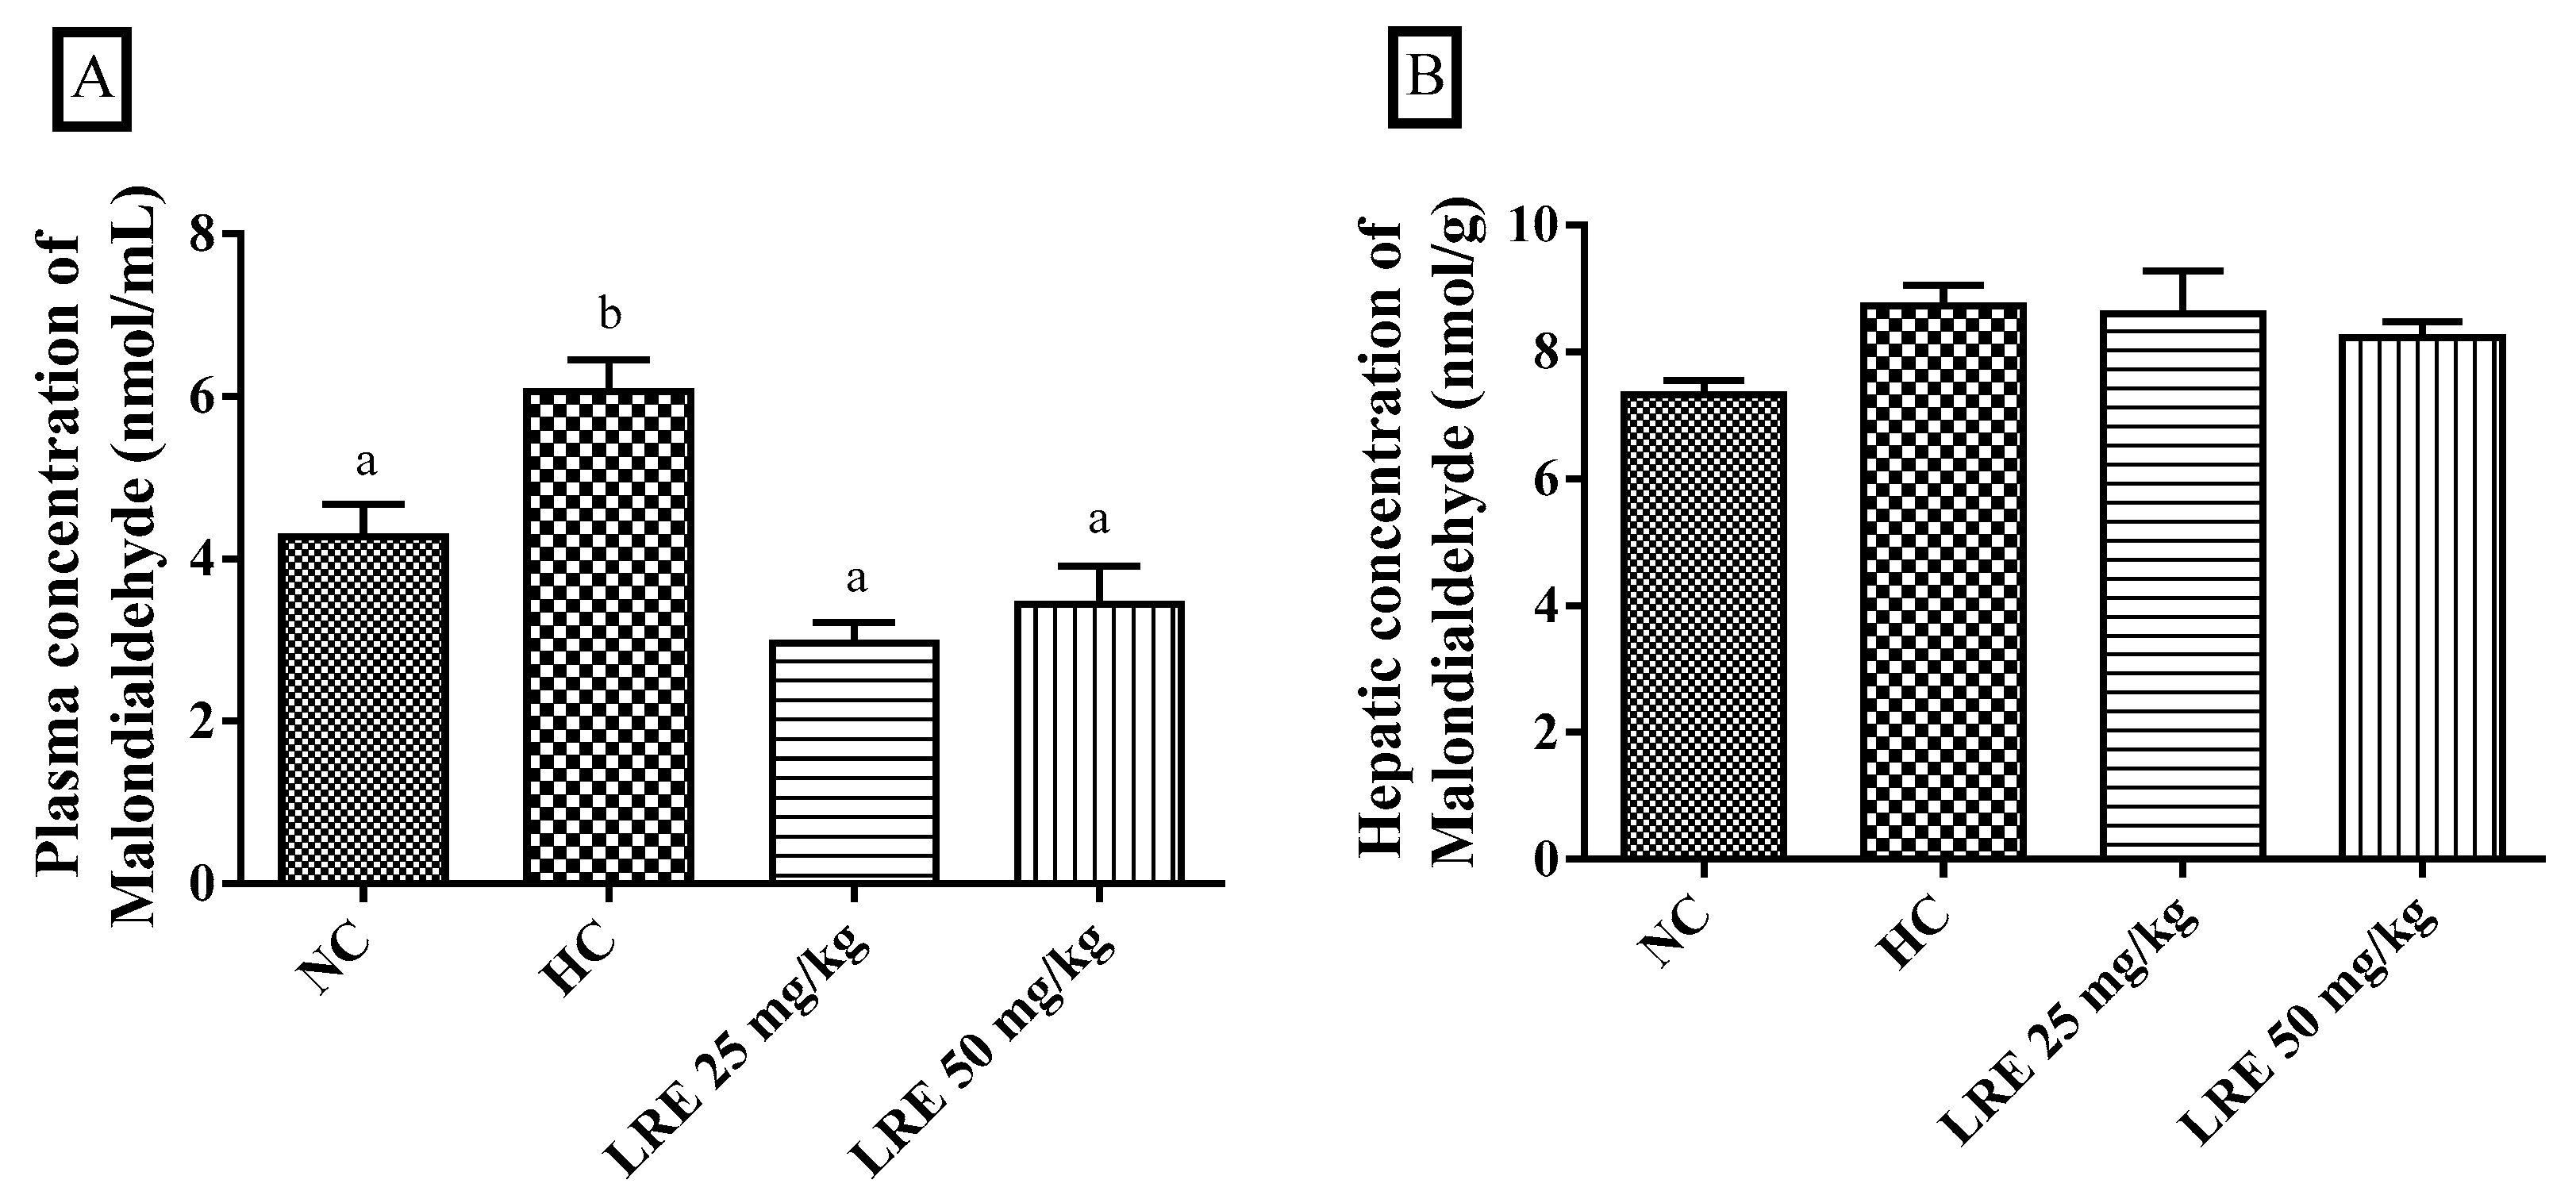
2.6.1. Determination of Plasma and Hepatic Concentrations of Malondialdehyde (MDA)
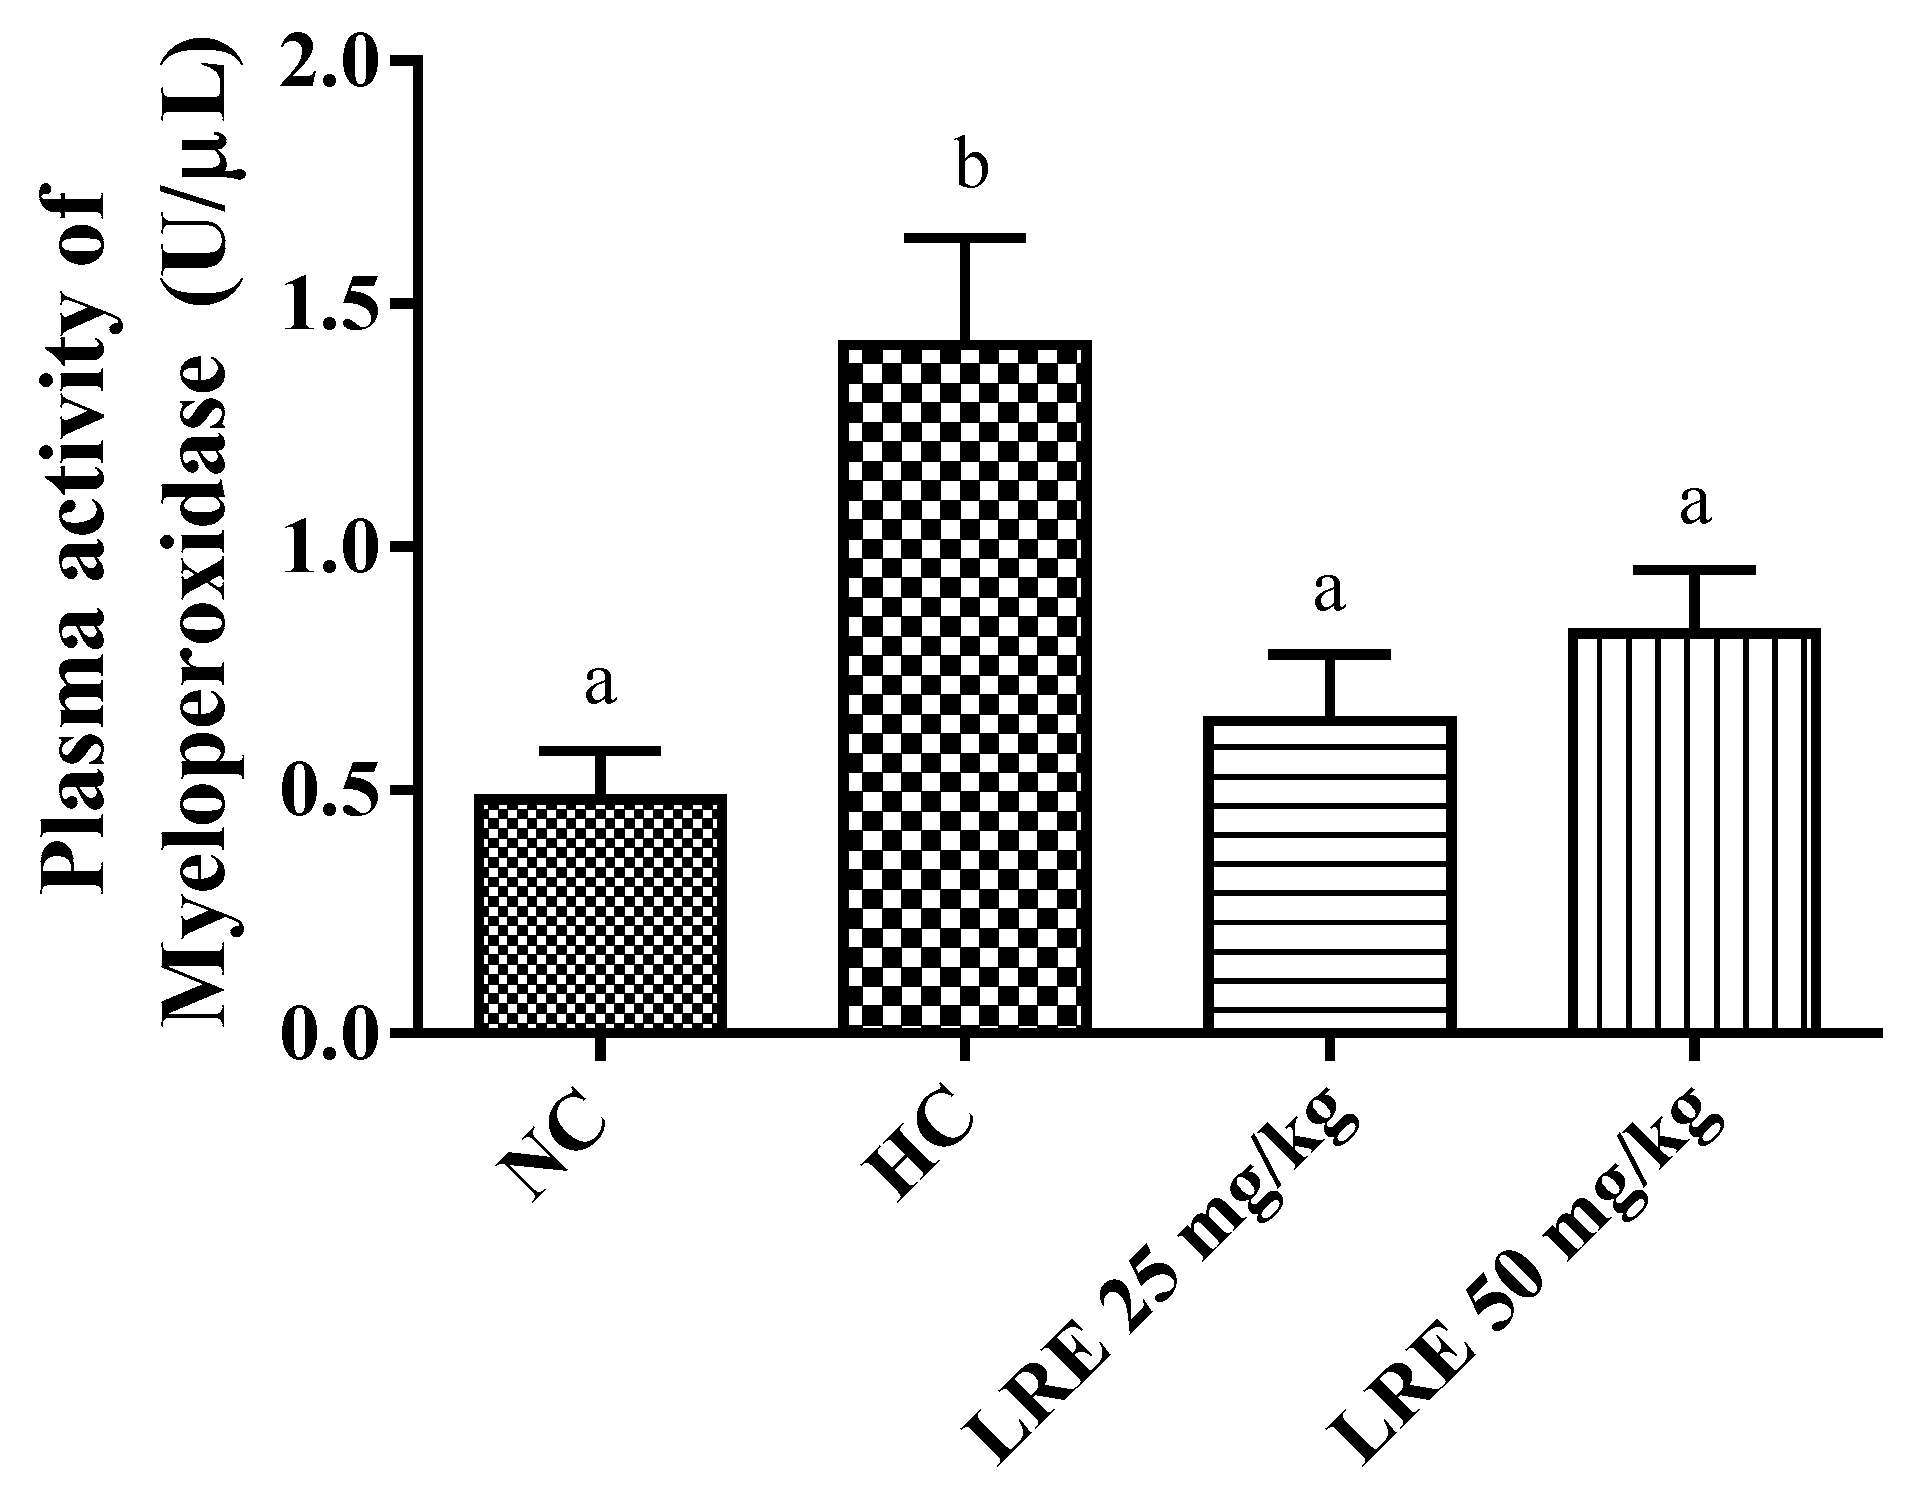
2.6.2. Determination of Plasma Activity of Myeloperoxidase (MPO)
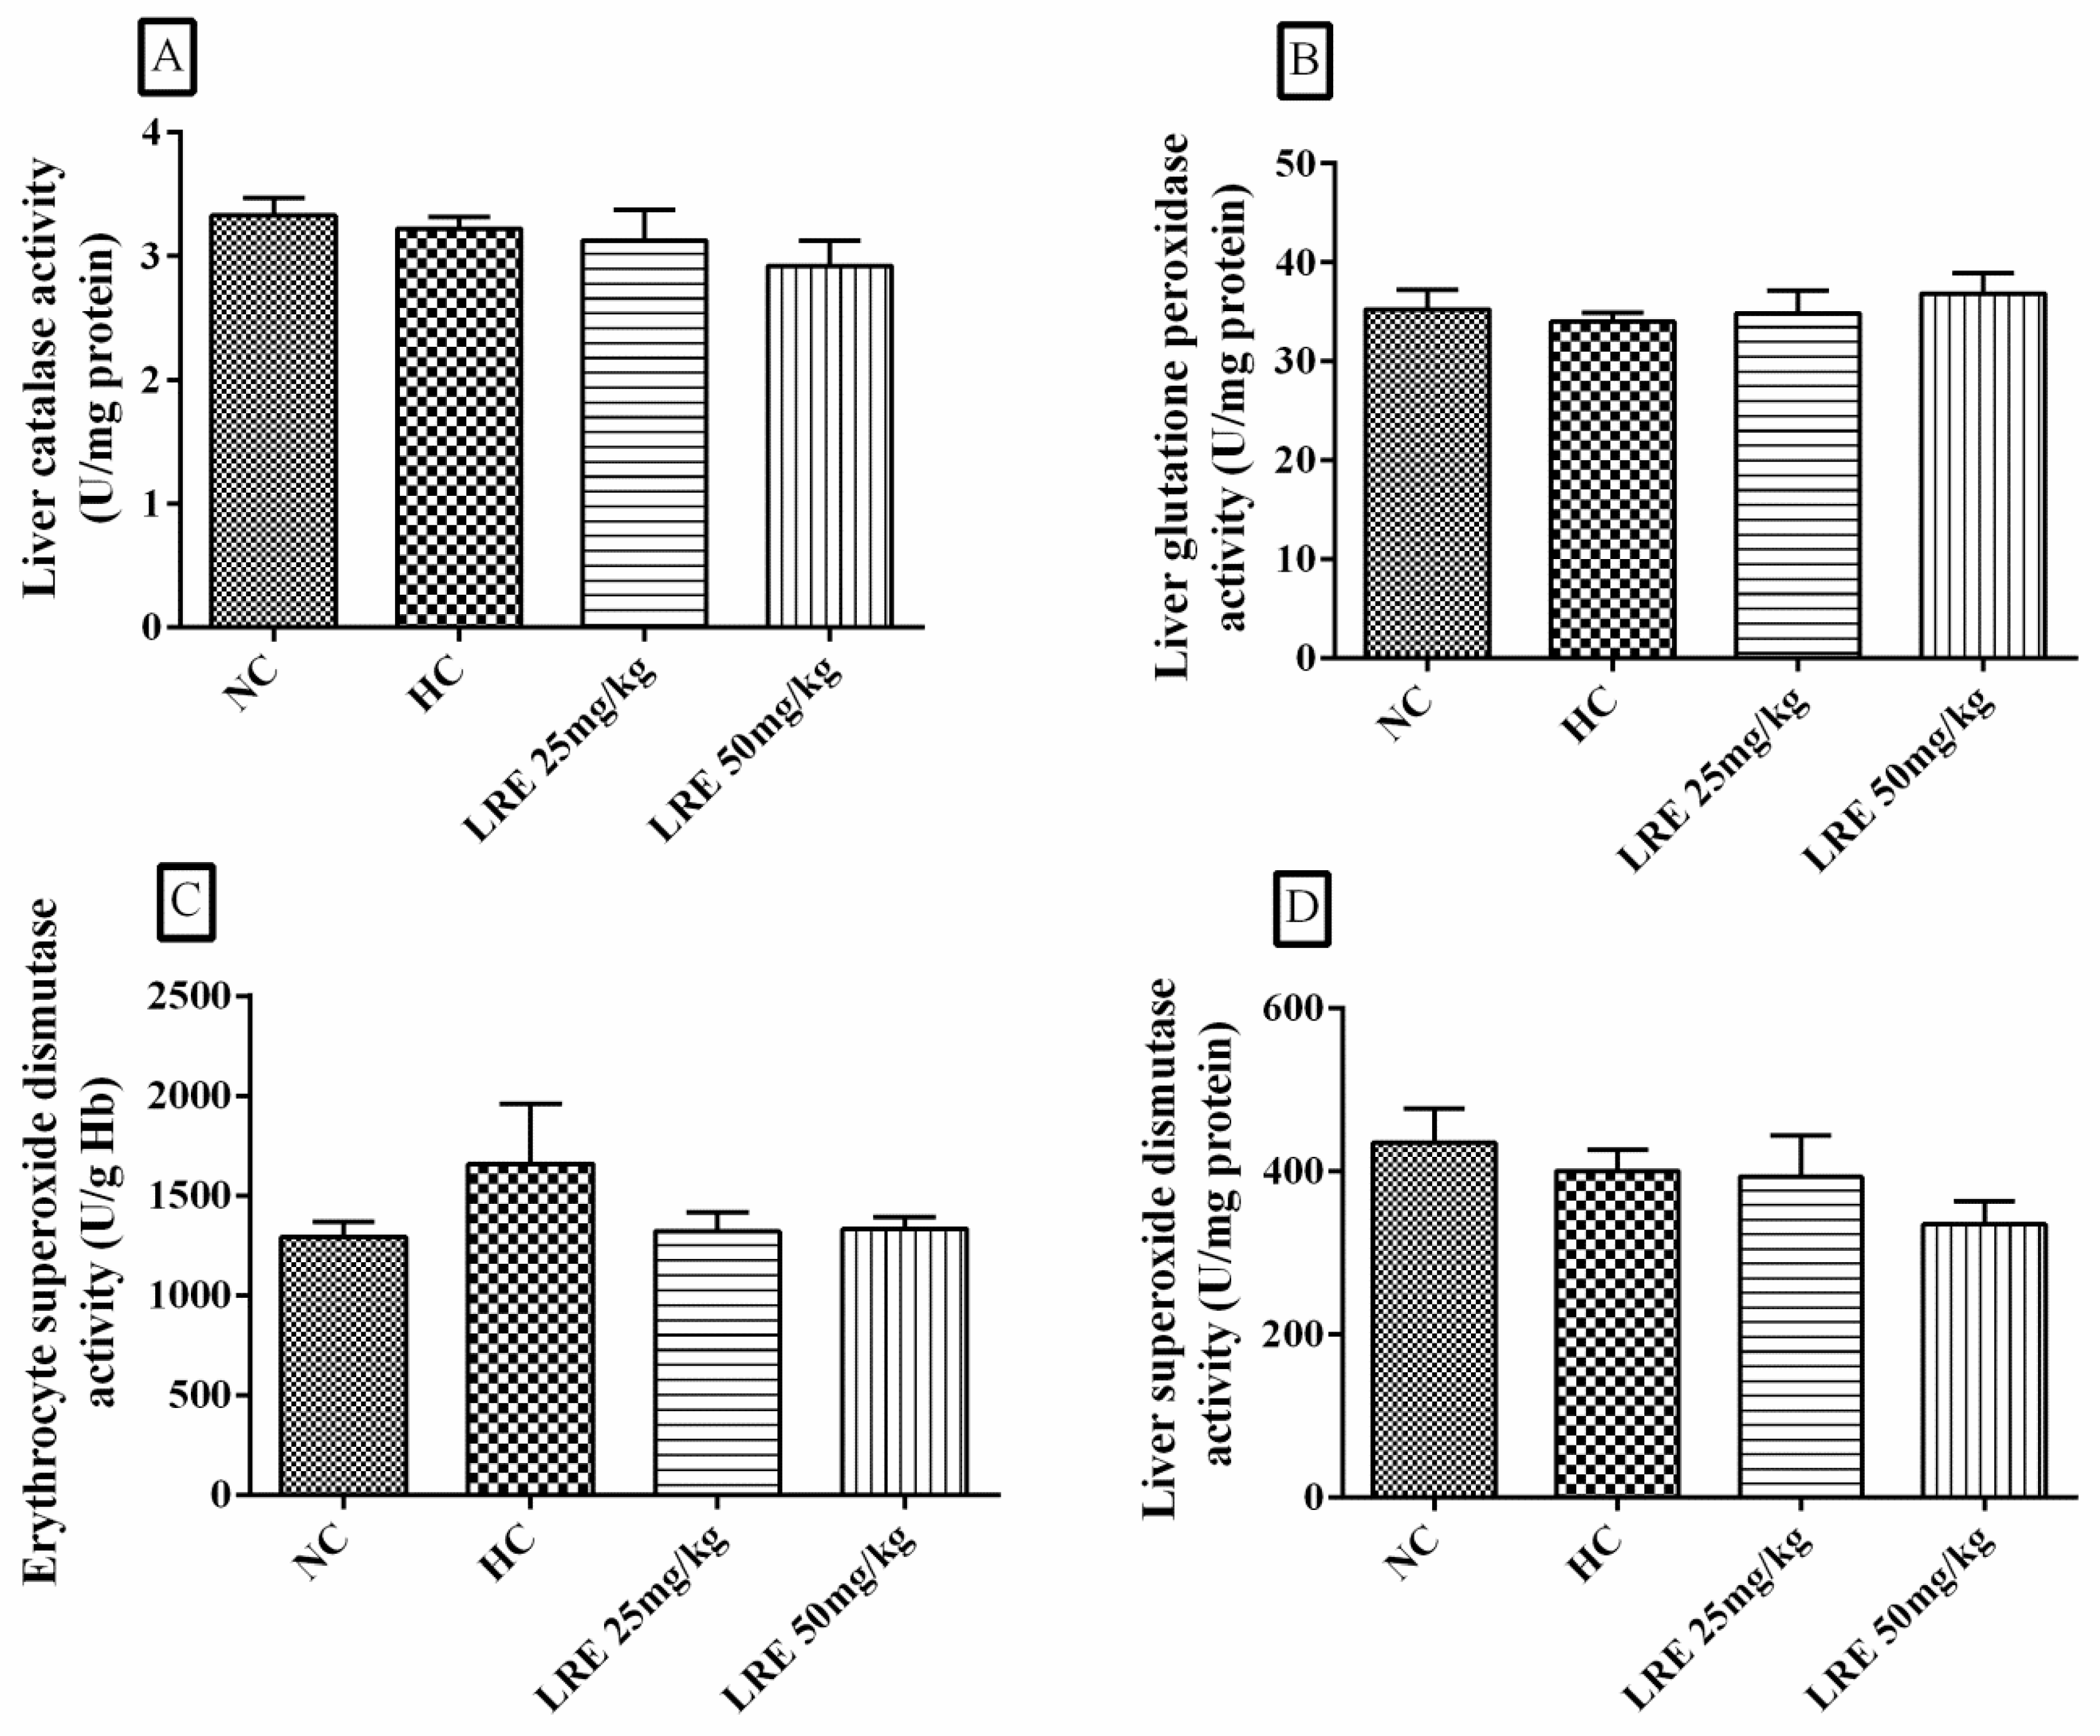
2.7. Determination of the Antioxidant Enzyme Activity
2.7.1. Liver Catalase (CAT) Activity
2.7.2. Liver Glutathione Peroxidase (GPx) Activity
2.7.3. Liver Superoxide Dismutase (SOD-h) Activity
2.7.4. Erythrocyte Superoxide Dismutase (SOD-e) Activity
2.8. Statistical Analysis
3. Results
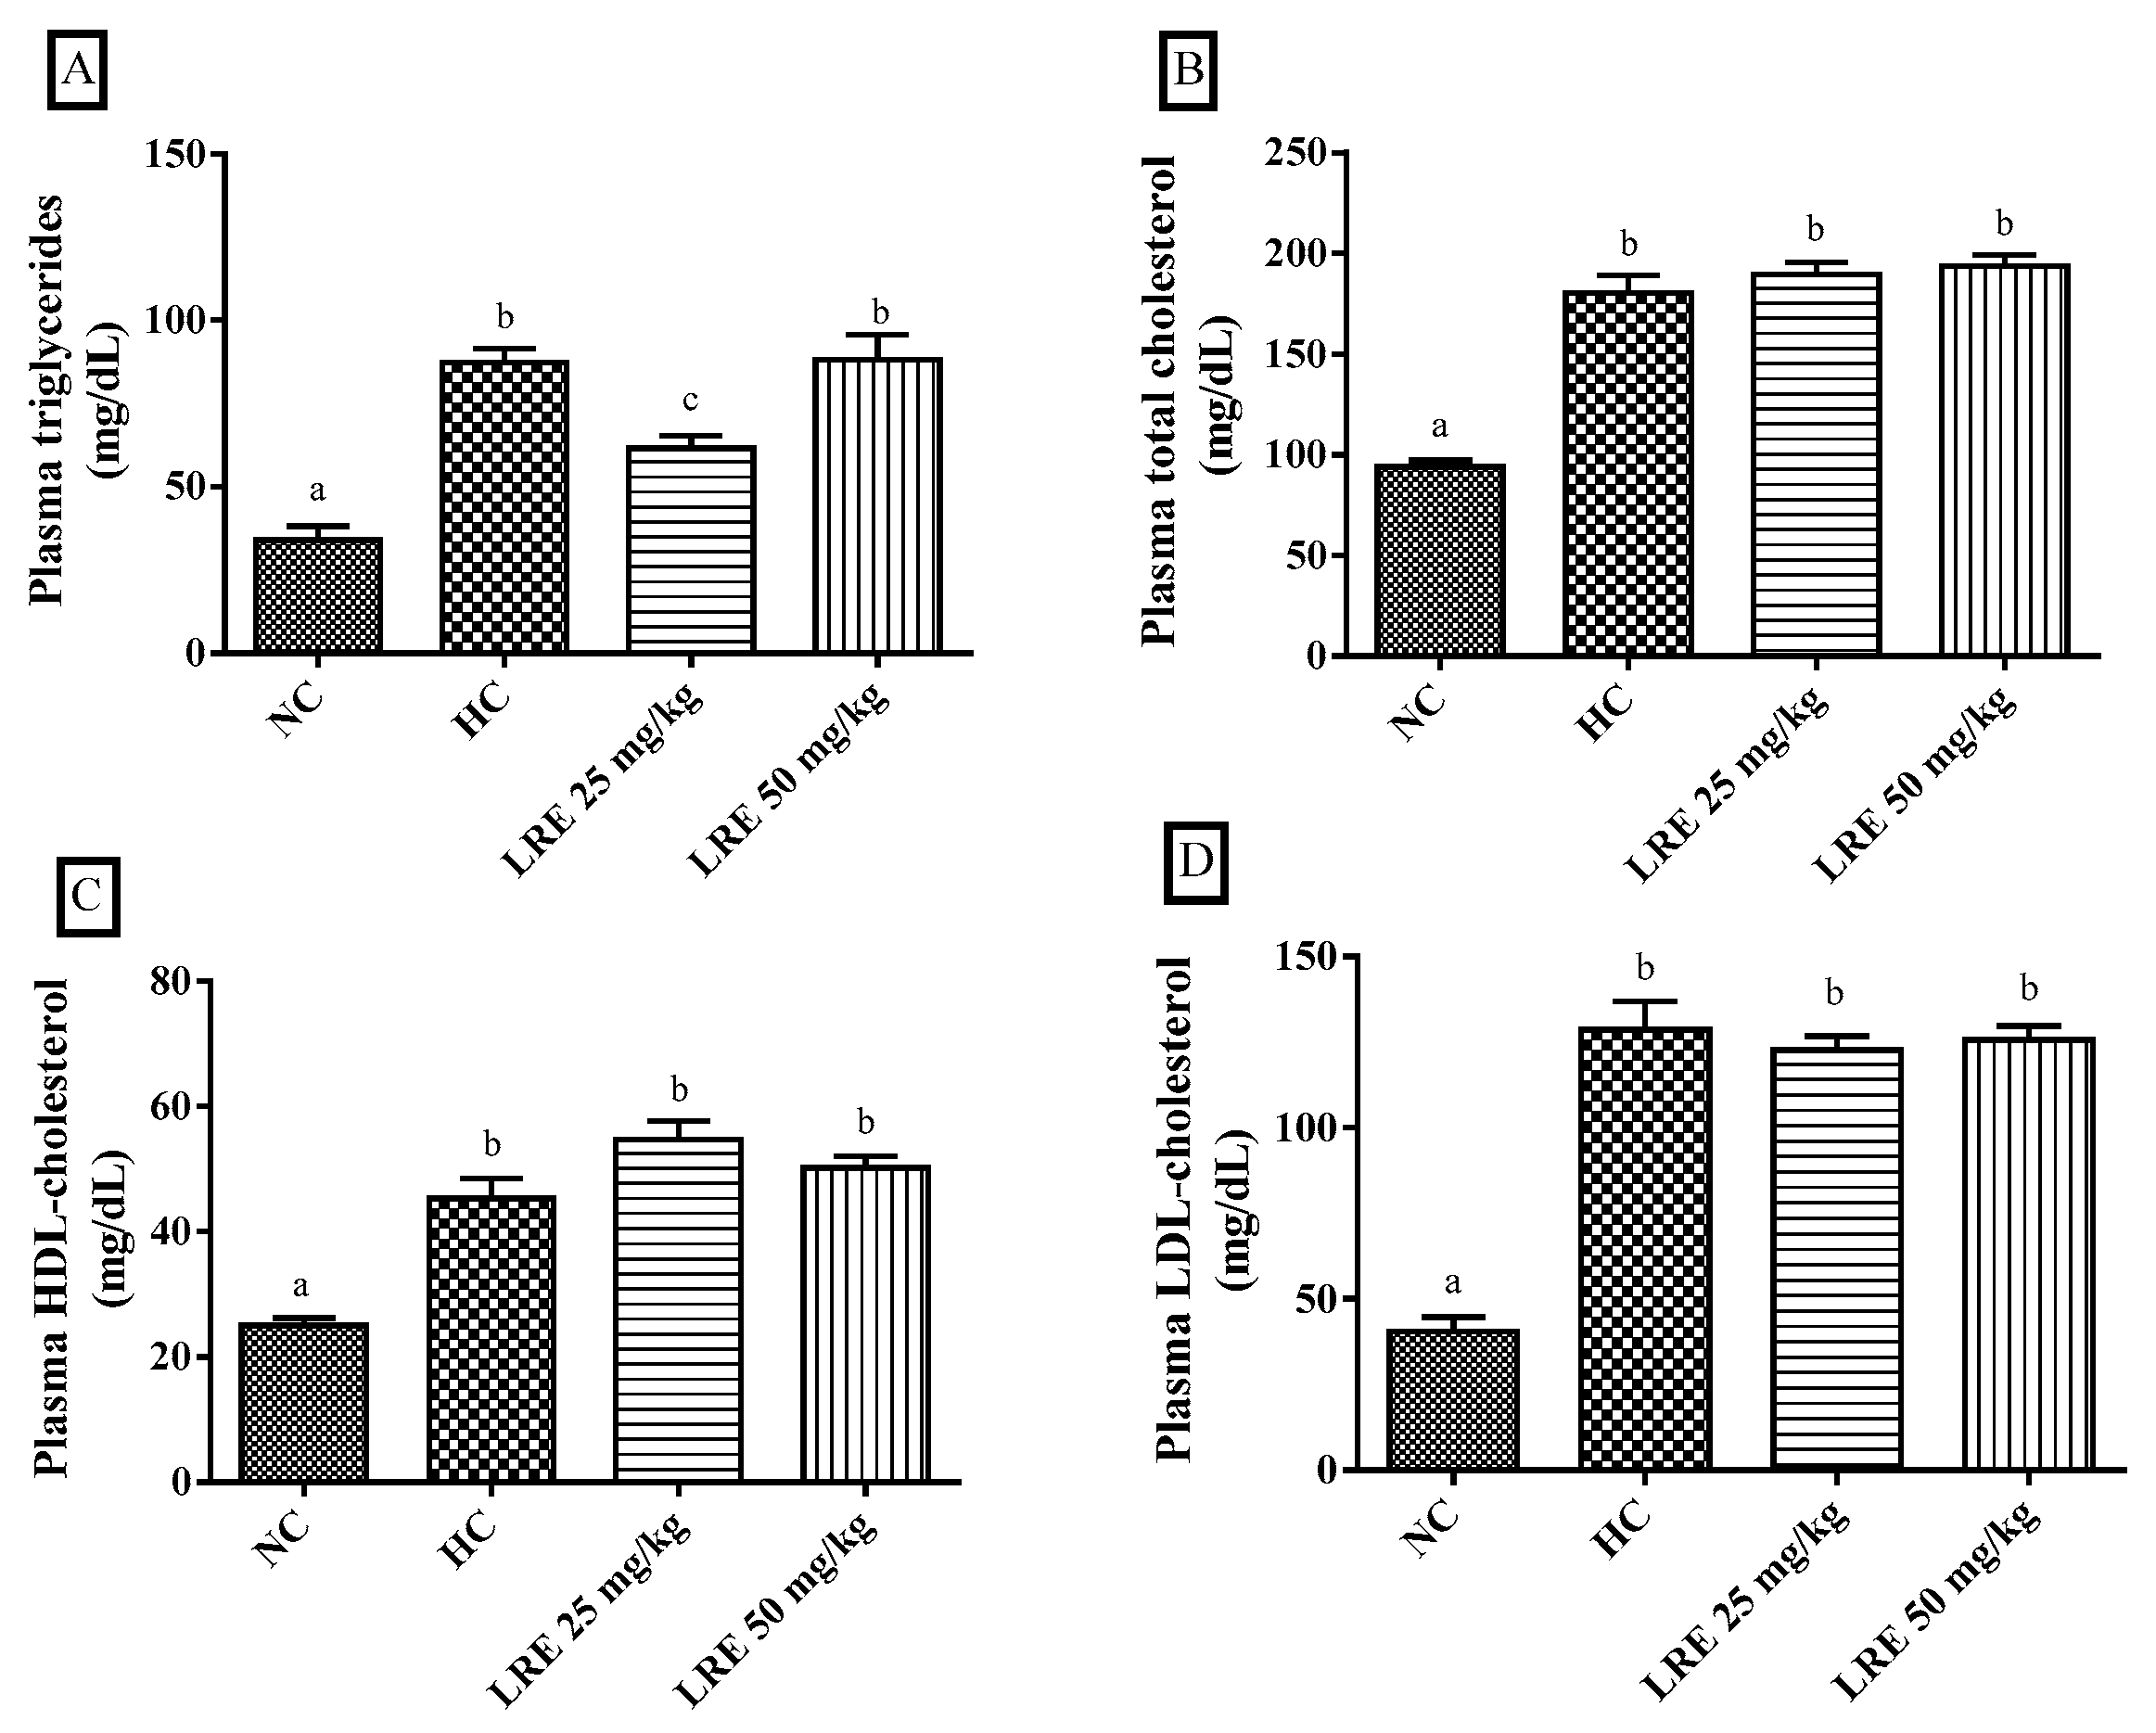
3.1. Lipid Profile
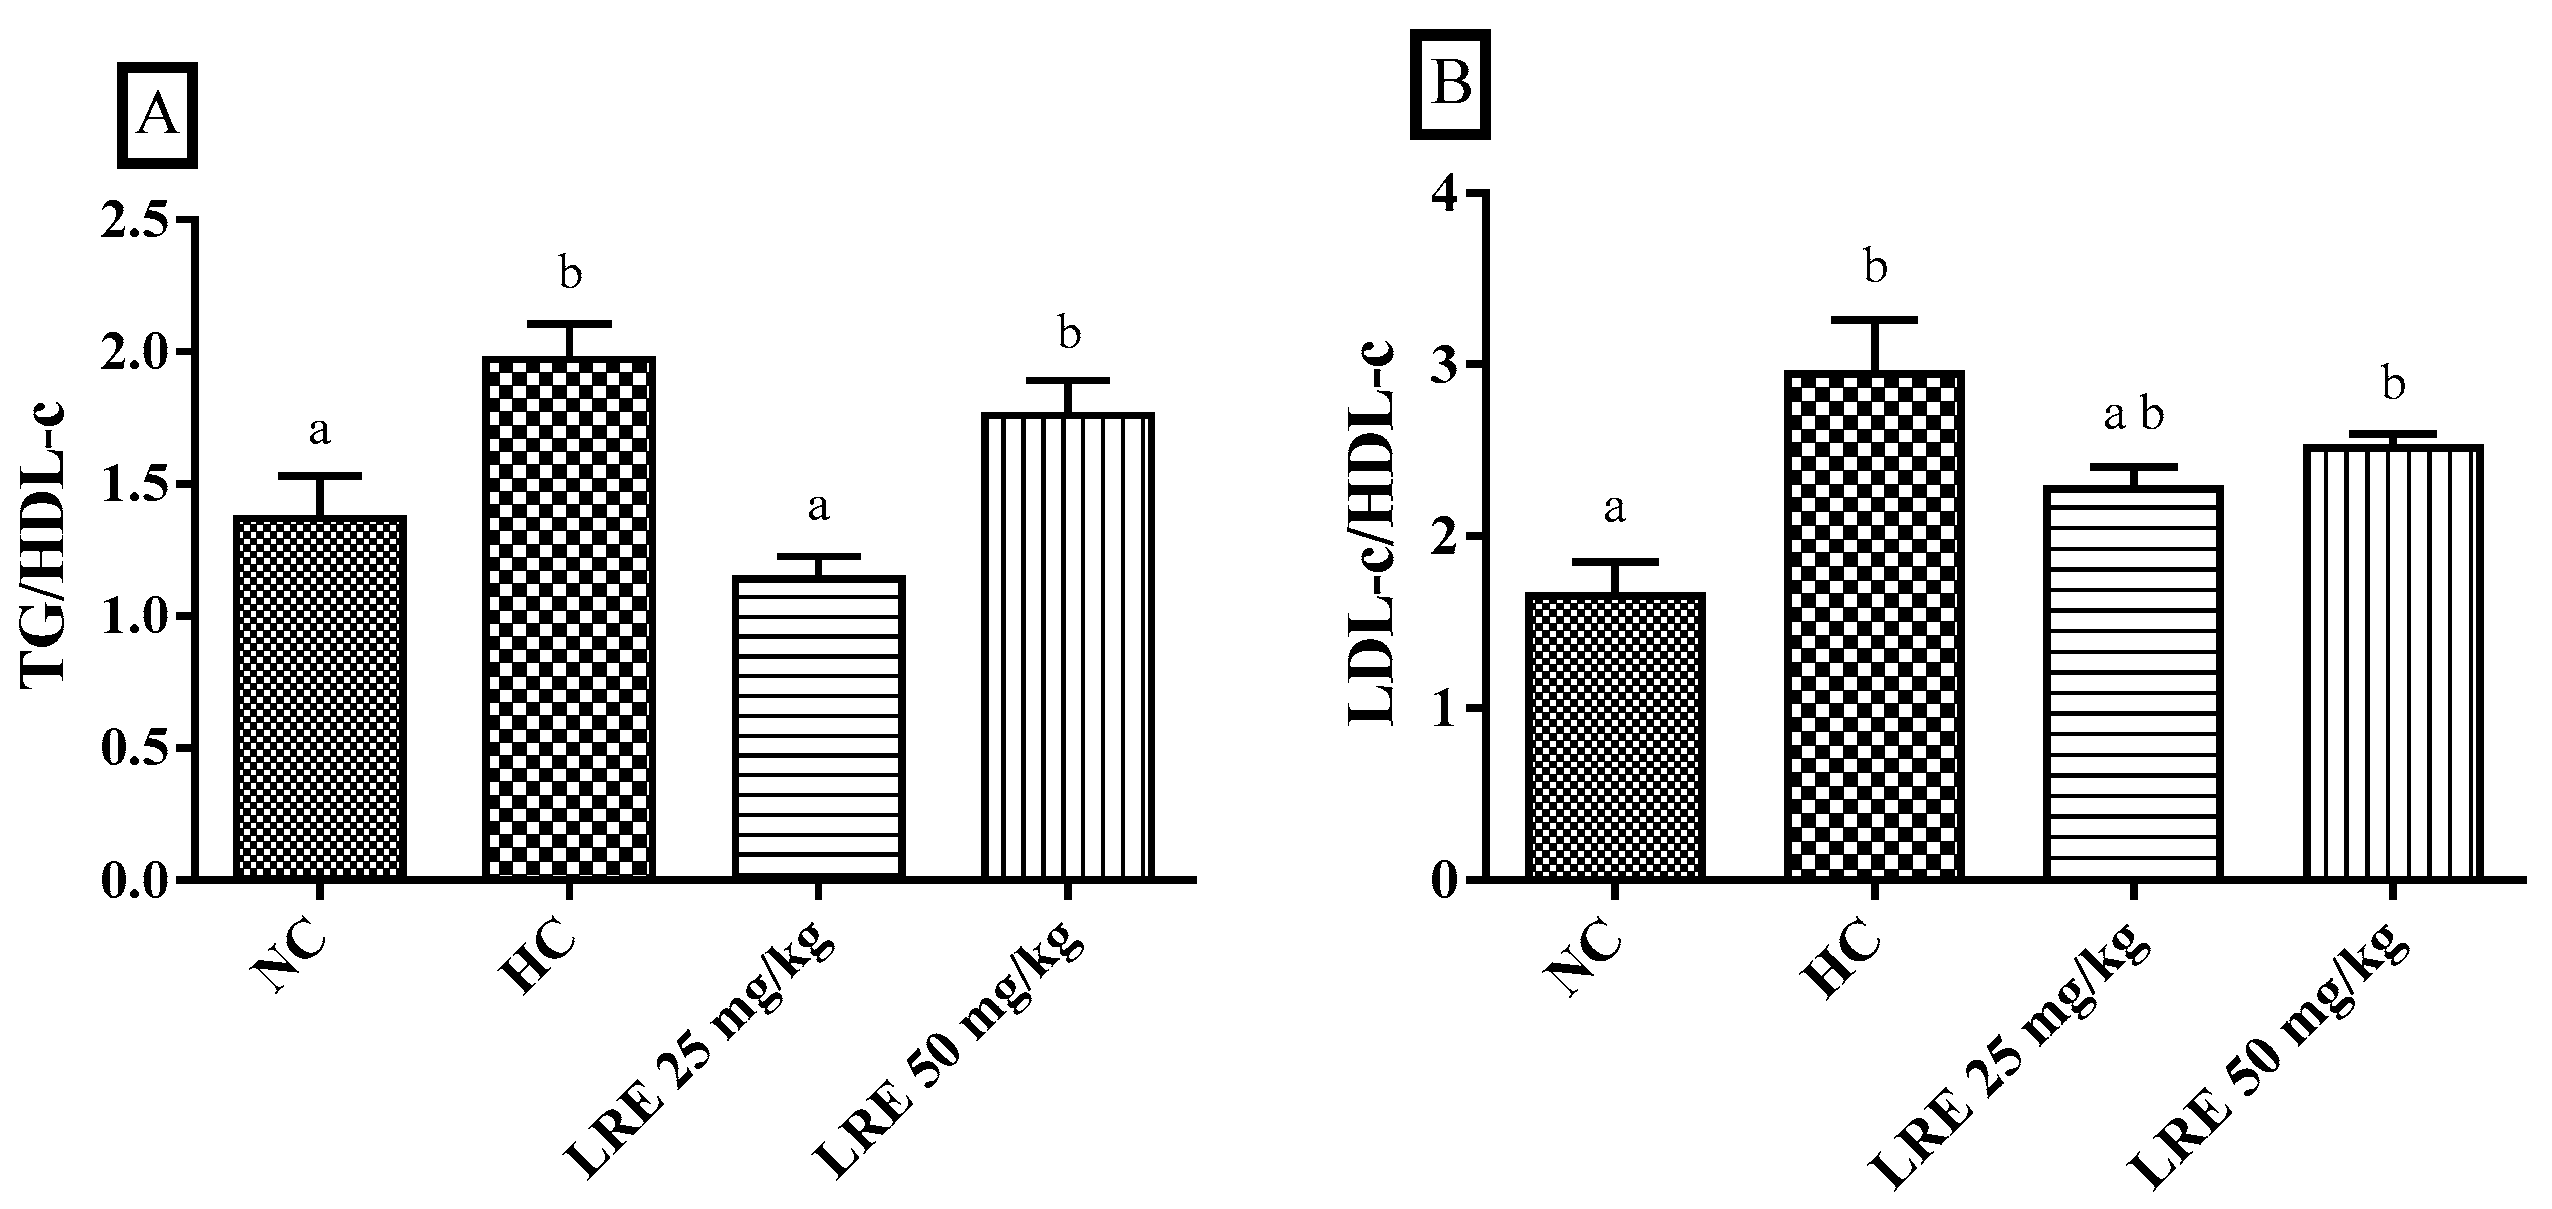
3.2. Atherogenic Indexes
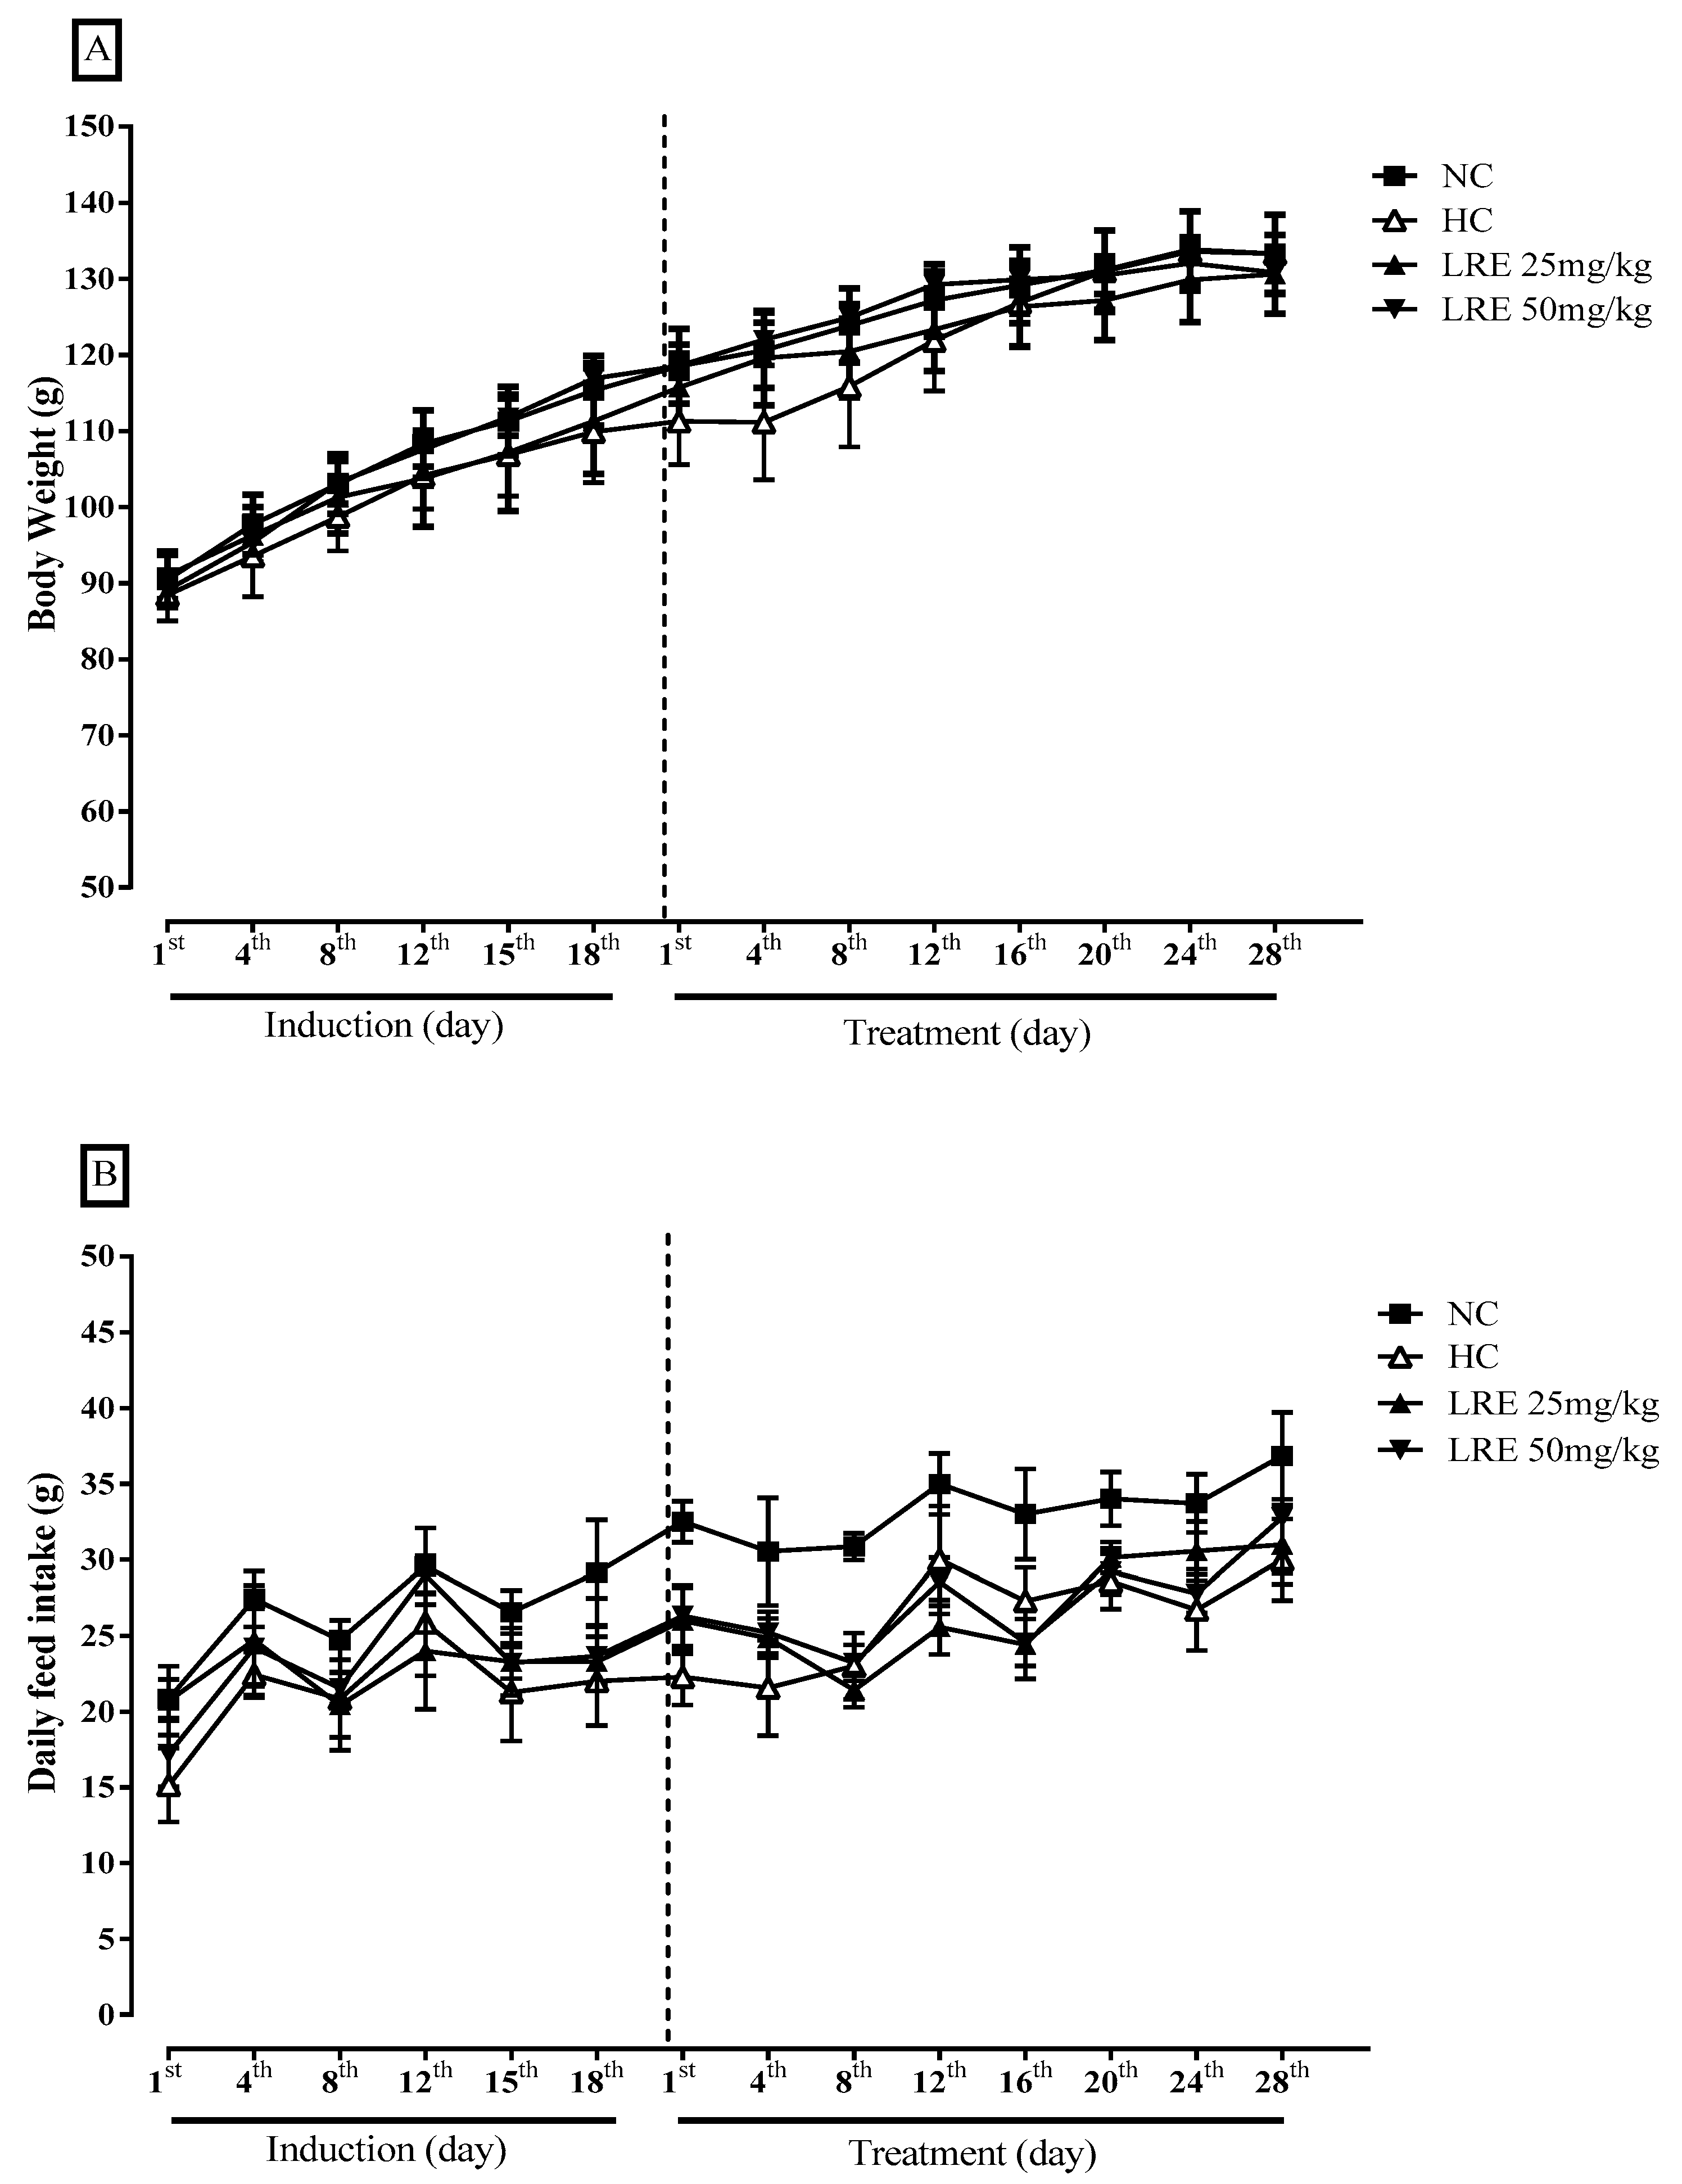
3.3. Body Weight and Feed Consumption
3.4. Oxidative Stress Biomarkers
3.5. Activity of Antioxidant Enzymes
4. Discussion
5. Conclusions
Author Contributions
Funding
Acknowledgments
Conflicts of Interest
Abbreviations
| ACOX | Peroxisomal acyl-coenzyme A oxidase |
| AIN | American Institute of Nutrition |
| BHT | butylhydroxytoluene |
| CAT | catalase |
| FI | Feed intake |
| CPT-1 | Carnitine palmitoyltransferase I |
| GPx | glutathione peroxidase |
| HC | hypercholesterolemic control |
| HDL-c | HDL cholesterol |
| HE | hematoxylin-eosin |
| HMG-CoA | 3-hydroxy-3-methyl-glutaryl-coenzyme A |
| LDL-c | LDL cholesterol |
| LDLox | oxidized low-density lipoproteins |
| LRE | lycopene-rich extract |
| MDA-h | hepatic malondialdehyde |
| MDA-p | plasma malondialdehyde |
| MPO | myeloperoxidase |
| NADPH | nicotinamide adenine dinucleotide phosphate |
| NC | normolipidemic control |
| PPAR | Peroxisome proliferator-activated receptor |
| SDS | sodium dodecyl sulfate |
| SOD-e | erythrocytic superoxide dismutas |
| SOD-h | hepatic superoxide dismutase |
| SREBP | Sterol regulatory element-binding protein |
| TBARS | thiobarbituric acid reactive substances |
| TC | total cholesterol |
| TEV | Total Energy Value |
| TG | triglycerides |
| WG | weight gain |
References
- Faludi, A.A.; Izar, M.C.D.O.; Saraiva, J.F.K.; Chacra, A.P.M.; Bianco, H.T.; Afiune Neto, A.; Bertolami, A.; Pereira, A.C.; Lottenberg, A.M.; Sposito, A.C.; et al. Atualização da Diretriz Brasileira de Dislipidemias e Prevenção da Aterosclerose. Arq. Bras. Cardiol. 2017, 109, 1–76. [Google Scholar] [CrossRef] [PubMed]
- Corrêa-Camacho, C.R.; Dias-Melicio, L.A.; Soares, A.M.V.C. Aterosclerose, uma resposta inflamatória. Arq. Ciênc. Saúde. 2007, 14, 41–48. [Google Scholar]
- World Health Organization. Cardiovascular Diseases (CVDs). Available online: http://www.who.int/mediacentre/factsheets/fs317/en/ (accessed on 8 January 2018).
- Yang, X.; Li, Y.; Li, Y.; Ren, X.; Zhang, X.; Hu, D.; Gao, Y.; Xing, Y.; Shang, H. Oxidative Stress-Mediated Atherosclerosis: Mechanisms and Therapies. Front. Physiol. 2017, 8, 1–16. [Google Scholar] [CrossRef] [PubMed]
- Kido, T.; Kondo, K.; Itakura, H.; Yokoyama, S. Sequential change in physicochemical properties of LDL during oxidative modification. Chem. Phys. Lipids 2015, 193, 52–62. [Google Scholar] [CrossRef] [PubMed]
- Gondim, T.M.; Moraes, L.E.P.; Fehiberg, I.; Brito, V.S. Aspectos fisiopatológicos da dislipidemia aterogênica e impactos na homestasia. Revista Brasileira de Análises Clínicas 2017, 49, 20–26. [Google Scholar] [CrossRef]
- Zhang, Y.J.; Gan, R.Y.; Li, S.; Zhou, Y.; Li, A.N.; Xu, D.P.; Li, H.B. Antioxidant phytochemicals for the prevention and treatment of chronic diseases. Molecules 2015, 20, 21138–21156. [Google Scholar] [CrossRef] [PubMed]
- Sesso, H.D.; Liu, S.; Gaziano, M.J.; Buring, J.E. Dietary lycopene, tomato-based food products and cardiovascular disease in women. J. Nutr. 2003, 133, 2336–2341. [Google Scholar] [CrossRef] [PubMed]
- Djuric, Z.; Powell, L.C. Antioxidant capacity of lycopene-containing foods. Int. J. Food Sci. Nutr. 2001, 52, 143–149. [Google Scholar]
- Vasconcelos, A.G.; Amorim, A.D.G.N.; Santos, R.C.; Souza, J.M.T.; Souza, L.K.M.; Araújo, T.S.L.; Nicolau, L.A.D.; Carvalho, L.L.; Aquino, P.E.A.; da Silva Martins, C.; et al. Lycopene rich extract from red guava (Psidium guajava L.) displays anti-inflammatory and antioxidant profile by reducing suggestive hallmarks of acute inflammatory response in mice. Food Res. Int. 2017, 99, 959–968. [Google Scholar] [CrossRef]
- Santos, R.C.; Ombredane, A.S.; Souza, J.M.T.; Vasconcelos, A.G.; Plácido, A.; Amorim, A.G.N.; Barbosa, E.A.; Lima, F.C.D.A.; Ropke, C.D.; Alves, M.M.M.; et al. Lycopene-rich extract from red guava (Psidium guajava L.) displays cytotoxic effect against human breast adenocarcinoma cell line MCF-7 via an apoptotic-like pathway. Food Res. Int. 2018, 105, 184–196. [Google Scholar] [CrossRef]
- Müller, L.; Caris-Veyrat, C.; Lowe, G.; Böhm, V. Lycopene and its antioxidant role in the prevention of cardiovascular diseases–A critical review. Crit. Rev. Food Sci. Nutr. 2016, 56, 1868–1879. [Google Scholar] [CrossRef]
- McEneny, J.; Wade, L.; Young, I.S.; Masson, L.; Duthie, G.; McGinty, A.; McMaster, C.; Thies, F. Lycopene intervention reduces inflammation and improves HDL functionality in moderately overweight middle-aged individuals. J. Nutr. Biochem. 2013, 24, 163–168. [Google Scholar] [CrossRef] [PubMed]
- Martín-Pozuelo, G.; Navarro-González, I.; González-Barrio, R.; Santaella, M.; García-Alonso, J.; Hidalgo, N.; Goméz-Galego, C.; Ros, G.; Periago, M.J. The effect of tomato juice supplementation on biomarkers and gene expression related to lipid metabolism in rats with induced hepatic steatosis. Eur. J. Nutr. 2015, 54, 933–944. [Google Scholar] [CrossRef] [PubMed]
- Costa-Rodrigues, J.; Pinho, O.; Monteiro, P.R.R. Can lycopene be considered an effective protection against cardiovascular disease? Food Chem. 2018, 245, 1148–1153. [Google Scholar] [CrossRef] [PubMed]
- Song, B.; Liu, K.; Gao, Y.; Zhao, L.; Fang, H.; Li, Y.; Pei, L.; Xu, Y. Lycopene and risk of cardiovascular diseases: A meta-analysis of observational studies. Mol. Nutr. Food Res. 2017, 61, 1–6. [Google Scholar] [CrossRef] [PubMed]
- Cheng, H.M.; Koutsidis, G.; Lodge, J.K.; Ashor, A.W.; Siervo, M.; Lara, J. Lycopene and Tomato and risk of cardiovascular diseases: A systematic review and meta-analysis of epidemiological evidence. Crit. Rev. Food Sci. Nutr. 2017, 11, 1–18. [Google Scholar] [CrossRef] [PubMed]
- Amorim, A.G.N.; Leite, J.R.S.A.; Ropke, C.D. Obtenção de extrato rico em licopeno e licopeno puro de fonte natural. Patent BR102016030594-2, 26 December 2016. [Google Scholar]
- National Research Council Guide for the Care and Use of Laboratory Animals, 8th ed.; National Academy Press: Washington, DC, USA, 2010.
- Dispõe sobre as sanções penais e administrativas derivadas de condutas e atividades lesivas ao meio ambiente, e dá outras providências; Lei n. 9.605, de 12 de fevereiro de 1998; Diário Oficial da União: Brasília, Brazil, 1998.
- Regulamenta o inciso VII do § 1º do art. 225 da Constituição Federal, estabelecendo procedimentos para o uso científico de animais; revoga a Lei n. 6.638, de 8 de maio de 1979; e dá outras providências; Lei n. 11.794, de 8 de outubro de 2008; Diário Oficial da União: Brasília, Brazil, 2008.
- Bravo, E.; Cantafora, A.; Calcabrini, A.; Ortu, G. Why prefer the goldem Sirium hamster (Mesocricetus auratus) to the Wistar rat in experimental studies on plasma lipoprotein metabolism? Comp. Biochem. Physiol. 1994, 107, 347–355. [Google Scholar]
- AOAC-Association of Offccial Analytical Chemists; AOAC International: Gaithersburg, MD, USA, 2007.
- Draper, M.W.; Flowers, D.E.; Huster, W.J.; Neild, J.A.; Harper, K.D.; Arnaud, C. A controlled trial of raloxifene (LY139481) HCl: Impact on bone turnover and serum lipid profile in healthy postmenopausal women. J. Bone Miner. Res. 1996, 11, 835–842. [Google Scholar] [CrossRef]
- Dobiášová, M.; Frohlich, J. The plasma parameter log (TG/HDL-C) as an atherogenic index: Correlation with lipoprotein particle size and esterification rate inapoB-lipoprotein-depleted plasma (FER HDL). Clin. Biochem. 2001, 34, 583–588. [Google Scholar] [CrossRef]
- Ohkawa, H.; Ohishi, N.; Yagi, K. Assay for lipid peroxides in animal tissues by thiobarbituric acid reaction. Anal. Biochem. 1979, 95, 351–358. [Google Scholar] [CrossRef]
- Pyles, L.A.; Stejskal, E.; Einzing, S. Spectrophotometric measurement of plasma 2-thiobarbituric acid-reactive substances in the presence of hemoglobin and bilirubin interfernce. Proc. Soc. Exp. Biol. Med. 1993, 202, 407–419. [Google Scholar] [CrossRef]
- Bradley, P.P.; Priebat, D.A.; Christensen, R.D.; Rothstein, G. Measurement of cutaneous inflammation: estimation of neutrophil content with an enzyme marker. J. Invest. Dermatol. 1982, 78, 206–209. [Google Scholar] [CrossRef] [PubMed]
- Beutler, E. Metabolismo das células vermelhas: um manual de métodos bioquímicos; Grune & Stratton: New York, NY, USA, 1975. [Google Scholar]
- Sies, H.; Koch, O.R.; Martino, E.; Boveris, A. Increased biliary glutathione disulfide release in chronically ethanol-treated rats. FEBS let. 1979, 103, 287–290. [Google Scholar] [CrossRef]
- McCord, J.M.; Fridovich, I. Superoxide dismutase an enzymic function for erythrocuprein (hemocuprein). J. Biol. Chem. 1969, 244, 6049–6055. [Google Scholar] [PubMed]
- Das, K.; Samanta, L.; Chainy, G.B.D. A modified spectrophotometric assay of superoxide dismutase using nitrite formation by superoxide radicals. Indian J. Biochem. Biophys. 2000, 37, 201–204. [Google Scholar]
- Kattoor, A.J.; Pothineni, N.V.K.; Palagiri, D.; Mehta, J.L. Oxidative stress in atherosclerosis. Curr. Atheroscler. Rep. 2017, 19, 1–11. [Google Scholar] [CrossRef] [PubMed]
- Russell, J.C.; Proctor, S.D. Small animal models of cardiovascular disease: tools for the study of the roles of metabolic syndrome, dyslipidemia, and atherosclerosis. Cardiovasc. Pathol. 2006, 15, 318–330. [Google Scholar] [CrossRef] [PubMed]
- Lee, L.C.; Wei, L.; Huang, W.C.; Hsu, Y.M.; Chen, Y.M.; Huang, C.C. Hypolipidemic effect of tomato juice in hamsters in high cholesterol diet-induced hyperlipidemia. Nutrients 2015, 7, 10525–10537. [Google Scholar] [CrossRef]
- Kumar, R.; Salwe, K.J.; Kumarappan, M. Evaluation of antioxidant, hypolipidemic, and antiatherogenic property of lycopene and astaxanthin in atherosclerosis-induced rats. Pharmacognosy. Res. 2017, 9, 161–167. [Google Scholar] [CrossRef]
- Tenenbaum, A.; Klempfner, R.; Fisman, E.Z. Hypertriglyceridemia: A too long unfairly neglected major cardiovascular risk factor. Cardiovasc. Diabetol. 2014, 13, 1–10. [Google Scholar] [CrossRef]
- Fenni, S.; Hammou, H.; Astier, J.; Bonnet, L.; Karkeni, E.; Couturier, C. Lycopene and tomato powder supplementation similarly inhibit high-fat diet induced obesity, inflammatory response, and associated metabolic disorders. Mol. Nutr. Food Res. 2017, 61, 1–10. [Google Scholar] [CrossRef]
- Young, A.J.; Lowe, G.M. Antioxidant and prooxidant properties of carotenoids. Arch. Biochem. Biophys. 2001, 385, 20–27. [Google Scholar] [CrossRef] [PubMed]
- Agarwal, S.; Rao, A.V. Tomato lycopene and Low Density Lipoprotein oxidation: A human dietary intervention study. Lipids 1998, 33, 181–184. [Google Scholar] [CrossRef]
- Alvi, S.S.; Iqbal, D.; Ahmad, S.; Khan, M.S. Molecular rationale delineating the role of lycopene as a potent HMG-CoA reductase inhibitor: In vitro and in silico study. Nat. Prod. Res. 2016, 30, 2111–2114. [Google Scholar] [CrossRef] [PubMed]
- Renju, G.L.; Kurup, G.M.; Kumari, C.H.S. Effect of lycopene from Chlorella marina on high cholesterol-induced oxidative damage and inflammation in rats. Inflammopharmacology 2014, 22, 45–54. [Google Scholar] [CrossRef] [PubMed]
- Cordeiro, A.; Andrés, E.; Ordoñez, B.; León, M.; Laclaustra, M.; Grima, A.; Luengo, E.; Moreno, J.; Bés, M.; Pascual, I.; et al. Usefulness of triglycerides-to–high-density lipoprotein cholesterol ratio for predicting the first coronary event in men. Am. J. Cardiol. 2009, 104, 1393–1397. [Google Scholar] [CrossRef]
- Mohamed, D.A.; Hamed, T.E.; Al-Okbi, S.Y. Reduction in hypercholesterolemia and risk of cardiovascular diseases by mixtures of plant food extract: a study on plasma lipid profile, oxidative stress and testosterone in rats. Grasas y aceites 2010, 61, 378–389. [Google Scholar] [CrossRef]
- Kastelein, J.J.; Van der Steeg, W.A.; Holme, I.; Gaffney, M.; Cater, N.B.; Barter, P.; Deedwania, P.; Olsson, A.G.; Boekholdt, S.M.; et al. Lipids, apolipoproteins, and their ratios in relation to cardiovascular events with statin treatment. Circulation 2008, 117, 3002–3009. [Google Scholar] [CrossRef]
- Kunutsor, S.K.; Zaccardi, F.; Karppi, J.; Kurl, S.; Laukkanen, J.A. Is high serum LDL/HDL cholesterol ratio an emerging risk factor for sudden cardiac death? Findings from the KIHD study. J. Atheroscler. Thromb. 2016, 37184. [Google Scholar] [CrossRef]
- El-Nashar, N.N.; Abduljawad, S.H. Impact effect of lycopene and tomato-based products network on cardio-protective biomarkers in vivo. Funct. Food. Health Dis. 2012, 2, 151–165. [Google Scholar] [CrossRef]
- Salem, S.A. Effect of two carotenoids (lycopene and βcarotene) supplementation on hyperlipidemia and lipid peroxidation in experimental albino rats. J. High Inst. Public Health 2015, 45, 1–7. [Google Scholar] [CrossRef]
- Napoli, C.; Lerman, L.O. Involvement of oxidation-sensitive mechanisms in the cardiovascular effects of hypercholesterolemia. Mayo Clin. Proc. 2001, 76, 619–630. [Google Scholar] [CrossRef]
- Esterbauer, H.; Schaur, R.J.; Zollner, H. Chemistry and Biochemistry of 4-hydroxynonenal, malonaldehyde and related aldehydes. Free Radic. Biol. Med. 1991, 11, 81–128. [Google Scholar] [CrossRef]
- Tapiero, H.; Townsend, D.M.; Tew, K.D. The role of carotenoids in the prevention of human pathologies. Biomed. Pharmacother. 2004, 58, 100–110. [Google Scholar] [CrossRef] [PubMed]
- Reifen, R.; Nissenkorn, A.; Matas, Z.; Bujanover, Y. 5-ASA and lycopene decrease the oxidative stress and inflammation induced by iron in rats with colitis. J. Gastroenterol. 2004, 39, 514–519. [Google Scholar] [CrossRef] [PubMed]
- Britton, G. Structure and properties of carotenoids in relation to function. FASEB J. 1995, 9, 1551–1558. [Google Scholar] [CrossRef] [PubMed]
- Taniyama, Y.; Griendling, K.K. Reactive oxigen species in the vasculature: molecular and celular mechanisms. Hypertension 2003, 42, 1075–1081. [Google Scholar] [CrossRef] [PubMed]
- Podrez, E.A.; Abu-Sou, H.M.; Hazem, S.L. Myeloperoxidase-generated oxidants and atherosclerosis. Free Radic. Biol. Med. 2000, 28, 1717–1725. [Google Scholar] [CrossRef]
- Carr, A.C.; McCall, M.R.; Frei, B. Oxidation of LDL by myeloperoxidase and reative nitrogen species—Reaction pathways and antioxidants protection. Arterioscler. Thromb. Vasc. Biol. 2000, 20, 1716–1723. [Google Scholar] [CrossRef]
- Michiels, C.; Raes, M.; Toussaint, O.; Remacle, J. Importance of Se-glutathione peroxidase, catalase and CU/Zn-SOD for cell suvival against oxidative stress. Free Radic. Biol. Med. 1994, 17, 235–248. [Google Scholar] [CrossRef]
- Pisoschi, A.M.; Pop, A. The role of antioxidants in the chemistry of oxidative stress: A review. Eur. J. Med. Chem. 2015, 97, 55–74. [Google Scholar] [CrossRef]
- Breinholt, V.; Lauridsen, S.T.; Daneshvar, B.; Jakobsen, J. Dose-response effects of lycopene on selected drug-metabolizing and antioxidant enzymes in the rat. Cancer Lett. 2000, 154, 201–210. [Google Scholar] [CrossRef]
- Nquyen, P.; Leray, V.; Diez, M.; Serisier, S.; Le Bloc’h, J.; Siliart, B.; Dumon, H. Liver lipid metabolism. J. Anim. Physiol. Anim. Nutr. 2007, 92, 272–283. [Google Scholar] [CrossRef]
- Lupton, J.R.; Atkinson, S.A.; Chang, N.; Fraga, C.G.; Levy, J.; Messina, M.; Richardson, D.P.; Ommen, B.; Yang, Y.; Griffiths, J.C.; et al. Exploring the benefits and challenges of establishing a DRI-like process for bioactives. Eur. J. Nutr. 2014, 53, 1–9. [Google Scholar] [CrossRef] [PubMed]
- Toti, E.; Chen, C.Y.O.; Palmeri, M.; Valencia, D.V.; Peluso, I. Non-provitamin A and provitamin A carotenoids as immunomodulators: recommended dietary allowance, therapeutic index, or personalized nutrition? Oxid. Med. Cell. Longev. 2018, 1–20. [Google Scholar] [CrossRef] [PubMed]
- Amorim, A.G.N.; Souza, J.M.T.; Santos, R.C.; Gullón, B.; Oliveira, A.; Santos, L.F.A.; Virgino, A.L.E.; Mafud, A.C.; Petrilli, H.M.; Mascarenhas, Y.P.; et al. HPLC-DAD, ESI–MS/MS, and NMR of Lycopene Isolated From P. guajava L. and Its Biotechnological Applications. Eur. J. Lipid. Sci. Technol. 2018, 120, 1700330. [Google Scholar] [CrossRef]


| Component | Normolipidemic Feed | Hypercholesterolemic Feed |
|---|---|---|
| Moisture (%) | 10.2 ± 0.1 | 6.85 ± 0.17 * |
| Ashes (%) | 7.8 ± 0.1 | 4.80 ± 0.19 * |
| Lipids (%) | 3.3 ± 0.1 | 14.61 ± 0.07 * |
| Proteins (%) | 20.9 ± 0.4 | 19.06±1.00 |
| Carbohydrate # (%) | 68.2 ± 0.3 | 61.30 ± 0.80 * |
| TEV (KJ.g−1) | 16.36 | 19.00 |
© 2019 by the authors. Licensee MDPI, Basel, Switzerland. This article is an open access article distributed under the terms and conditions of the Creative Commons Attribution (CC BY) license (http://creativecommons.org/licenses/by/4.0/).
Share and Cite
Brito, A.K.d.S.; Lima, G.d.M.; Farias, L.M.d.; Rodrigues, L.A.R.L.; Carvalho, V.B.L.d.; Pereira, C.F.d.C.; Frota, K.d.M.G.; Conde-Júnior, A.M.; Silva, A.M.O.; Rizzo, M.d.S.; et al. Lycopene-Rich Extract from Red Guava (Psidium guajava L.) Decreases Plasma Triglycerides and Improves Oxidative Stress Biomarkers on Experimentally-Induced Dyslipidemia in Hamsters. Nutrients 2019, 11, 393. https://doi.org/10.3390/nu11020393
Brito AKdS, Lima GdM, Farias LMd, Rodrigues LARL, Carvalho VBLd, Pereira CFdC, Frota KdMG, Conde-Júnior AM, Silva AMO, Rizzo MdS, et al. Lycopene-Rich Extract from Red Guava (Psidium guajava L.) Decreases Plasma Triglycerides and Improves Oxidative Stress Biomarkers on Experimentally-Induced Dyslipidemia in Hamsters. Nutrients. 2019; 11(2):393. https://doi.org/10.3390/nu11020393
Chicago/Turabian StyleBrito, Ana Karolinne da Silva, Geovanni de Morais Lima, Luciana Melo de Farias, Lays Arnaud Rosal Lopes Rodrigues, Vanessa Brito Lira de Carvalho, Cristian Francisco de Carvalho Pereira, Karoline de Macedo Gonçalves Frota, Airton Mendes Conde-Júnior, Ana Mara Oliveira Silva, Márcia dos Santos Rizzo, and et al. 2019. "Lycopene-Rich Extract from Red Guava (Psidium guajava L.) Decreases Plasma Triglycerides and Improves Oxidative Stress Biomarkers on Experimentally-Induced Dyslipidemia in Hamsters" Nutrients 11, no. 2: 393. https://doi.org/10.3390/nu11020393