Personalized Nutrient Profiling of Food Patterns: Nestlé’s Nutrition Algorithm Applied to Dietary Intakes from NHANES

1
Nestlé Research, Vers-chez-les-Blanc, 1000 Lausanne 26, Switzerland
2
Center for Public Health Nutrition, University of Washington, Seattle, WA 98195-3410, USA
*
Author to whom correspondence should be addressed.
Nutrients 2019, 11(2), 379; https://doi.org/10.3390/nu11020379
Submission received: 27 December 2018
/
Revised: 4 February 2019
/
Accepted: 6 February 2019
/
Published: 12 February 2019
Abstract
:Nutrient profiling (NP) models have been used to assess the nutritional quality of single foods. NP methodologies can also serve to assess the quality of total food patterns. The objective of this study was to construct a personalized nutrient-based scoring system for diet quality and optimal calories. The new Nestlé Nutrition Algorithm (NNA) is based on age and gender-specific healthy ranges for energy and nutrient intakes over a 24 h period. To promote nutrient balance, energy and nutrient intakes either below or above pre-defined healthy ranges are assigned lower diet quality scores. NNA-generated diet quality scores for female 2007–2014 National Health and Nutrition Examination Survey (NHANES) participants were compared to their Healthy Eating Index (HEI) 2010 scores. Comparisons involved correlations, joint contingency tables, and Bland Altman plots. The NNA approach showed good correlations with the HEI 2010 scores. NNA mean scores for 7 days of two exemplary menu plans (MyPlate and DASH) were 0.88 ± 0.05 (SD) and 0.91 ± 0.02 (SD), respectively. By contrast, diets of NHANES participants scored 0.45 ± 0.14 (SD) and 0.48 ± 0.14 on first and second days, respectively. The NNA successfully captured the high quality of MyPlate and Dietary Approaches to Stop Hypertension (DASH) menu plans and the lower quality of diets actually consumed in the US.
1. Introduction
Nutrient profiling (NP) models were developed to assess nutrient density of individual foods [1] expressed per 100 kcal, 100 g, or per serving [2]. Favorable nutrient profiles have provided the scientific basis for the adjudication of nutrition and health claims and for front-of-pack labels and logos [3]. Unfavorable nutrient profiles, largely linked to excessive food content of calories, fat, sugar, and salt, have been used to develop warning labels and to limit marketing and advertising to children [4,5,6,7]. The food industry has also used NP modeling methods to evaluate and (re)formulate product portfolios [8].
While most of the existing NP models apply to single foods, the current emphasis in public health nutrition is on nutrient density of habitual food patterns [9,10]. NP methods, often based on nutrients-to-calories ratio, were recently used to evaluate the nutrient balance of MyPlate meals [11]. Most recently, the Nutrient Rich Food (NRF9.3) index was used for a standardized analysis of diet quality for children and adults in nationally representative nutrition surveys from Canada, Denmark, France, Spain, UK, and the US [12,13,14,15,16,17,18]. NP modeling was used to assess diet quality across countries in preference to alternative diet quality measures, such as the Healthy Eating Index (HEI).
Initially developed in 1995 [19], the HEI is a 100 point scale that measures compliance with the Dietary Guidelines for Americans, which are revised and reissued every 5 years [20]. Following the Dietary Guidelines, the HEI incorporates concepts of adequacy and moderation. The most recent versions have incorporated food groups to encourage (e.g., leafy green vegetables, whole fruit), food groups to limit (refined grains) as well as desirable nutrients (plant protein) and desirable nutrient ratios (saturated to unsaturated fat). Adjusting the HEI for 1000 kcal means that diet quality scores do not increase with higher energy intakes.
Given that the HEI is a hybrid tool, inclusive of both nutrients and food groups, its calculations critically depend on the availability of the Food Patterns Equivalents Database (FPED) formerly known as the MyPyramid Equivalents Database (MPED). The FPED converts the foods and beverages in the Food and Nutrient Database for Dietary Studies to the 37 United States Department of Agriculture (USDA) Food Patterns components that are used to calculate HEI. While FPED data are available from the USDA, they have not been calculated by agencies in Canada, Denmark, France, Spain, or the UK. For that reason, the HEI measure cannot be used outside the US.
Some countries have developed similar indices to monitor compliance with local dietary guidelines. Examples include Canada [21], Spain [22], Brazil [23], and Australia [24]. However, those approaches are far from standardized. In all cases, better compliance with dietary guidelines—variously assessed through food or nutrient consumption thresholds, ranges, or daily amounts—led to a higher diet quality scores.
The NNA is a new nutrient-based model that assesses the nutrient density of dietary patterns with no need of MPED or FPED databases. As such, the present NNA model can be applied worldwide, wherever population energy and nutrient intake data are available. Unlike the HEI approach, the NNA model is energy adjusted. Therefore, in contrast to the HEI model, under- or over-consumption of energy and nutrients leads to lower scores. This paper provides the scoring system, together with the steps taken to demonstrate its validity and reliability.
2. Materials and Methods
2.1. Nestlé Nutrition Algorithm (NNA)
The new Nestlé’ Nutrition Algorithm approach was to award maximum scores to consumption patterns that kept both energy and nutrients within the healthy range. The NNA score, illustrated in Figure 1, was based on three components.
Consumption patterns within the healthy range received a score of 100.
Consumption patterns below the healthy range received a diminishing score from 100 to 0.
Consumption patterns above the healthy range received a diminishing score from 100 to 0.
The NNA score (a number from 0–100) for dietary nutrient quality was derived from the average of nutrients included in the model for a given period of time. The model was not weighted but could be weighted in the future (or not). The period of time was 24 h but that could be different in the future (or not). This nutrient score was then multiplied by the energy score, so that intakes outside the predefined healthy energy range received lower scores.
The scoring system is shown in Figure 1. Chart a illustrates the way that points are awarded for carbohydrate, protein, total fat, fiber, potassium, calcium, magnesium, iron, food folate, and vitamins A, D, E and C. If the nutrient amount falls between Point B and C then it would receive a maximal score of 1.0. Nutrient amounts that fall between A and B, or between C and D receive partial scores. Nutrient amounts at or less than point A, or at or greater than point D receive a score of zero. The values used to define these 4 points (A, B, C and D) are provided in the adjacent table in Figure 1.
Chart b illustrates the way that points are awarded for sodium, added sugars and saturated fat. If the nutrient amount falls between Point A and B then it would receive a maximal score of 1.0. Nutrient amounts that fall between B and C receive partial scores. Nutrient amounts at or greater than point C receive a score of zero. The values used to define these 3 points (A, B and C) are provided in the adjacent table in Figure 1.
Chart c illustrates the way that points are awarded for energy. If the energy amount falls between Point B and C then it would receive a maximal score of 1.0. Energy amounts that fall between A and B, or between C and D receive partial scores. Energy amounts at or less than point A, or at or greater than point D receive a score of zero. The values used to define these 4 points (A, B, C, and D) are provided in the adjacent table in Figure 1.
2.1.1. The Selection of Index Nutrients
The present calculations were based on the nutrient values for foods in the USDA’s National Nutrient Database for Standard Reference (SR), release 28. Nutrients that were selected for inclusion in the NNA were carbohydrate, protein, total fat, fiber, potassium, calcium, magnesium, iron, food folate, vitamin A, vitamin D, vitamin E, vitamin C, sodium, added sugars and saturated fat. These nutrients had been identified to be either shortfall nutrients, or nutrients consumed in excess in the US diet [25]. Values for added sugar were extracted from the USDA’s Food Patterns Equivalents Database (2011–2012).
2.1.2. Defining Healthy Ranges for Nutrients
The healthy ranges for each nutrient are based on age and gender specific Dietary Reference Intakes (DRI) (i.e., Recommended Dietary Allowance where available or else Adequate Intakes). For most micronutrients, we define the healthy range as 100–200% DRI, except vitamin C for which we define the healthy range as 100–300%. For sodium, saturated fat and added sugars the healthy range was defined as 0–100% of levels recommended by the World Health Organization. The healthy range for macronutrients was defined using the Acceptable Macronutrient Distribution Ranges (AMDRs) recommended by the Food and Nutrition Board, Institute of Medicine, National Academies. For insufficient micronutrient intakes, a score of zero was given when intake was ≤(0.5 × DRI). For micronutrient intakes above the healthy range, a score of zero was given when intake was ≥(1.5 × the upper healthy range). The present upper limit (200% DRI) is distinct from, and much lower than, the Tolerable Upper Limit (TUL) established for some nutrients by regulatory authorities and expert panels. However, if personalization of the algorithm generates a value for point D (Figure 1) that is greater than the TUL then point D should be the TUL (and not 1.5 × C).
2.1.3. Defining Healthy Ranges for Energy
Age- and gender-specific estimated energy requirements (EER) were based on equations provided by the Institutes of Medicine (2002) [26]. The healthy range for energy was based on 15% deviations below or above the calculated value. For implausible energy intakes, a score of zero was given when total energy intake was ≤(0.5 × EER). For excessive energy intakes, a score of zero was given when total energy intake was ≥(1.5 × EER).
2.2. NNA Applied to MyPlate and DASH Menu Plans
The selection of upper healthy ranges for nutrients of interest was compared to data from two publicly available menu plans that represent healthy food patterns: MyPlate [27], created by the USDA and DASH [28], sponsored by sponsored by the National Institutes of Health. Each menu plan provided complete meals (breakfast, lunch and dinner), snacks and beverages for 7 consecutive days. The nutrient composition of each menu plan was derived and reported in Appendix A. The menu plans are provided in Appendix B. The NNA scores were calculated for each of these menu plans.
Mean energy and nutrient content of the food patterns were converted to percent DRIs in order to see if they fall within the healthy ranges defined in Figure 1.
2.3. NNA Applied to NHANES 2007–2014 Dietary Intakes
NHANES data (2007–2014) were used to test the validity of the algorithm. The nutrient intakes of subjects with different profiles were scored with the NNA. For simplicity, some of the results below are illustrated only for non-pregnant women aged 31–50 years, assuming an energy requirement of 2000 kcal. Section 3.3.4. below compares the NNA scores for different sub-populations, stratified by age, gender or socio-economic status.
2.4. Statistical Analysis
Table 1 summarizes the steps taken to assess the validity of the NNA.
The statistical relationship between the total score and the single nutrient scores was evaluated through principal component analysis (PCA) and Cronbach’s coefficient. PCA was used to assess the “true” underlying dimensionality of the data, while Cronbach’s coefficient provided a measure of internal consistency, as a function of the number of items, the average covariance between item-pairs, and the variance of the total score.
2.4.1. Comparisons between NNA and HEI-2010 Using NHANES 2011–2012
The Healthy Eating Index (HEI) is a widely used measure of dietary quality. It was designed to assess diet quality and effectively it assesses the extent to which the US population adheres to the Dietary Guidelines for Americans. Although the HEI was constructed differently from our nutrition algorithm, we hypothesize that there should be agreement between these two scoring mechanisms. Therefore, we assessed the performance of our nutrition algorithm against HEI 2010, for NHANES 2011–2012.
We illustrate this for the sub-population of females 31–50 years. We scored the NHANES 2011–2012 data for day 1 with the 2010 version of HEI, and compared the results with the present NNA. To do this the simple HEI scoring algorithm method was used [29]. Nutrient analyses were based on the USDA’s Food and Nutrient Database for Dietary Studies (2011–2012) and the Food Pattern Equivalents Database (2011–2012).
The data were stratified by age and gender to yield four subgroups: male 31–50 years, female 31–50 years, male 70+ years, and female 70+. The resulting NNA scores were compared pairwise, with the T-test (null hypothesis: mean scores are equal).
NHANES participants were also assigned to a socio-economic category, ”low”, “medium” or “high”, following the same methodology as in Wang et al. (2014) [30]. The mean NNA scores were compared between the three groups, and differences between groups were assessed using a Kruskal–Wallis test for comparisons.
2.4.2. Internal Consistency
We assessed internal consistency, using the Cronbach’s coefficient. This statistic evaluates whether the different components in the score are really measuring the same construct. The Cronbach coefficient can range from 0 to 1, a higher score indicating a higher internal consistency. As a rule of thumb, values above 0.7 are generally considered to be acceptable.
2.5. NNA Applied to FPED Food Groups
In order to test whether NNA is associated with certain food patterns, we calculated the intakes of some specific food groups using the Food Patterns Equivalent Database, and compared their distributions between NNA tertiles. The Food Patterns Equivalents Database (FPED) converts the foods and beverages in the Food and Nutrient Database for Dietary Studies to the 37 USDA Food Patterns components, and it is publicly available. We used FPED 2011–2012 to calculate the intakes of the following food groups in a subset of the NHANES participants: (a) dark green vegetables; (b) red and orange vegetables (excluding tomatoes); (c) cured meat; (d) citrus, melons, and berries; (e) solid fats; (f) whole grains; (g) refined grains; and (h) whole fruits. We refer to the FPED documentation for the exact definition of which foods are included in each group [31].
We considered non-pregnant women aged 31–50 years, energy intake of 1700–2300 kcal. We split the dataset in NNA tertiles and compared the distributions of intakes for each food group.
3. Results
3.1. NNA Applied to MyPlate and DASH Menu Plans
The MyPlate and DASH menu plans provided 7 days of complete meals (breakfast, lunch, and dinner), snacks and beverages. The NNA scores for the 7 days of each of these menu plans were. 0.88 ± 0.05 (SD) for MyPlate and 0.91 ± 0.02 (SD) for DASH.
Relative Validation of Healthy Ranges
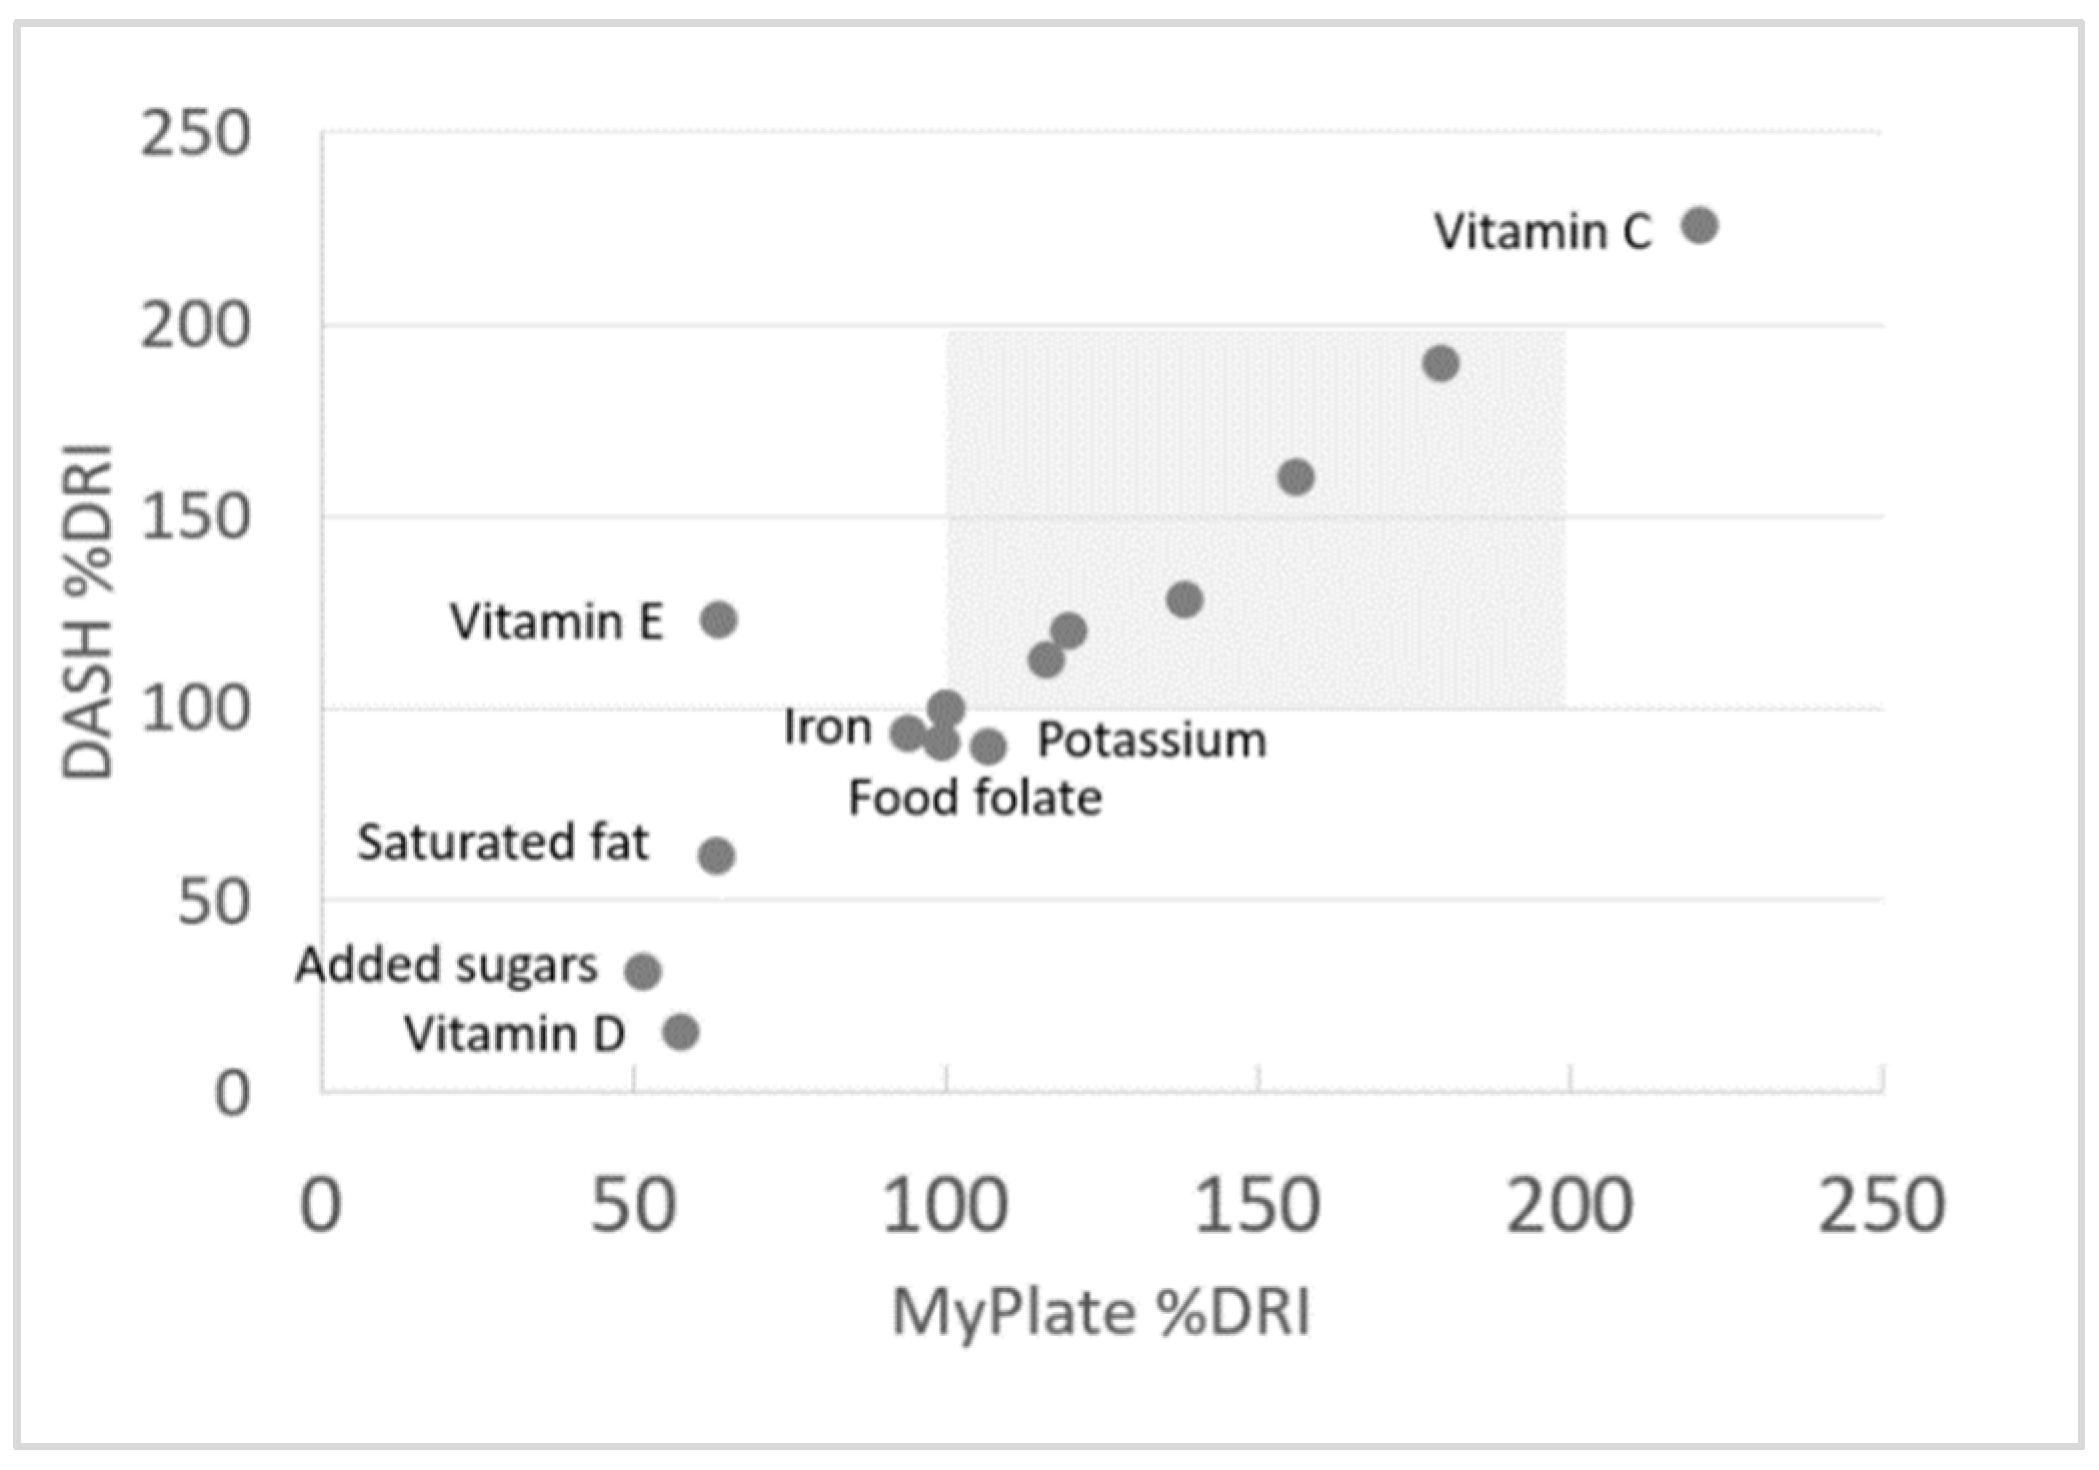
A scatterplot of percent RDIs for the mean nutrient values from the MyPlate and DASH menu plans are shown in Figure 2. Figure 2 shows that vitamins and minerals in MyPlate and Dash meals were mostly within the 100%–175% daily value range. Given the emphasis on vegetables and fruit in MyPlate and in DASH, vitamin C levels were far in excess of requirements. Both MyPlate and DASH were careful to limit saturated fat, added sugars, and sodium—mean values were at or below maximum recommended values. Vitamin E was short of the DRI in MyPlate (not in DASH) whereas vitamin D was low in both.
The present choice of 100%–200% of age and gender specific RDAs was thus validated relative to MyPlate and DASH.
3.2. NNA Applied to NHANES 2007–2014 Dietary Intakes
The NNA scores for the non-pregnant women aged 31–50 years who took part in the NHANES dietary surveys between 2007–2014 were 0.45 ± 0.14 (SD) and 0.48 ± 0.14 (SD) for days 1 and 2, respectively. Sample sizes were 743 and 605, respectively. The scores for individual nutrients are shown in Table 2.
3.3. Comparisons between NNA and HEI-2010 using NHANES 2011–2012
For simplicity, since the definition of the Healthy Eating Index has changed over time, we limit the comparison between NNA and HEI to the HEI 2010 and the 2011–2012 cycle of NHANES.
3.3.1. Correlations
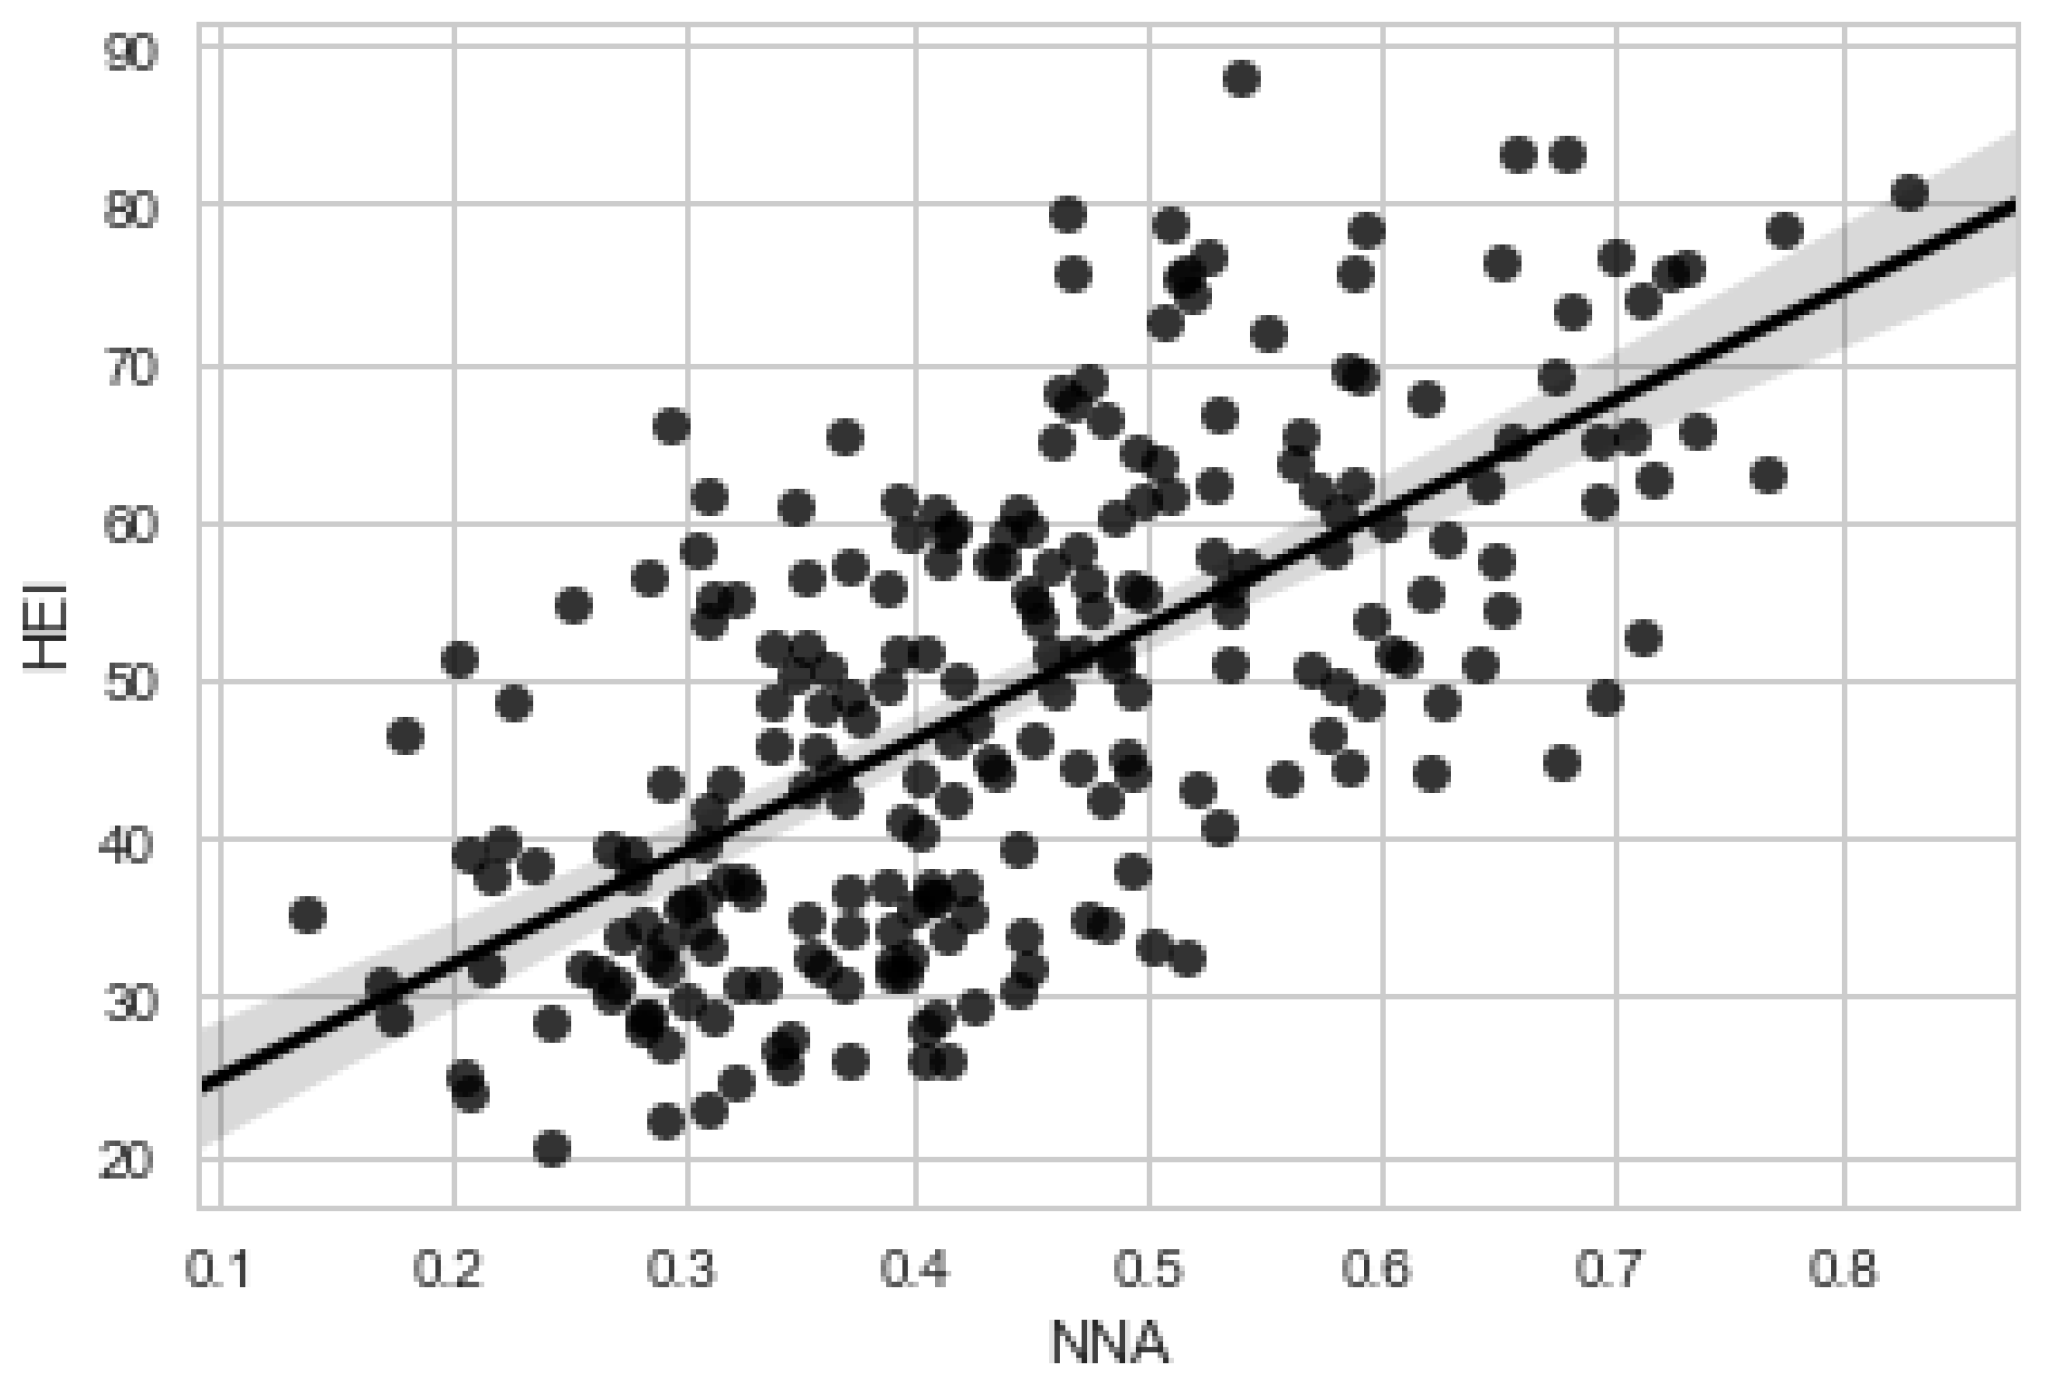
We first calculated the Pearson correlation coefficient between the two scores, without any restrictions on energy intake (n = 1348 women, 31–50 years). Then we restricted the analysis to those women whose caloric intakes were between 1700 and 2300 kcal (Day 1, n = 155; Day 2, n = 135). The data are shown in Figure 3.
Pearson correlation coefficients between HEI and the NNA for women aged 31–50 years and without energy restriction were 0.32 for Day 1 and 0.22 for Day 2. With energy restriction, the correlations were 0.69 (Day 1) and 0.54 (Day 2).
3.3.2. Bland–Altman Plots (Women Aged 31–50 Years, Non-Pregnant and Non-Lactating)
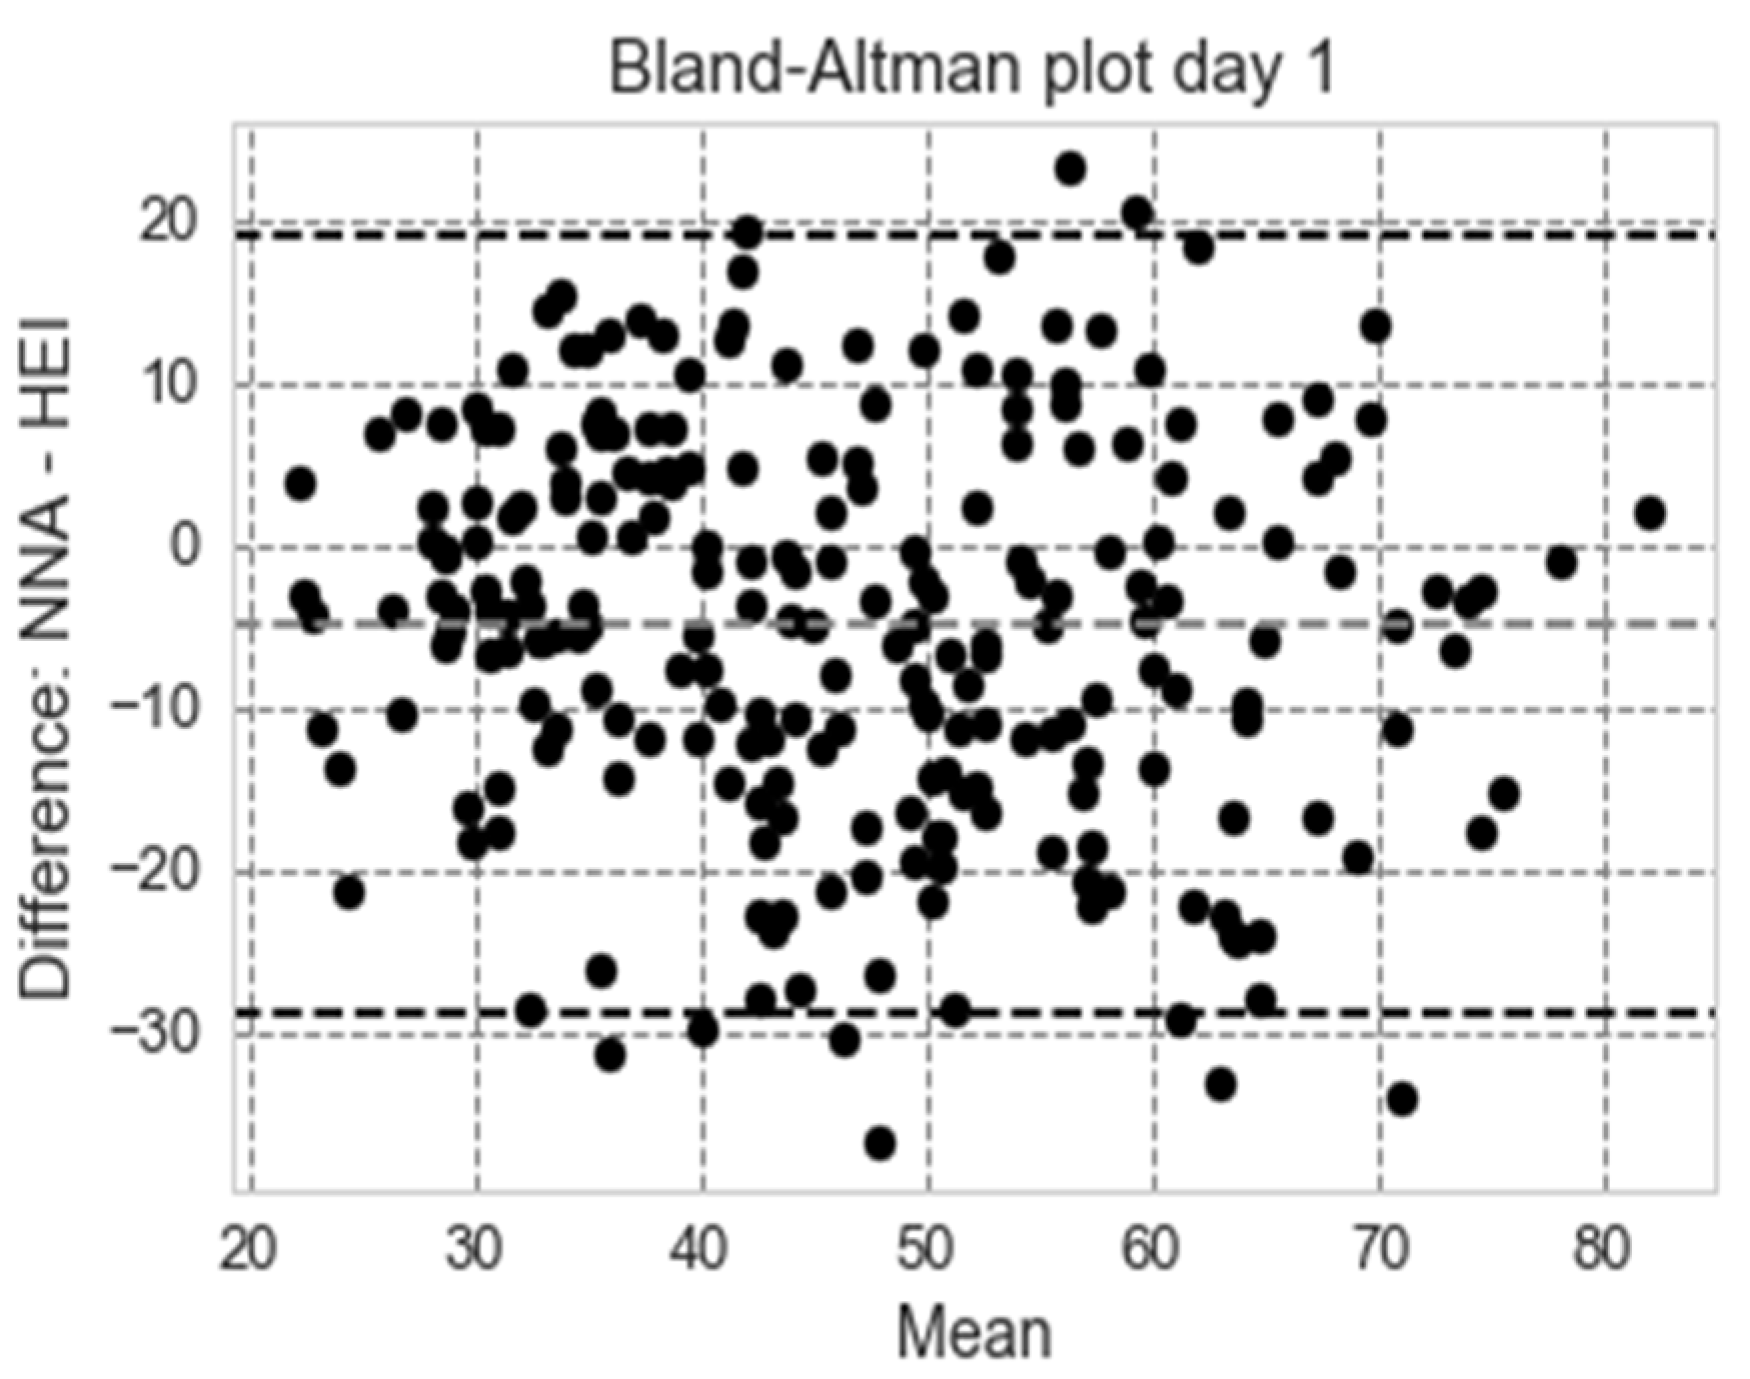
A standard way to evaluate the agreement between two methods of measurement is through Bland–Altman plots [32]. The Bland–Altman analysis shows a bias of −4.48 (day 1) and −3.84 (day 2), meaning that our nutrition score is generally lower that HEI 2010; in addition, 95.04 percentage points (day 1) and 95.62 percentage points (day 2) were within the limits of agreement. The Bland–Altman plots for agreement (with 95% confidence), restricted to the 1700–2300 range, are shown in Figure 4 for day 1.
3.3.3. Analysis by Quartile (Women Aged 31–50 Years, Non-Pregnant and Non-Lactating)
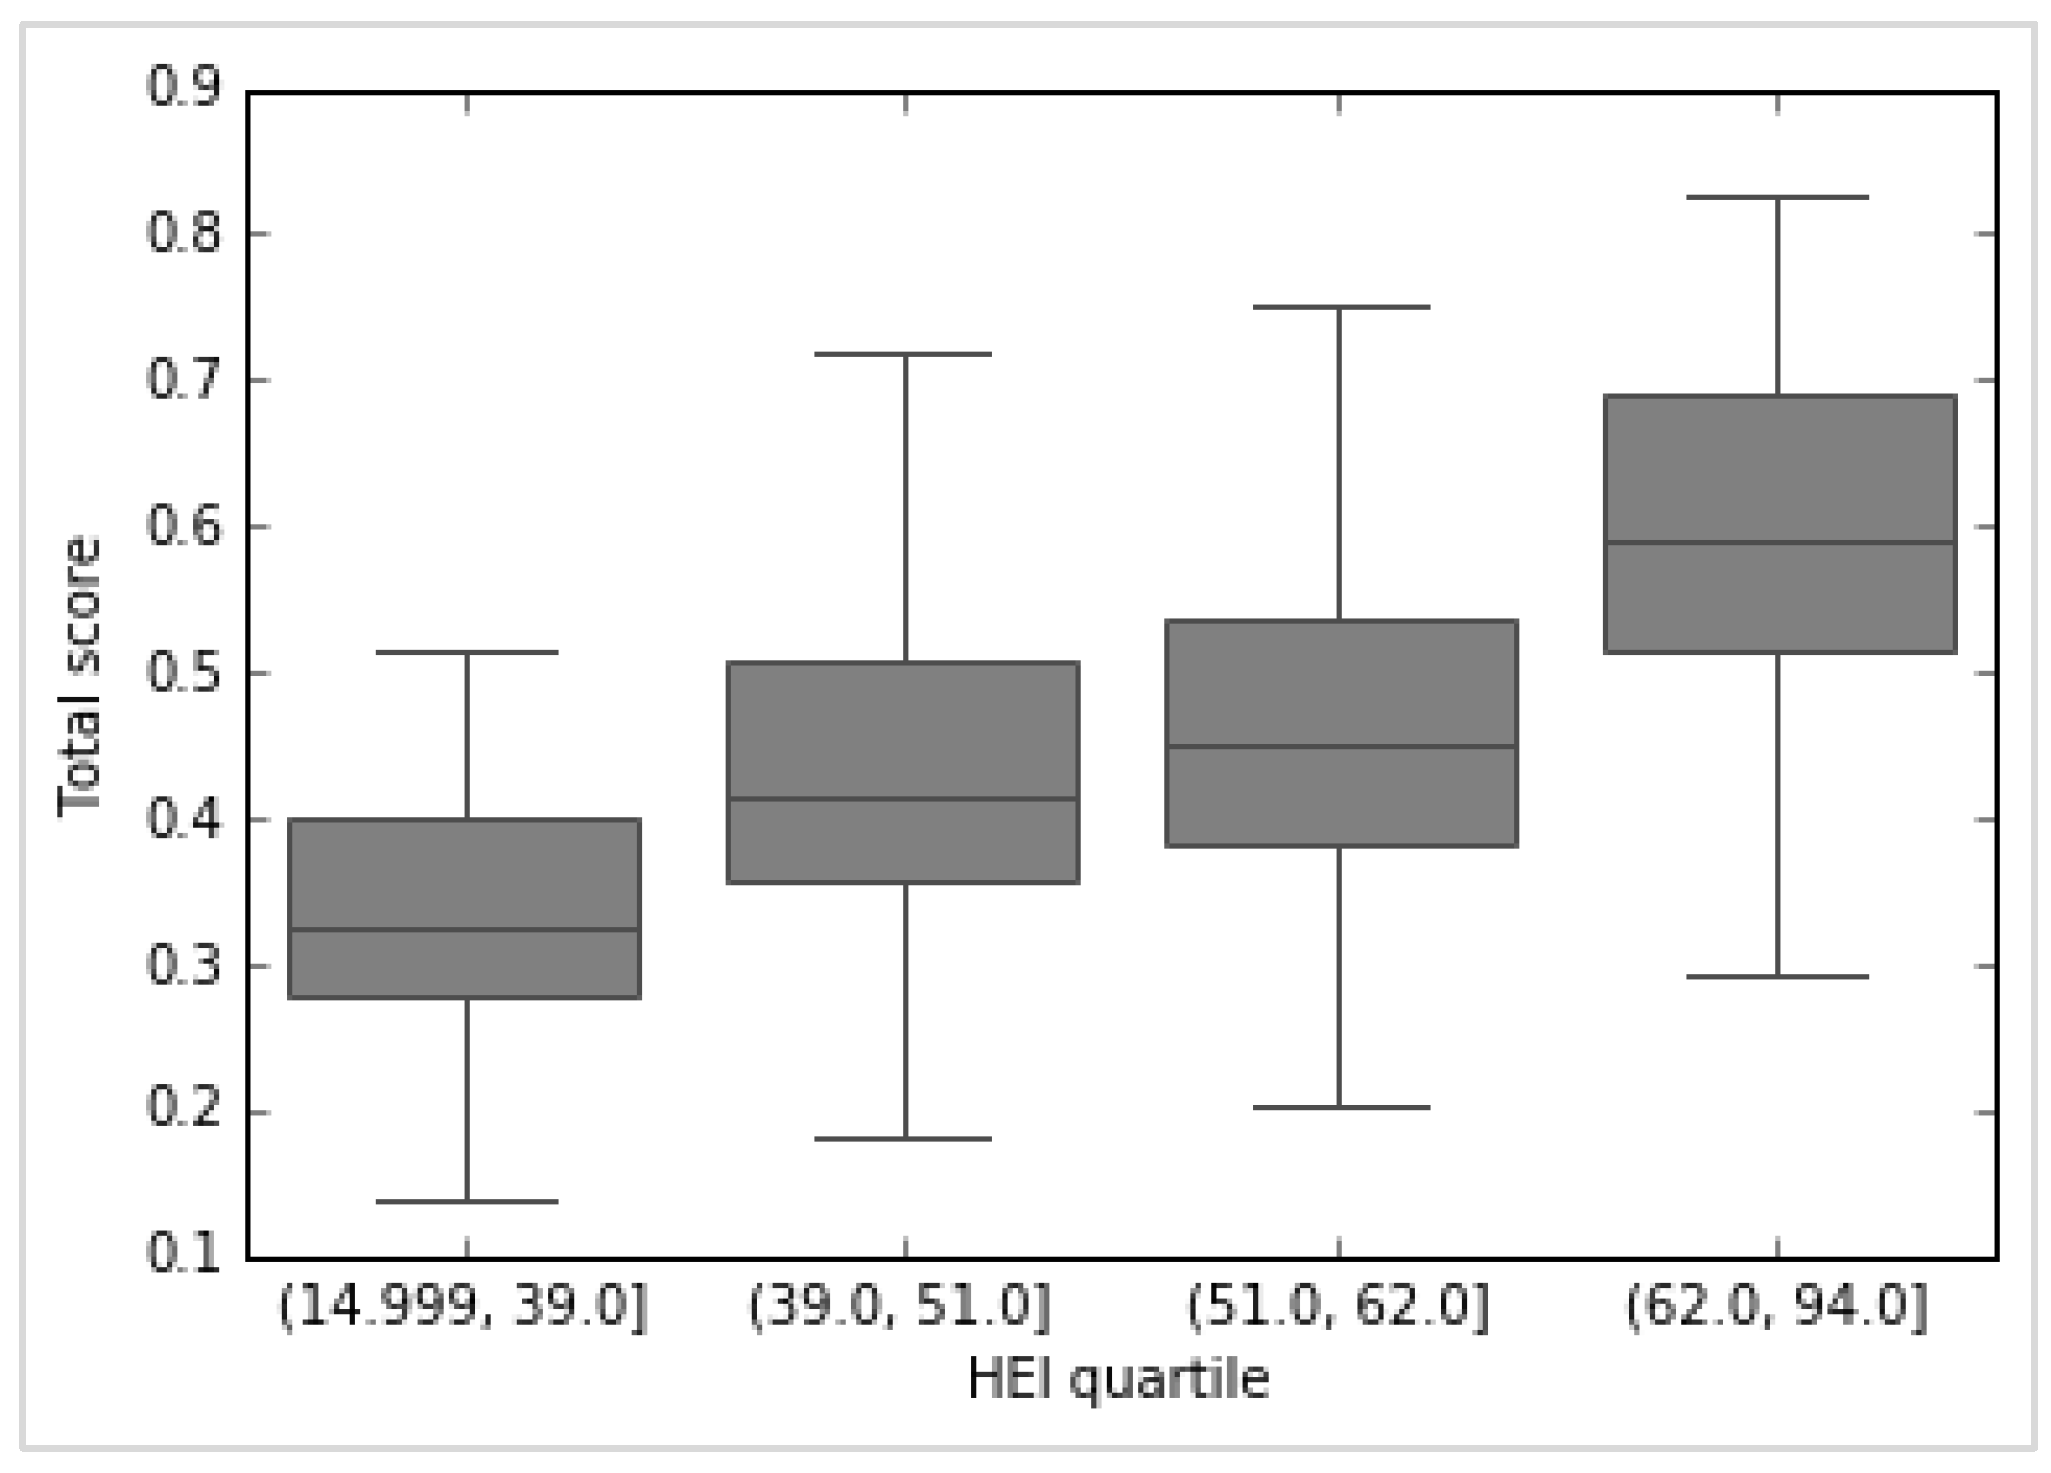
As a further means of comparison, the NHANES dataset (again with calories restricted to 1700–2300) was split by HEI quartiles and the mean nutrition algorithm scores were compared between the groups. This is shown in Figure 5 below for day 1 (the data for day 2 are virtually the same). The Tukey test rejected the null hypothesis of equal means (95% confidence level) for both days.
3.3.4. Impact of Age, Gender, and Socioeconomic Status
A comparison between NNA and HEI scores according to age, gender, and socioeconomic status is provided in Table 3 and Table 4.
Socio-economic status (SES) was defined as in [30]: categorization of socioeconomic status (SES) was based on education and income level. Income level was categorized according to the poverty income ratio (PIR) as: (a) less than 1.30; (b) 1.30 to 3.49; and (c) 3.50 or higher. Years of formal education were categorized as: (a) less than 12 years; (b) completed 12 years; (c) some college; and (d) completed college. Participants with more than 12 completed years of educational attainment and a PIR of at least 3.5 were categorized into high SES; participants with less than 12 years of educational attainment and a PIR less than 1.30 were categorized into low SES; and others were classified as medium SES.
3.4. Validation against Food Groups
Table 5 shows the average intakes in each NNA tertile, as well as the p-value of a Kruskal–Wallis test of comparison (the null hypothesis being that there is no difference between the distributions). All p-values are less than 5%, except in the case of refined grains.
3.5. Internal Consistency
The results for the Cronbach’s alpha coefficient are summarized in Table 6 using a subset of data from NHANES 2011–2012: Female 31–50 years, 1700–2300 kcal.
3.6. Principal Component Analysis
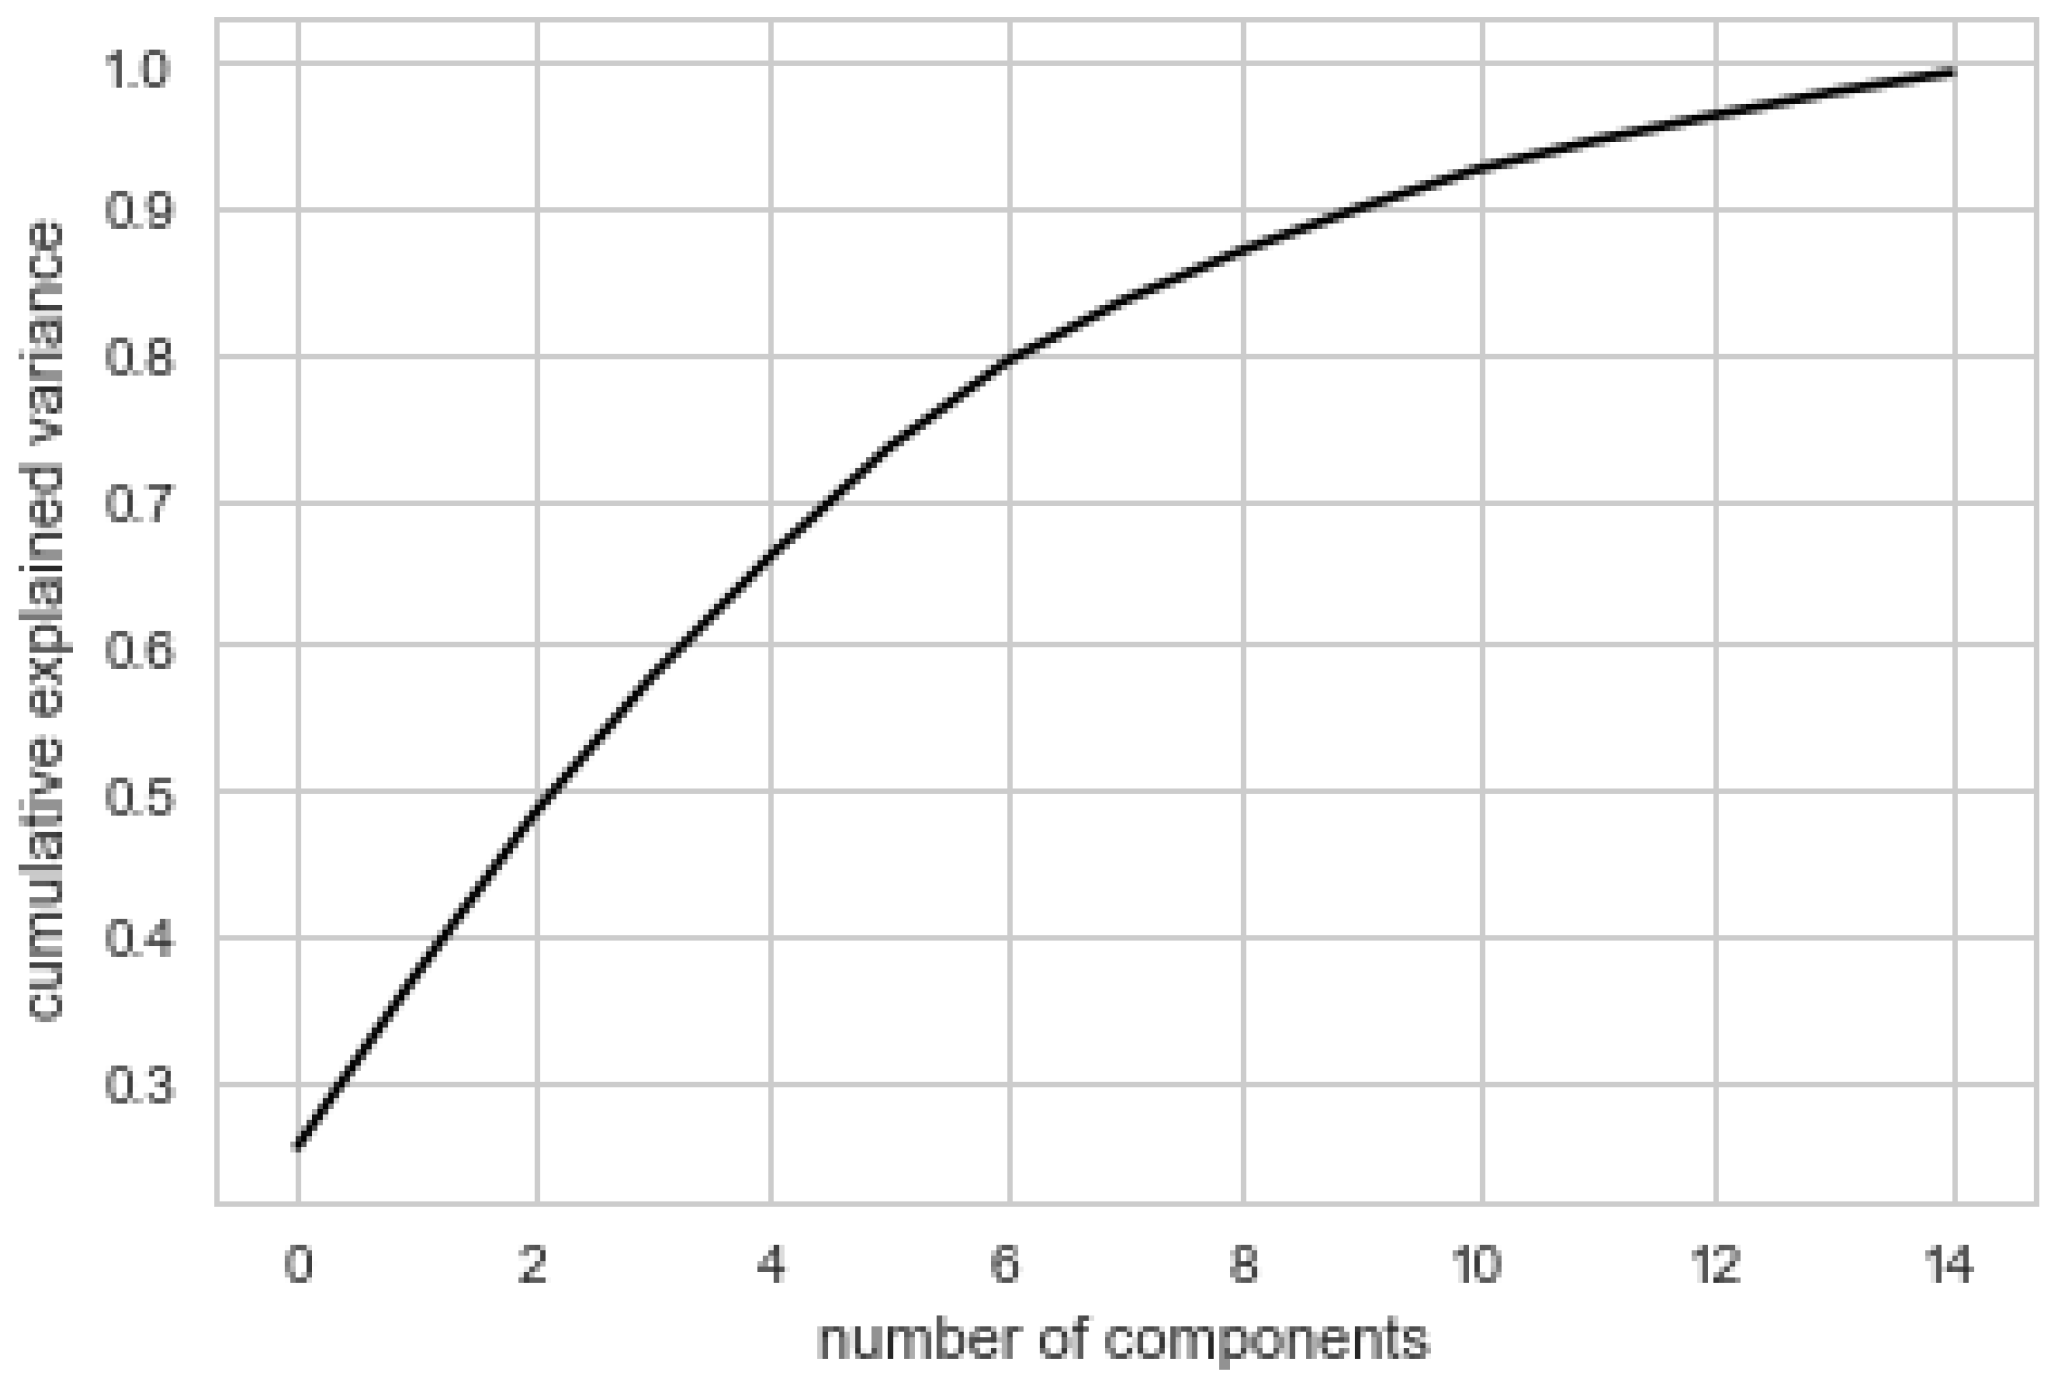
Figure 6 below shows the proportion of variance explained by the principal components. Fifteen principal components were selected by maximum likelihood estimation [33]. This suggests that the dimensionality cannot be substantially reduced. Principal component analysis confirmed that a number of components (nutrients) independently contribute to the overall score. In other words, the PCA provides evidence that no one single linear combination of the components of the NNA accounts for a substantial proportion of the covariation in dietary patterns. In order to explain at least 90% of the variance, one needs at least nine or 10 factors. It should be noted that the principal components are linear combinations of nutrient scores, and not just nutrient scores.
4. Discussion
The data analysis presented in this paper supports the reliability and validity of the new Nestlé Nutrition Algorithm. Exemplary menu plans are a useful way of testing the construct validity of a diet score, and has been used previously with the HEI [34]. The NNA algorithm could differentiate between the nutritional quality of two exemplary menu plans (as proxies for healthy diets) and the nutritional quality of NHANES participants (with similar energy intakes). The score is derived from 16 nutrients, as well as energy, meaning that no single nutrient influences the overall score. Rather, it is the overall nutrient signature that influences the score, with maximal scores being obtained for exemplary menu plans. Although the scoring system is based on nutrients, it can predict all of the food groups that we looked at, except for refined grains. This means that low NNA scores can be improved by increasing the diversity of food groups.
The internal consistency of the nutrition algorithm is good, as indicated by a Cronbach’s Alpha score of 0.73 using NHANES data. However, the correlation matrix indicates that there are associations between numbers of nutrients. The associations between potassium, magnesium, folate, and fiber might be explained by the coexistence of these nutrients in vegetables. The associations between vitamin A, vitamin D, and calcium could be explained by the coexistence of these nutrients in dairy products.
This paper has shown that higher scores are obtained for the diets of women of middle and high socio-economic status versus women of low socio-economic status. This is expected, as it is consistent with previous findings of a positive association between indices of socio-economic status and micronutrient intake and status [35].
The NNA approach is to award maximum scores when both energy and nutrients fall within an ideal healthy range. Lower scores are given when nutrients are either above or below this range. This approach differs from other dietary scoring methods in which a maximal micronutrient score is capped at 100% of the nutrient requirements [3,11]. Nevertheless, the idea of an optimal range for nutrients is not new. Twenty years ago, Wirsam and Uthus (1996) proposed a new mathematical approach for scoring the nutritional quality of diets based on fuzzy logic [36]. They assigned values to the intake of nutrients, with values increasing from zero to a maximum of 1.0 when the optimal level was reached, and thereafter falling when the amount exceeded the optimal level and became harmful to health. By creating and combining sets of scores for numerous nutrients, the authors could demonstrate how closely a diet met the national recommendations [36]. Their model included all nutrients (i.e., they were not specifically selected) and there was no consideration of energy. This approach has more recently been applied to food groups for a range of energy levels as means of developing healthy diets [37].
An important point of differentiation between the present algorithm, and others, is the energy adjustment. This novel adjustment means that when a 24 h diet is within 15% of energy needs, the score reflects only dietary quality. When energy intake falls outside this ideal range, the score starts to fall, reaching zero when implausibly low or excessive energy levels are reached. NNA scores are not correlated with HEI 2010 scores because HEI measures diet quality independently of quantity. However, when the analysis of NHANES data was restricted caloric intakes between 1700 and 2300 kcal then we observed statistically significant correlations between the HEI 2010 and NNA. The more energy intake is outside the healthy range, the greater is the negative impact of energy on the overall score. The goal is to encourage the consumption of nutrient dense foods and optimize calories, consistent with food-based dietary guidelines.
Consequently, it could be interesting to explore the potential for the NNA to serve as a tool for tracking diet quality and quantity at the population level. Tracking dietary quality over time is problematic using the HEI because the algorithm is regularly modified in line with updates to the US dietary guidelines. An advantage of the NNA is that it effectively distinguishes a healthy eating pattern from an unhealthy one, and could therefore be used in other countries with similar nutrient requirements, even though the foods and beverages consumed may be different. The NNA could potentially also be used by individuals interested in tracking their own diet scores. Such an application could include using portable devices (phone, laptop).
A potential limitation for the use of the algorithm is the availability of nutrient information. Nutrient information is available for a wide range of foods and beverages in relevant nutrient databases, but inevitably, there are many foods and beverages that are not documented in these databases. The nutrition label of packaged foods provides many of the nutrients required, but not all. Added sugars can be a particular problem, since values are not readily available in public databases. However, the introduction of newly-revised labelling information in the US will mean that added sugars as well as vitamin D will be included on the label, although potassium and vitamins A and C will no longer appear. At the same time, databases are increasingly reporting added sugars (e.g., the Australian nutrient database). This has been facilitated by the introduction of robust algorithms for estimating added sugars [38].
An additional limitation of this, or any other diet score, is the quality of food intake data. The measurement of food intake is thwarted by well-known methodological problems such as underreporting, and variability in food intake on different days of the week. Theoretically, dietary recalls, or analyzing the nutrient content of a duplicate diet, would be the most reliable ways of generating food intake data [39]. The advent of new technologies that can be used with hand held devices such as Smartphones, will help individuals to capture food intake in real-time more reliably. Such technologies include the use of photographs, [40] barcodes, and voice [41].
5. Conclusions
In conclusion, the NNA provides a reliable and valid method of scoring the healthiness of diets, based on healthy ranges for nutrient composition and energy. It is designed for evaluating the healthiness of the diets of males and females of all ages and diverse energy requirements.
6. Patents
Fabio Mainardi and Hilary Green (WO2018234083) System and methods for calculating, displaying, modifying, and using single dietary intake score reflective of optimal quantity and quality of consumables. US first filing of patent, 23 June 2017; Published 27 December 2018.
Author Contributions
H.G. and F.M. conceived this work, H.G. performed the literature search, F.M. did the data extraction, formal analysis, and validation, H.G. wrote the first draft of the manuscript, A.D. provided mentorship, all authors critically revised and approved the final version.
Funding
This research received no external funding.
Acknowledgments
The authors thank Vera Steullet for helpful discussions and feedback.
Conflicts of Interest
F.M. and H.G are employed by Nestlé and A.D. is an advisor to the company. There was no corporate influence on the design of the study; in the collection, analyses, or interpretation of data; in the writing of the manuscript.
Appendix A

Table A1.
Nutrient composition of MyPlate and DASH menu plans.
| MyPlate | DASH | ||||
|---|---|---|---|---|---|
| Nutrients | Mean | SD | Mean | SD | |
| Energy, Kcal | 2094 | 212 | 2286 | 110 | |
| Carbohydrate, % energy intake | 54 | 7 | 54 | 2 | |
| Protein, % energy intake | 19 | 3 | 19 | 2 | |
| Total fat, % energy intake | 29 | 7 | 30 | 1 | |
| Saturated fat, % energy intake | 7 | 2 | 7 | 1 | |
| Added sugars, % energy intake | 5 | 3 | 4 | 2 | |
| Calcium, mg | 1449 | 271 | 1468 | 202 | |
| Food folate, mcg | 448 | 173 | 412 | 110 | |
| Fiber, g | 31 | 3 | 34 | 3 | |
| Iron, mg | 18 | 5 | 19 | 5 | |
| Magnesium, mg | 507 | 64 | 569 | 53 | |
| Potassium, mg | 4891 | 494 | 4918 | 244 | |
| Sodium, mg | 1825 | 341 | 1935 | 255 | |
| Vitamin A, mcg | 1127 | 535 | 1301 | 757 | |
| Vitamin C, mg | 173 | 98 | 194 | 67 | |
| Vitamin D, mcg | 9 | 8 | 3 | 5 | |
| Vitamin E, mcg | 10 | 4 | 21 | 2 | |
DASH: Dietary Approaches to Stop Hypertension.
Appendix B
| MyPlate 7-Day 2000 Calorie Menus | ||
|---|---|---|
| Day | Ingredients | Measure (g) |
| Day 1 | ||
| Breakfast | Uncooked oatmeal | 41 |
| Fat-free milk | 245 | |
| Raisins | 18 | |
| Brown Sugar | 25 | |
| Orange Juice (unsweetened) | 248 | |
| Lunch | Tortilla chips | 57 |
| Cooked ground turkey | 57 | |
| Corn & Canola oil | 9 | |
| Kidney beans | 46 | |
| Low-fat cheddar cheese | 14 | |
| Chopped lettuce | 18 | |
| Avocado | 115 | |
| Lime juice | 6 | |
| Salsa | 36 | |
| Coffee | 179 | |
| Dinner | Lasagna noodles | 57 |
| Cooked spinach | 90 | |
| Ricotta cheese-whole milk | 124 | |
| Part-skim mozzarella | 28 | |
| Tomato sauce | 120 | |
| Whole wheat roll | 28 | |
| Tub margarine | 5 | |
| Fat-free milk | 245 | |
| Snack | Raisins | 18 |
| Almonds (unsalted) | 28 | |
| Day 2 | ||
| Breakfast | Tortilla, flour | 49 |
| Scrambled egg | 61 | |
| Black beans | 65 | |
| Salsa | 36 | |
| Grapefruit | 118 | |
| Coffee | 179 | |
| Lunch | Whole-grain bun | 65 |
| Lean roast beef | 57 | |
| Part-skim mozzarella | 28 | |
| Tomato | 54 | |
| Mushrooms | 39 | |
| Corn & Canola oil | 9 | |
| Mustard | 5 | |
| Potato wedges | 100 | |
| Ketchup | 17 | |
| Fat-free milk | 245 | |
| Dinner | Salmon filet | 113 |
| Olive oil | 5 | |
| Lemon juice | 10 | |
| Cooked beet greens | 38 | |
| Corn/canola oil | 9 | |
| Quinoa | 185 | |
| Slivered almonds | 14 | |
| Fat-free milk | 245 | |
| Snack | Cantaloupe balls | 177 |
| Day 3 | ||
| Breakfast | Oat cereal ready to eat | 42 |
| Banana | 118 | |
| Fat-free milk | 123 | |
| Whole-wheat toast | 42 | |
| Tub margarine | 5 | |
| Prune juice | 256 | |
| Lunch | Rye bread | 64 |
| Tuna | 57 | |
| Mayonnaise | 14 | |
| Chopped celery | 8 | |
| Shredded lettuce | 18 | |
| Peach | 150 | |
| Fat-free milk | 245 | |
| Dinner | Cooked chicken breast | 85 |
| Sweet potato, roasted | 180 | |
| Succotash (limas & corn) | 96 | |
| Tub margarine | 9 | |
| Whole-wheat roll | 28 | |
| Coffee | 179 | |
| Snack | Dried Apricots | 33 |
| Yogurt (Chocolate.; 0% Fat) | 245 | |
| Day 4 | ||
| Breakfast | Whole-wheat English muffin | 66 |
| All-fruit preserves | 20 | |
| Hard-cooked egg | 50 | |
| Coffee | 179 | |
| Lunch | Chunky vegetable soup + pasta | 288 |
| White beans | 101 | |
| Saltine crackers | 18 | |
| Celery sticks | 51 | |
| Fat-free milk | 245 | |
| Dinner | Macaroni pasta | 57 |
| Cooked ground beef | 57 | |
| Corn/canola oil | 9 | |
| Tomato sauce | 120 | |
| Grated parmesan cheese | 15 | |
| Raw spinach leaves | 30 | |
| Tangerine sections | 98 | |
| Chopped walnuts | 59 | |
| Oil & vinegar dressing | 21 | |
| Coffee | 179 | |
| Snack | Nonfat fruit yogurt | 245 |
| Day 5 | ||
| Breakfast | Shredded wheat | 49 |
| Sliced banana | 75 | |
| Fat-free milk | 123 | |
| Slice whole-wheat toast | 25 | |
| All-fruit preserves | 7 | |
| Fat-free chocolate milk | 245 | |
| Lunch | Whole-wheat pita bread | 57 |
| Roasted turkey, sliced | 85 | |
| Tomato | 54 | |
| Shredded lettuce | 9 | |
| Mustard | 5 | |
| Mayonnaise | 14 | |
| Grapes | 46 | |
| Tomato juice | 243 | |
| Dinner | Broiled beef steak | 113 |
| Mashed potatoes | 140 | |
| Cooked green beans | 63 | |
| Tub margarine | 9 | |
| Honey | 7 | |
| Whole wheat roll | 28 | |
| Frozen yogurt (chocolate) | 87 | |
| Sliced strawberries | 42 | |
| Fat-free milk | 245 | |
| Snack | Frozen yogurt (chocolate) | 174 |
| Day 6 | ||
| Breakfast | Whole wheat bread | 64 |
| Fat-free milk | 45 | |
| Egg (in French toast) | 34 | |
| Tub margarine | 9 | |
| Pancake syrup | 20 | |
| Large grapefruit | 118 | |
| Fat-free milk | 245 | |
| Lunch | Kidney beans | 46 |
| Navy beans | 26 | |
| Black beans | 36 | |
| Tomato sauce | 120 | |
| Chopped onions | 40 | |
| Chopped Jalapeno peppers | 11 | |
| Corn/canola oil | 5 | |
| Cheese Sauce | 63 | |
| Large baked potato | 299 | |
| Cantaloupe melon | 90 | |
| Coffee | 179 | |
| Dinner | Cheese pizza, thin crust | 138 |
| Lean ham | 28 | |
| Pineapple | 41 | |
| Mushrooms | 39 | |
| Safflower oil | 5 | |
| Mixed salad greens | 36 | |
| Oil & vinegar dressing | 21 | |
| Fat-free milk | 245 | |
| Snack | Hummus | 45 |
| Whole-wheat crackers | 23 | |
| Day 7 | ||
| Breakfast | Buckwheat pancakes | 146 |
| Pancake syrup | 20 | |
| Sliced strawberries | 42 | |
| Orange Juice (unsweetened) | 248 | |
| Lunch | Canned clams | 85 |
| Potato | 170 | |
| Chopped onion | 20 | |
| Chopped celery | 15 | |
| Evaporated milk | 96 | |
| Bacon | 28 | |
| White flour | 8 | |
| Whole-wheat crackers | 46 | |
| Orange | 140 | |
| Fat-free milk | 306 | |
| Dinner | Firm tofu | 114 |
| Chopped Chinese cabbage | 38 | |
| Sliced bamboo shoots | 38 | |
| Chopped sweet red peppers | 19 | |
| Chopped green peppers | 19 | |
| Corn/canola oil | 14 | |
| Cooked brown rice | 195 | |
| Honeydew melon | 128 | |
| Plain fat-free yogurt | 123 | |
| Coffee | 179 | |
| Snack | Banana | 118 |
| Peanut butter | 32 | |
| Non-fat fruit yogurt | 245 | |
| DASH 7-Day 2000 Calorie Menus | ||
| Day 1 | ||
| Breakfast | Bran flakes cereal | 30 |
| Banana | 118 | |
| Low-fat milk | 246 | |
| Whole wheat bread | 32 | |
| Soft (tub) margarine | 5 | |
| Orange juice | 248 | |
| Lunch | Chicken salad: | |
| Chicken breast, cooked, cubed, and skinless | 91 | |
| Celery, chopped | 5 | |
| Lemon juice | 3 | |
| Onion powder | 0 | |
| Salt | 0 | |
| Mayonnaise, low-fat | 9 | |
| Whole wheat bread | 32 | |
| Dijon mustard (prepared, yellow) | 15 | |
| Cucumber slices | 52 | |
| Tomato wedges | 90 | |
| Sunflower seeds | 9 | |
| Italian dressing, low calorie | 5 | |
| Fruit cocktail, juice pack | 119 | |
| Dinner | Beef, eye of the round | 85 |
| Beef gravy, fat-free | 36 | |
| Green beans, sautéed with | 125 | |
| Canola oil | 2 | |
| Baked potato | 138 | |
| Sour cream, fat-free | 12 | |
| Grated natural cheddar cheese, reduced fat | 10 | |
| Chopped scallions | 6 | |
| Whole wheat roll: | 28 | |
| Soft (tub) margarine | 5 | |
| Apple | 149 | |
| Low-fat milk | 246 | |
| Snacks | Almonds, unsalted | 48 |
| Raisins | 41 | |
| Fruit yogurt, fat-free, no sugar added | 123 | |
| Day 2 | ||
| Breakfast | Instant oatmeal | 28 |
| Whole wheat bagel | 50 | |
| Peanut butter | 32 | |
| Banana | 118 | |
| Low-fat milk | 246 | |
| Lunch | Chicken breast, skinless | 84 |
| Whole wheat bread | 64 | |
| Cheddar cheese, reduced fat | 21 | |
| Romaine lettuce (outer leaf) | 28 | |
| Tomato | 40 | |
| Mayonnaise, low-fat (reduced fat with olive oil) | 15 | |
| Cantaloupe chunks | 160 | |
| Apple juice | 248 | |
| Dinner | Spaghetti | 140 |
| Vegetarian spaghetti sauce | ||
| Olive oil | 5 | |
| Onions, chopped | 12 | |
| Garlic, chopped | 2 | |
| Zucchini, sliced | 24 | |
| Oregano, dried (ground) | 1 | |
| Basil, dried | 1 | |
| Canned tomato sauce | 31 | |
| Canned tomato paste | 75 | |
| Tomatoes, chopped | 41 | |
| Water | 40 | |
| Parmesan cheese | 15 | |
| Spinach leaves | 30 | |
| Carrots, grated | 28 | |
| Mushrooms, sliced | 18 | |
| Vinaigrette dressing | ||
| Garlic, separated and peeled | 8 | |
| Water | 30 | |
| Red wine vinegar | 4 | |
| Honey | 1 | |
| Virgin olive oil | 3 | |
| Black pepper | 1 | |
| Corn, cooked from frozen | 83 | |
| Canned pears, juice pack | 124 | |
| Snacks | Almonds, unsalted | 48 |
| Dried apricots | 33 | |
| Fruit yogurt, fat-free, no sugar added | 245 | |
| Day 3 | ||
| Breakfast | Bran flakes cereal | 30 |
| Banana | 118 | |
| Low-fat milk | 246 | |
| Whole wheat bread | 32 | |
| Soft (tub) margarine | 5 | |
| Orange juice | 248 | |
| Lunch | Beef, eye of round | 57 |
| Barbeque sauce | 28 | |
| Cheddar cheese, reduced fat | 56 | |
| Hamburger bun | 42 | |
| Romaine lettuce (outer leaf) | 28 | |
| Tomato | 40 | |
| New potato salad | ||
| New potatoes | 156 | |
| Olive oil | 5 | |
| Green onions, chopped | 4 | |
| Black pepper | 0 | |
| Orange | 131 | |
| Dinner | Cod, cooked | 85 |
| Lemon juice | 5 | |
| Brown rice, cooked | 98 | |
| Spinach, cooked from frozen, sautéed with: | 190 | |
| Canola oil | 5 | |
| Almonds, slivered | 8 | |
| Cornbread muffin, made with oil | 33 | |
| Soft (tub) margarine | 5 | |
| Snacks | Fruit yogurt, fat-free, no added sugar | 245 |
| Sunflower seeds | 9 | |
| Graham cracker | 28 | |
| Peanut butter | 32 | |
| Day 4 | ||
| Breakfast | Whole wheat bread | 32 |
| Soft (tub) margarine | 5 | |
| Fruit yogurt, fat-free | 245 | |
| Peach | 150 | |
| Grape juice | 127 | |
| Lunch | Ham and cheese sandwich: | |
| Ham, low-fat, low sodium | 57 | |
| Cheddar cheese, reduced fat | 21 | |
| Whole wheat bread | 64 | |
| Romaine lettuce (outer leaf) | 28 | |
| Tomato | 40 | |
| Mayonnaise, low-fat (reduced fat with olive oil) | 15 | |
| Carrot sticks | 122 | |
| Dinner | Chicken and Spanish rice | |
| Onions, chopped | 32 | |
| Green peppers | 22 | |
| Vegetable oil (sunflower) | 2 | |
| Canned tomato sauce | 37 | |
| Parsley, chopped | 1 | |
| Black pepper | 1 | |
| Garlic, minced (powder) | 1 | |
| Cooked brown rice (cooked in unsalted water) | 195 | |
| Chicken breasts, cooked, skin and bone removed, and diced | 98 | |
| Green peas, sautéed with: | 160 | |
| Canola oil | 5 | |
| Cantaloupe chunks | 160 | |
| Low-fat milk | 246 | |
| Snacks | Almonds, unsalted | 48 |
| Apple juice | 248 | |
| Dried apricots | 33 | |
| Low-fat milk | 246 | |
| Day 5 | ||
| Breakfast | Whole grain oat rings cereal | 37 |
| Banana | 118 | |
| Low-fat milk | 246 | |
| Raisin bagel | 105 | |
| Peanut butter | 32 | |
| Orange juice | 248 | |
| Lunch | Tuna salad | |
| Canned tuna, water pack | 34 | |
| Celery, chopped | 10 | |
| Green onions, chopped | 5 | |
| Mayonnaise, low-fat | 20 | |
| Romaine lettuce (outer leaf) | 28 | |
| Whole wheat bread | 32 | |
| Cucumber slices (with peel) | 104 | |
| Tomato wedges | 90 | |
| Vinaigrette dressing | 22 | |
| Cottage cheese, low-fat | 113 | |
| Canned pineapple, juice pack | 91 | |
| Dinner | Turkey meatloaf | |
| Lean ground turkey | 91 | |
| Regular oats, dry | 8 | |
| Egg, whole | 10 | |
| Onion, dehydrated flakes | 1 | |
| Ketchup (low sodium) | 12 | |
| Baked potato | 138 | |
| Sour cream, fat-free | 12 | |
| Natural cheddar cheese, reduced fat, grated | 14 | |
| Scallion stalk, chopped | 5 | |
| Collard greens, sautéed with: | 36 | |
| Canola oil | 5 | |
| Whole wheat roll | 28 | |
| Peach | 150 | |
| Snacks | Fruit yogurt, fat-free, | 123 |
| Sunflower seeds, unsalted | 17 | |
| Day 6 | ||
| Breakfast | Low-fat granola bar | 24 |
| Banana | 118 | |
| Fruit yogurt, fat-free, no sugar added | 123 | |
| Orange juice | 248 | |
| Low-fat milk | 246 | |
| Lunch | Turkey breast | 85 |
| Whole wheat bread | 64 | |
| Romaine lettuce (outer leaf) | 28 | |
| Tomato | 40 | |
| Mayonnaise, low-fat | 10 | |
| Dijon mustard (prepared, yellow) | 15 | |
| Steamed broccoli, cooked from frozen (boiled) | 184 | |
| Orange | 131 | |
| Dinner | Spicy baked fish | |
| Salmon fillet | 114 | |
| Virgin olive oil | 3 | |
| Spicy seasoning, salt-free | 1 | |
| Scallion rice | ||
| Cooked brown rice (cooked in unsalted water) | 176 | |
| Bouillon granules, low sodium | 1 | |
| Green onions, chopped | 4 | |
| Spinach, cooked from frozen, sautéed with: | 95 | |
| Canola oil | 9 | |
| Almonds, slivered | 8 | |
| Carrots, cooked from frozen | 146 | |
| Whole wheat roll | 28 | |
| Soft (tub) margarine | 5 | |
| Cookie | 12 | |
| Snacks | Peanuts, unsalted | 19 |
| Low-fat milk | 246 | |
| Dried apricots | 33 | |
| Day 7 | ||
| Breakfast | Whole grain oat rings cereal | 37 |
| Banana | 118 | |
| Low-fat milk | 246 | |
| Fruit yogurt, fat-free | 245 | |
| Lunch | Canned tuna, drained, rinsed | 73 |
| Mayonnaise, low-fat (reduced fat with olive oil) | 15 | |
| Romaine lettuce (outer leaf) | 28 | |
| Tomato | 40 | |
| Whole wheat bread | 64 | |
| Apple | 182 | |
| Low-fat milk | 246 | |
| Dinner | Zucchini lasagna | |
| Cooked lasagna noodles, cooked in unsalted water | 38 | |
| Part-skim mozzarella cheese, grated | 14 | |
| Cottage cheese, fat-free | 36 | |
| Parmesan cheese, grated | 4 | |
| Raw zucchini, sliced | 19 | |
| Low-sodium tomato sauce (tomato and vegetable) | 101 | |
| Basil, dried | 1 | |
| Oregano, dried | 1 | |
| Onion, chopped | 7 | |
| Garlic | 1 | |
| Black pepper | 0 | |
| Fresh spinach leaves | 30 | |
| Tomato wedges | 180 | |
| Croutons, seasoned | 5 | |
| Vinaigrette dressing, reduced calorie | 22 | |
| Sunflower seeds | 9 | |
| Whole wheat roll | 28 | |
| Soft (tub) margarine | 5 | |
| Grape juice | 253 | |
| Snacks | Almonds, unsalted | 48 |
| Dried apricots | 33 | |
| Whole wheat crackers | 28 | |
References
- Drewnowski, A. Concept of a nutritious food: Toward a nutrient density score. Am. J. Clin. Nutr. 2005, 82, 721–732. [Google Scholar] [CrossRef] [PubMed]
- Drewnowski, A.; Fulgoni, V., III. Nutrient profiling of foods: Creating a nutrient rich food index. Nutr. Rev. 2008, 66, 23–39. [Google Scholar] [CrossRef] [PubMed]
- Drewnowski, A. Defining nutrient density: Development and validation of the nutrient rich foods index. J. Am. Coll. Nutr. 2009, 28, 421S–426S. [Google Scholar] [CrossRef]
- Roodenburg, A.J.C.; Popkin, B.M.; Seidell, J.C. Development of international criteria for a front of package food labelling system: The international choices programme. Eur. J. Clin. Nutr. 2011, 65, 1190–1200. [Google Scholar] [CrossRef] [PubMed]
- Sacks, G.; Rayner, M.; Stockley, L.; Scarborough, P.; Snowdon, W.; Swinburn, B. Applications of nutrient profiling: Potential role in diet-related chronic disease prevention and the feasibility of a core nutrient-profiling system. Eur. J. Clin. Nutr. 2011, 65, 298–306. [Google Scholar] [CrossRef] [PubMed]
- Hughes, C.; Wellard, L.; Lin, J.; Suen, K.L.; Chapman, K. Regulating health claims on food labels using nutrient profiling: What will the proposed standard mean in the Australian supermarket? Public Health Nutr. 2013, 16, 2154–2161. [Google Scholar] [CrossRef] [PubMed]
- Rayner, M.; Scarborough, P.; Kaur, A. Nutrient profiling and the regulation of marketing to children. Possibilities and pitfalls. Appetite 2013, 62, 232–235. [Google Scholar] [CrossRef]
- Vlassopoulos, A.; Masset, G.; Charles, V.; Hoover, C.; Chesneau-Guillemont, C.; Leroy, F.; Lehmann, U.; Spieldenner, J.; Tee, E.-S.; Gibney, M.; et al. A nutrient profiling system for the (re)formulation of a global food and beverage portfolio. Eur. J. Nutr. 2017, 56, 1105–1122. [Google Scholar] [CrossRef]
- Calton, E.K.; James, A.P.; Pannu, P.K.; Soares, M.J. Certain dietary patterns are beneficial for the metabolic syndrome: Reviewing the evidence. Nutr. Res. 2014, 34, 559–568. [Google Scholar] [CrossRef]
- Mozaffarian, D. Dietary and policy priorities for cardiovascular disease, diabetes, and obesity. Circulation 2016, 133, 187–225. [Google Scholar] [CrossRef]
- Fern, E.B.; Watzke, H.; Barclay, D.V.; Roulin, A.; Drewnowski, A. The nutrient balance concept: A new quality metric for composite meals and diets. PLoS ONE 2015, 10, e0130491. [Google Scholar] [CrossRef] [PubMed]
- Gibney, M.J.; Barr, S.I.; Bellisle, F.; Drewnowski, A.; Fagt, S.; Livingstone, B.; Masset, G.; Varela Moreiras, G.; Moreno, L.A.; Smith, J.; et al. Breakfast in human nutrition: The international breakfast research initiative. Nutrients 2018, 10, 559. [Google Scholar] [CrossRef] [PubMed]
- Barr, S.; Vatanparast, H.; Smith, J. Breakfast in Canada: Prevalence of consumption, contribution to nutrient and food group intakes, and variability across Tertiles of daily diet quality. A study from the international breakfast research initiative. Nutrients 2018, 10, 985. [Google Scholar] [CrossRef] [PubMed]
- Fagt, S.; Matthiessen, J.; Thyregod, C.; Kørup, K.; Biltoft-Jensen, A. Breakfast in Denmark. Prevalence of consumption, intake of foods, nutrients and dietary quality. A study from the international breakfast research initiative. Nutrients 2018, 10, 1085. [Google Scholar] [CrossRef]
- Ruiz, E.; Ávila, J.M.; Valero, T.; Rodriguez, P.; Varela-Moreiras, G. Breakfast Consumption in Spain: Patterns, nutrient intake and quality. Findings from the ANIBES Study, a Study from the international breakfast research initiative. Nutrients 2018, 10, 1324. [Google Scholar] [CrossRef] [PubMed]
- Bellisle, F.; Hébel, P.; Salmon-Legagneur, A.; Vieux, F. Breakfast consumption in French children, adolescents, and adults: A nationally representative cross-sectional survey examined in the context of the international breakfast research initiative. Nutrients 2018, 10, 1056. [Google Scholar] [CrossRef] [PubMed]
- Drewnowski, A.; Rehm, C.D.; Vieux, F. Breakfast in the United States: Food and nutrient intakes in relation to diet quality in national health and examination survey 2011–2014. A Study from the International breakfast research initiative. Nutrients 2018, 10, 1200. [Google Scholar] [CrossRef]
- Gaal, S.; Kerr, M.A.; Ward, M.; McNulty, H.; Livingstone, M.B.E. Breakfast consumption in the UK: Patterns, nutrient intake and diet quality. A study from the international breakfast research initiative group. Nutrients 2018, 10, 999. [Google Scholar] [CrossRef]
- Kennedy, E.T.; Ohls, J.; Carlson, S.; Fleming, K. The healthy eating index—Design and applications. J. Am. Diet. Assoc. 1995, 95, 1103–1108. [Google Scholar] [CrossRef]
- National Cancer Institute: Comparing the HEI-2015, HEI-2010 & HE-2005. Available online: https://epi.grants.cancer.gov/hei/comparing.html (accessed on 26 January 2019).
- Garriguet, D. Diet quality in Canada. Health Rep. 2009, 20, 41–52. [Google Scholar]
- Norte Navarro, A.I.; Ortiz Moncada, R. Spanish diet quality according to the healthy eating index. Nutr. Hosp. 2011, 26, 330–336. [Google Scholar] [PubMed]
- Andrade, S.C.; Previdelli, Á.N.; Marchioni, D.M.; Fisberg, R.M. Evaluation of the reliability and validity of the Brazilian healthy eating index revised. Rev. Saude Publ. 2013, 47, 675–683. [Google Scholar] [CrossRef] [PubMed]
- Roy, R.; Hebden, L.; Rangan, A.; Allman-Farinelli, M. The development, application, and validation of a healthy eating index for Australian Adults (HEIFA-2013). Nutrition 2016, 32, 432–440. [Google Scholar] [CrossRef] [PubMed]
- Scientific Report of the 2015 Dietary Guidelines Advisory Committee. Available online: https://health.gov/dietaryguidelines/2015-scientific-report/pdfs/scientific-report-of-the-2015-dietary-guidelines-advisory-committee.pdf (accessed on 16 November 2018).
- Institute of Medicine. Dietary Reference Intakes for Energy, Carbohydrate, Fiber, Fat, Fatty Acids, Cholesterol, Protein, and Amino Acids. Food and Nutrition Board; National Academy Press: Washington, WA, USA, 2002. [Google Scholar]
- U.S. Department of Agriculture Sample Menus for a 2000 Calorie Food Pattern. Available online: http://www.choosemyplate.gov/food-groups/downloads/Sample_Menus-2000Cals-DG2010.pdf (accessed on 15 May 2015).
- NHLBI, NIH. Your Guide to Lowering Your Blood Pressure with DASH—A Week with the DASH Eating Plan. 2015. Available online: http://www.nhlbi.nih.gov/health/resources/heart/hbp-dash-week-dash-html (accessed on 12 February 2015).
- The Healthy Eating Index: Overview of the Methods and Calculations. Available online: https://epi.grants.cancer.gov/hei/hei-methods-and-calculations.html (accessed on 16 November 2018).
- Wang, D.D.; Leung, C.W.; Li, Y.; Ding, E.L.; Chiuve, S.E.; Hu, F.B.; Willett, W.C. Trends in dietary quality among adults in the United States, 1999 through 2010. JAMA Intern. Med. 2014, 174, 1587–1595. [Google Scholar] [CrossRef] [PubMed]
- Bowman, S.A.; Clemens, J.J.C.; Friday, J.E.; Thoerig, R.C.; Mosfegh, A.J. Food Patterns Equivalents Database 2011–2012: Methodology and User Guide. 2014. Available online: https://www.ars.usda.gov/ARSUserFiles/80400530/pdf/fped/FPED_1112.pdf (accessed on 19 November 2018).
- Bland, J.M.; Altman, D.G. Statistical methods for assessing agreement between two methods of clinical measurement. Lancet 1986, 327, 307–310. [Google Scholar] [CrossRef]
- Minka, T.P. Automatic choice of dimensionality for PCA; MIT Media Laboratory: Cambridge, MA, USA, 2000; pp. 598–604. [Google Scholar]
- Guenther, P.M.; Casavale, K.O.; Reedy, J.; Kirkpatrick, S.I.; Hiza, H.A.B.; Kuczynski, K.J.; Kahle, L.L.; Krebs-Smith, S.M. Update of the healthy eating index: HEI-2010. J. Acad. Nutr. Diet. 2013, 113, 569–580. [Google Scholar] [CrossRef] [PubMed]
- Novaković, R.; Cavelaars, A.; Geelen, A.; Nikolić, M.; Altaba, I.I.; Viñas, B.R.; Ngo, J.; Golsorkhi, M.; Medina, M.W.; Brzozowska, A.; et al. Socio-economic determinants of micronutrient intake and status in Europe: A systematic review. Public Health Nutr. 2014, 17, 1031–1045. [Google Scholar] [CrossRef]
- Wirsam, B.; Uthus, E.O. The use of fuzzy logic in nutrition. J. Nutr. 1996, 126, 2337S–2341S. [Google Scholar] [CrossRef]
- Asghari, G.; Ejtahed, H.-S.; Sarsharzadeh, M.-M.; Nazeri, P.; Mirmiran, P. Designing fuzzy algorithms to develop healthy dietary pattern. Int. J. Endocrinol. Metab. 2013, 11, 151–161. [Google Scholar] [CrossRef]
- Louie, J.C.Y.; Moshtaghian, H.; Boylan, S.; Flood, V.M.; Rangan, A.M.; Barclay, A.W.; Brand-Miller, J.C.; Gill, T.P. A systematic methodology to estimate added sugar content of foods. Eur. J. Clin. Nutr. 2015, 69, 154–161. [Google Scholar] [CrossRef]
- Shim, J.-S.; Oh, K.; Kim, H.C. Dietary assessment methods in epidemiologic studies. Epidemiol. Health 2014, 36, e2014009. [Google Scholar] [CrossRef] [PubMed]
- Ashman, A.M.; Collins, C.E.; Brown, L.J.; Rae, K.M.; Rollo, M.E. Validation of a Smartphone image-based dietary assessment method for pregnant women. Nutrients 2017, 9, 73. [Google Scholar] [CrossRef] [PubMed]
- Illner, A.K.; Freisling, H.; Boeing, H.; Huybrechts, I.; Crispim, S.P.; Slimani, N. Review and evaluation of innovative technologies for measuring diet in nutritional epidemiology. Int. J. Epidemiol. 2012, 41, 1187–1203. [Google Scholar] [CrossRef] [PubMed]
Figure 1.
The Nestlé Nutrition Algorithm scoring system. AMDR: Acceptable Macronutrient Distribution Range, DRI: Dietary Reference Intakes, WHO: World Health Organization, EER: Estimated Energy Requirement.
Figure 1.
The Nestlé Nutrition Algorithm scoring system. AMDR: Acceptable Macronutrient Distribution Range, DRI: Dietary Reference Intakes, WHO: World Health Organization, EER: Estimated Energy Requirement.

Figure 2.
Dietary Reference Intakes (DRIs) for nutrients values from MyPlate and DASH menu plans for non-pregnant women aged 31–50 years. This shows the relationship between the nutrient composition of the DASH menu plan and the MyPlate menu plan, expressed as percent of the dietary reference intake for each nutrient. Each data point represents the mean of 7 days of each menu plan (the menu plans are provided in Appendix B). DASH: Dietary Approaches to Stop Hypertension.

Figure 3.
Scatterplot, NHANES 2011–2012, females 31–50 years, energy intake between 1700 and 2300 kcals, day 1 (n = 155). This shows the relationship between the NNA score (x axis) and the HEI score (y axis) for a subset of NHANES data. NHANES: National Health and Nutrition Examination Survey, NNA: Nestlé Nutrition Algorithm, HEI: Healthy Eating Index.

Figure 4.
Bland–Altman plot showing agreement between HEI and the NNA score for women aged 31–50 years non-pregnant and non-lactating (NHANES 2011–2012, day 1, n = 155). NHANES: National Health and Nutrition Examination Survey, NNA: Nestlé Nutrition Algorithm, HEI: Healthy Eating Index.
Figure 4.
Bland–Altman plot showing agreement between HEI and the NNA score for women aged 31–50 years non-pregnant and non-lactating (NHANES 2011–2012, day 1, n = 155). NHANES: National Health and Nutrition Examination Survey, NNA: Nestlé Nutrition Algorithm, HEI: Healthy Eating Index.

Figure 5.
HEI vs. NNA score by quartile for day 1 for women aged 31–50 years, non-pregnant and non-lactating (n= 155). This shows the relationship between the HEI score by quartile (x axis) and the NNA score (y axis) for a subset of NHANES data. NHANES: National Health and Nutrition Examination Survey, NNA: Nestlé Nutrition Algorithm, HEI: Healthy Eating Index.

Figure 6.
PCA analysis: proportion of variance explained by the principal components of the algorithm. Data = NHANES 2011–2012, day 1, women aged 31–50 years, non-lactating or pregnant (n = 155). This shows the amount of variance between each of the nutrients in the model. PCA: principal component analysis.

Table 1.
Strategies used to validate the new Nestlé Nutrition Algorithm (NNA) (NHANES: National Health and Nutrition Examination Survey, HEI: Healthy eating Index).
Table 1.
Strategies used to validate the new Nestlé Nutrition Algorithm (NNA) (NHANES: National Health and Nutrition Examination Survey, HEI: Healthy eating Index).
| Question | Strategy |
|---|---|
| Content validity ● Does the score capture the key aspects of diet quality as specified in the current Dietary Guidelines for Americans? | ● Compare the NNA scores against the key recommendations |
| Construct validity ● Does the score give high ranking to menus developed by nutrition experts? | ● Compute scores for sample menus generated according to the Dietary Guidelines for Americans |
| ● What is the underlying structure of the score? | ● Principal component analysis |
| ● Does the score distinguish between groups with known differences in diet quality? | ● Compare scores for different groups in NHANES data |
| ● Does the score agree, to a reasonable extent, with already existing trusted dietary indices? | ● Comparison with HEI 2010 on NHANES data, |
| Reliability ● How internally consistent is the total score? | ● Calculate Cronbach coefficient |
Table 2.
NNA scores (individual nutrients and total score) for non-pregnant women aged 31–50 years, energy intake of 1700–2300 kcal (n = 1348).
Table 2.
NNA scores (individual nutrients and total score) for non-pregnant women aged 31–50 years, energy intake of 1700–2300 kcal (n = 1348).
| Day 1 Scores | Day 2 Scores | |||
|---|---|---|---|---|
| Mean | SD | Mean | SD | |
| Added sugars | 0.23 | 0.39 | 0.28 | 0.41 |
| Calcium | 0.59 | 0.40 | 0.62 | 0.39 |
| Carbohydrate | 0.87 | 0.23 | 0.87 | 0.22 |
| Fat, saturated | 0.80 | 0.27 | 0.81 | 0.26 |
| Fat, total | 0.72 | 0.37 | 0.76 | 0.35 |
| Fiber | 0.32 | 0.37 | 0.39 | 0.39 |
| Food Folate | 0.18 | 0.29 | 0.20 | 0.31 |
| Iron | 0.43 | 0.34 | 0.47 | 0.36 |
| Magnesium | 0.61 | 0.36 | 0.67 | 0.34 |
| Potassium | 0.16 | 0.24 | 0.20 | 0.24 |
| Protein | 0.96 | 0.14 | 0.98 | 0.11 |
| Sodium | 0.44 | 0.33 | 0.42 | 0.33 |
| Vitamin A | 0.23 | 0.42 | 0.30 | 0.46 |
| Vitamin C | 0.43 | 0.46 | 0.48 | 0.46 |
| Vitamin D | 0.06 | 0.18 | 0.08 | 0.22 |
| Vitamin E | 0.16 | 0.29 | 0.16 | 0.29 |
| Total score | 0.45 | 0.14 | 0.48 | 0.14 |
SD: standard deviation.
Table 3.
Comparison between NNA and NHANES 2011–2012 (day 1) for age, gender, and socioeconomic status (SES), with energy intakes between 1700 and 2300 kcal.
Table 3.
Comparison between NNA and NHANES 2011–2012 (day 1) for age, gender, and socioeconomic status (SES), with energy intakes between 1700 and 2300 kcal.
| HEI 2010 | NNA | Sample Size | Standard Deviation HEI | Standard Deviation NNA | |
|---|---|---|---|---|---|
| Age | |||||
| 31–50 | 50.2 | 45 | 411 | 14.2 | 14.2 |
| 70+ | 56.3 | 48.7 | 171 | 14.4 | 13 |
| p-value | 9.54 × 10⁻⁶ | 2.13 × 10⁻³ | |||
| Gender | |||||
| Male | 52.9 | 46.2 | 274 | 14.9 | 13.2 |
| Female | 51.2 | 45.9 | 308 | 15.8 | 14 |
| p-value | 1.66 × 10⁻¹ | 7.68 × 10⁻¹ | |||
| SES | |||||
| low | 48.2 | 45.1 | 69 | 16.6 | 14.1 |
| medium | 50.8 | 45.1 | 298 | 15.5 | 13.8 |
| high | 54.9 | 48.1 | 170 | 14.3 | 13 |
| p-value | 1.25 × 10⁻³ | 5.36 × 10⁻² |
NNA: Nestlé Nutrition Algorithm, HEI: Healthy Eating Index.
Table 4.
Comparison between NNA and NHANES 2011–2012 (day 1) for age, gender, and socioeconomic status (SES), with no restriction on energy intakes.
Table 4.
Comparison between NNA and NHANES 2011–2012 (day 1) for age, gender, and socioeconomic status (SES), with no restriction on energy intakes.
| HEI 2010 | NNA | Sample Size | Standard Error HEI | Standard Error NNA | |
|---|---|---|---|---|---|
| Age | |||||
| 31–50 | 49.8 | 23.3 | 1557 | 0.4 | 0.5 |
| 70+ | 55.8 | 27 | 649 | 0.6 | 0.8 |
| p-value | 3.77 × 10⁻¹⁸ | 1.18 × 10⁻⁴ | |||
| Gender | |||||
| Male | 51.1 | 22.9 | 1082 | 0.4 | 0.6 |
| Female | 52.1 | 25.8 | 1124 | 0.5 | 0.6 |
| p-value | 8.7522 × 10⁻² | 8.75 × 10⁻⁴ | |||
| SES | |||||
| low | 47.9 | 20.9 | 304 | 0.8 | 1.2 |
| medium | 50.5 | 23.6 | 1148 | 0.4 | 0.6 |
| high | 55.3 | 27.8 | 583 | 0.6 | 0.9 |
| p-value | 7.58 × 10⁻¹⁴ | 2.39 × 10⁻⁶ |
NNA: Nestlé Nutrition Algorithm, HEI: Healthy Eating Index.
Table 5.
Average intakes of selected food groups, split by NNA tertiles for non-pregnant women aged 31–50 years, energy intake of 1700–2300 kcal.
Table 5.
Average intakes of selected food groups, split by NNA tertiles for non-pregnant women aged 31–50 years, energy intake of 1700–2300 kcal.
| NNA Tertile | (0, 0.34) | (0.34, 0.47) | (0.47, 0.77) | p-Value (Kruskal Test) | ||
|---|---|---|---|---|---|---|
| Food Group | ||||||
| Dark green veg | cup-eq/1000 kcal | 0.072 | 0.066 | 0.248 | 0.000000 | |
| Red orange veg | cup-eq/1000 kcal | 0.036 | 0.023 | 0.096 | 0.000014 | |
| Cured meat | oz-eq/1000 kcal | 0.486 | 0.3 | 0.33 | 0.008600 | |
| Citrus melon berries | cup-eq/1000 kcal | 0.05 | 0.082 | 0.169 | 0.000010 | |
| Solid fats | g/1000 kcal | 18.157 | 16.496 | 12.783 | 0.000006 | |
| Whole grain | cup-eq/1000 kcal | 0.203 | 0.296 | 0.674 | 0.000000 | |
| Refined grains | cup-eq/1000 kcal | 2.491 | 2.834 | 2.669 | 0.170000 | |
| Whole fruit | cup-eq/1000 kcal | 0.203 | 0.236 | 0.517 | 0.000000 | |
NNA: Nestlé Nutrition Algorithm.
Table 6.
Cronbach’s alpha coefficient of reliability (or consistency). This shows that the internal consistency of the NNA is high, indicating that it and its components provide a reliable diet score.
Table 6.
Cronbach’s alpha coefficient of reliability (or consistency). This shows that the internal consistency of the NNA is high, indicating that it and its components provide a reliable diet score.
| Cronbach’s Alpha | Confidence Interval (95%) | Sample Size | |
|---|---|---|---|
| Day 1 | 0.85 | (0.85, 0.86) | 155 |
| Day 2 | 0.87 | (0.86, 0.87) | 135 |
© 2019 by the authors. Licensee MDPI, Basel, Switzerland. This article is an open access article distributed under the terms and conditions of the Creative Commons Attribution (CC BY) license (http://creativecommons.org/licenses/by/4.0/).
Share and Cite
MDPI and ACS Style
Mainardi, F.; Drewnowski, A.; Green, H. Personalized Nutrient Profiling of Food Patterns: Nestlé’s Nutrition Algorithm Applied to Dietary Intakes from NHANES. Nutrients 2019, 11, 379. https://doi.org/10.3390/nu11020379
AMA Style
Mainardi F, Drewnowski A, Green H. Personalized Nutrient Profiling of Food Patterns: Nestlé’s Nutrition Algorithm Applied to Dietary Intakes from NHANES. Nutrients. 2019; 11(2):379. https://doi.org/10.3390/nu11020379
Chicago/Turabian StyleMainardi, Fabio, Adam Drewnowski, and Hilary Green. 2019. "Personalized Nutrient Profiling of Food Patterns: Nestlé’s Nutrition Algorithm Applied to Dietary Intakes from NHANES" Nutrients 11, no. 2: 379. https://doi.org/10.3390/nu11020379
Note that from the first issue of 2016, this journal uses article numbers instead of page numbers. See further details here.