Article

Sex-Specific Changes in Gut Microbiome Composition following Blueberry Consumption in C57BL/6J Mice

1
Arkansas Children’s Nutrition Center, University of Arkansas for Medical Sciences, Little Rock, AR 72205, USA
2
Department of Pediatrics, University of Arkansas for Medical Sciences, Little Rock, AR 722025, USA
*
Author to whom correspondence should be addressed.
Nutrients 2019, 11(2), 313; https://doi.org/10.3390/nu11020313
Submission received: 11 December 2018 / Revised: 25 January 2019 / Accepted: 27 January 2019 / Published: 1 February 2019
(This article belongs to the Special Issue Dietary Anthocyanins and Human Health)

Abstract

:
The antioxidant and anti-inflammatory properties of blueberries improve vascular function and insulin sensitivity. However, the bioavailability of the active compounds in blueberries is largely dependent on the gut microbiota, which may themselves be altered by blueberry components. The objective of the current study was to explore a possible sex-dependent modulation of the gut microbiota following supplementation with blueberries in adult mice. Eight-week-old C57BL/6J mice (n = 7–10/group) were provided with control or blueberry-containing diets (5% freeze-dried powder) for 4 weeks. Body weight, composition, and food intake were measured weekly. Genomic DNA was isolated from the cecal contents for 16S rRNA sequencing. Blueberry feeding decreased α-diversity (operational taxonomical unit abundance) and altered β-diversity (p < 0.05). At the phylum level, the Firmicutes to Bacteroidetes ratio was significantly lower in the blueberry-fed groups (p < 0.001), along with increased Tenericutes and decreased Deferribacteres. At the genus level, blueberry feeding led to sexually-dimorphic differences, which were associated with predicted metabolic pathways. Pathways such as fatty acid and lipid metabolism were significantly different and demonstrated a stronger association with microbes in the male. To summarize, blueberry supplementation led to sexually-dimorphic global changes in the gut microbiome, which could possibly contribute to physiological changes in mice.

1. Introduction

Blueberries (Vaccinium angustifolium) have long been considered beneficial to human health. Nutritionally, one cup (100 g) of blueberries provides 3.6 g of fiber, 25% of the daily vitamin C requirement, and offers other nutritional benefits. Blueberry production has been on the rise in order to match the increasing level of consumption over the last several decades [1]. The health benefits of blueberries have been attributed to bioactive compounds such as ‘anthocyanins’ and ‘phenolic acids’ [2,3]. Anti-oxidant and anti-inflammatory effects of blueberries have been demonstrated in a range of studies using cellular systems and animal models [4,5,6]. Blueberry-derived anthocyanins have been reported to stimulate apoptosis and prevent the growth of cancer cells [7,8], as well as also having been shown to protect against oxidative stress [9]. In addition, dietary anthocyanins, phenolic acid, and blueberry supplementation were shown to improve hyperglycemia in diabetic mice, attenuate whole-body insulin resistance in high-fat diet (HFD)-fed mice, reduce inflammatory markers in adipose tissue, and aid in greater bone formation in rats [10,11].
Only 5%–10% of the biologically active compounds in blueberries are absorbed in the small intestine, while the remaining unabsorbed compounds reach the large intestine and colon, where they are available for microbial metabolism [12]. Many of these compounds are modified by gut microbes, resulting in polyphenol products which are known to mediate several physiological effects in the host [13]. Furthermore, the availability of anthocyanins in blueberries alters the composition of the gut microbiome by increasing the abundance of the microbes responsible for the metabolism and conversion of anthocyanins into bioactive xenometabolites [13], thereby demonstrating the impact of blueberry consumption on gut microbiota in rodents [14,15,16]. Considering that the digestibility and bioavailability of blueberries are contingent upon gut microbiota, studies to determine how blueberry consumption impacts gut microbial ecology are warranted.
The influence of sex and diet on gut microbiota is well-established [17,18,19,20]. Changes in diet rapidly alter the composition of microbiota by changing the nutritional environment available for microbes within the gastrointestinal tract [17,21,22,23]. In contrast, sex has been theorized to alter the composition of gut microbiota via an interaction between microbes and sex hormones [18]. Although the exact mechanism underlying this interaction is not fully understood, it appears to be elicited by a sexually-dimorphic immune response [18,19,24,25]. However, most dietary interventions focusing on the gut microbiome do not account for the role of sex. Thus, the interaction between diet and sex, and its effect on the gut microbiome, remain to be fully explored in the context of blueberry consumption.
In the current study, we investigated the effects of blueberry supplementation on the gut microbiota composition in male and female C57BL/6J mice. In addition, we determined whether an altered microbiome was associated with changes in the predicted metabolic functional pathways. Finally, we investigated sexually-dimorphic changes in the microbiome and metabolic function in male and female mice in response to the blueberry diet. Our study provides evidence of marked changes in the composition and functional potential of the gut microbiome following blueberry supplementation in mice. Importantly, these findings strongly suggest that blueberry feeding elicits these differences in a sexually-dimorphic manner. Furthermore, correlations among metabolically relevant functional pathways and microbial families demonstrate a stronger association in male mice relative to female mice.

2. Materials and Methods

2.1. Experimental Design

The mice were group-housed (4–5 mice per cage) in an Association for the Assessment and Accreditation of Laboratory Animal Care-approved animal facility at the Arkansas Children’s Research Institute, with a constant temperature of 22 °C and the lights on from 6:00 a.m. to 6:00 p.m daily. The Institutional Animal Care and Use Committee at the University of Arkansas for Medical Sciences approved all of the animal procedures. Four-week-old male and female C57BL/6J mice were produced from several breeding pairs using multiple dams. The male and female mice were randomly divided into four different groups. The number of mice per group was dictated by power analysis. Using the effect sizes (F_BB n = 9 and F_Con n = 7 for females; and M_BB n = 9 and M_Con n = 10 for males), we computed that we had over 76% power in males and over 93% power in females to detect differences at α = 0.05 between the blueberry diet groups with the samples sizes present herein. Power calculations were designed for the main outcomes, such as weight and body composition, but not for microbiome analysis since the anticipated effect sizes for each taxonomic unit differed and it was hard to estimate a priori.
The mice were randomized to either a control diet (TD.95092, Harlan Teklad, MA, USA) or a blueberry-supplemented diet (containing 5% (by wt) freeze-dried blueberry powder (TD.10679, Harlan Teklad, MA, USA)) provided ad libitum. Freeze-dried whole blueberry (Vaccinium angustifolium) powder (Hi-Actives Wild Blueberry) was kindly provided by VDF/FutureCeuticals, Momence, IL, USA. The nutrient composition of both diets is provided in Table 1. Both diets contained casein as the sole protein source. Mice were divided into four groups: Male mice fed a control diet (M_Con, n = 10), male mice fed a blueberry diet (M_BB, n = 9), female mice fed a control diet (F_Con, n = 7), and female mice fed a blueberry diet (F_BB, n = 9). During the 28-day dietary intervention, body weights were measured weekly and body composition was measured by Echo MRI at the end of the study (at 8 weeks). The mice were euthanized at ~9.00 a.m. in the fed state by carbon dioxide asphyxiation and the cecal contents and other tissues (adipose tissue, liver, muscle, and bone) were collected and snap-frozen for further analysis.

2.2. Microbial Community Profiling Using 16S rRNA Amplicon Sequencing

Genomic DNA was extracted from the cecal contents using the MO BIO PowerSoil DNA Isolation kit (Qiagen, Gaithersburg, MD, USA) with a few modifications. The cecal contents (20–25 mg) were added directly into 96-well plates with beads and recommended buffers in the wells. The sealed plates were shaken horizontally at 20 rpm for 20 min using the MO BIO shaker. The remaining steps were performed as directed by the manufacturer. The extracted DNA was quantitated spectrophotometrically and stored at −20 °C. Fifty nanograms of genomic DNA were utilized for the amplification of the V4 variable region of the 16S rRNA gene using 515F/806R primers. Forward and reverse primers were dual-indexed, as described by Kozich et al., to accommodate the multiplexing of up to 384 samples per run [26]. Paired-end sequencing (2 × 250 bp) of pooled amplicons was carried out on an Illumina MiSeq with ~30% of PhiX DNA [27].

2.3. Bioinformatics Analysis

The processing and quality-filtering of reads were performed by using scripts in QIIME (v1.9.1) [28] and other in-house scripts [29]. Paired reads were stitched with PEAR, an over-lapping paired-end reads merger algorithm, which evaluated all possible paired-end read overlaps, minimizing false-positive hits [30]. The reads were further filtered based on Phred quality scores and, for chimeric reads, using USEARCH61 [31]. The filtered reads (mean counts per sample = 37,971) were de-multiplexed within QIIME and samples with less than 5000 reads were excluded from further analysis. UCLUST was used to cluster sequences into operational taxonomical units (OTUs based on >97% identity) [31]. Operational taxonomical unit (OTU)-picking was performed using an open-reference method which encompassed the clustering of reads against a reference sequence collection, as well as picking out the reads which failed to align with any known reference sequence in the database [32]. To eliminate erroneous mislabeling, the resulting OTU tables were checked for mislabeling sequences [33]. Representative sequences were further aligned using PyNAST with the Greengenes core-set alignment template [34]. Construction of a phylogenetic tree was performed using the default (FASTTREE) method in QIIME [35]. OTUs were normalized by the predicted 16S copy number and functions were predicted with the use of GreenGenes 13_5 databases for KEGG Orthologs.
PICRUSt, a bioinformatics software package designed to predict metagenome functional content from marker gene surveys (e.g., 16S rRNA) and full genomes, was used to identify differences in predictive metagenome function [36].

2.4. Statistical Analysis

The microbiota OTU reads were imported into the R version 3.4.3 (https://cran.r-project.org/) and all statistical analyses were performed using the vegan and phyloseq packages unless specifically noted. The OTU richness was measured by Chao1, while the OTU diversity was measured by several diversity indices (Shannon, Simpson, Inverse Simpson, and Fisher). Group differences in α-diversity (richness and diversity) were assessed by ANOVA. Between-specimen diversity (β-diversity) was assessed by using Bray−Curtis dissimilarities and was then visualized using non-metric multi-dimensional scaling (NMDS). The treatment group differences in β-diversity were assessed on the dissimilarity matrix using permutational multivariate analysis of the variance (PERMANOVA) with 500 permutations. Group differences among taxa-level OTUs were assessed by pairwise comparisons between read counts using Negative Binomial Wald Tests from the DESeq2 package. The OTU relative abundance is given as the median % relative abundance when described in the text. All of the statistical tests used on 16S-rRNA gene sequencing data were considered significant, at p  ≤  0.05. All of the tests were corrected for multiple comparisons using the false discovery rate (FDR) correction by Benjamini and Hochberg. Associations among selected variables were assessed with Spearman’s correlations. An in-house developed R-based Shiny app (DAME) was utilized to facilitate the procedures and statistical analysis described above [37]. All of the statistical analyses were performed and figures were made using R (version 3.4.3, https://cran.r-project.org/). Two-Way ANOVA was used to determine the main effects of the blueberry diet and sex separately, as well as their interactions. The correlation between microbial abundance and predicted metagenomic function was performed using the corrplot package in R and the utilized microbe abundance at the family or genus levels, as described in the specific comparison. The statistical significance was determined at p ≤ 0.05.

3. Results

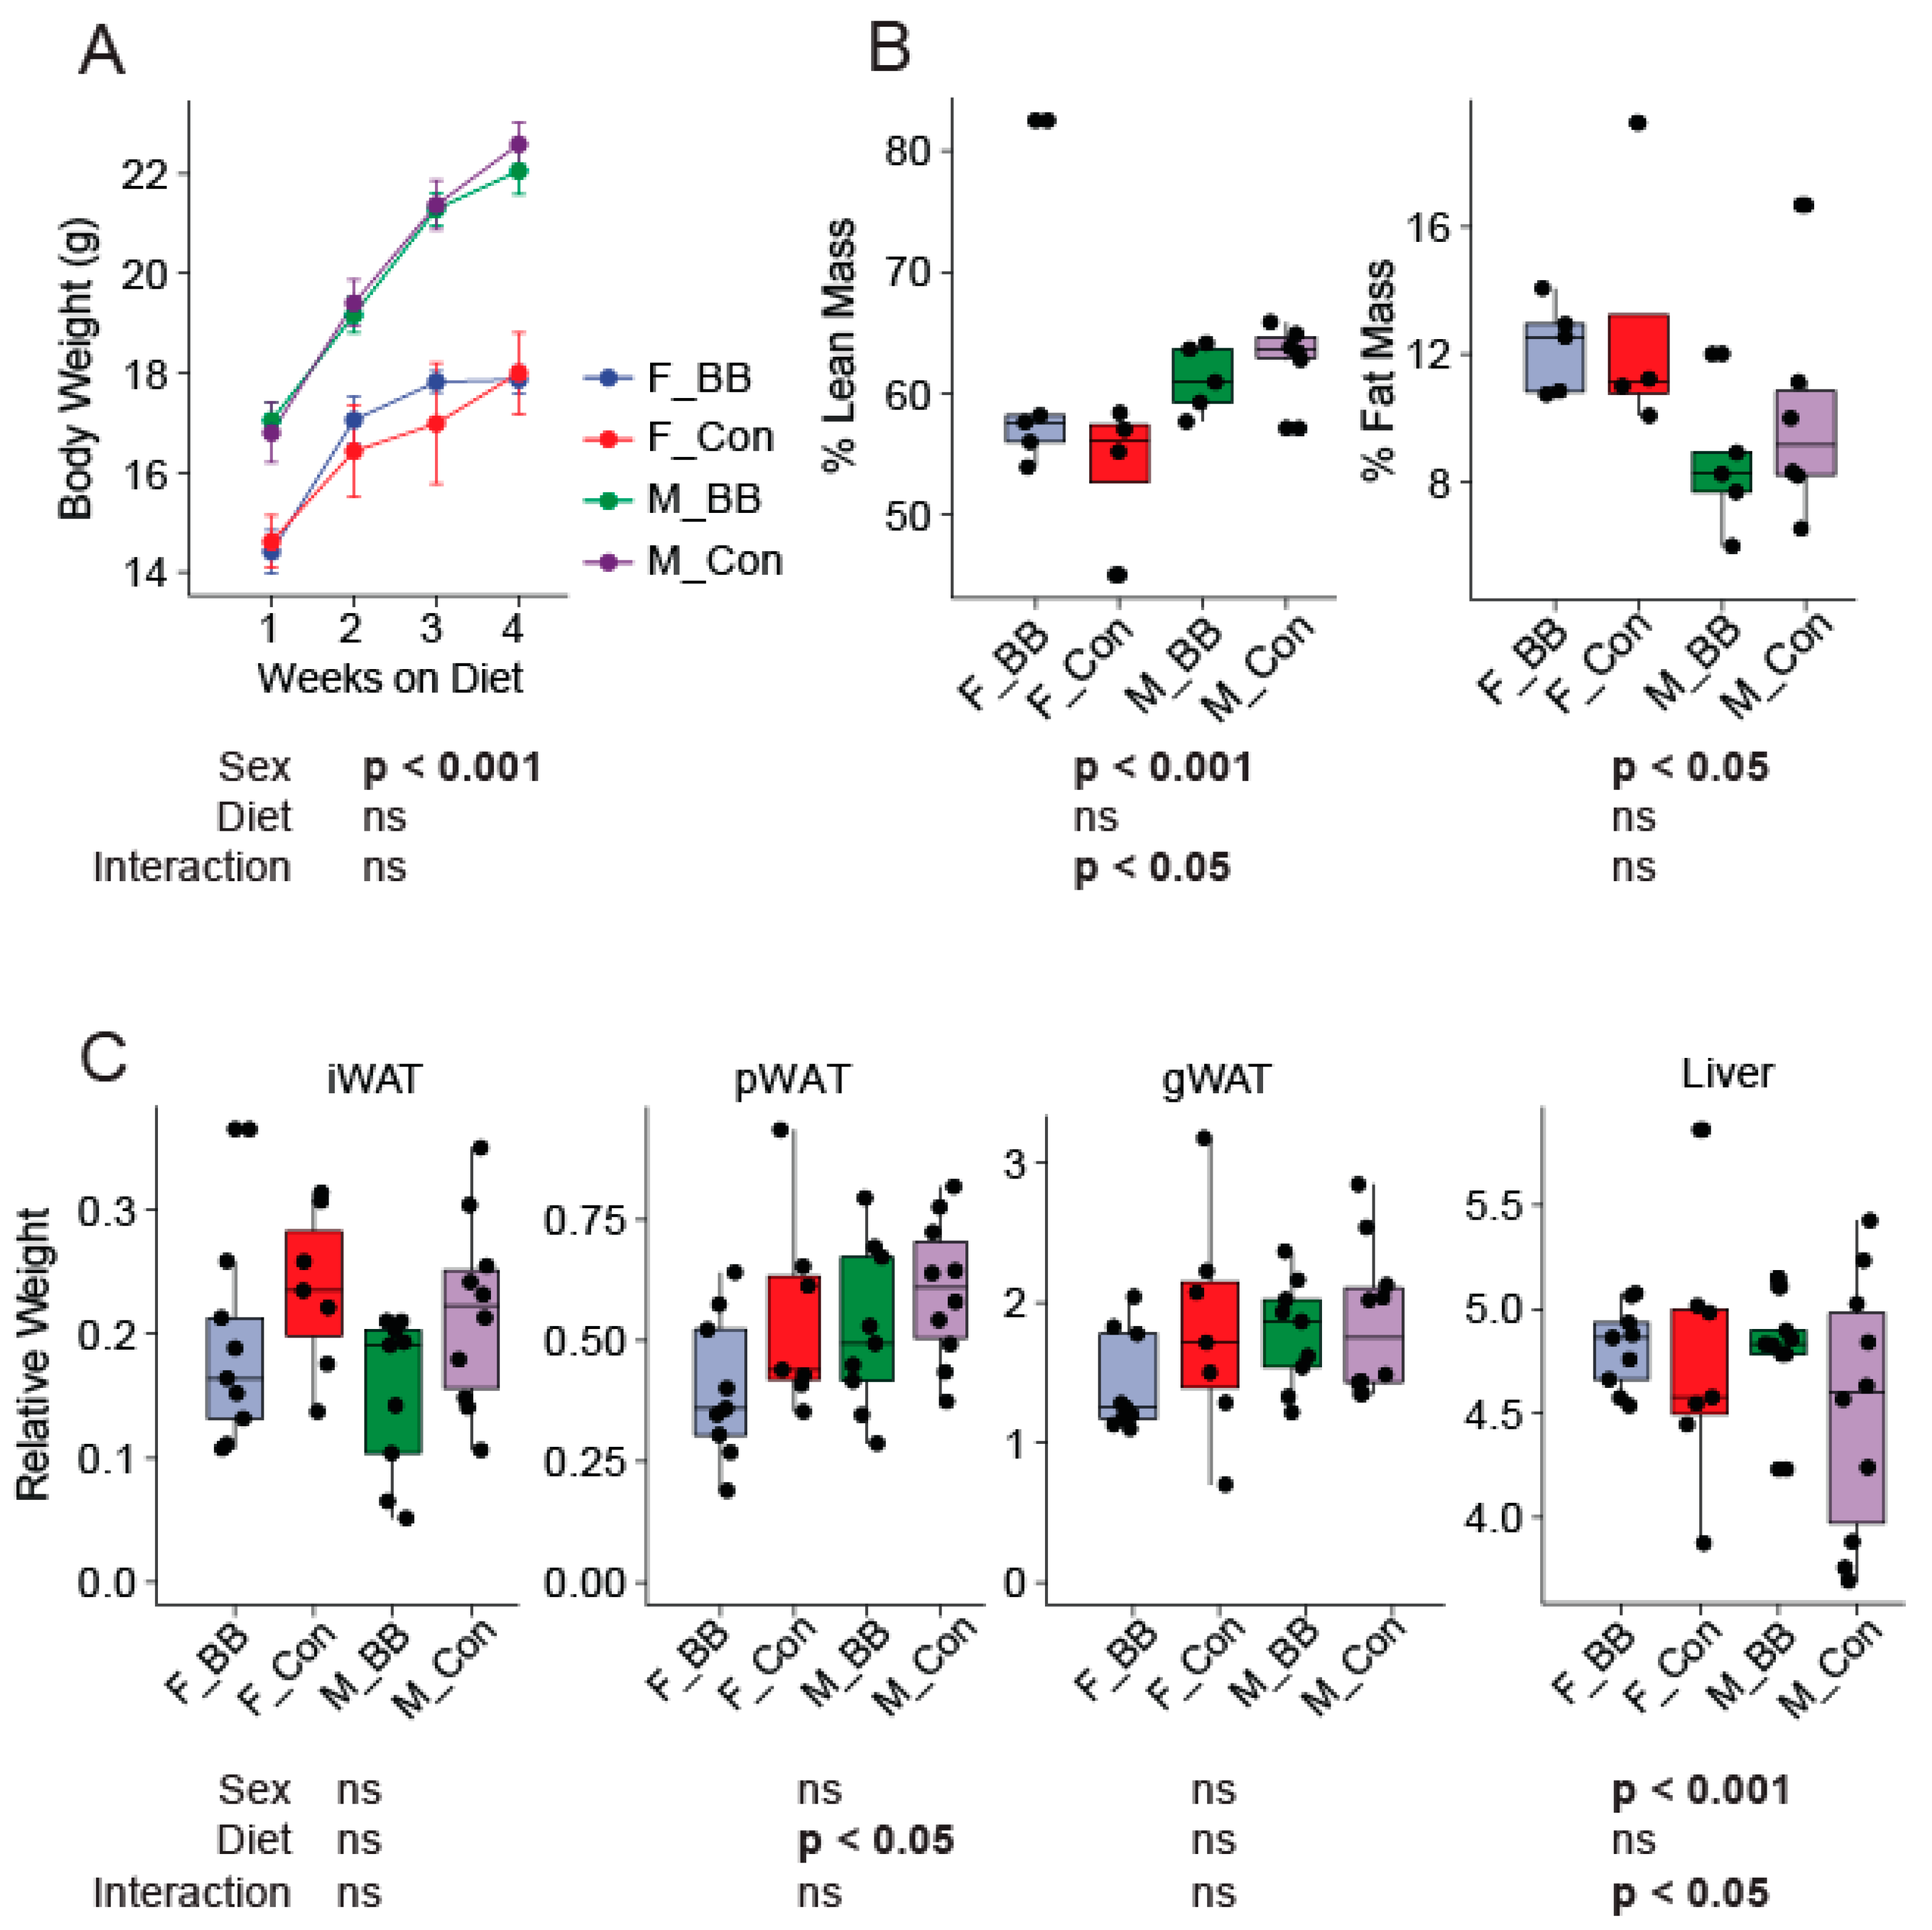
3.1. Body Weight, Body Composition, and Tissue Weights

Dietary blueberry supplementation did not alter the body weights in male and female mice between the blueberry and control diet-fed groups over the four week study period (Figure 1A). The food intake was not different amongst groups (data not shown). There were no diet-associated differences in the percent of fat mass or the percent of lean mass, as measured by MRI, at the end of the study between the groups fed the control or the blueberry diet (Figure 1B). However, the well-documented sex differences in weight gain and body composition were evident. Male mice weighed significantly more than female mice over the four week period (Sex, p < 0.001). The percent of lean mass was greater in male mice relative to female mice and the percent of fat mass was reduced in male mice compared to females (Sex, p < 0.05) (Figure 1B). The relative weights of the inguinal (iWAT) fat depot, gonadal (gWAT) fat depot, and liver normalized to body weight were not different, except for perirenal fat depots (pWAT), which were significantly higher (p < 0.05) in the groups fed the blueberry diet (Figure 1C).

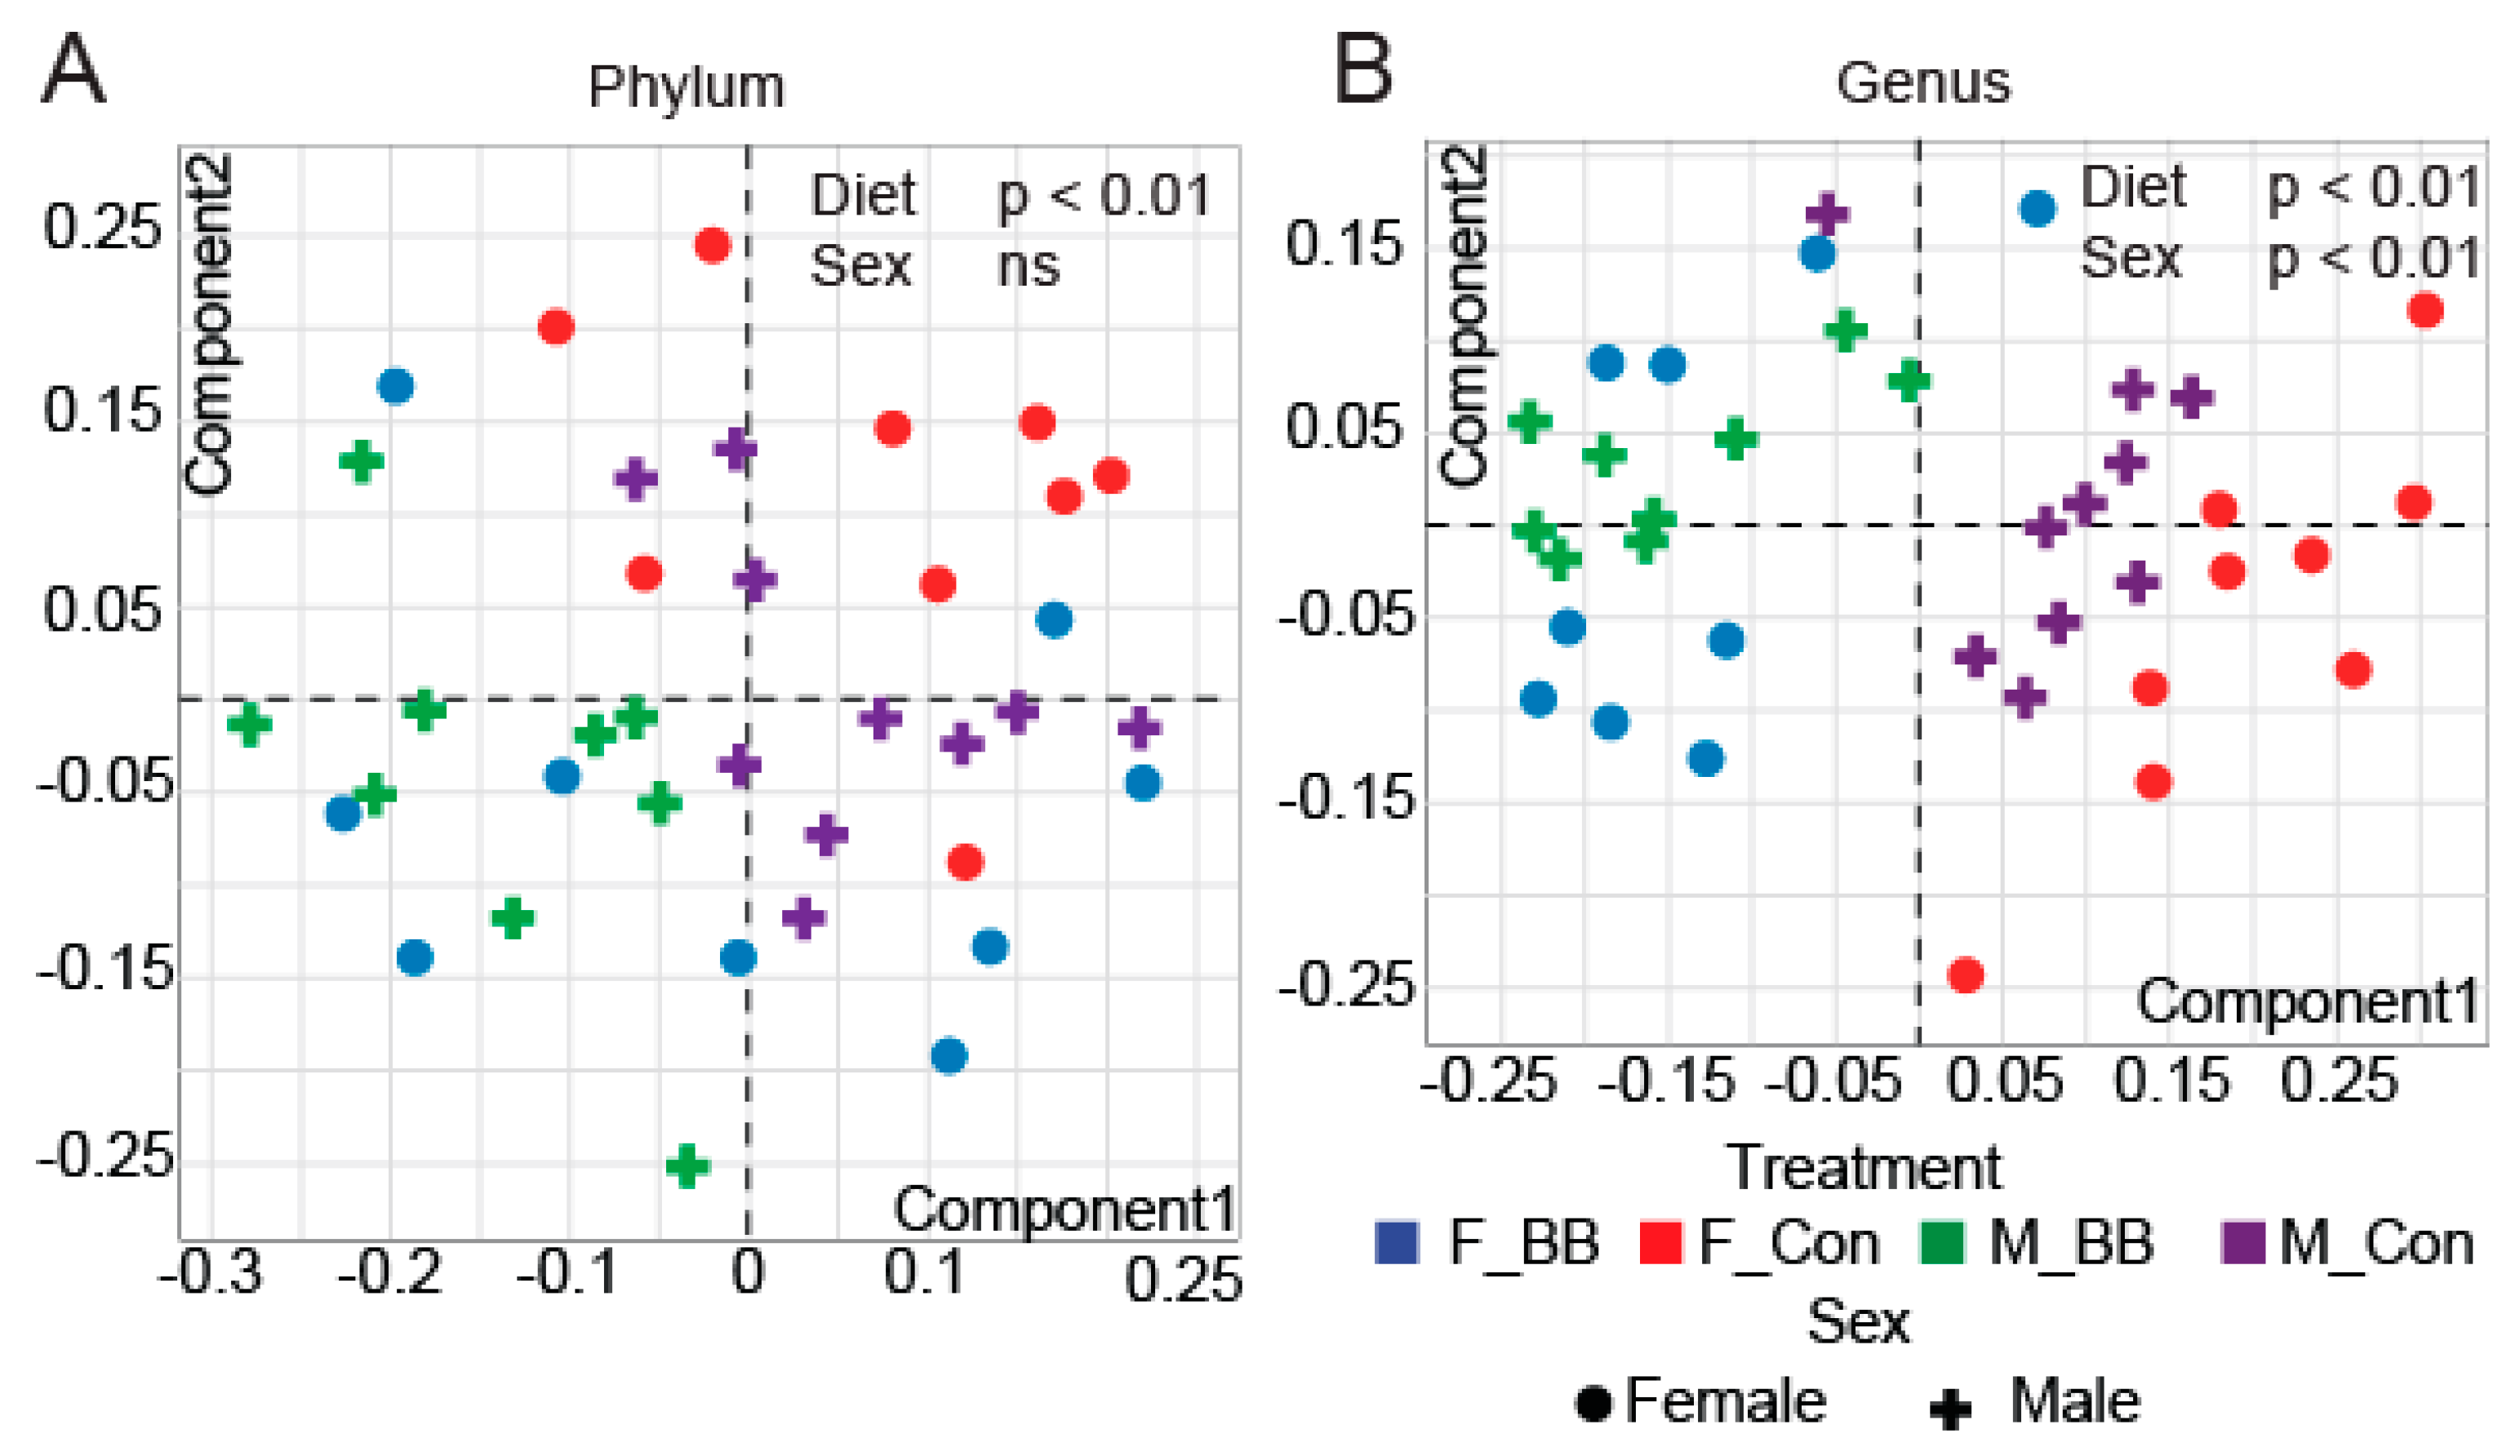
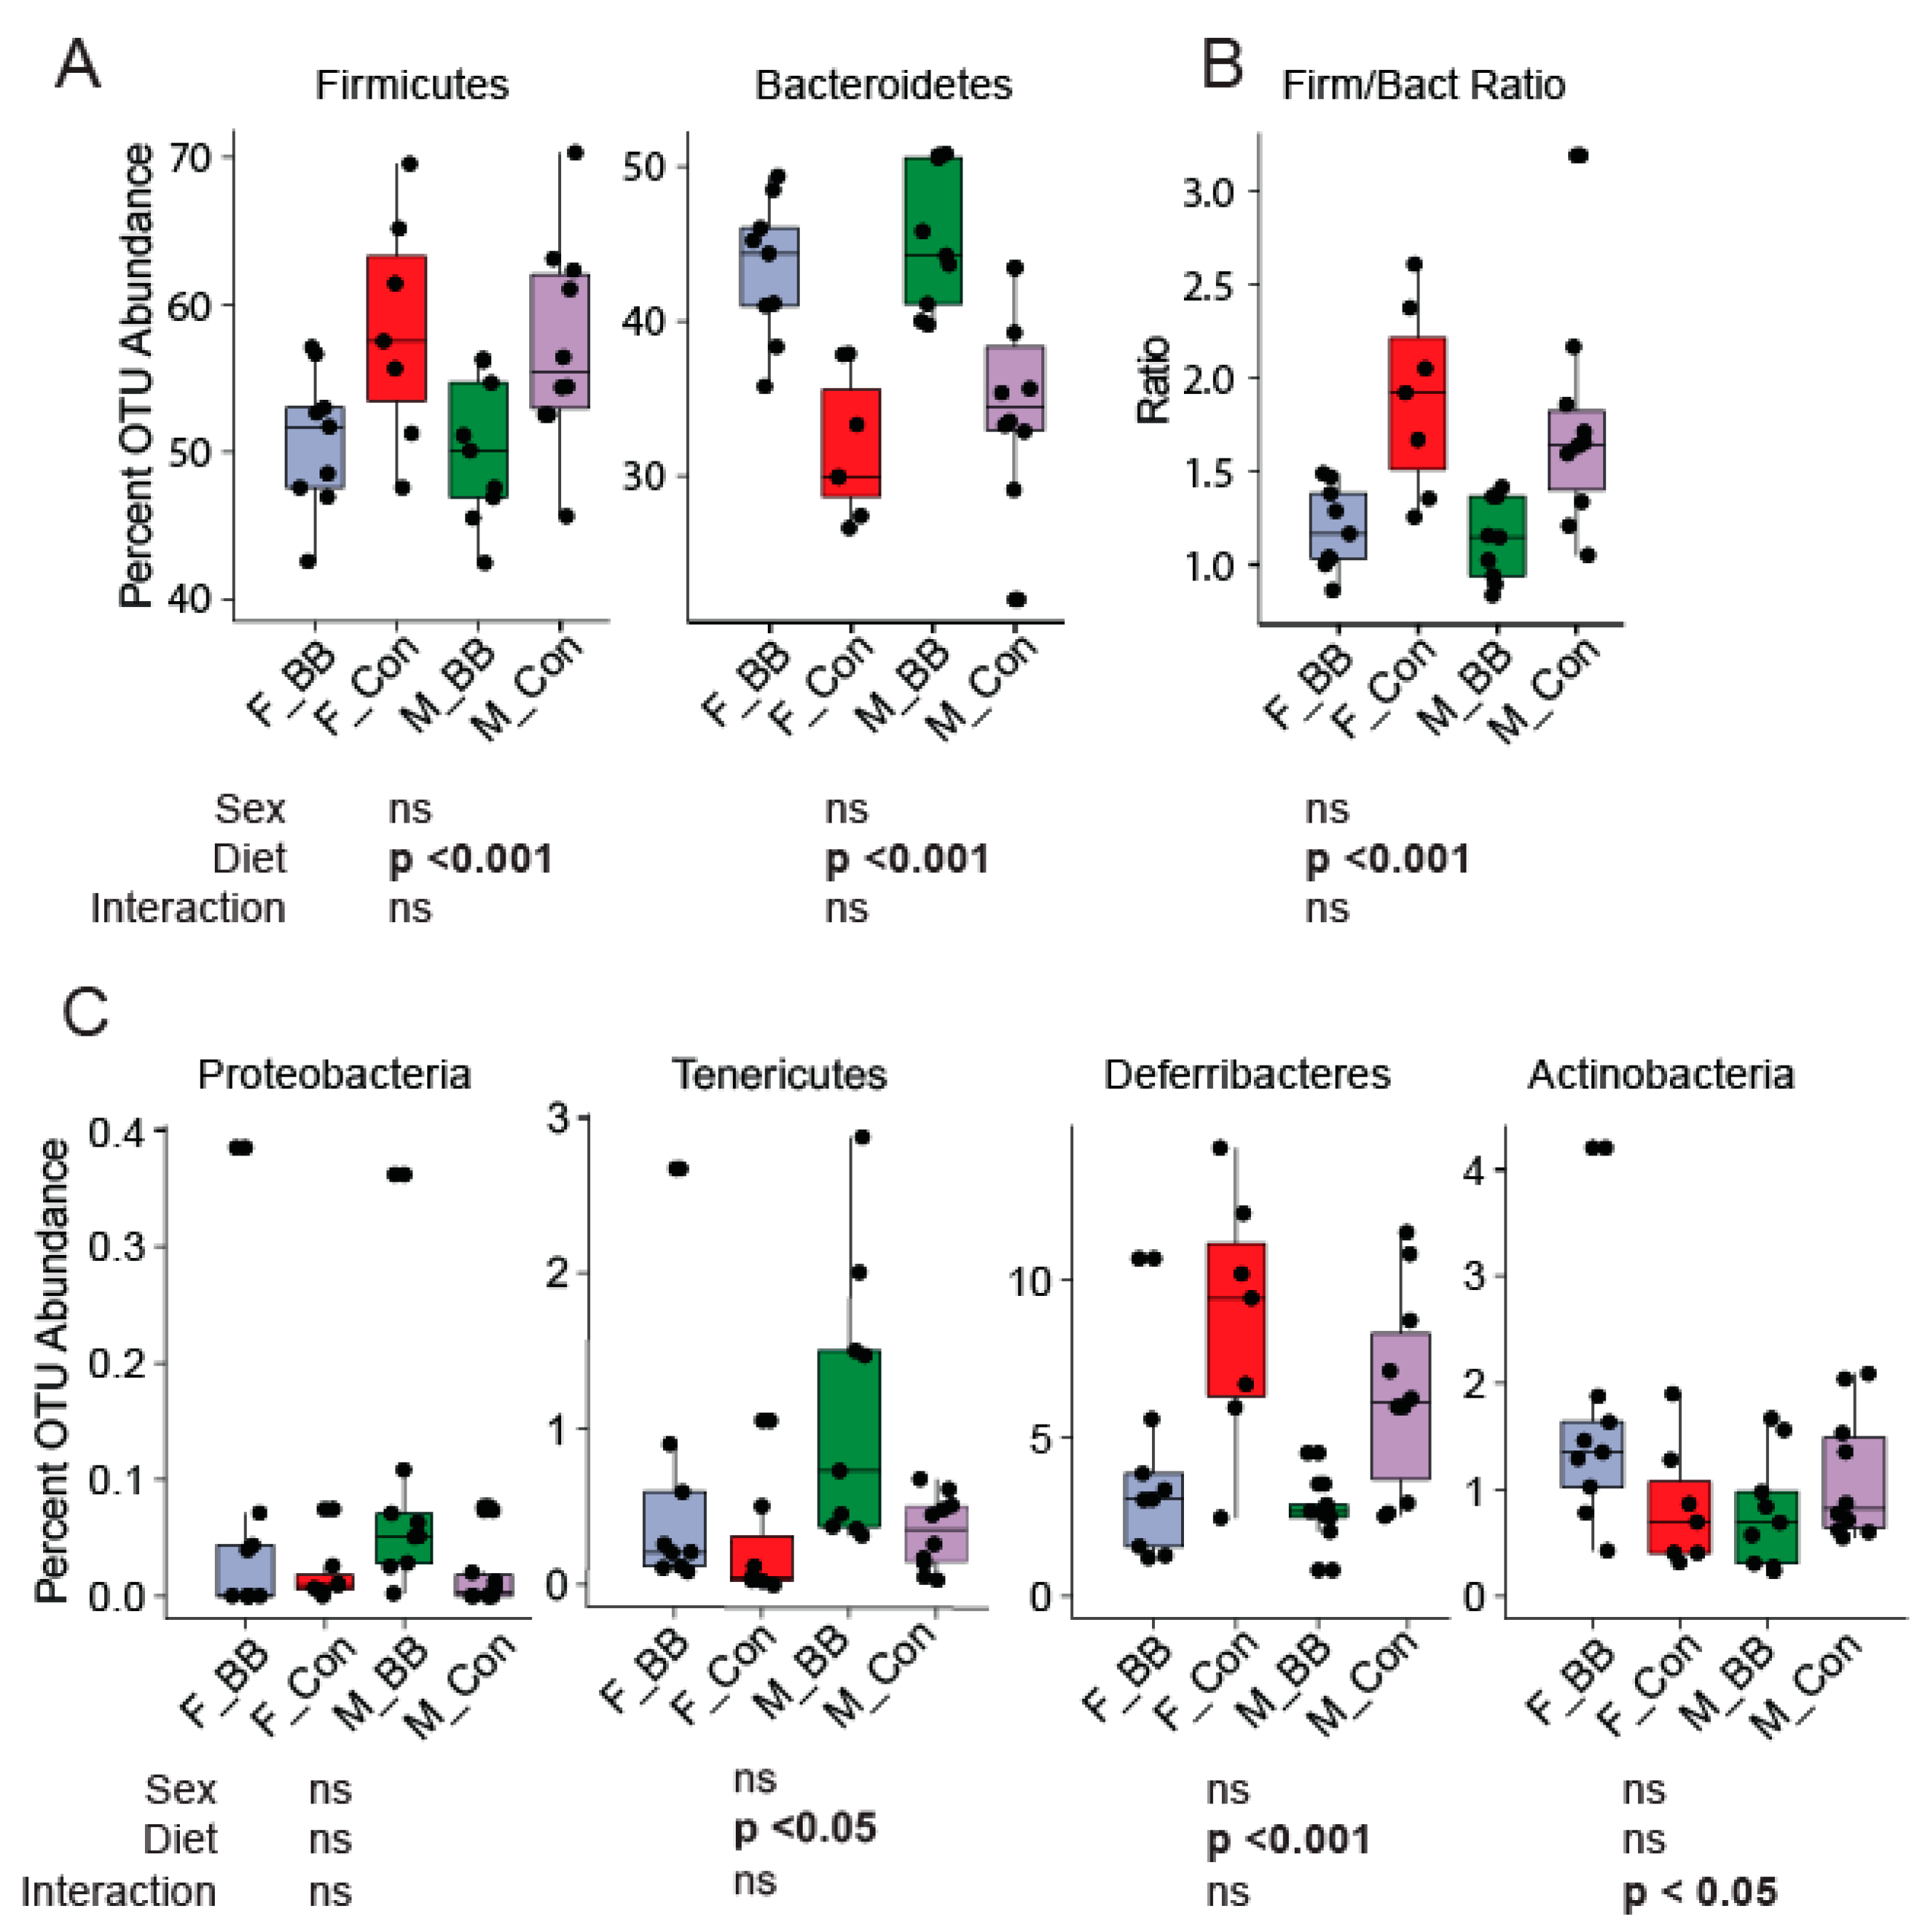
3.2. Gut Microbial Taxonomic Analysis

We analyzed the gut microbiota composition by 16S rRNA amplicon sequencing of cecal contents and observed distinct differences in the microbial taxa associated with blueberry consumption. Microbiome diversity is typically described in terms of within (i.e., α) and between sample (i.e., β) diversities. α-diversity indices, such as Chao1 and the number of Observed OTUs (measures of richness), were significantly increased in blueberry-fed groups in males and reduced in females at the phylum level (Diet × Sex, p < 0.05) (Table 2). At the genus level, blueberries significantly reduced the total observed OTUs and the Chao1 and Fisher indices compared to the control groups in both male and female blueberry-fed mice (Diet, p < 0.05) (Table 2). Non-metric multi-dimensional scaling (NMDS) ordination plots of Bray−Curtis dissimilarities revealed significant differences in β-diversity at all taxonomic levels due to blueberry supplementation in both male and female mice (Diet, p < 0.01). However, sex affected β-diversity at the genus level (p < 0.01) but not at the phylum level (Figure 2A,B).

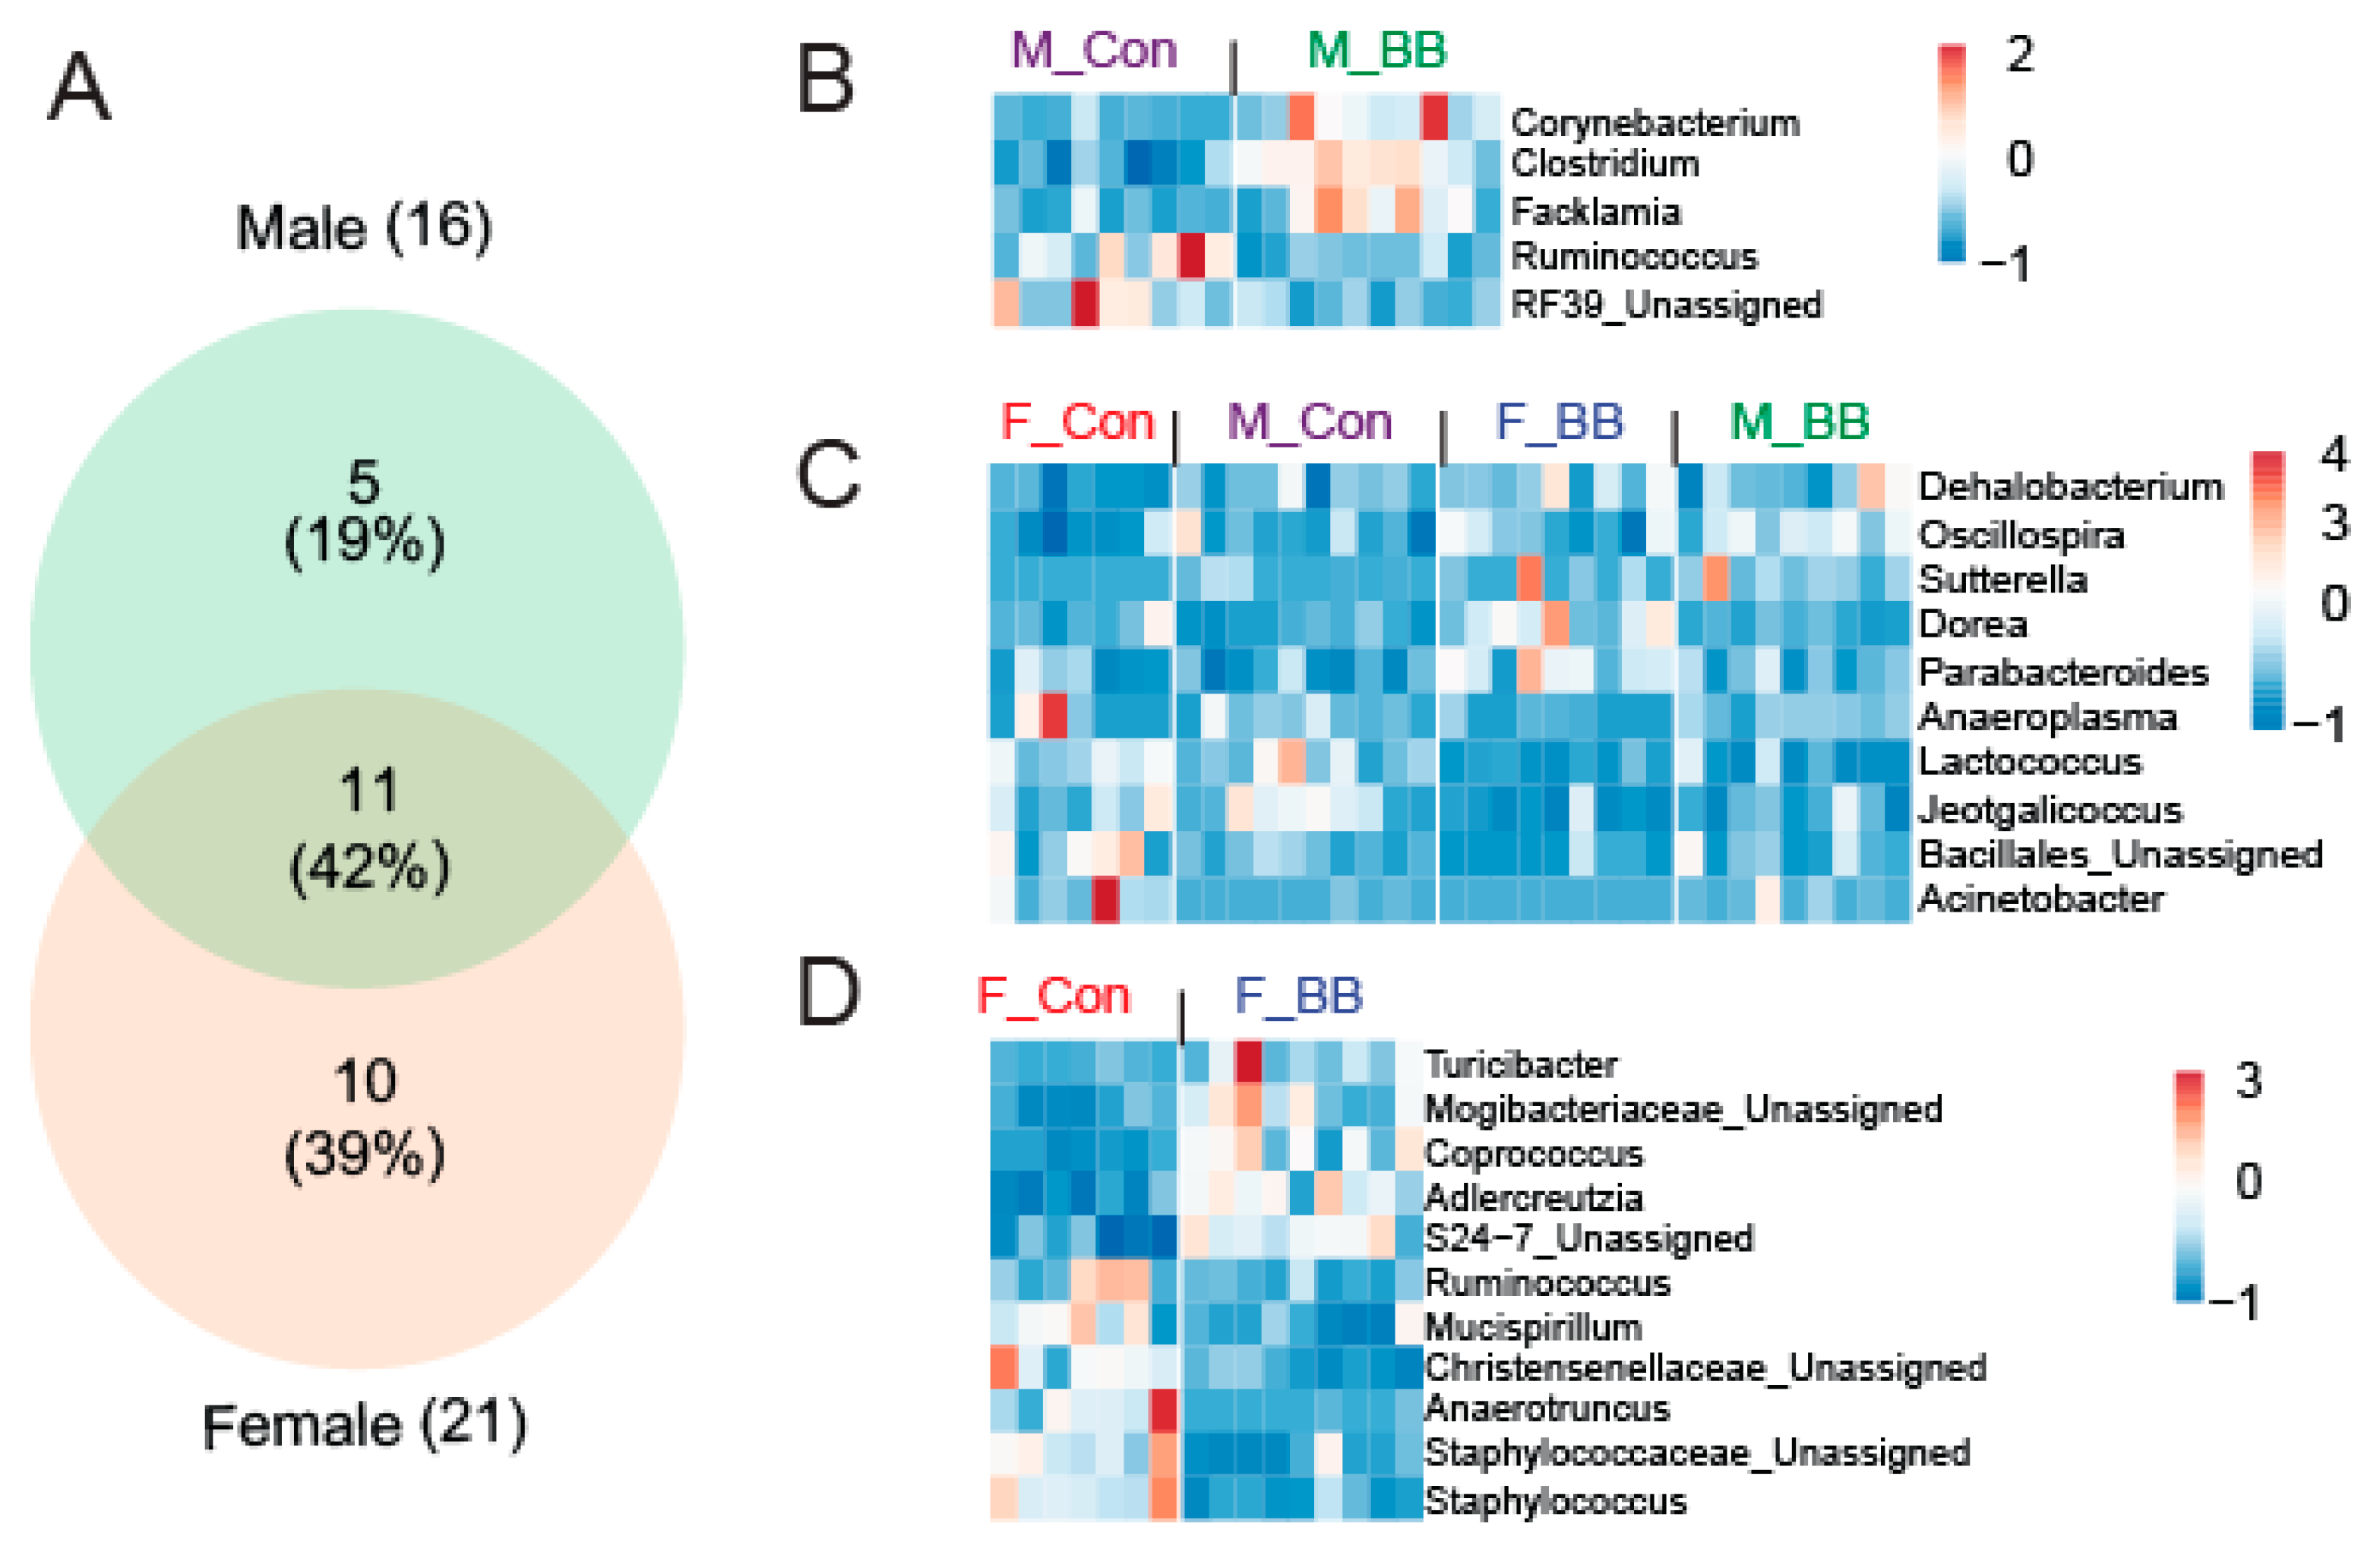
3.3. Blueberry Consumption-Associated Taxonomical Differences

Gut microbiome assessment of specific bacterial phyla revealed significant differences due to supplementation in both male and female mice. Bacteroidetes’ abundance increased, whereas Firmicutes’ abundance decreased significantly in mice fed the blueberry diet (Diet, p < 0.001) (Figure 3A). The Firmicutes to Bacteroidetes ratio was lower in both male and female mice fed blueberry diets compared to mice fed a control diet (p < 0.001) (Figure 3B). Deferribacteres was lower in blueberry-fed mice compared to control diet-fed mice (p < 0.05) (Figure 3C). Tenericutes was higher in blueberry-fed mice in both males and females (p < 0.05) (Figure 3C).
At the genus level, a significant effect of blueberry-feeding was present in 16 genera in males and 21 genera in female mice (p < 0.05). When assessed for commonality and uniqueness among the genera, five genera were unique in males and 10 genera were unique in females, whereas 11 genera were commonly affected in both male and female mice (Figure 4A) following blueberry consumption. Of the five genera unique to males, Corynebacterium, Clostridium, and Facklamia were increased while Ruminococcus and RF39 were decreased in the blueberry-fed groups (Figure 4B). In female mice, Turicibacter, Mogibacteriaceae, Coprococcus, Adlercreutzia, and S24-7 were increased while Ruminococcus, Mucispirillum, Christensenellaceae, Anaerotruncus, and Staphylococcus were decreased in the blueberry-fed groups (Figure 4D). Genera affected by the blueberry diet across both sexes included Dehalobacterium, Oscillospira, Sutterella, Dorea, Parabacteroides, Anaeroplasma, Lactococcus, Jeotgalicoccus, Bacillus, and Acinetobacter (Figure 4C). The detailed relative percent of the OTU abundance at the genus level for individual genera can be found in Table 3.

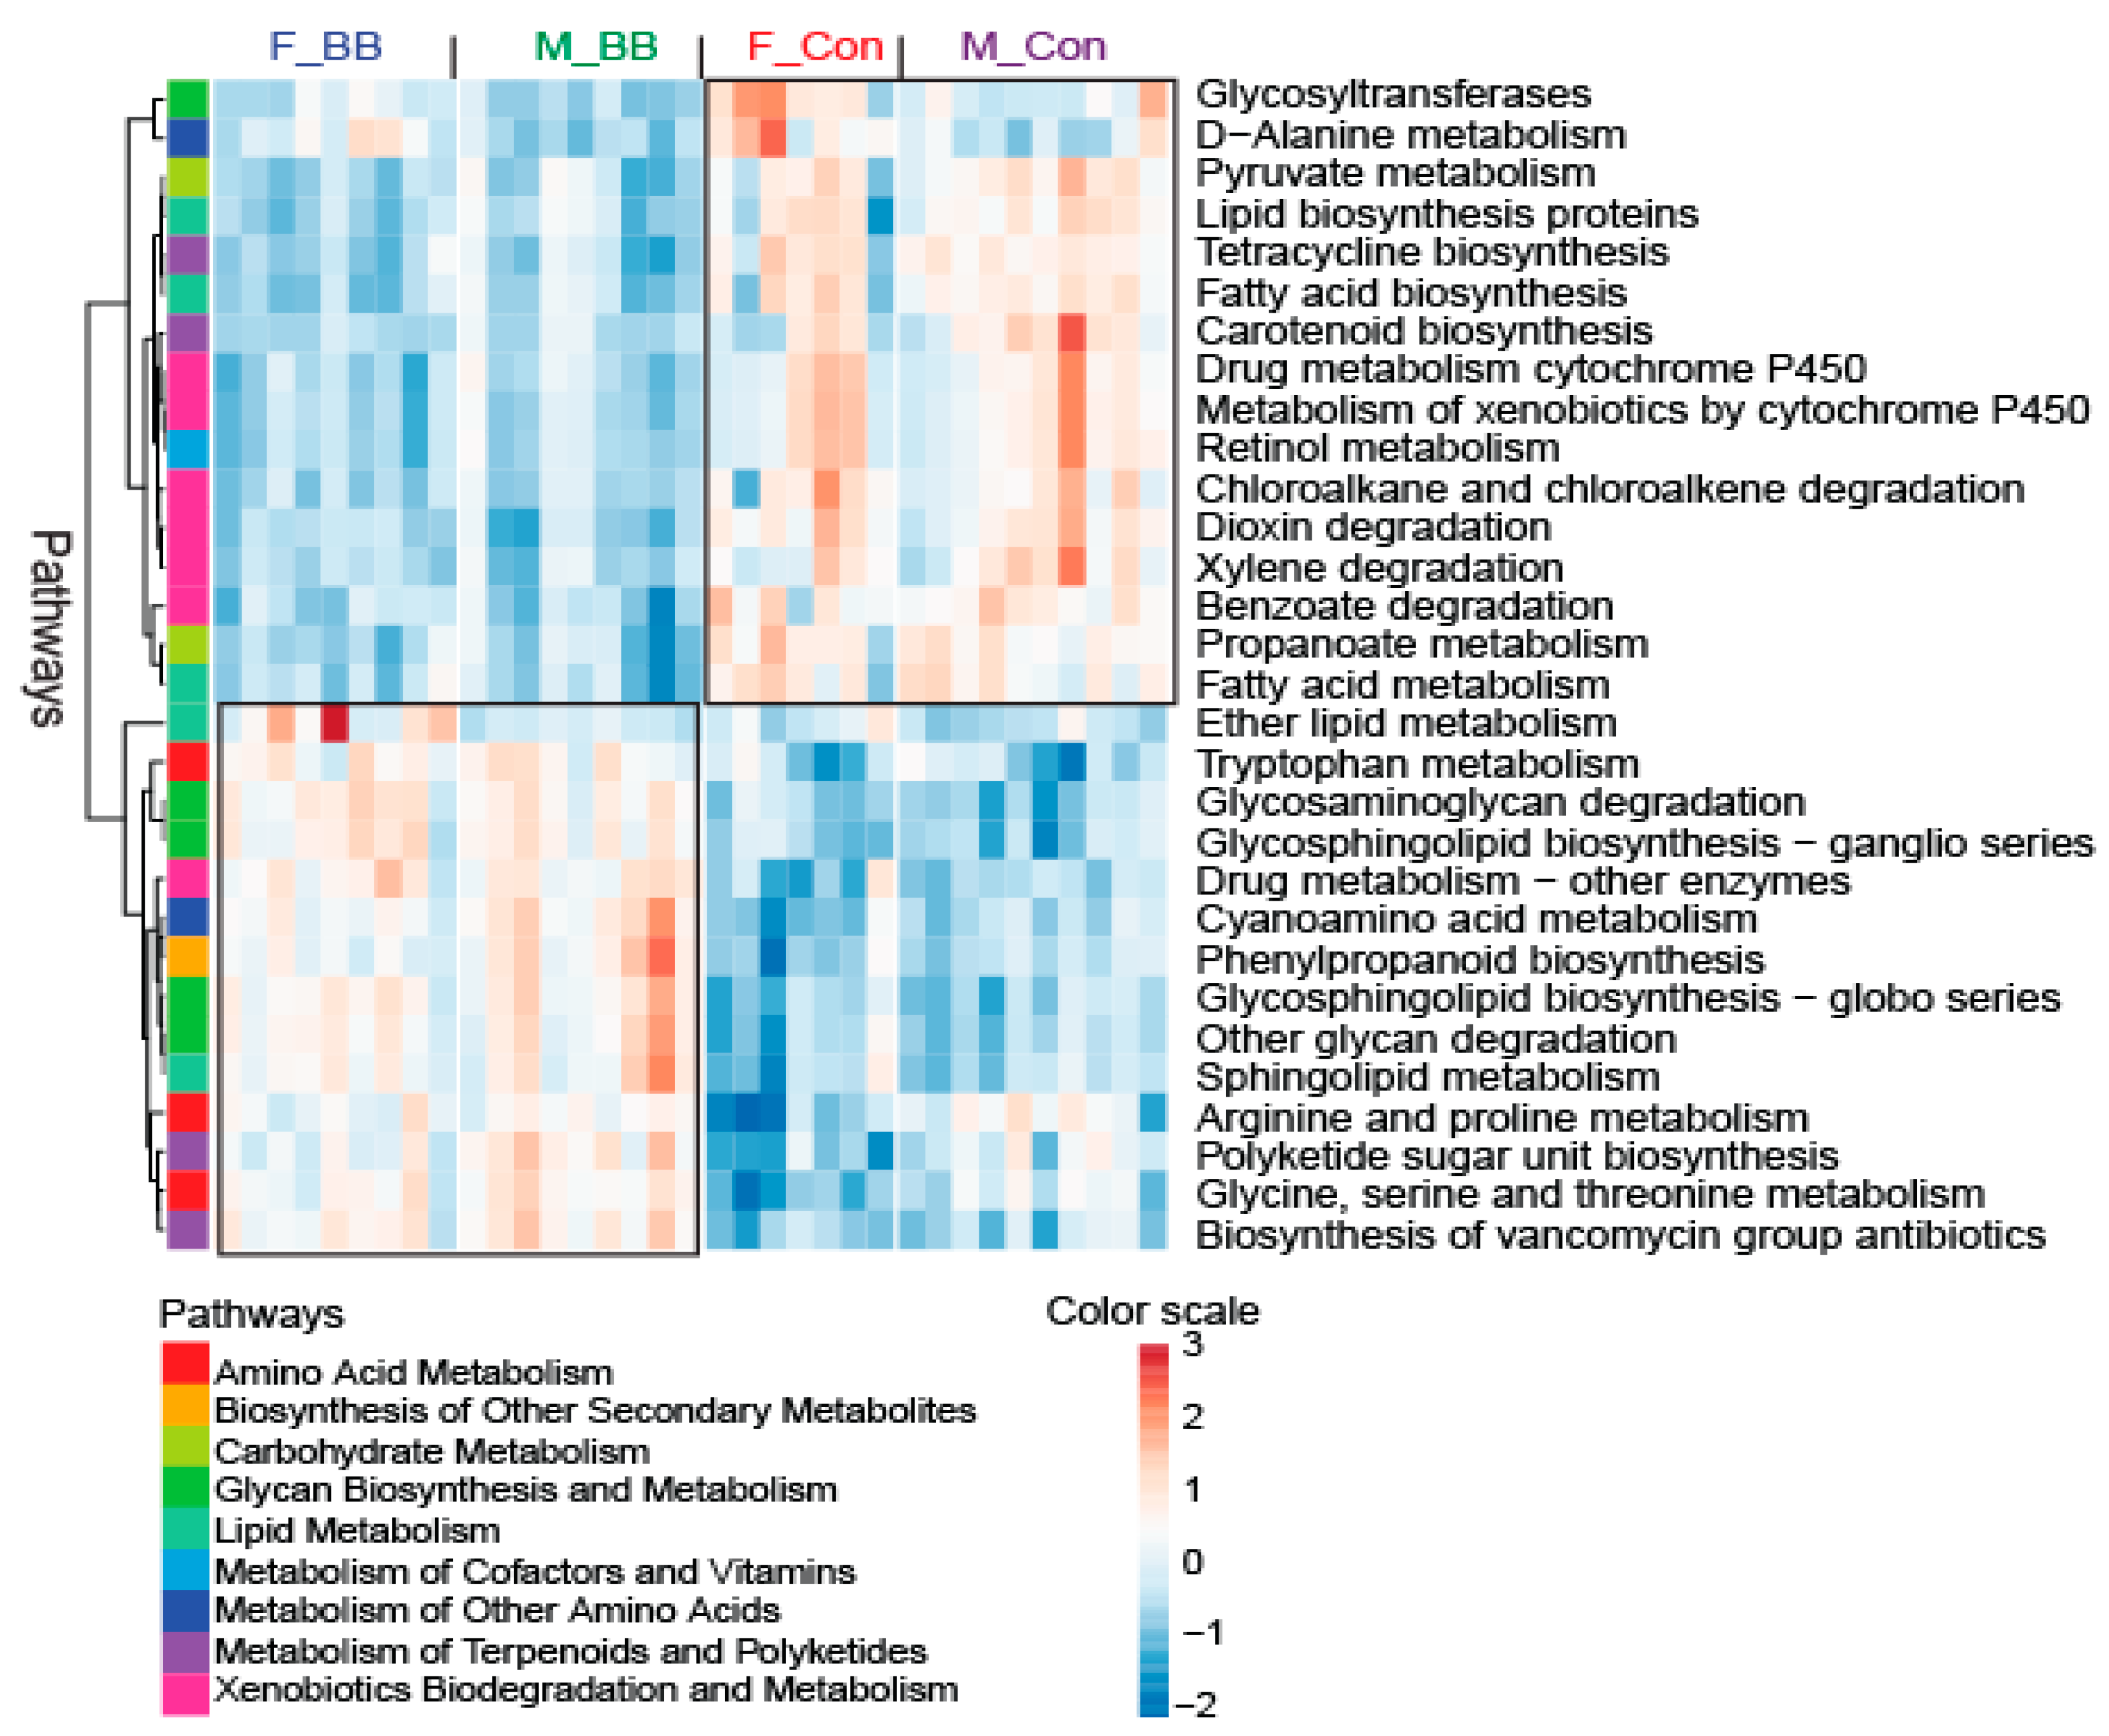
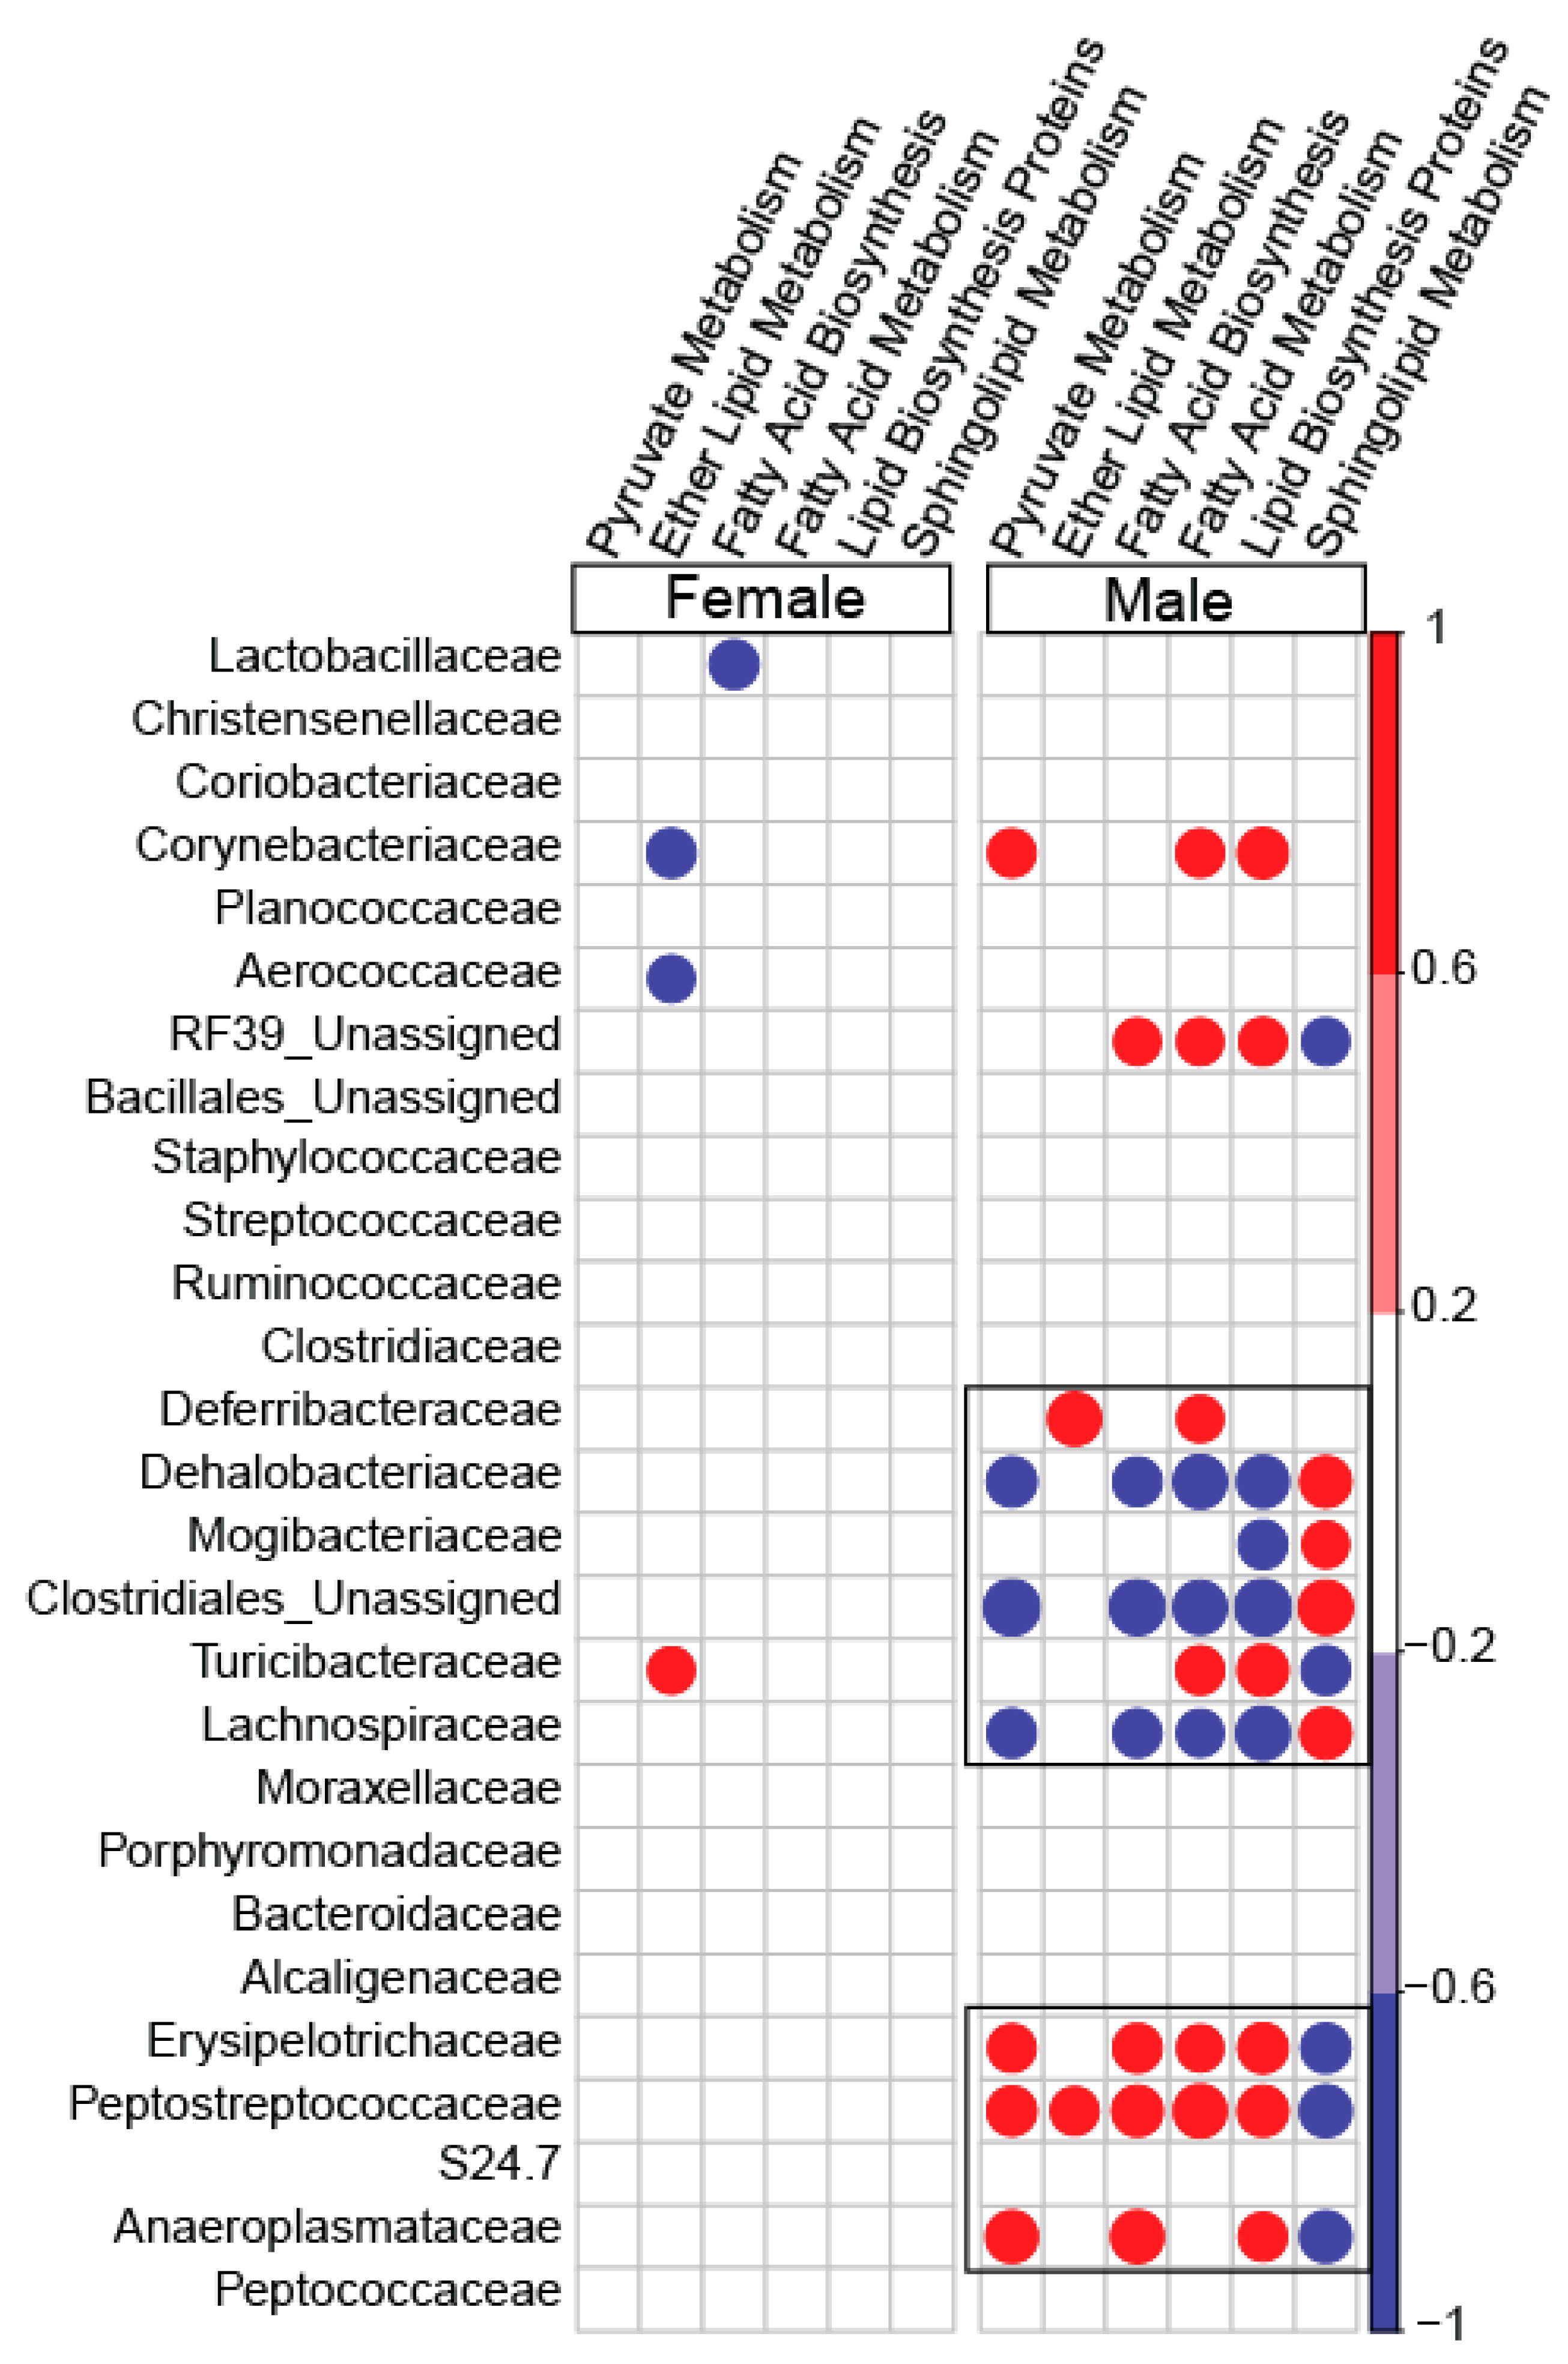
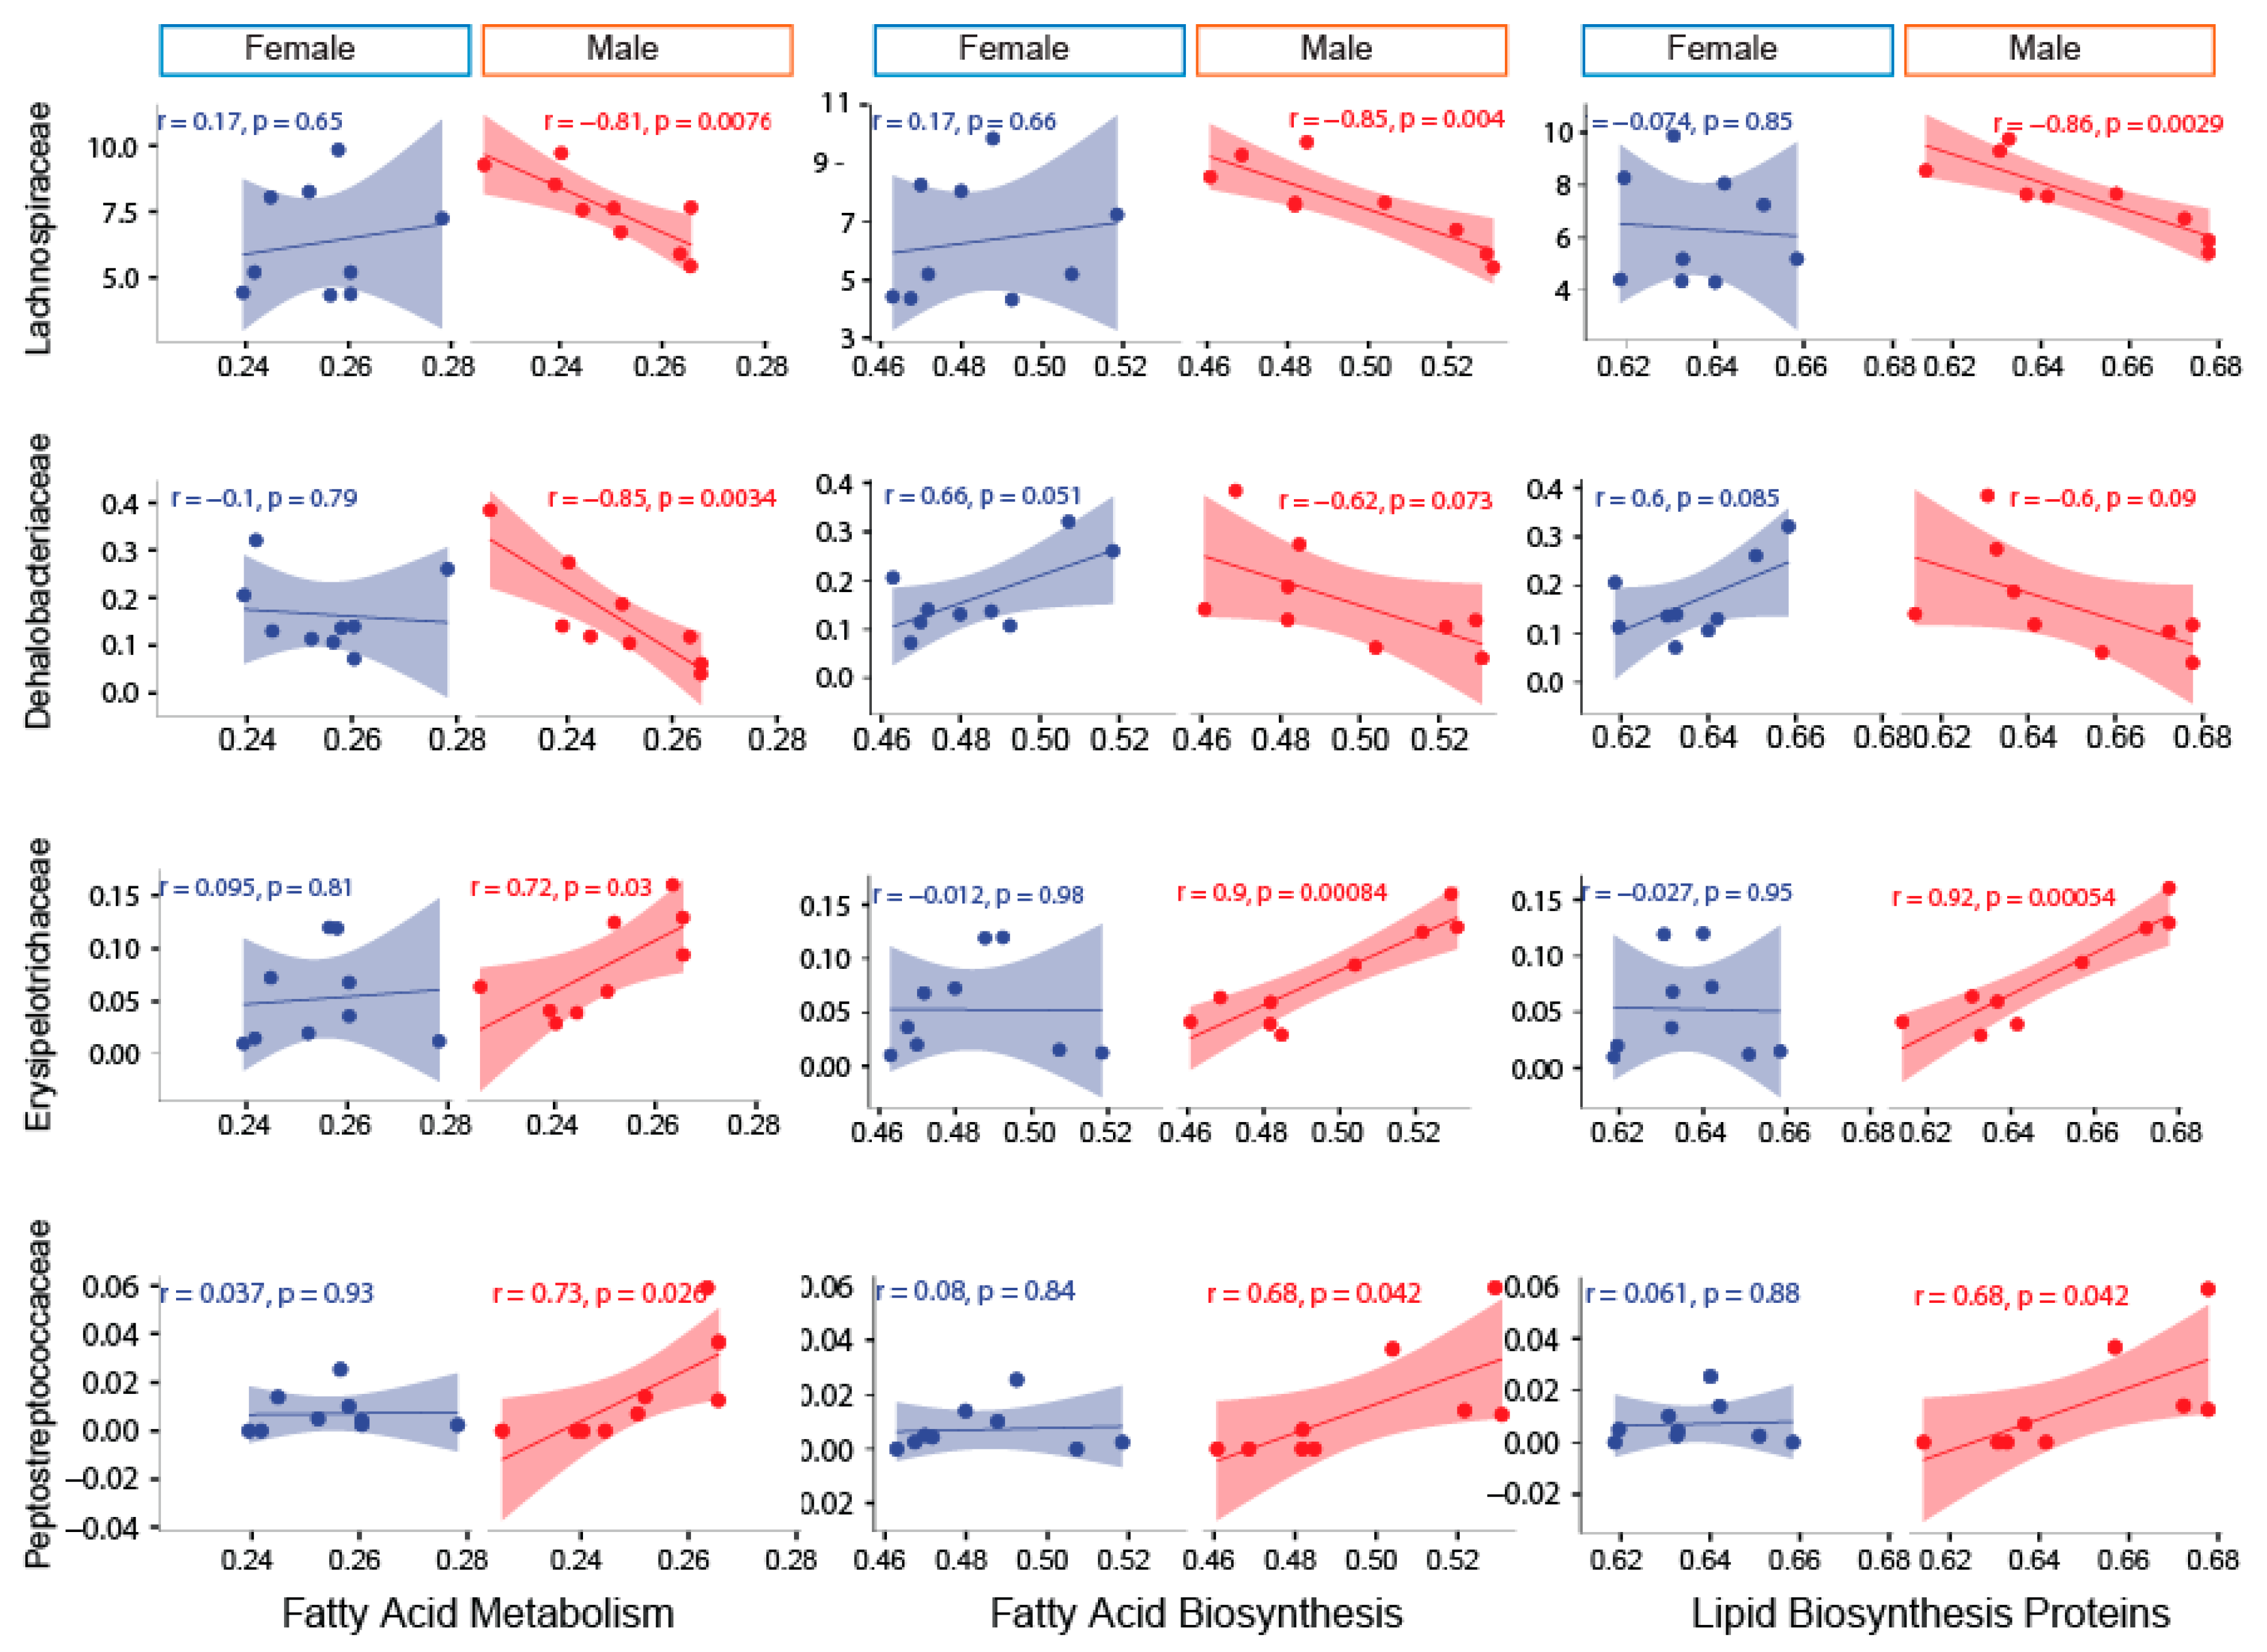
3.4. PICRUSt-Predicted Metabolic Pathways

Overall, blueberry-feeding had a major effect on the predicted metabolic pathways in both male and female mice, based on PICRUSt analysis. Metabolism-related pathways, such as pyruvate metabolism, fatty acid biosynthesis and metabolism, metabolism of xenobiotics, and retinol metabolism, were less-represented in the collective microbial genome in blueberry-fed mice compared to control-fed mice (Figure 5). The abundance of genome encoding factors related to lipid metabolism, tryptophan metabolism, arginine and proline metabolism, and polyketide and sugar unit biosynthesis were higher in control diet-fed mice as compared to blueberry-fed mice (Figure 5).
To determine the association between the family-level abundance and predicted metabolic pathways, five important pathways under the metabolism category were picked. The sexually-dimorphic differences of these pathways and their overall significance in metabolism were the basis for final selection. Pyruvate metabolism, ether lipid metabolism, fatty acid biosynthesis, fatty acid metabolism, lipid biosynthesis protein, and sphingolipid metabolism demonstrated a stronger association with microbial families in blueberry-fed male mice compared to blueberry-fed female mice. Lachnospiraceae and Dehalobacteriaceae were negatively correlated with fatty acid metabolism, including lipid biosynthesis, in male blueberry-fed mice. Erysipelotrichaceae and Peptostreptococcaceae were positively associated with fatty acid metabolism, including lipid biosynthesis, in only male mice. There were no correlations between the aforementioned families and the metabolic pathways in female mice (Figure 6 and Figure 7).

4. Discussion

To our knowledge, there are no reports documenting sexually-dimorphic differences in gut microbiota in response to blueberry supplementation. In the current study, the central question addressed is three-fold: Whether blueberry dietary supplementation led to altered gut microbiota, whether these changes were distinct in male and female mice, and whether the altered microbiome composition was associated with differences in the predictive metabolic function. Remarkably, blueberry diets not only altered the overall microbiome composition but also did so in a sexually-dimorphic manner. These changes translated to changes in the predicted metabolic functional pathway as well. Sexual dimorphism persisted in changes in the predictive metabolic functional pathways, i.e., male mice demonstrated stronger associations with fatty acid and lipid-related pathways compared to their female counterparts on a blueberry diet.
Along with the well-defined impact of sex on physiology and behavior [38], sex-based differences in the gut microbial composition have also been increasingly documented [39,40,41]. Recent studies have provided evidence for differences in gut microbiota composition between the sexes and for the specific influence of diet, as well as sex hormones, on gut microbiota composition [18,42,43]. Factors including allosomally-linked genes, a differential abundance of sex hormones, differential body composition, altered cytokine and hormone profiles, and a distinctive gut microbiota have been implicated in contributing to sexual dimorphism [43,44,45,46]. Of these factors, the role of gonadal steroids, especially estrogens and downstream signaling via estrogen receptors, have been extensively examined to explain sex differences in the metabolism [47,48]. We observed that a number of significantly affected microbial genera, in response to blueberry supplementation, were greater in female (21) compared to male (16) mice. The predicted biological functions of the observed microbial community in the control and blueberry-fed mice were significantly different to animals fed the control diet and followed the sexually-dimorphic pattern. Interestingly, we observed a stronger association among predicted meta-genomic pathways related to lipid and fatty acid metabolism and the Erysipelotrichaceae and Peptostreptococcaceae families in male mice, suggesting that blueberries may promote sex-dependent differences. However, the mechanisms contributing to the observed diet-sex interaction, in response to blueberry supplementation, remain to be studied using a more mechanistic approach.
Blueberries are high in anthocyanins, in addition to other polyphenolic compounds [3], and have anti-oxidant and anti-inflammatory properties [49,50,51,52] which contribute to improved vascular function and increased insulin sensitivity [53,54]. Anthocyanins are not digested or metabolized in the stomach or upper intestine and remain intact until reaching the large intestine, where they are converted to phenolic acids by commensal bacteria [12,55]. It is likely that anthocyanin consumption alters the composition and function of the gut microbiota, leading to an enrichment of bacteria that enhances the metabolism of anthocyanin; however, this bidirectional relationship has not yet been addressed in anthocyanin research, to our knowledge. The current report contributes new knowledge to the repertoire of changes in microbiota associated with the consumption of this dietary factor.
Findings of the current study, showing altered microbial ecology in blueberry-fed mice, are in line with previous reports of other polyphenol-rich foods. In one study, a reduction in the ratio of Firmicutes to Bacteroidetes and an increase in Akkermansia muciniphila was observed following the intake of grape extract (1% Concord grape polyphenols) for 13 weeks in mice [56,57]. These changes conferred protection against the negative consequences of the high-fat diet (HFD), as shown by a reduction in systemic inflammation and an improvement in insulin sensitivity [56,57]. In the current study, OTU abundances of major phyla such as Bacteroidetes and Tenericutes were significantly increased in blueberry-fed mice, which is consistent with a recent study by Lee et al. where they fed blueberry powder (10% by weight) to rats [58]. Akin to our findings, the Firmicutes to Bacteroidetes ratio was significantly lower in blueberry-fed rats. There is evidence supporting the notion of Firmicutes as energy harvesters and Bacteroidetes as energy consumers, and their ratio might be indicative of the state of adiposity [59]. However, in the current study, the shift in the Firmicutes: Bacteroidetes ratio was not accompanied by any differences in adiposity, body weight, or other metabolic endpoints upon blueberry feeding. Liu et al. previously reported that mice fed grape seed proanthocyanidin extract had a higher abundance of Erysipelotrichaceae, Lachnospiraceae, and Peptostreptococcaceae families, which was associated with reduced inflammation and improved insulin sensitivity in mice [60]. Interestingly, we observed a positive association among the predicted meta-genomic pathways related to lipid and fatty acid metabolism and Erysipelotrichaceae and Peptostreptococcaceae families in blueberry-fed mice. This correlation was only observed in male mice, further supporting the idea that blueberry components may promote sex-dependent differences. It remains to be determined in human studies if similar interactions between anthocyanins, or other blueberry components, and the gut microbiota are present.
Blueberry-supplemented diets are known to improve glucose homeostasis and reduce body weight in experimental animals [53,61,62,63]. In our study, blueberry supplementation did not change the body weight or body composition in C57BL/6 mice. Several factors, including the relatively young age of mice (4 week old weanling mice), the shorter duration of dietary intervention (4 weeks), the feeding of blueberry powder rather than pure anthocyanins, and the absence of an obesogenic challenge (viz. high-fat diets) are all likely to have led to the results that we observed in our experiment. Consistent with our study, blueberry supplementation for shorter durations did not change the body weight or tissue weights in diabetic mice [64] and rats [58]. Nonetheless, the duration of dietary exposure was sufficient to dramatically reconfigure the gut microbiome of the mice, consistent with a predominant role of the diet on gut microbiota.
The predicted functional profiling of microbial communities provides an insight into the genetic make-up of the microbial population and how it might impact the host’s biological pathways [36]. The predicted biological functions of the observed microbial community in control and blueberry-fed mice were significantly different to those of control-fed animals. Blueberry supplementation during the current study impacted a total of 27 metabolic pathways irrespective of sex. Microbial pathways impacting pyruvate metabolism, lipid biosynthesis, fatty acid biosynthesis, metabolism of xenobiotics, and chloroalkane and chloroalkene degradation were lower in blueberry-fed mice. Pathways including tryptophan metabolism, cyanoamino acid metabolism, arginine and proline metabolism, and glycine, serine, and threonine metabolism were increased in the microbial genome of blueberry-fed mice. The down-regulated pathways correlated with the reduced Firmicutes’ and increased Bacteroidetes’ abundance in blueberry-fed groups. The enzymatic biotransformation of blueberries may also be relevant for xenobiotic metabolism, which may allow the conversion of many classes of compounds, including flavonoids, isoflavonoids, lignans, phenolic acids, fiber, and tannins [65,66]. In our study, we noticed an increase in meta-genomic functional pathways associated with xenobiotic degradation and benzoate degradation in mice fed a blueberry diet relative to those fed a control diet. Lee et al. reported the increased short-chain fatty acid (SCFA) production in blueberry-fed rats [58]. Changes in predicted pathways upon blueberry supplementation, especially the metabolism-related pathways, might change the production of SCFAs in these mice.

5. Conclusions

In conclusion, our study demonstrated that blueberry supplementation in male and female mice led to compositional changes in the gut microbiota at all taxonomic levels. These changes also led to an alteration in the predicted metabolic pathways, which revealed stronger associations between specific pathway-enriched bacterial genomes and select microbes only in male mice. Thus, our study provides further support that the biological effects of blueberries are associated with alterations in the gut microbiota. The current study provides novel insights into the repertoire of these changes and advances our understanding of the effects of blueberry-enriched diets. The study also highlights diet-sex interactions in the gut microbiota. However, the present findings primarily describe the observed associations between changes in the microbiome and the predicted metabolic pathways, without any metabolic functional assessment, and are associative in nature. Future studies are needed to make causal inferences about the role of the altered microbiome and to ascertain the functional significance. These studies would ideally involve microbiome manipulation (via antibiotics) or transplantation (into germ-free animals). Future experiments involving human subjects that explore these relationships will be required to understand which findings are recapitulated in the context of dietary blueberry consumption.

Author Contributions

U.D.W., J.-R.C., and K.S.; conception and design of the research; U.D.W., Y.Z., J.-R.C., O.P.L., and K.S.; performed experiments; U.D.W., J.R.-C., B.D.P., S.V.C., and K.S.; analyzed data; U.D.W., J.R.-C., B.D.P., and K.S.; interpreted the results of experiments; U.D.W.; prepared figures and drafted the manuscript; U.D.W., J.R.-C., S.V.C., B.D.P., and K.S.; edited and revised the manuscript; U.D.W. and K.S.; approved the final version of the manuscript.

Funding

This study was supported by the USDA-Agriculture Research Service Project 6026-51000-010-05S.

Acknowledgments

We thank Matt Ferguson, Jim Sikes, Trey Pittman, Bobby Fay, Jessica Besancon, Mallory Jayroe, and other members of the Arkansas Children’s Nutrition Center Animal Research Facility for assistance with the animal studies. We also thank Clark Sims and Sean Adams for the useful comments during the manuscript preparation.

Conflicts of Interest

No conflicts of interest, financial or otherwise, are declared by the author(s).

References

  1. National Nutrient Database for Standard Reference Release 28; ARS-2016; United States Department of Agriculture: Washington, DC, USA, 2016.
  2. Wang, S.Y.; Lin, H.S. Antioxidant activity in fruits and leaves of blackberry, raspberry, and strawberry varies with cultivar and developmental stage. J. Agric. Food Chem. 2000, 48, 140–146. [Google Scholar] [CrossRef] [PubMed]
  3. Wu, X.; Beecher, G.R.; Holden, J.M.; Haytowitz, D.B.; Gebhardt, S.E.; Prior, R.L. Concentrations of anthocyanins in common foods in the United States and estimation of normal consumption. J. Agric. Food Chem. 2006, 54, 4069–4075. [Google Scholar] [CrossRef] [PubMed]
  4. Scalbert, A.; Manach, C.; Morand, C.; Remesy, C.; Jimenez, L. Dietary polyphenols and the prevention of diseases. Crit. Rev. Food Sci. Nutr. 2005, 45, 287–306. [Google Scholar] [CrossRef] [PubMed]
  5. Khurana, S.; Venkataraman, K.; Hollingsworth, A.; Piche, M.; Tai, T.C. Polyphenols: Benefits to the cardiovascular system in health and in aging. Nutrients 2013, 5, 3779–3827. [Google Scholar] [CrossRef] [PubMed]
  6. Kalt, W.; Forney, C.F.; Martin, A.; Prior, R.L. Antioxidant capacity, vitamin C, phenolics, and anthocyanins after fresh storage of small fruits. J. Agric. Food Chem. 1999, 47, 4638–4644. [Google Scholar] [CrossRef] [PubMed]
  7. Seeram, N.P.; Adams, L.S.; Zhang, Y.; Lee, R.; Sand, D.; Scheuller, H.S.; Heber, D. Blackberry, black raspberry, blueberry, cranberry, red raspberry, and strawberry extracts inhibit growth and stimulate apoptosis of human cancer cells in vitro. J. Agric. Food Chem. 2006, 54, 9329–9339. [Google Scholar] [CrossRef] [PubMed]
  8. Neto, C.C. Cranberry and blueberry: Evidence for protective effects against cancer and vascular diseases. Mol. Nutr. Food Res. 2007, 51, 652–664. [Google Scholar] [CrossRef] [PubMed]
  9. Liu, M.; Li, X.Q.; Weber, C.; Lee, C.Y.; Brown, J.; Liu, R.H. Antioxidant and antiproliferative activities of raspberries. J. Agric. Food Chem. 2002, 50, 2926–2930. [Google Scholar] [CrossRef]
  10. Chen, J.R.; Lazarenko, O.P.; Wu, X.; Kang, J.; Blackburn, M.L.; Shankar, K.; Badger, T.M.; Ronis, M.J. Dietary-induced serum phenolic acids promote bone growth via p38 MAPK/beta-catenin canonical Wnt signaling. J. Bone Miner. Res. 2010, 25, 2399–2411. [Google Scholar] [CrossRef]
  11. Chen, J.R.; Lazarenko, O.P.; Zhang, J.; Blackburn, M.L.; Ronis, M.J.; Badger, T.M. Diet-derived phenolic acids regulate osteoblast and adipocyte lineage commitment and differentiation in young mice. J. Bone Miner. Res. 2014, 29, 1043–1053. [Google Scholar] [CrossRef]
  12. McGhie, T.K.; Walton, M.C. The bioavailability and absorption of anthocyanins: Towards a better understanding. Mol. Nutr. Food Res. 2007, 51, 702–713. [Google Scholar] [CrossRef] [PubMed]
  13. Bolca, S.; Van de Wiele, T.; Possemiers, S. Gut metabotypes govern health effects of dietary polyphenols. Curr. Opin. Biotechnol. 2013, 24, 220–225. [Google Scholar] [CrossRef] [PubMed]
  14. Rebello, C.J.; Burton, J.; Heiman, M.; Greenway, F.L. Gastrointestinal microbiome modulator improves glucose tolerance in overweight and obese subjects: A randomized controlled pilot trial. J. Diabetes Complicat. 2015, 29, 1272–1276. [Google Scholar] [CrossRef] [PubMed]
  15. Burton, J.H.; Johnson, M.; Johnson, J.; Hsia, D.S.; Greenway, F.L.; Heiman, M.L. Addition of a Gastrointestinal Microbiome Modulator to Metformin Improves Metformin Tolerance and Fasting Glucose Levels. J. Diabetes Sci. Technol. 2015, 9, 808–814. [Google Scholar] [CrossRef] [PubMed]
  16. Lacombe, A.; Li, R.W.; Klimis-Zacas, D.; Kristo, A.S.; Tadepalli, S.; Krauss, E.; Young, R.; Wu, V.C. Lowbush wild blueberries have the potential to modify gut microbiota and xenobiotic metabolism in the rat colon. PLoS ONE 2013, 8, e67497. [Google Scholar] [CrossRef] [PubMed]
  17. Muegge, B.D.; Kuczynski, J.; Knights, D.; Clemente, J.C.; Gonzalez, A.; Fontana, L.; Henrissat, B.; Knight, R.; Gordon, J.I. Diet drives convergence in gut microbiome functions across mammalian phylogeny and within humans. Science 2011, 332, 970–974. [Google Scholar] [CrossRef] [PubMed]
  18. Markle, J.G.; Frank, D.N.; Mortin-Toth, S.; Robertson, C.E.; Feazel, L.M.; Rolle-Kampczyk, U.; von Bergen, M.; McCoy, K.D.; Macpherson, A.J.; Danska, J.S. Sex differences in the gut microbiome drive hormone-dependent regulation of autoimmunity. Science 2013, 339, 1084–1088. [Google Scholar] [CrossRef] [PubMed]
  19. Freire, A.C.; Basit, A.W.; Choudhary, R.; Piong, C.W.; Merchant, H.A. Does sex matter? The influence of gender on gastrointestinal physiology and drug delivery. Int. J. Pharm. 2011, 415, 15–28. [Google Scholar] [CrossRef] [PubMed]
  20. De Filippo, C.; Cavalieri, D.; Di Paola, M.; Ramazzotti, M.; Poullet, J.B.; Massart, S.; Collini, S.; Pieraccini, G.; Lionetti, P. Impact of diet in shaping gut microbiota revealed by a comparative study in children from Europe and rural Africa. Proc. Natl. Acad. Sci. USA 2010, 107, 14691–14696. [Google Scholar] [CrossRef] [PubMed]
  21. Wu, G.D.; Chen, J.; Hoffmann, C.; Bittinger, K.; Chen, Y.Y.; Keilbaugh, S.A.; Bewtra, M.; Knights, D.; Walters, W.A.; Knight, R.; et al. Linking long-term dietary patterns with gut microbial enterotypes. Science 2011, 334, 105–108. [Google Scholar] [CrossRef] [PubMed]
  22. David, L.A.; Maurice, C.F.; Carmody, R.N.; Gootenberg, D.B.; Button, J.E.; Wolfe, B.E.; Ling, A.V.; Devlin, A.S.; Varma, Y.; Fischbach, M.A.; et al. Diet rapidly and reproducibly alters the human gut microbiome. Nature 2014, 505, 559–563. [Google Scholar] [CrossRef] [PubMed]
  23. Baars, A.; Oosting, A.; Lohuis, M.; Koehorst, M.; El Aidy, S.; Hugenholtz, F.; Smidt, H.; Mischke, M.; Boekschoten, M.V.; Verkade, H.J.; et al. Sex differences in lipid metabolism are affected by presence of the gut microbiota. Sci. Rep. 2018, 8, 13426. [Google Scholar] [CrossRef] [PubMed]
  24. Bolnick, D.I.; Snowberg, L.K.; Hirsch, P.E.; Lauber, C.L.; Org, E.; Parks, B.; Lusis, A.J.; Knight, R.; Caporaso, J.G.; Svanback, R. Individual diet has sex-dependent effects on vertebrate gut microbiota. Nat. Commun. 2014, 5, 4500. [Google Scholar] [CrossRef] [PubMed]
  25. Davis, D.J.; Hecht, P.M.; Jasarevic, E.; Beversdorf, D.Q.; Will, M.J.; Fritsche, K.; Gillespie, C.H. Sex-specific effects of docosahexaenoic acid (DHA) on the microbiome and behavior of socially-isolated mice. Brain Behav. Immun. 2017, 59, 38–48. [Google Scholar] [CrossRef] [PubMed]
  26. Kozich, J.J.; Westcott, S.L.; Baxter, N.T.; Highlander, S.K.; Schloss, P.D. Development of a dual-index sequencing strategy and curation pipeline for analyzing amplicon sequence data on the MiSeq Illumina sequencing platform. Appl. Environ. Microbiol. 2013, 79, 5112–5120. [Google Scholar] [CrossRef] [PubMed]
  27. Bokulich, N.A.; Subramanian, S.; Faith, J.J.; Gevers, D.; Gordon, J.I.; Knight, R.; Mills, D.A.; Caporaso, J.G. Quality-filtering vastly improves diversity estimates from Illumina amplicon sequencing. Nat. Methods 2013, 10, 57–59. [Google Scholar] [CrossRef] [PubMed]
  28. Caporaso, J.G.; Kuczynski, J.; Stombaugh, J.; Bittinger, K.; Bushman, F.D.; Costello, E.K.; Fierer, N.; Pena, A.G.; Goodrich, J.K.; Gordon, J.I.; et al. QIIME allows analysis of high-throughput community sequencing data. Nat. Methods 2010, 7, 335–336. [Google Scholar] [CrossRef] [PubMed]
  29. Wankhade, U.D.; Zhong, Y.; Kang, P.; Alfaro, M.; Chintapalli, S.V.; Thakali, K.M.; Shankar, K. Enhanced offspring predisposition to steatohepatitis with maternal high-fat diet is associated with epigenetic and microbiome alterations. PLoS ONE 2017, 12, e0175675. [Google Scholar] [CrossRef]
  30. Zhang, J.; Kobert, K.; Flouri, T.; Stamatakis, A. PEAR: A fast and accurate Illumina Paired-End reAd mergeR. Bioinformatics 2014, 30, 614–620. [Google Scholar] [CrossRef] [PubMed]
  31. Edgar, R.C. Search and clustering orders of magnitude faster than BLAST. Bioinformatics 2010, 26, 2460–2461. [Google Scholar] [CrossRef] [PubMed]
  32. Rideout, J.R.; He, Y.; Navas-Molina, J.A.; Walters, W.A.; Ursell, L.K.; Gibbons, S.M.; Chase, J.; McDonald, D.; Gonzalez, A.; Robbins-Pianka, A.; et al. Subsampled open-reference clustering creates consistent, comprehensive OTU definitions and scales to billions of sequences. PeerJ 2014, 2, e545. [Google Scholar] [CrossRef] [PubMed]
  33. Knights, D.; Kuczynski, J.; Charlson, E.S.; Zaneveld, J.; Mozer, M.C.; Collman, R.G.; Bushman, F.D.; Knight, R.; Kelley, S.T. Bayesian community-wide culture-independent microbial source tracking. Nat. Methods 2011, 8, 761–763. [Google Scholar] [CrossRef] [PubMed]
  34. McDonald, D.; Price, M.N.; Goodrich, J.; Nawrocki, E.P.; DeSantis, T.Z.; Probst, A.; Andersen, G.L.; Knight, R.; Hugenholtz, P. An improved Greengenes taxonomy with explicit ranks for ecological and evolutionary analyses of bacteria and archaea. ISME J. 2012, 6, 610–618. [Google Scholar] [CrossRef] [PubMed]
  35. Price, M.N.; Dehal, P.S.; Arkin, A.P. FastTree 2—Approximately maximum-likelihood trees for large alignments. PLoS ONE 2010, 5, e9490. [Google Scholar] [CrossRef] [PubMed]
  36. Langille, M.G.; Zaneveld, J.; Caporaso, J.G.; McDonald, D.; Knights, D.; Reyes, J.A.; Clemente, J.C.; Burkepile, D.E.; Vega Thurber, R.L.; Knight, R.; et al. Predictive functional profiling of microbial communities using 16S rRNA marker gene sequences. Nat. Biotechnol. 2013, 31, 814–821. [Google Scholar] [CrossRef] [PubMed]
  37. Piccolo, B.D.; Wankhade, U.D.; Chintapalli, S.V.; Bhattacharyya, S.; Luo, C.; Shankar, K. Dynamic Assessment of Microbial Ecology (DAME): A web app for interactive analysis and visualization of microbial sequencing data. Bioinformatics 2017, 34, 1050–1052. [Google Scholar] [CrossRef]
  38. Van Nas, A.; Guhathakurta, D.; Wang, S.S.; Yehya, N.; Horvath, S.; Zhang, B.; Ingram-Drake, L.; Chaudhuri, G.; Schadt, E.E.; Drake, T.A.; et al. Elucidating the role of gonadal hormones in sexually dimorphic gene coexpression networks. Endocrinology 2009, 150, 1235–1249. [Google Scholar] [CrossRef] [PubMed]
  39. Mueller, S.; Saunier, K.; Hanisch, C.; Norin, E.; Alm, L.; Midtvedt, T.; Cresci, A.; Silvi, S.; Orpianesi, C.; Verdenelli, M.C.; et al. Differences in fecal microbiota in different European study populations in relation to age, gender, and country: A cross-sectional study. Appl. Environ. Microbiol. 2006, 72, 1027–1033. [Google Scholar] [CrossRef] [PubMed]
  40. Shastri, P.; McCarville, J.; Kalmokoff, M.; Brooks, S.P.; Green-Johnson, J.M. Sex differences in gut fermentation and immune parameters in rats fed an oligofructose-supplemented diet. Biol. Sex Differ. 2015, 6, 13. [Google Scholar] [CrossRef] [PubMed]
  41. Gomez, A.; Luckey, D.; Taneja, V. The gut microbiome in autoimmunity: Sex matters. Clin. Immunol. 2015, 159, 154–162. [Google Scholar] [CrossRef]
  42. Yurkovetskiy, L.; Burrows, M.; Khan, A.A.; Graham, L.; Volchkov, P.; Becker, L.; Antonopoulos, D.; Umesaki, Y.; Chervonsky, A.V. Gender bias in autoimmunity is influenced by microbiota. Immunity 2013, 39, 400–412. [Google Scholar] [CrossRef] [PubMed]
  43. Org, E.; Mehrabian, M.; Parks, B.W.; Shipkova, P.; Liu, X.; Drake, T.A.; Lusis, A.J. Sex differences and hormonal effects on gut microbiota composition in mice. Gut Microbes 2016, 7, 313–322. [Google Scholar] [CrossRef] [PubMed]
  44. Chen, X.; McClusky, R.; Chen, J.; Beaven, S.W.; Tontonoz, P.; Arnold, A.P.; Reue, K. The number of x chromosomes causes sex differences in adiposity in mice. PLoS Genet. 2012, 8, e1002709. [Google Scholar] [CrossRef] [PubMed]
  45. Laaksonen, D.E.; Niskanen, L.; Punnonen, K.; Nyyssonen, K.; Tuomainen, T.P.; Salonen, R.; Rauramaa, R.; Salonen, J.T. Sex hormones, inflammation and the metabolic syndrome: A population-based study. Eur. J. Endocrinol. 2003, 149, 601–608. [Google Scholar] [CrossRef] [PubMed]
  46. Wells, J.C. Sexual dimorphism of body composition. Best Pract. Res. Clin. Endocrinol. Metab. 2007, 21, 415–430. [Google Scholar] [CrossRef]
  47. Palmer, B.F.; Clegg, D.J. The sexual dimorphism of obesity. Mol. Cell. Endocrinol. 2015, 402, 113–119. [Google Scholar] [CrossRef]
  48. Ter Horst, K.W.; Gilijamse, P.W.; de Weijer, B.A.; Kilicarslan, M.; Ackermans, M.T.; Nederveen, A.J.; Nieuwdorp, M.; Romijn, J.A.; Serlie, M.J. Sexual Dimorphism in Hepatic, Adipose Tissue, and Peripheral Tissue Insulin Sensitivity in Obese Humans. Front. Endocrinol. 2015, 6, 182. [Google Scholar] [CrossRef]
  49. Dulebohn, R.V.; Yi, W.; Srivastava, A.; Akoh, C.C.; Krewer, G.; Fischer, J.G. Effects of blueberry (Vaccinium ashei) on DNA damage, lipid peroxidation, and phase II enzyme activities in rats. J. Agric. Food Chem. 2008, 56, 11700–11706. [Google Scholar] [CrossRef]
  50. Riso, P.; Klimis-Zacas, D.; Del Bo, C.; Martini, D.; Campolo, J.; Vendrame, S.; Moller, P.; Loft, S.; De Maria, R.; Porrini, M. Effect of a wild blueberry (Vaccinium angustifolium) drink intervention on markers of oxidative stress, inflammation and endothelial function in humans with cardiovascular risk factors. Eur. J. Nutr. 2013, 52, 949–961. [Google Scholar] [CrossRef]
  51. DeFuria, J.; Bennett, G.; Strissel, K.J.; Perfield, J.W., II; Milbury, P.E.; Greenberg, A.S.; Obin, M.S. Dietary blueberry attenuates whole-body insulin resistance in high fat-fed mice by reducing adipocyte death and its inflammatory sequelae. J. Nutr. 2009, 139, 1510–1516. [Google Scholar] [CrossRef]
  52. Petersen, C.; Bharat, D.; Cutler, B.R.; Gholami, S.; Denetso, C.; Mueller, J.E.; Cho, J.M.; Kim, J.S.; Symons, J.D.; Anandh Babu, P.V. Circulating metabolites of strawberry mediate reductions in vascular inflammation and endothelial dysfunction in db/db mice. Int. J. Cardiol. 2018, 263, 111–117. [Google Scholar] [CrossRef] [PubMed]
  53. Bharat, D.; Cavalcanti, R.R.M.; Petersen, C.; Begaye, N.; Cutler, B.R.; Costa, M.M.A.; Ramos, R.; Ferreira, M.R.; Li, Y.; Bharath, L.P.; et al. Blueberry Metabolites Attenuate Lipotoxicity-Induced Endothelial Dysfunction. Mol. Nutr. Food Res. 2018, 62, 1700601. [Google Scholar] [CrossRef] [PubMed]
  54. Fairlie-Jones, L.; Davison, K.; Fromentin, E.; Hill, A.M. The Effect of Anthocyanin-Rich Foods or Extracts on Vascular Function in Adults: A Systematic Review and Meta-Analysis of Randomised Controlled Trials. Nutrients 2017, 9, 908. [Google Scholar] [CrossRef] [PubMed]
  55. Faria, A.; Fernandes, I.; Norberto, S.; Mateus, N.; Calhau, C. Interplay between anthocyanins and gut microbiota. J. Agric. Food Chem. 2014, 62, 6898–6902. [Google Scholar] [CrossRef] [PubMed]
  56. Roopchand, D.E.; Carmody, R.N.; Kuhn, P.; Moskal, K.; Rojas-Silva, P.; Turnbaugh, P.J.; Raskin, I. Dietary Polyphenols Promote Growth of the Gut Bacterium Akkermansia muciniphila and Attenuate High-Fat Diet-Induced Metabolic Syndrome. Diabetes 2015, 64, 2847–2858. [Google Scholar] [CrossRef] [PubMed]
  57. Henning, S.M.; Yang, J.; Shao, P.; Lee, R.P.; Huang, J.; Ly, A.; Hsu, M.; Lu, Q.Y.; Thames, G.; Heber, D.; et al. Health benefit of vegetable/fruit juice-based diet: Role of microbiome. Sci. Rep. 2017, 7, 2167. [Google Scholar] [CrossRef]
  58. Lee, S.; Keirsey, K.I.; Kirkland, R.; Grunewald, Z.I.; Fischer, J.G.; de La Serre, C.B. Blueberry Supplementation Influences the Gut Microbiota, Inflammation, and Insulin Resistance in High-Fat-Diet-Fed Rats. J. Nutr. 2018, 148, 209–219. [Google Scholar] [CrossRef]
  59. Turnbaugh, P.J.; Ley, R.E.; Mahowald, M.A.; Magrini, V.; Mardis, E.R.; Gordon, J.I. An obesity-associated gut microbiome with increased capacity for energy harvest. Nature 2006, 444, 1027–1031. [Google Scholar] [CrossRef]
  60. Liu, W.; Zhao, S.; Wang, J.; Shi, J.; Sun, Y.; Wang, W.; Ning, G.; Hong, J.; Liu, R. Grape seed proanthocyanidin extract ameliorates inflammation and adiposity by modulating gut microbiota in high-fat diet mice. Mol. Nutr. Food Res. 2017, 61, 1601082. [Google Scholar] [CrossRef]
  61. Wu, T.; Qi, X.; Liu, Y.; Guo, J.; Zhu, R.; Chen, W.; Zheng, X.; Yu, T. Dietary supplementation with purified mulberry (Morus australis Poir) anthocyanins suppresses body weight gain in high-fat diet fed C57BL/6 mice. Food Chem. 2013, 141, 482–487. [Google Scholar] [CrossRef]
  62. Anhe, F.F.; Nachbar, R.T.; Varin, T.V.; Vilela, V.; Dudonne, S.; Pilon, G.; Fournier, M.; Lecours, M.A.; Desjardins, Y.; Roy, D.; et al. A polyphenol-rich cranberry extract reverses insulin resistance and hepatic steatosis independently of body weight loss. Mol. Metab. 2017, 6, 1563–1573. [Google Scholar] [CrossRef]
  63. Anhe, F.F.; Roy, D.; Pilon, G.; Dudonne, S.; Matamoros, S.; Varin, T.V.; Garofalo, C.; Moine, Q.; Desjardins, Y.; Levy, E.; et al. A polyphenol-rich cranberry extract protects from diet-induced obesity, insulin resistance and intestinal inflammation in association with increased Akkermansia spp. population in the gut microbiota of mice. Gut 2015, 64, 872–883. [Google Scholar] [CrossRef] [PubMed]
  64. Takikawa, M.; Inoue, S.; Horio, F.; Tsuda, T. Dietary anthocyanin-rich bilberry extract ameliorates hyperglycemia and insulin sensitivity via activation of AMP-activated protein kinase in diabetic mice. J. Nutr. 2010, 140, 527–533. [Google Scholar] [CrossRef] [PubMed]
  65. Laparra, J.M.; Sanz, Y. Interactions of gut microbiota with functional food components and nutraceuticals. Pharmacol. Res. 2010, 61, 219–225. [Google Scholar] [CrossRef]
  66. Milbury, P.E.; Kalt, W. Xenobiotic metabolism and berry flavonoid transport across the blood-brain barrier. J. Agric. Food Chem. 2010, 58, 3950–3956. [Google Scholar] [CrossRef] [PubMed]
Figure 1. Body weight, body composition, and tissue weights of mice during the dietary intervention. (A) The body weight of male and female mice over the four weeks of dietary supplementation, (B) The body composition (% Lean mass and % Fat mass) at the end of the dietary intervention, and (C) iWAT (inguinal), pWAT (perirenal), gWAT (gonadal) white adipose tissue weights expressed relative to body weight at the time of euthanization. F-BB (female mice fed a blueberry diet) (n = 9), F-Con (female mice fed a control diet) (n = 7), M-BB (male mice fed a blueberry diet) (n = 9), and M-Con (male mice fed a control diet) (n = 10). A Two-Way ANOVA analysis was performed using R. Sex and diet and the interactions of both were used as two factors to determine the significance. (ns = non-significant).
Nutrients 11 00313 g001
Figure 2. The β-diversity of microbial ecology upon blueberry supplementation. Non-metric multi-dimensional scaling (NMDS) analysis of the operational taxonomical unit (OTU) abundance matrix of the β-diversity of gut microbial communities shows differences at both the (A) phylum and (B) genus level. (F-BB (female mice fed a blueberry diet) (n = 9), F-Con (female mice fed a control diet) (n = 7), M-BB (male mice fed a blueberry diet) (n = 9), and M-Con (male mice fed a control diet) (n = 10). Multi-factor ANOVA analysis was performed using an R-based Shiny app (DAME). Sex and diet were used as two factors to determine the significance (ns = non-significant).
Nutrients 11 00313 g002
Figure 3. Operational taxonomical unit (OTU) abundance at the phylum level upon blueberry supplementation. (A) The OTU abundance of Firmicutes and Bacteroidetes was decreased and increased, respectively, in the blueberry-supplemented groups in both sexes. (B) Decreased Firmicutes to Bacteroidetes ratios in the blueberry groups were seen. (C) Proteobacteria, Tenericutes, Deferribacteres, and Actinobacteria were also altered by dietary blueberry supplementation. F-BB (female mice fed a blueberry diet) (n = 9), F-Con (female mice fed a control diet) (n = 7), M-BB (male mice fed a blueberry diet) (n = 9), and M-Con (male mice fed a control diet) (n = 9). Two-Way ANOVA analysis was performed using R. Sex, diet, and their interaction, then these two factors were used to determine the significance. (ns = non significant).
Nutrients 11 00313 g003
Figure 4. Blueberry supplementation affects the differential abundance of genera in a sexually-dimorphic pattern. (A) A Venn diagram showing the differential abundance of unique and common genera when determining the effect of blueberry supplementation in male and female mice. A heat map of uniquely expressed and significant genera in (B) males only, (C) males and females, and (D) in females only. F-BB (female mice fed a blueberry diet) (n = 9), F-Con (female mice fed a control diet) (n = 7), M-BB (male mice fed a blueberry diet) (n = 9), and M-Con (male mice fed a control diet) (n = 9). The color legend represents the relative fold (normalized) abundance of particular genera. The color scale shows the fold change. (Differential abundance analysis was performed using Negative Binomial Regression by taxonomic levels with pairwise comparisons of meta-data using DESeq2 workflow).
Nutrients 11 00313 g004
Figure 5. The PICRUSt-predicted biological function pathways upon blueberry supplementation. The metabolic pathways from KEGG module predictions used 16S data with PICRUSt and sequenced shotgun metagenomes. F-BB (female mice fed a blueberry diet) (n = 9), F-Con (female mice fed a control diet) (n = 7), M-BB (male mice fed a blueberry diet) (n = 9), and M-Con (male mice fed a control diet) (n = 9).
Nutrients 11 00313 g005
Figure 6. Spearman correlations of specific metabolic pathways predicted from microbial genomes, with the operational taxonomical unit (OTU) abundance of families. Pathways such as lipid metabolism, fatty acid metabolism, lipid biosynthesis, etc. and their association with OTU abundances at family-level taxa are shown. The color red denotes a positive association, whereas the color blue denotes negative correlations; only statistically significant correlations are depicted. The color gradient represents the degree of association.
Nutrients 11 00313 g006
Figure 7. The sexually-dimorphic association of fatty acid metabolism, fatty acid synthesis, and lipid biosynthesis with Lachnospiraceae, Dehalobacteriaceae, Erysipelotrichaceae, and Peptostreptococcaceae families. PICRUSt-generated predicted metabolic pathways (the mean relative frequency % based on operational taxonomical unit (OTU) abundance) such as fatty acid metabolism, fatty acid biosynthesis, and lipid biosynthesis show a sexually-dimorphic association with Lachnospiraceae, Dehalobacteriaceae, Erysipelotrichaceae, and Peptostreptococcaceae
Nutrients 11 00313 g007
Table 1. The diet compositions, showing the weight (g/kg), % by weight, and % by kcal of the dietary components.
Ingredients7% Corn Oil Diet5% Blueberry Diet
TD.95092TD.10679
g/kgg/kg
Casein200.0198.2
L-Cysteine33
Corn Starch397.5351.9
Maltodextrin132132
Sucrose100100
Corn Oil70.069.5
Cellulose50.047.9
Min Mix (AIN-93G-MX(94046))3535
Vitamin Mix (AIN-93-VX(94047))1010
Choline Bitartrate2.52.5
TBHQ, Anti-oxident0.0140.014
Blueberry Powder-50
Both Diets
Macronutrient Info% by weight% kcal from
Protein17.718.8
Carbohydrate60.163.9
Fat7.217.2
Kcal/g3.83.8
Table 2. α-diversity indices at the phylum and genus levels (Data are expressed as mean ± SE). Statistical differences between the groups (F-BB (female mice fed a blueberry diet) (n = 9), F-Con (female mice fed a control diet) (n = 7), M-BB (male mice fed a blueberry diet) (n = 9), and M-Con (male mice fed a control diet) (n = 10) were determined by Two-Way ANOVA for sex and diet and their interaction (bold typed numbers state the significantly different indices).
Phylum
IndexF_BBF_ConM_BBM_ConSexDietDiet:Sex
Chao15.444 ± 0.1765.714 ± 0.1846 ± 05.5 ± 0.1670.2250.3810.017
Fisher0.48 ± 0.0170.5 ± 0.0180.534 ± 0.0010.485 ± 0.0160.1630.2990.025
InvSimpson2.22 ± 0.0412.214 ± 0.0992.176 ± 0.032.181 ± 0.0670.5260.9550.924
Observed5.444 ± 0.1765.714 ± 0.1846 ± 05.5 ± 0.1670.2250.3810.017
Shannon0.908 ± 0.0250.929 ± 0.0340.887 ± 0.0220.915 ± 0.0270.5120.3890.880
Simpson0.548 ± 0.0080.543 ± 0.0220.54 ± 0.0060.538 ± 0.0150.5990.7370.890
Genus
IndexF_BBF_ConM_BBM_ConSexDietDiet:Sex
Chao131.833 ± 0.67734.286 ± 0.77833.667 ± 1.00334.833 ± 0.5640.1250.0220.412
Fisher3.368 ± 0.0713.614 ± 0.0913.568 ± 0.1013.719 ± 0.0650.0710.0170.570
InvSimpson5.186 ± 0.2335.49 ± 0.324.883 ± 0.216.277 ± 0.2580.3980.0010.041
Observed31.667 ± 0.60134.143 ± 0.73833.333 ± 0.88234.6 ± 0.5210.1280.0090.392
Shannon2.091 ± 0.0392.067 ± 0.0612.124 ± 0.0392.227 ± 0.0280.0290.1910.128
Simpson0.804 ± 0.0090.814 ± 0.0110.792 ± 0.0090.838 ± 0.0060.5340.0010.046
Table 3. The operational taxonomical unit (OTU) abundance at the genus level. F-BB (female mice fed a blueberry diet) (n = 9), F-Con (female mice fed a control diet) (n = 7), M-BB (male mice fed a blueberry diet) (n = 9), and M-Con (male mice fed a control diet) (n = 9). Data are expressed as mean ± SE. Statistical differences between the groups were determined by Two-Way ANOVA for sex, diet, and their interaction. Bold typed numbers indicate the significantly different indices.
Family_GenusF_ConF_BBM_ConM_BBSexDietDiet × Sex
Clostridiales_Unassigned12.93 ± 3.2515.8 ± 1.0412.42 ± 1.5116.68 ± 1.850.9540.0650.720
Staphylococcaceae_Unassigned0.04 ± 0.010.01 ± 00.02 ± 0.010 ± 00.0640.0000.434
Alcaligenaceae_Sutterella0 ± 00.06 ± 0.040.02 ± 0.010.08 ± 0.040.6520.0470.985
Coriobacteriaceae_Adlercreutzia0.29 ± 0.071.19 ± 0.150.38 ± 0.090.72 ± 0.150.0500.0000.033
Erysipelotrichaceae_Unassigned0.07 ± 0.020.05 ± 0.010.05 ± 0.020.08 ± 0.020.7400.6150.131
Clostridiaceae_Unassigned5.52 ± 1.598.35 ± 1.612.04 ± 1.36.06 ± 0.650.1230.1440.002
Staphylococcaceae_Staphylococcus0.19 ± 0.040.04 ± 0.010.14 ± 0.040.02 ± 0.010.4790.0000.613
Lactobacillaceae_Lactobacillus23.83 ± 3.739.93 ± 1.969.67 ± 2.64.47 ± 1.380.0010.0010.086
Ruminococcaceae_Oscillospira1.8 ± 0.322.72 ± 0.392.39 ± 0.393.42 ± 0.290.1320.0110.885
Staphylococcaceae_Jeotgalicoccus0.05 ± 0.010.01 ± 0.010.05 ± 0.010.02 ± 0.010.2040.0020.920
Dehalobacteriaceae_Dehalobacterium0.07 ± 0.010.17 ± 0.030.12 ± 0.020.16 ± 0.040.5890.0270.311
X.Mogibacteriaceae._Unassigned0.03 ± 0.010.11 ± 0.020.04 ± 0.010.1 ± 0.010.6540.0000.566
Ruminococcaceae_Ruminococcus3.8 ± 1.241.12 ± 0.256.64 ± 1.262.46 ± 0.620.0180.0010.432
Lachnospiraceae_Dorea0.05 ± 0.020.11 ± 0.020.02 ± 0.010.03 ± 00.0000.0500.064
Streptococcaceae_Lactococcus0.95 ± 0.140.28 ± 0.040.86 ± 0.190.38 ± 0.140.6950.0000.503
Ruminococcaceae_Unassigned2.84 ± 0.731.83 ± 0.213.28 ± 0.312.37 ± 0.360.1620.0240.901
Porphyromonadaceae_Parabacteroides3.44 ± 0.726.44 ± 0.912.75 ± 0.453.74 ± 0.520.0070.0080.143
S24.7_Unassigned27.48 ± 1.0836.57 ± 1.3230.15 ± 1.6839.53 ± 1.230.1670.0000.920
Planococcaceae_Sporosarcina0.01 ± 00 ± 00.01 ± 00.01 ± 0.010.0360.6470.458
Lachnospiraceae_Coprococcus0.21 ± 0.030.92 ± 0.160.37 ± 0.081.44 ± 0.230.0890.0000.243
RF39_Unassigned0.23 ± 0.150.57 ± 0.280.33 ± 0.081.11 ± 0.30.2200.0140.330
Christensenellaceae_Unassigned0.46 ± 0.090.11 ± 0.030.28 ± 0.050.08 ± 0.010.1140.0000.123
Anaeroplasmataceae_Anaeroplasma0.03 ± 0.020 ± 00.02 ± 00.01 ± 00.9410.1430.166
Lachnospiraceae_.Ruminococcus.0.59 ± 0.140.35 ± 0.080.26 ± 0.040.72 ± 0.150.8370.1860.002
Lachnospiraceae_Unassigned3.73 ± 1.244.94 ± 0.595.84 ± 0.745.42 ± 0.250.1020.6680.274
Turicibacteraceae_Turicibacter0.18 ± 0.12.22 ± 0.911.51 ± 0.674.54 ± 0.760.0340.0010.508
Ruminococcaceae_Anaerotruncus0.02 ± 0.010 ± 00.02 ± 0.010 ± 00.7930.0000.799
Deferribacteraceae_Mucispirillum8.72 ± 1.53.75 ± 0.986.45 ± 1.022.71 ± 0.340.2190.0000.542
Corynebacteriaceae_Corynebacterium0.55 ± 0.20.37 ± 0.240.73 ± 0.20.07 ± 0.040.8790.0260.211
Peptococcaceae_Unassigned0.03 ± 0.010.06 ± 0.020.08 ± 0.020.08 ± 0.010.1690.4740.393
Peptococcaceae_rc4.40.76 ± 0.261.46 ± 0.30.83 ± 0.271.46 ± 0.390.9410.0420.908
Bacillales_Unassigned0.03 ± 0.010 ± 00.01 ± 00.01 ± 00.3510.0350.004
Aerococcaceae_Facklamia0.05 ± 0.010.04 ± 0.020.06 ± 0.010.01 ± 0.010.8320.0560.208
Moraxellaceae_Acinetobacter0.02 ± 0.010 ± 00 ± 00.01 ± 00.2580.2000.012
Bacteroidaceae_Bacteroides0.96 ± 0.360.33 ± 0.11.92 ± 0.521.95 ± 0.540.0050.5390.455
Peptostreptococcaceae_Unassigned0.01 ± 00.01 ± 00.02 ± 0.010.01 ± 0.010.0590.3940.433
Clostridiaceae_Clostridium0.07 ± 0.020.08 ± 0.020.21 ± 0.020.07 ± 0.010.0020.0000.000

