Nutritional Adequacy and Latent Tuberculosis Infection in End-Stage Renal Disease Patients


Abstract
1. Introduction
2. Materials and Methods
2.1. Study Population
2.2. Dialysis Prescription
2.3. Data Collection
2.4. Hemodialysis Adequacy
2.5. Interferon Gamma Release Assay
2.6. Statistical Analysis
3. Results
4. Discussion
5. Conclusions
Author Contributions
Funding
Conflicts of Interest
References
- Kim, H.W.; Kim, J.S. Treatment of latent tuberculosis infection and its clinical efficacy. Tuberc. Respir. Dis. 2018, 81, 6–12. [Google Scholar] [CrossRef] [PubMed]
- Segall, L.; Covic, A. Diagnosis of tuberculosis in dialysis patients: Current strategy. Clin. J. Am. Soc. Nephrol. 2010, 5, 1114–1122. [Google Scholar] [CrossRef] [PubMed][Green Version]
- Aparicio, M.; Cano, N.; Chauveau, P.; Azar, R.; Canaud, B.; Flory, A.; Laville, M.; Leverve, X. Nutritional status of haemodialysis patients: A french national cooperative study. French study group for nutrition in dialysis. Nephrol. Dial. Transpl. 1999, 14, 1679–1686. [Google Scholar] [CrossRef] [PubMed]
- Daugirdas, J.T. Second generation logarithmic estimates of single-pool variable volume kt/v: An analysis of error. J. Am. Soc. Nephrol. 1993, 4, 1205–1213. [Google Scholar] [PubMed]
- Depner, T.A.; Daugirdas, J.T. Equations for normalized protein catabolic rate based on two-point modeling of hemodialysis urea kinetics. J. Am. Soc. Nephrol. 1996, 7, 780–785. [Google Scholar] [PubMed]
- Triverio, P.A.; Bridevaux, P.O.; Roux-Lombard, P.; Niksic, L.; Rochat, T.; Martin, P.Y.; Saudan, P.; Janssens, J.P. Interferon-gamma release assays versus tuberculin skin testing for detection of latent tuberculosis in chronic haemodialysis patients. Nephrol. Dial. Transpl. 2009, 24, 1952–1956. [Google Scholar] [CrossRef] [PubMed]
- Cho, K.S. Tuberculosis control in the republic of Korea. Epidemiol. Health 2018, 40, e2018036. [Google Scholar] [CrossRef] [PubMed]
- Lee, S.H.; Kim, H.J.; Park, S.J.; Kim, T.H.; Park, S.J.; Kang, S.W.; Kim, Y.H.; Menzies, D. Serial interferon-gamma release assays for latent tuberculosis in dialysis patients with end stage renal disease in a Korean population. BMC Infect. Dis. 2015, 15, 381. [Google Scholar] [CrossRef] [PubMed]
- Lee, S.S.; Chou, K.J.; Su, I.J.; Chen, Y.S.; Fang, H.C.; Huang, T.S.; Tsai, H.C.; Wann, S.R.; Lin, H.H.; Liu, Y.C. High prevalence of latent tuberculosis infection in patients in end-stage renal disease on hemodialysis: Comparison of quantiferon-tb gold, elispot, and tuberculin skin test. Infection 2009, 37, 96–102. [Google Scholar] [CrossRef] [PubMed]
- Zyga, S.; Christopoulou, G.; Malliarou, M. Malnutrition-inflammation-atherosclerosis syndrome in patients with end-stage renal disease. J. Ren. Care 2011, 37, 12–15. [Google Scholar] [CrossRef] [PubMed]
- Cano, N.; Stroumza, P.; Lacombe, P.; Labastie-Coeyrehourcq, J. Plasma prealbumin in hemodialysis patients. Am. J. Kidney Dis. 1994, 23, 621. [Google Scholar] [CrossRef]
- Weng, C.H.; Hu, C.C.; Yen, T.H.; Hsu, C.W.; Huang, W.H. Nutritional predictors of mortality in long term hemodialysis patients. Sci. Rep. 2016, 6, 35639. [Google Scholar] [CrossRef] [PubMed]
- Kondrup, J.E.S.P.E.N.; Allison, S.P.; Elia, M.; Vellas, B.; Plauth, M. Espen guidelines for nutrition screening 2002. Clin. Nutr. 2003, 22, 415–421. [Google Scholar] [CrossRef]
- Combe, C.; Chauveau, P.; Laville, M.; Fouque, D.; Azar, R.; Cano, N.; Canaud, B.; Roth, H.; Leverve, X.; Aparicio, M.; et al. Influence of nutritional factors and hemodialysis adequacy on the survival of 1,610 french patients. Am. J. Kidney Dis. 2001, 37, S81–S88. [Google Scholar] [CrossRef] [PubMed]
- Anuradha, R.; Munisankar, S.; Bhootra, Y.; Kumar, N.P.; Dolla, C.; Babu, S. Malnutrition is associated with diminished baseline and mycobacterial antigen—Stimulated chemokine responses in latent tuberculosis infection. J. Infect. 2018, 77, 410–416. [Google Scholar] [CrossRef] [PubMed]
- Chandra, R.K. 1990 mccollum award lecture. Nutrition and immunity: Lessons from the past and new insights into the future. Am. J. Clin. Nutr. 1991, 53, 1087–1101. [Google Scholar] [CrossRef] [PubMed]
- Kant, S.; Gupta, H.; Ahluwalia, S. Significance of nutrition in pulmonary tuberculosis. Crit. Rev. Food Sci. Nutr. 2015, 55, 955–963. [Google Scholar] [CrossRef]
- Macallan, D.C. Malnutrition in tuberculosis. Diagn. Microbiol. Infect. Dis. 1999, 34, 153–157. [Google Scholar] [CrossRef]
- Van Zyl-Smit, R.N.; Zwerling, A.; Dheda, K.; Pai, M. Within-subject variability of interferon-g assay results for tuberculosis and boosting effect of tuberculin skin testing: A systematic review. PLoS ONE 2009, 4, e8517. [Google Scholar] [CrossRef] [PubMed]
- Kovesdy, C.P.; Kopple, J.D.; Kalantar-Zadeh, K. Management of protein-energy wasting in non-dialysis-dependent chronic kidney disease: Reconciling low protein intake with nutritional therapy. Am. J. Clin. Nutr. 2013, 97, 1163–1177. [Google Scholar] [CrossRef] [PubMed]


| Negative IGRA (N = 70) | Positive IGRA (N = 20) | p Value | |
|---|---|---|---|
| Age (years) | 61.3 ± 13.5 | 62.8 ± 9.1 | 0.656 |
| Male | 44 (62.9%) | 12 (60.0%) | 1.000 |
| Body mass index (kg/m2) | 23.0 ± 3.1 | 23.5 ± 3.5 | 0.525 |
| Dialysis type (hemodialysis vs. peritoneal dialysis) | 64 (91.4%) vs. 6 (8.6%) | 20 (100.0%) vs. 0 (0%) | 0.397 |
| Dialysis vintage (months) | 18.0 (10.0–53.0) | 23.0 (15.0–60.0) | 0.302 |
| Comorbidity | |||
| Diabetes | 33 (47.8%) | 13 (65.0%) | 0.272 |
| Hypertension | 65 (94.2%) | 20 (100.0%) | 0.625 |
| Chronic glomerulonephritis | 13 (18.8%) | 1 (5.0%) | 0.251 |
| Coronary artery disease | 28 (40.6%) | 6 (30.0%) | 0.551 |
| Cerebrovascular disease | 3 (4.3%) | 3 (15.0%) | 0.243 |
| Prior tuberculosis treatment | 1 (1.4%) | 1 (5.0%) | 0.931 |
| Old fibrotic changes on chest radiograph | 7 (10.1%) | 11 (55.0%) | <0.005 |
| Immunosuppressant medication | 3 (4.3%) | 0 (0.0%) | 0.806 |
| Systolic blood pressure (mmHg) | 144.8 ± 20.1 | 147.0 ± 22.4 | 0.679 |
| Diastolic blood pressure (mmHg) | 69.7 ± 14.9 | 66.0 ± 14.7 | 0.334 |
| Heart rate (rate/min) | 69.5 (63.0–77.0) | 72.5 (68.5–78.5) | 0.158 |
| Interdialytic weight gain (hemodialysis patients only) | 2.4 ± 1.0 | 2.4 ± 1.1 | 0.919 |
| Hemoglobin, g/dL | 10.1 (9.5–10.8) | 10.2 (9.6–10.6) | 0.829 |
| Albumin, g/dL | 3.8 (3.5–4.0) | 3.8 (3.4–3.9) | 0.429 |
| Ferritin, ug/L | 201.0 (98.2–309.9) | 204.6 (115.4–296.4) | 0.884 |
| Transferrin saturation, % | 26.7 (21.3–36.0) | 32.3 (25.3–38.5) | 0.367 |
| Calcium, mg/dL | 8.9 ± 0.7 | 8.9 ± 0.7 | 0.957 |
| Phosphorus, mg/dL | 4.4 (3.7–5.5) | 4.4 (3.8–5.2) | 0.775 |
| Intact parathyroid hormone, pg/mL | 140.0 (87.7–238.0) | 194.0 (85.3–321.0) | 0.338 |
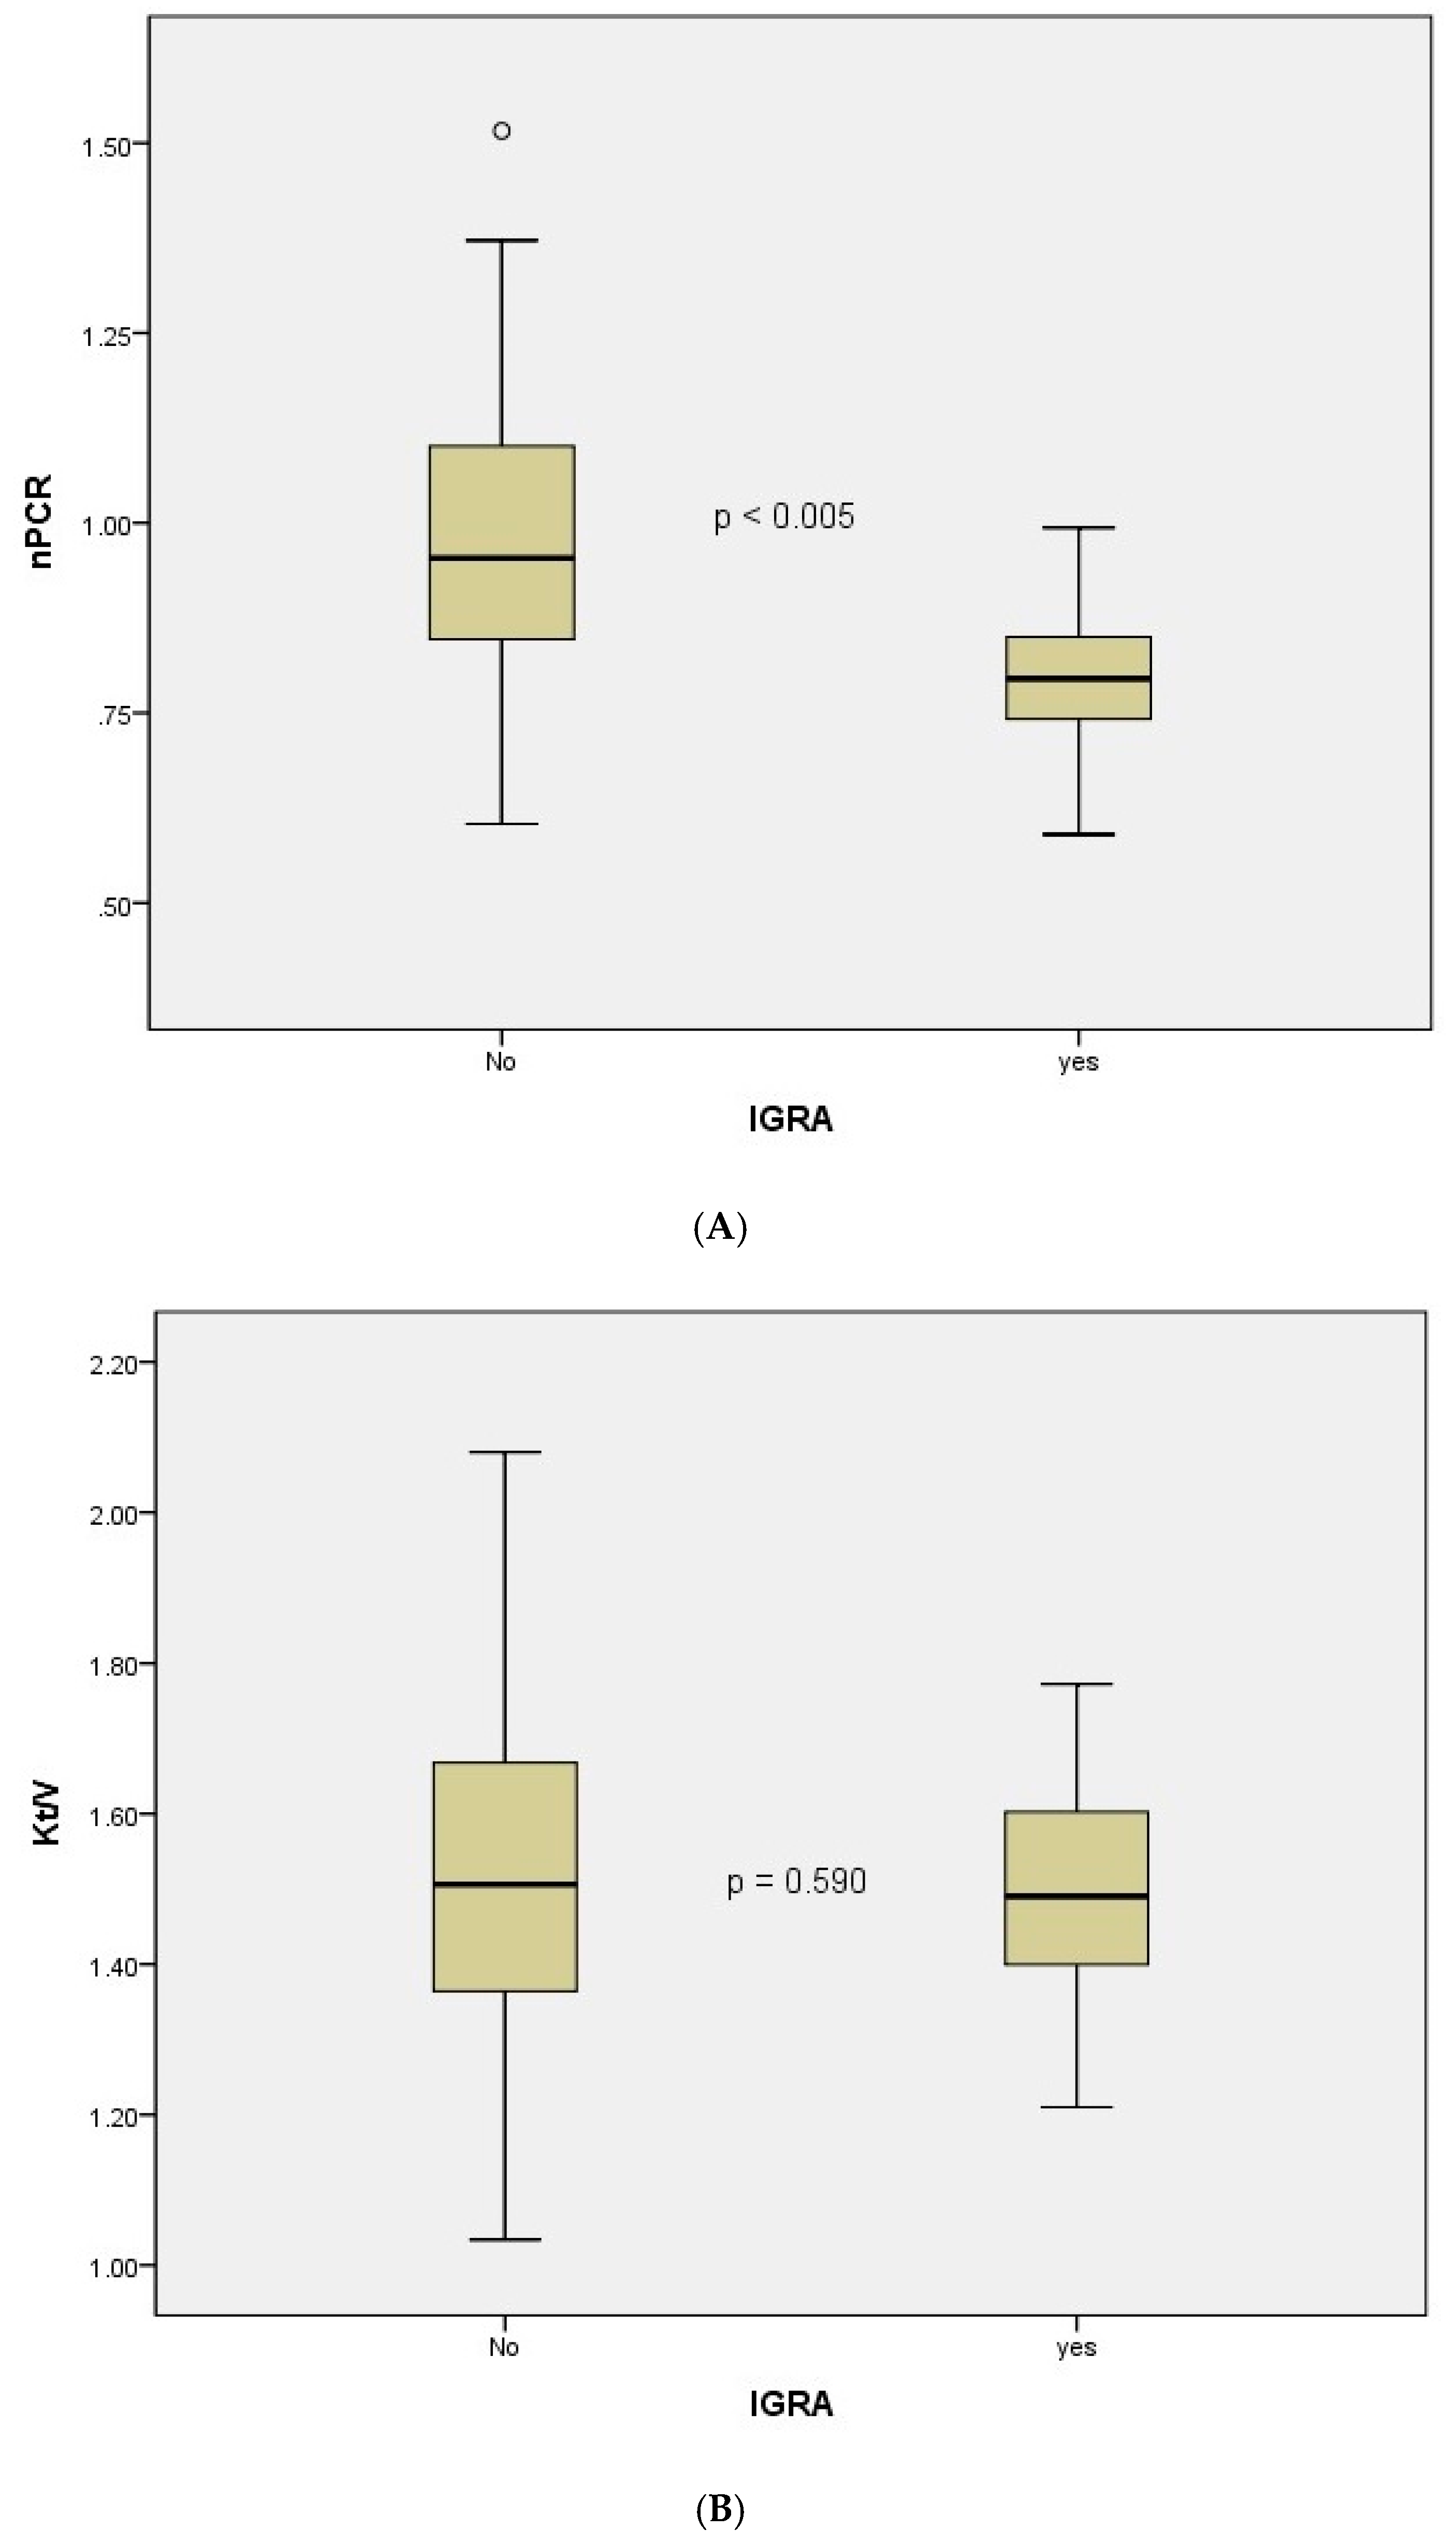
| Single-pool Kt/V (hemodialysis patients only, per dialysis session) | 1.5 ± 0.3 | 1.5 ± 0.2 | 0.590 |
| Normalized protein catabolic rate, g/kg/day | 1.0 ± 0.2 | 0.8 ± 0.1 | <0.005 |
| Variables | Adjusted Hazard Ratio (95% Confidence Interval) | p Value |
|---|---|---|
| Old fibrotic changes | 11.93 (3.17–44.85) | <0.005 |
| nPCR less than 0.87 g/kg/day | 7.74 (1.77–33.74) | 0.006 |
| Normalized Protein Catabolic Rate (g/kg/day) | >0.87 (N = 41) | ≤0.87 (N = 49) | p Value |
|---|---|---|---|
| Age (years) | 58.5 ± 12.0 | 64.2 ± 12.6 | 0.031 |
| Male | 24 (58.5%) | 32 (65.3%) | 0.659 |
| Body mass index (kg/m2) | 22.8 ± 3.1 | 23.3 ± 3.3 | 0.445 |
| Dialysis type (hemodialysis vs. peritoneal dialysis) | 41 (100.0%) vs. 0 (0.0%) | 43 (87.8%) vs. 6 (12.2%) | 0.058 |
| Dialysis vintage (months) | 23.0 (12.0–60.0) | 20.0 (9.0–44.5) | 0.358 |
| Comorbidity | |||
| Diabetes | 19 (46.3%) | 27 (56.2%) | 0.472 |
| Hypertension | 37 (90.2%) | 48 (100.0%) | 0.089 |
| Chronic glomerulonephritis | 9 (22.0%) | 5 (10.4%) | 0.231 |
| Coronary artery disease | 12 (29.3%) | 22 (45.8%) | 0.166 |
| Cerebrovascular disease | 1 (2.4%) | 5 (10.4%) | 0.284 |
| Prior tuberculosis treatment | 0 (0.0%) | 2 (4.2%) | 0.545 |
| Old fibrotic changes on chest radiograph | 6 (14.6%) | 12 (25.0%) | 0.343 |
| Immunosuppressant medication | 2 (4.9%) | 1 (2.1%) | 0.889 |
| Pre-dialysis systolic blood pressure (mmHg) | 148.8 ± 22.7 | 142.4 ± 18.3 | 0.141 |
| Pre-dialysis diastolic blood pressure (mmHg) | 71.4 ± 12.1 | 66.7 ± 16.6 | 0.127 |
| Pre-dialysis heart rate (rate/min) | 69.0 (64.0–75.0) | 72.0 (64.0–80.0) | 0.200 |
| Interdialytic weight gain (hemodialysis patients only) | 2.4 ± 1.0 | 2.4 ± 1.1 | 0.901 |
| Hemoglobin, g/dL | 10.3 (9.9–0.8) | 9.9 (9.3–10.5) | 0.038 |
| Albumin, g/dL | 3.9 (3.7–4.0) | 3.7 (3.4–3.9) | 0.003 |
| Ferritin, ug/L | 179.8 (95.0–308.5) | 221.5 (134.7–309.9) | 0.509 |
| Transferrin saturation, % | 28.6 (21.1–39.1) | 28.0 (23.2–36.0) | 0.946 |
| Calcium, mg/dL | 9.1 ± 0.6 | 8.7 ± 0.7 | 0.010 |
| Phosphorus, mg/dL | 4.5 (3.8–5.5) | 4.3 (3.7–5.3) | 0.760 |
| Intact parathyroid hormone, pg/mL | 153.0 (97.0–239.0) | 141.0 (71.1–243.0) | 0.840 |
| Single-pool Kt/V (hemodialysis patients only, per dialysis session) | 1.6 ± 0.2 | 1.4 ± 0.2 | 0.026 |
© 2019 by the authors. Licensee MDPI, Basel, Switzerland. This article is an open access article distributed under the terms and conditions of the Creative Commons Attribution (CC BY) license (http://creativecommons.org/licenses/by/4.0/).
Share and Cite
Baek, S.D.; Jeung, S.; Kang, J.-Y. Nutritional Adequacy and Latent Tuberculosis Infection in End-Stage Renal Disease Patients. Nutrients 2019, 11, 2299. https://doi.org/10.3390/nu11102299
Baek SD, Jeung S, Kang J-Y. Nutritional Adequacy and Latent Tuberculosis Infection in End-Stage Renal Disease Patients. Nutrients. 2019; 11(10):2299. https://doi.org/10.3390/nu11102299
Chicago/Turabian StyleBaek, Seung Don, Soomin Jeung, and Jae-Young Kang. 2019. "Nutritional Adequacy and Latent Tuberculosis Infection in End-Stage Renal Disease Patients" Nutrients 11, no. 10: 2299. https://doi.org/10.3390/nu11102299
APA StyleBaek, S. D., Jeung, S., & Kang, J.-Y. (2019). Nutritional Adequacy and Latent Tuberculosis Infection in End-Stage Renal Disease Patients. Nutrients, 11(10), 2299. https://doi.org/10.3390/nu11102299