Comparison of Inductively Coupled Plasma Optical Emission Spectrometry with an Ion Selective Electrode to Determine Sodium and Potassium Levels in Human Milk


Abstract
1. Introduction
2. Materials and Methods
2.1. Biochemical Analysis
2.1.1. Ion Selective Electrode Measurement of HM Na and K
2.1.2. Inductively Coupled Plasma Optical Emission Spectrometry (ICP-OES) Measurement of HM Na and K Reagents
Sample Preparation and Measurement
2.1.3. Validation of Analytical Methods
2.2. Statistical Analysis
3. Results
4. Discussion
Author Contributions
Funding
Acknowledgments
Conflicts of Interest
References
- Neville, M.C.; Allen, J.C.; Archer, P.C.; Casey, C.E.; Seacat, J.; Keller, R.P.; Lutes, V.; Rasbach, J.; Neifert, M. Studies in human lactation: milk volume and nutrient composition during weaning and lactogenesis. Am. J. Clin. Nutr. 1991, 54, 81–92. [Google Scholar] [CrossRef] [PubMed]
- Cregan, M.D.; De Mello, T.R.; Kershaw, D.; McDougall, K.; Hartmann, P.E. Initiation of lactation in women after preterm delivery. Acta. Obstet. Gynecol. Scand. 2002, 81, 870–877. [Google Scholar] [CrossRef] [PubMed]
- Wagner, E.A.; Chantry, C.J.; Dewey, K.G.; Nommsen-Rivers, L.A. Breastfeeding concerns at 3 and 7 days postpartum and feeding status at 2 months. Pediatrics 2013, 132, e865–e875. [Google Scholar] [CrossRef] [PubMed]
- Murase, M.; Wagner, E.A.; Chantry, C.J.; Dewey, K.G.; Nommsen-Rivers, L.A. The relation between breast milk sodium to potassium ratio and maternal report of a milk supply concern. J. Pediatr. 2017, 181, 294–297.e3. [Google Scholar] [CrossRef] [PubMed]
- Lemay, D.G.; Ballard, O.A.; Hughes, M.A.; Morrow, A.L.; Horseman, N.D.; Nommsen-Rivers, L.A. RNA sequencing of the human milk fat layer transcriptome reveals distinct gene expression profiles at three stages of lactation. PLoS ONE 2013, 8, e67531. [Google Scholar] [CrossRef] [PubMed]
- Fetherston, C.M.; Lai, C.; Hartmann, P.E. Relationships between symptoms and changes in breast physiology during lactation mastitis. Breastfeed. Med. 2006, 1, 136–145. [Google Scholar] [CrossRef] [PubMed]
- Filteau, S.M.; Rice, A.L.; Ball, J.J.; Chakraborty, J.; Stoltzfus, R.; de Francisco, A.; Willumsen, J.F. Breast milk immune factors in Bangladeshi women supplemented postpartum with retinol or beta-carotene. Am. J. Clin. Nutr. 1999, 69, 953–958. [Google Scholar] [CrossRef] [PubMed]
- Prentice, A.; Prentice, A. Unilateral breast dysfunction in lactating Gambian women. Ann. Trop. Paediatr. 1984, 4, 19–23. [Google Scholar] [CrossRef] [PubMed]
- Humenick, S.; Hill, P.; Thompson, J.; Hart, A. Breast-milk sodium as a predictor of breastfeeding patterns. Can. J. Nurs. Res. 1997, 30, 67–81. [Google Scholar]
- Arthur, P.; Hartmann, P.; Smith, M. Measurement of the milk intake of breast-fed infants. J. Pediatr. Gastroenterol. Nutr. 1987, 6, 758–763. [Google Scholar] [CrossRef] [PubMed]
- R Core Team. R: A Language and Environment for Statistical Computing. Available online: ftp://ftp.uvigo.es/CRAN/web/packages/dplR/vignettes/intro-dplR.pdf (accessed on 1 August 2018).
- R Studio Team. R Studio: Integrated Development for R. Available online: https://www.rstudio.com/ (accessed on 1 August 2018).
- Sarkar, D. Lattice: Trellis Graphics for R. Available online: https://cran.r-project.org/web/packages/lattice/index.html (accessed on 1 August 2018).
- Bland, J.M.; Altman, D.G. Statistical methods for assessing agreement between two methods of clinical measurement. Lancet 1986, 1, 307–310. [Google Scholar] [CrossRef]
- Hauser, P.C. Determination of alkali ions in biological and environmental samples. In The Alkali Metal Ions: Their Role for Life; Sigel, A., Sigel, H., Sigel, R.K.O., Eds.; Springer: Cham, Germany, 2016; pp. 11–25. [Google Scholar]
- Payne, R.; Buckley, B.; Rawson, K. Protein interference with ion-selective electrode measurement depends on reference electrode composition and design. Ann. Clin. Biochem. 1991, 28, 68–72. [Google Scholar] [CrossRef] [PubMed]
- Dimeski, G.; Badrick, T.; St John, A. Ion selective electrodes (ISEs) and interferences—A review. Clin. Chim. Acta 2010, 411, 309–317. [Google Scholar] [CrossRef] [PubMed]
- Atkinson, S.; Alston-Mills, B.; Lönnerdal, B.; Neville, M.C. Major minerals and ionic constituents of human and bovine milks. In Handbook of Milk Composition; Elsevier: Newyork, NY, USA, 1995; pp. 593–622. [Google Scholar]
- Neville, M.C.; Keller, R.P.; Seacat, J.; Casey, C.E.; Allen, J.C.; Archer, P. Studies on human lactation. I. Within-feed and between-breast variation in selected components of human milk. Am. J. Clin. Nutr. 1984, 40, 635–646. [Google Scholar] [CrossRef] [PubMed]
- Dewey, K.G.; Nommsen-Rivers, L.A.; Heinig, M.J.; Cohen, R.J. Risk factors for suboptimal infant breastfeeding behavior, delayed onset of lactation, and excess neonatal weight loss. Pediatrics 2003, 112, 607–619. [Google Scholar] [CrossRef] [PubMed]
- Chapman, D.J.; Perez-Escamilla, R. Identification of risk factors for delayed onset of lactation. J. Am. Diet. Assoc. 1999, 99, 450–454. [Google Scholar] [CrossRef]
- Hildebrandt, H. Maternal perception of lactogenesis time: A clinical report. J. Hum. Lact. 1999, 15, 317–323. [Google Scholar] [CrossRef] [PubMed]
- Hall, R.T.; Mercer, A.M.; Teasley, S.L.; McPherson, D.M.; Simon, S.D.; Santos, S.R.; Meyers, B.M.; Hipsh, N.E. A breast-feeding assessment score to evaluate the risk for cessation of breast-feeding by 7 to 10 days of age. J. Pediatr. 2002, 141, 659–664. [Google Scholar] [CrossRef] [PubMed]
- Meier, P.P.; Engstrom, J.L.; Mingolelli, S.S.; Miracle, D.J.; Kiesling, S. The rush mothers’ milk club: Breastfeeding interventions for mothers with very-low-birth-weight Infants. J. Obstet. Gynecol. Neonatal Nurs. 2004, 33, 164–174. [Google Scholar] [CrossRef] [PubMed]
- Li, R.; Fein, S.B.; Chen, J.; Grummer-Strawn, L.M. Why mothers stop breastfeeding: Mothers’ self-reported reasons for stopping during the first year. Pediatrics 2008, 122 (Suppl. 2), S69–S76. [Google Scholar] [CrossRef]
- Morton, J.A. The clinical usefulness of breast milk sodium in the assessment of lactogenesis. Pediatrics 1994, 93, 802–806. [Google Scholar] [PubMed]
- Aryeetey, R.N.; Marquis, G.S.; Timms, L.; Lartey, A.; Brakohiapa, L. Subclinical mastitis is common among Ghanaian women lactating 3 to 4 months postpartum. J. Hum. Lact. 2008, 24, 263–267. [Google Scholar] [CrossRef] [PubMed]
- Buescher, E.S.; Hair, P.S. Human milk anti-inflammatory component contents during acute mastitis. Cell. Immunol. 2001, 210, 87–95. [Google Scholar] [CrossRef] [PubMed]


| n = 65 | Mean | Standard Deviation | Range |
|---|---|---|---|
| Maternal age (years) | 34 | 4 | 24–43 |
| Length of gestation (weeks) | 39 | 2 | 30–41 |
| Stage of lactation (weeks) | 10 | 5 | 0.5–27 |
| 24 h milk production (millilitres) | 780 | 318 | 36–1932 |
| Na (mM) | K (mM) | K + 0.65 mM | Na:K Ratio | Na:K + 0.65 mM Ratio | |
|---|---|---|---|---|---|
| Low K | 60 | 4 | 4.65 | 15.00 | 12.90 |
| 40 | 4 | 4.65 | 10.00 | 8.60 | |
| 20 | 4 | 4.65 | 5.00 | 4.30 | |
| 12 | 4 | 4.65 | 3.00 | 2.58 | |
| Medium K | 60 | 12 | 12.65 | 5.00 | 4.74 |
| 40 | 12 | 12.65 | 3.33 | 3.16 | |
| 20 | 12 | 12.65 | 1.67 | 1.58 | |
| 12 | 12 | 12.65 | 1.00 | 0.95 | |
| High K | 60 | 18 | 18.65 | 3.33 | 3.22 |
| 40 | 18 | 18.65 | 2.22 | 2.14 | |
| 20 | 18 | 18.65 | 1.11 | 1.07 | |
| 12 | 18 | 18.65 | 0.67 | 0.64 |
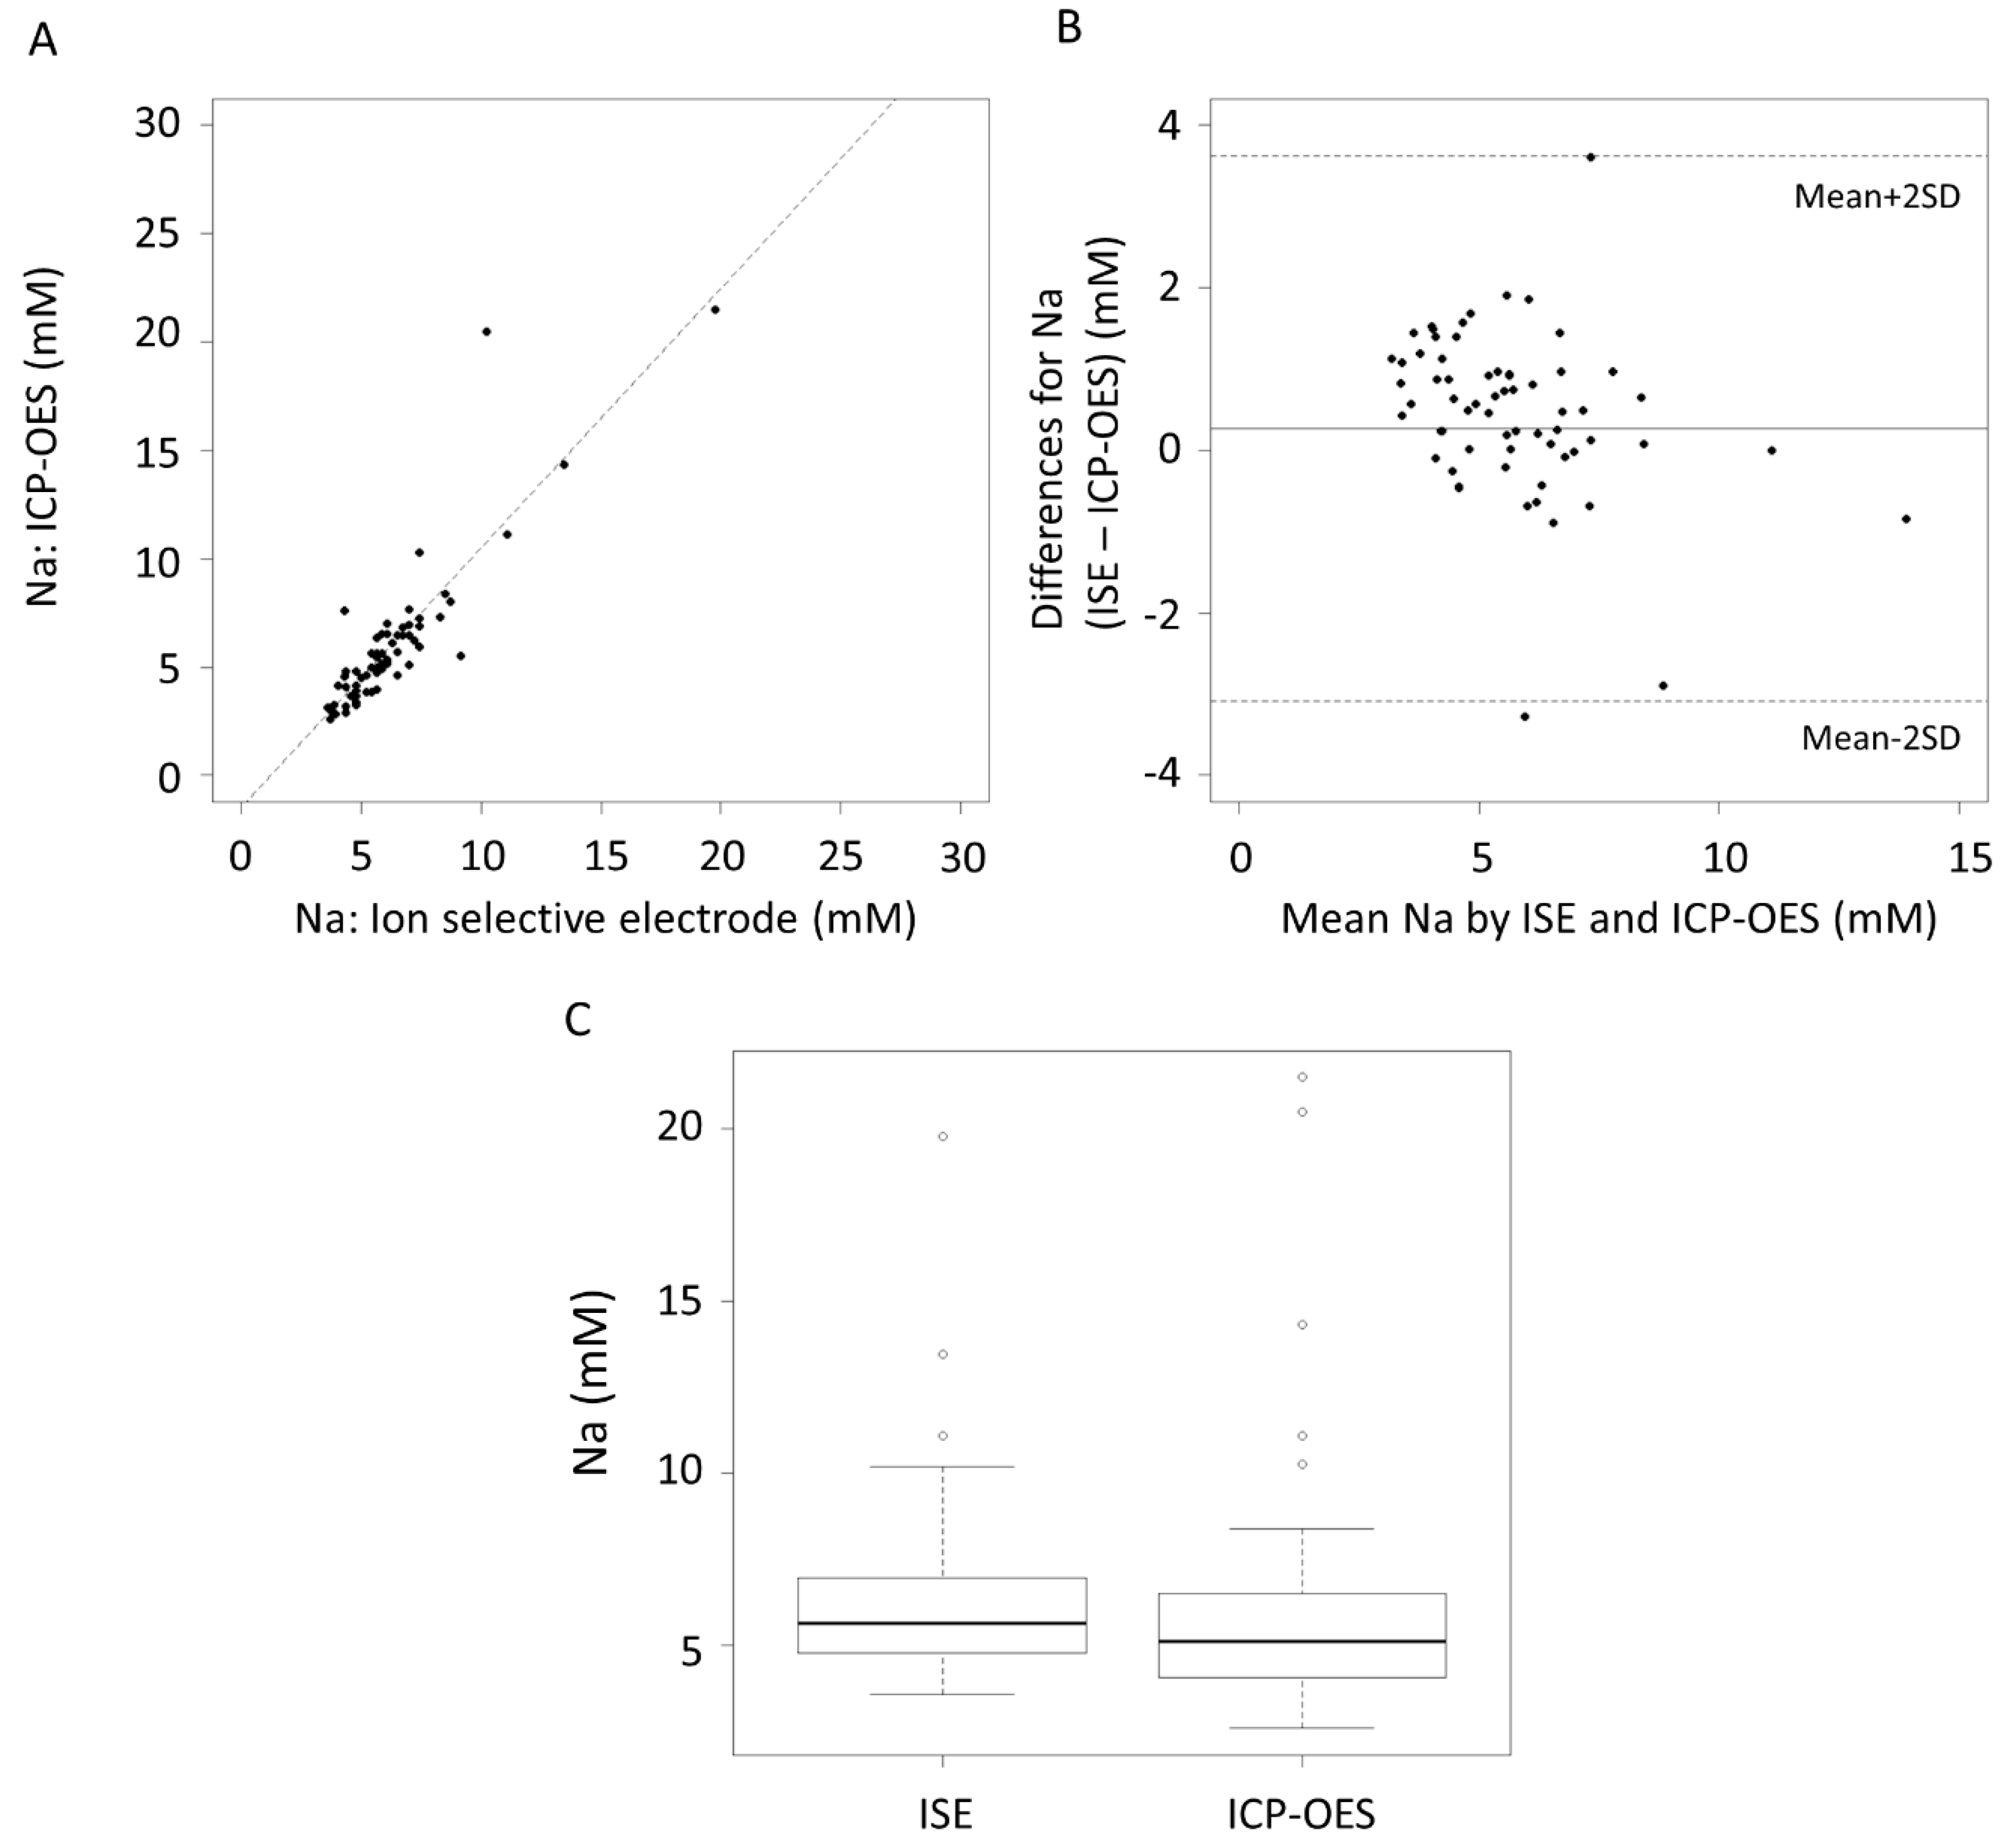
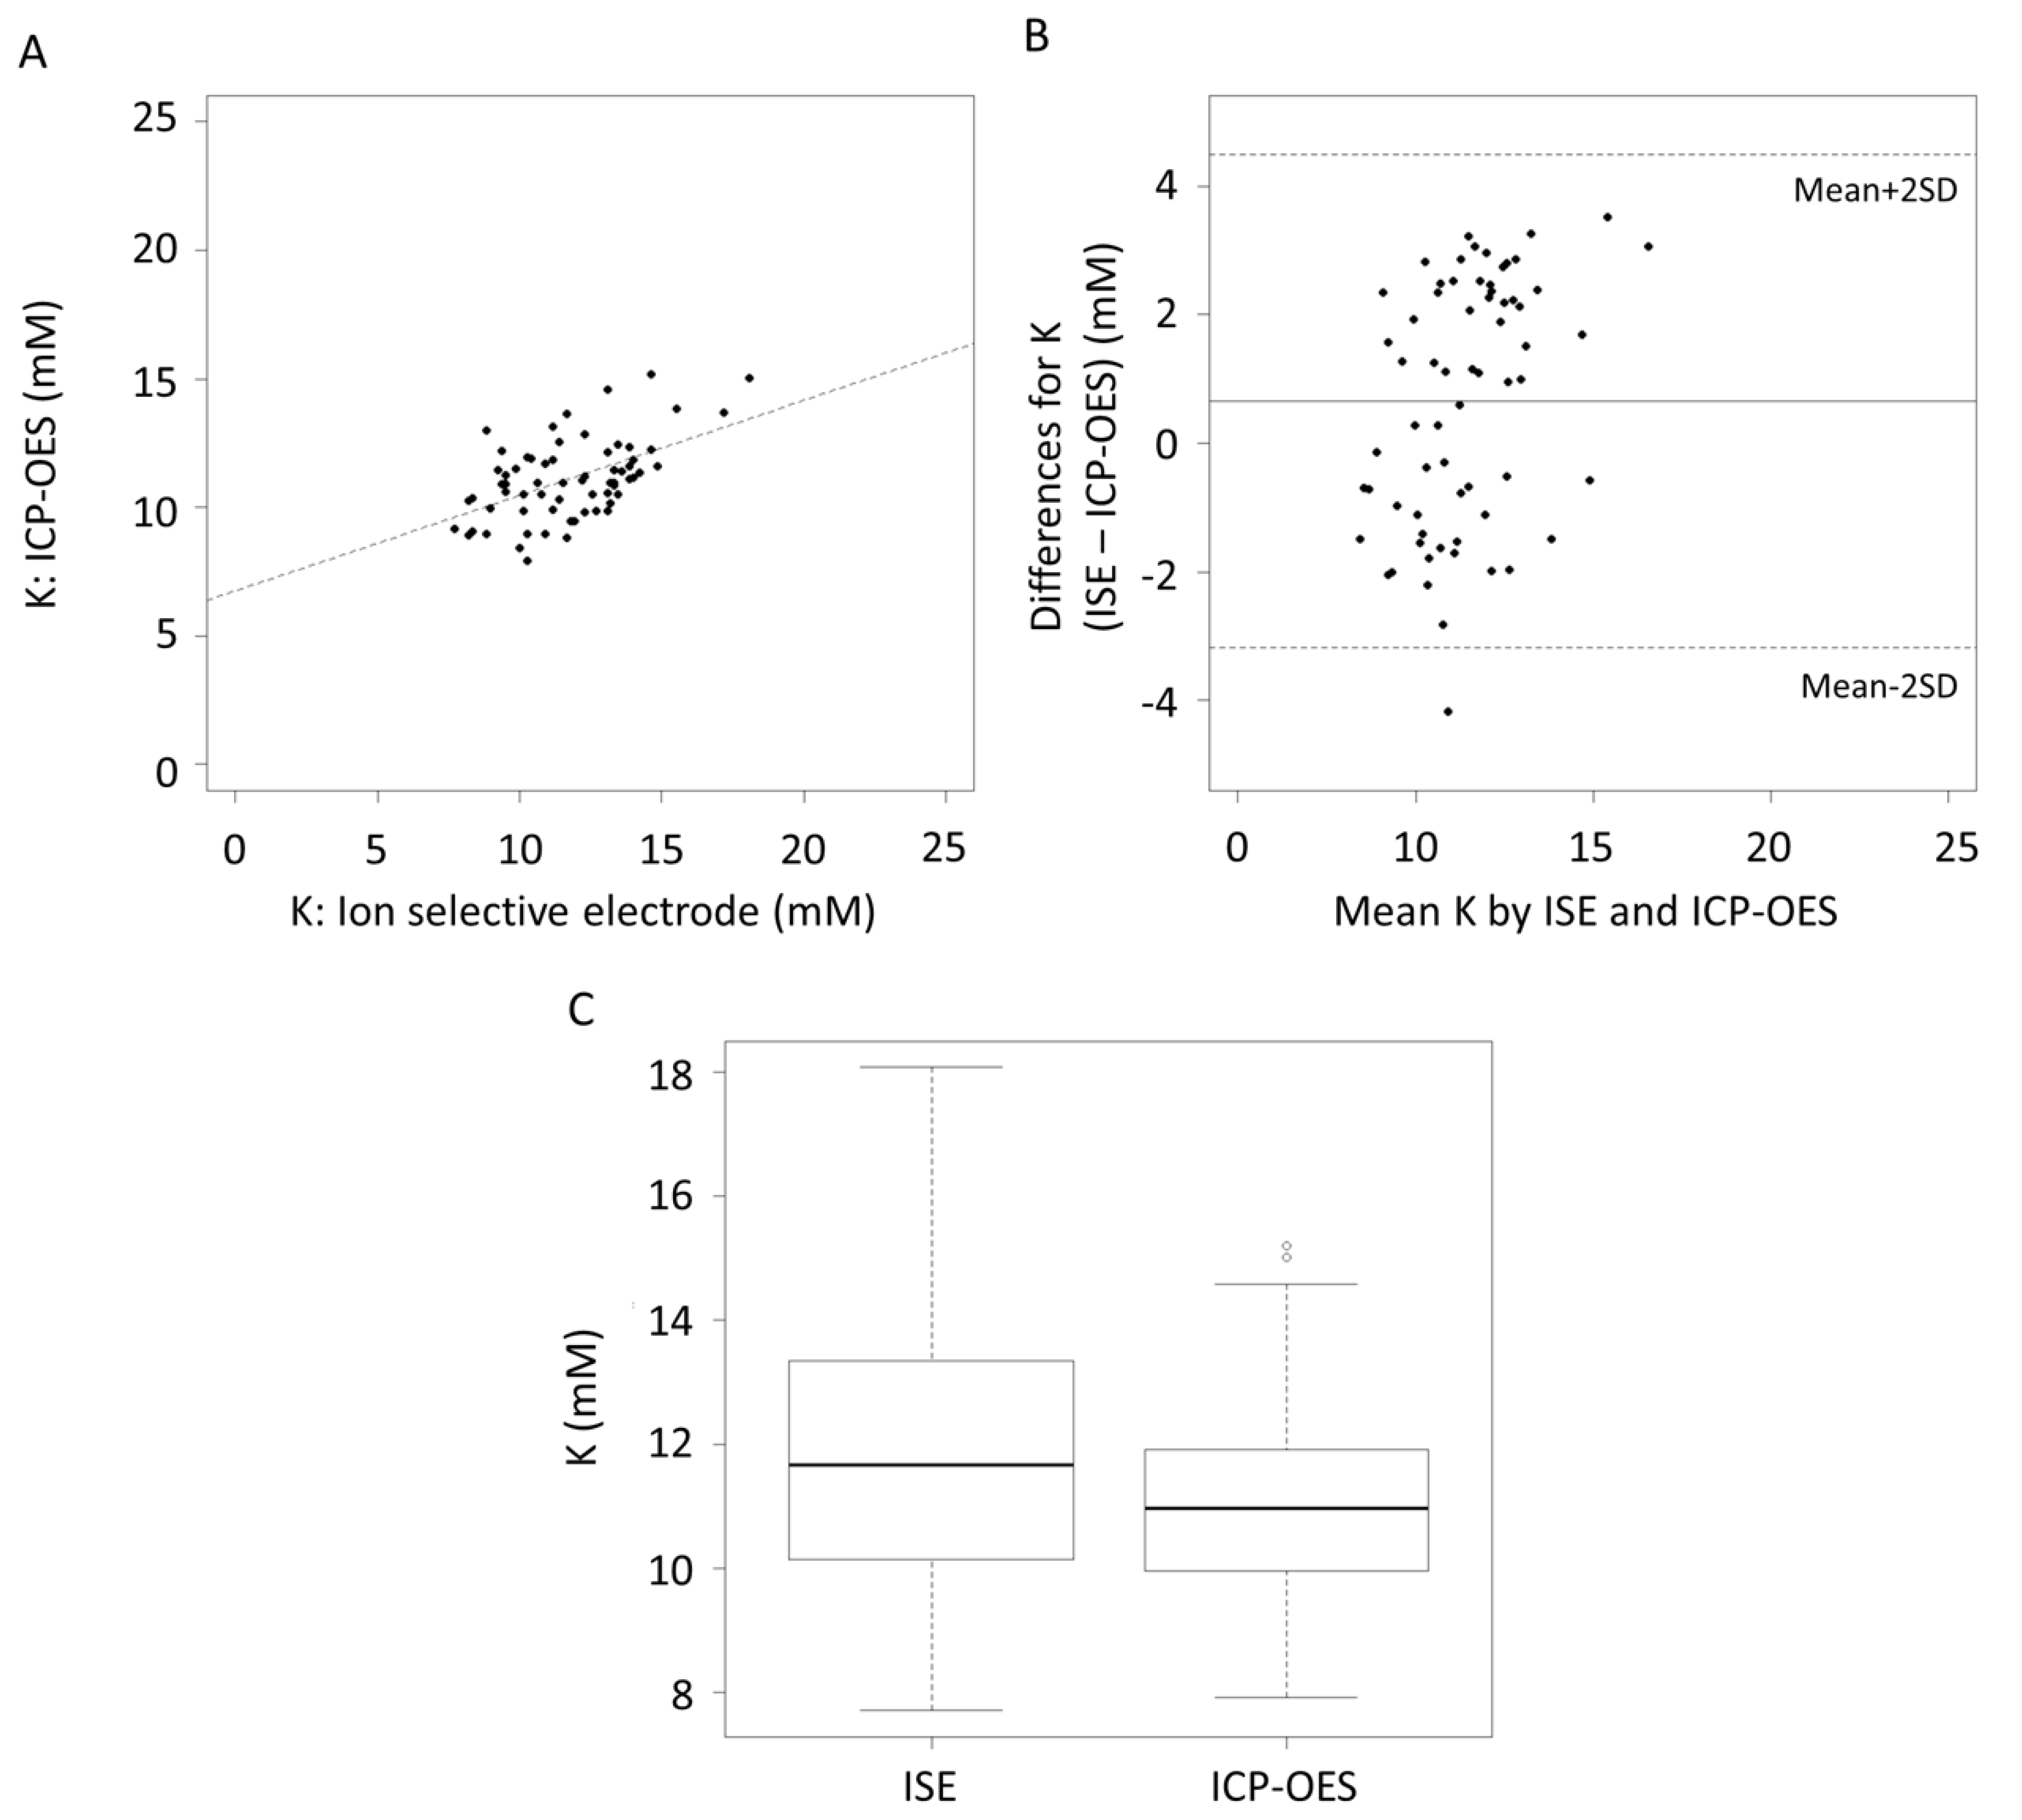
| n = 65 | Sodium (mM) | Potassium (mM) | ||||
|---|---|---|---|---|---|---|
| ISE | ICP-OES | p value | ISE | ICP-OES | p value | |
| Mean SD | 6.18 2.47 | 5.91 3.37 | 0.20 | 11.70 2.21 | 11.10 1.55 | 0.01 |
| Range | 3.59–19.80 | 2.59–21.50 | 7.69–18.10 | 7.91–15.20 | ||
| Element | Mean Difference | CI mean Difference | Limits of Agreement | CI of Limits of Agreement | ||
|---|---|---|---|---|---|---|
| Lower | Upper | Lower | Upper | |||
| Na (mM) | 0.26 | −0.15, 0.68 | −3.08 | 3.61 | −3.81, −2.37 | 2.90, 4.34 |
| K (mM) | 0.65 | 0.17, 1.13 | −3.19 | 4.49 | −4.01, −2.37 | 3.67, 5.31 |
© 2018 by the authors. Licensee MDPI, Basel, Switzerland. This article is an open access article distributed under the terms and conditions of the Creative Commons Attribution (CC BY) license (http://creativecommons.org/licenses/by/4.0/).
Share and Cite
Lai, C.T.; Gardner, H.; Geddes, D. Comparison of Inductively Coupled Plasma Optical Emission Spectrometry with an Ion Selective Electrode to Determine Sodium and Potassium Levels in Human Milk. Nutrients 2018, 10, 1218. https://doi.org/10.3390/nu10091218
Lai CT, Gardner H, Geddes D. Comparison of Inductively Coupled Plasma Optical Emission Spectrometry with an Ion Selective Electrode to Determine Sodium and Potassium Levels in Human Milk. Nutrients. 2018; 10(9):1218. https://doi.org/10.3390/nu10091218
Chicago/Turabian StyleLai, Ching Tat, Hazel Gardner, and Donna Geddes. 2018. "Comparison of Inductively Coupled Plasma Optical Emission Spectrometry with an Ion Selective Electrode to Determine Sodium and Potassium Levels in Human Milk" Nutrients 10, no. 9: 1218. https://doi.org/10.3390/nu10091218
APA StyleLai, C. T., Gardner, H., & Geddes, D. (2018). Comparison of Inductively Coupled Plasma Optical Emission Spectrometry with an Ion Selective Electrode to Determine Sodium and Potassium Levels in Human Milk. Nutrients, 10(9), 1218. https://doi.org/10.3390/nu10091218