Branched-Chain Amino Acid Database Integrated in MEDIPAD Software as a Tool for Nutritional Investigation of Mediterranean Populations

 , , , ,
 , ,
, , 
Abstract
1. Introduction
2. Materials and Methods
2.1. Computer Program
2.2. BCAA (Branched-Chain Amino Acids) Database
2.3. Populations and Ethical Statement
2.4. Dietary and Physical Activity Assessment
2.5. Data Management and Statistical Methods
3. Results
3.1. Description of BCAA Database
- Food items (n = 430) were completed from previous observations in SIDI program between 1992 and 2012 as compiled by Dr. P. Than Chi (Lapeyronie Hospital, Montpellier, France).
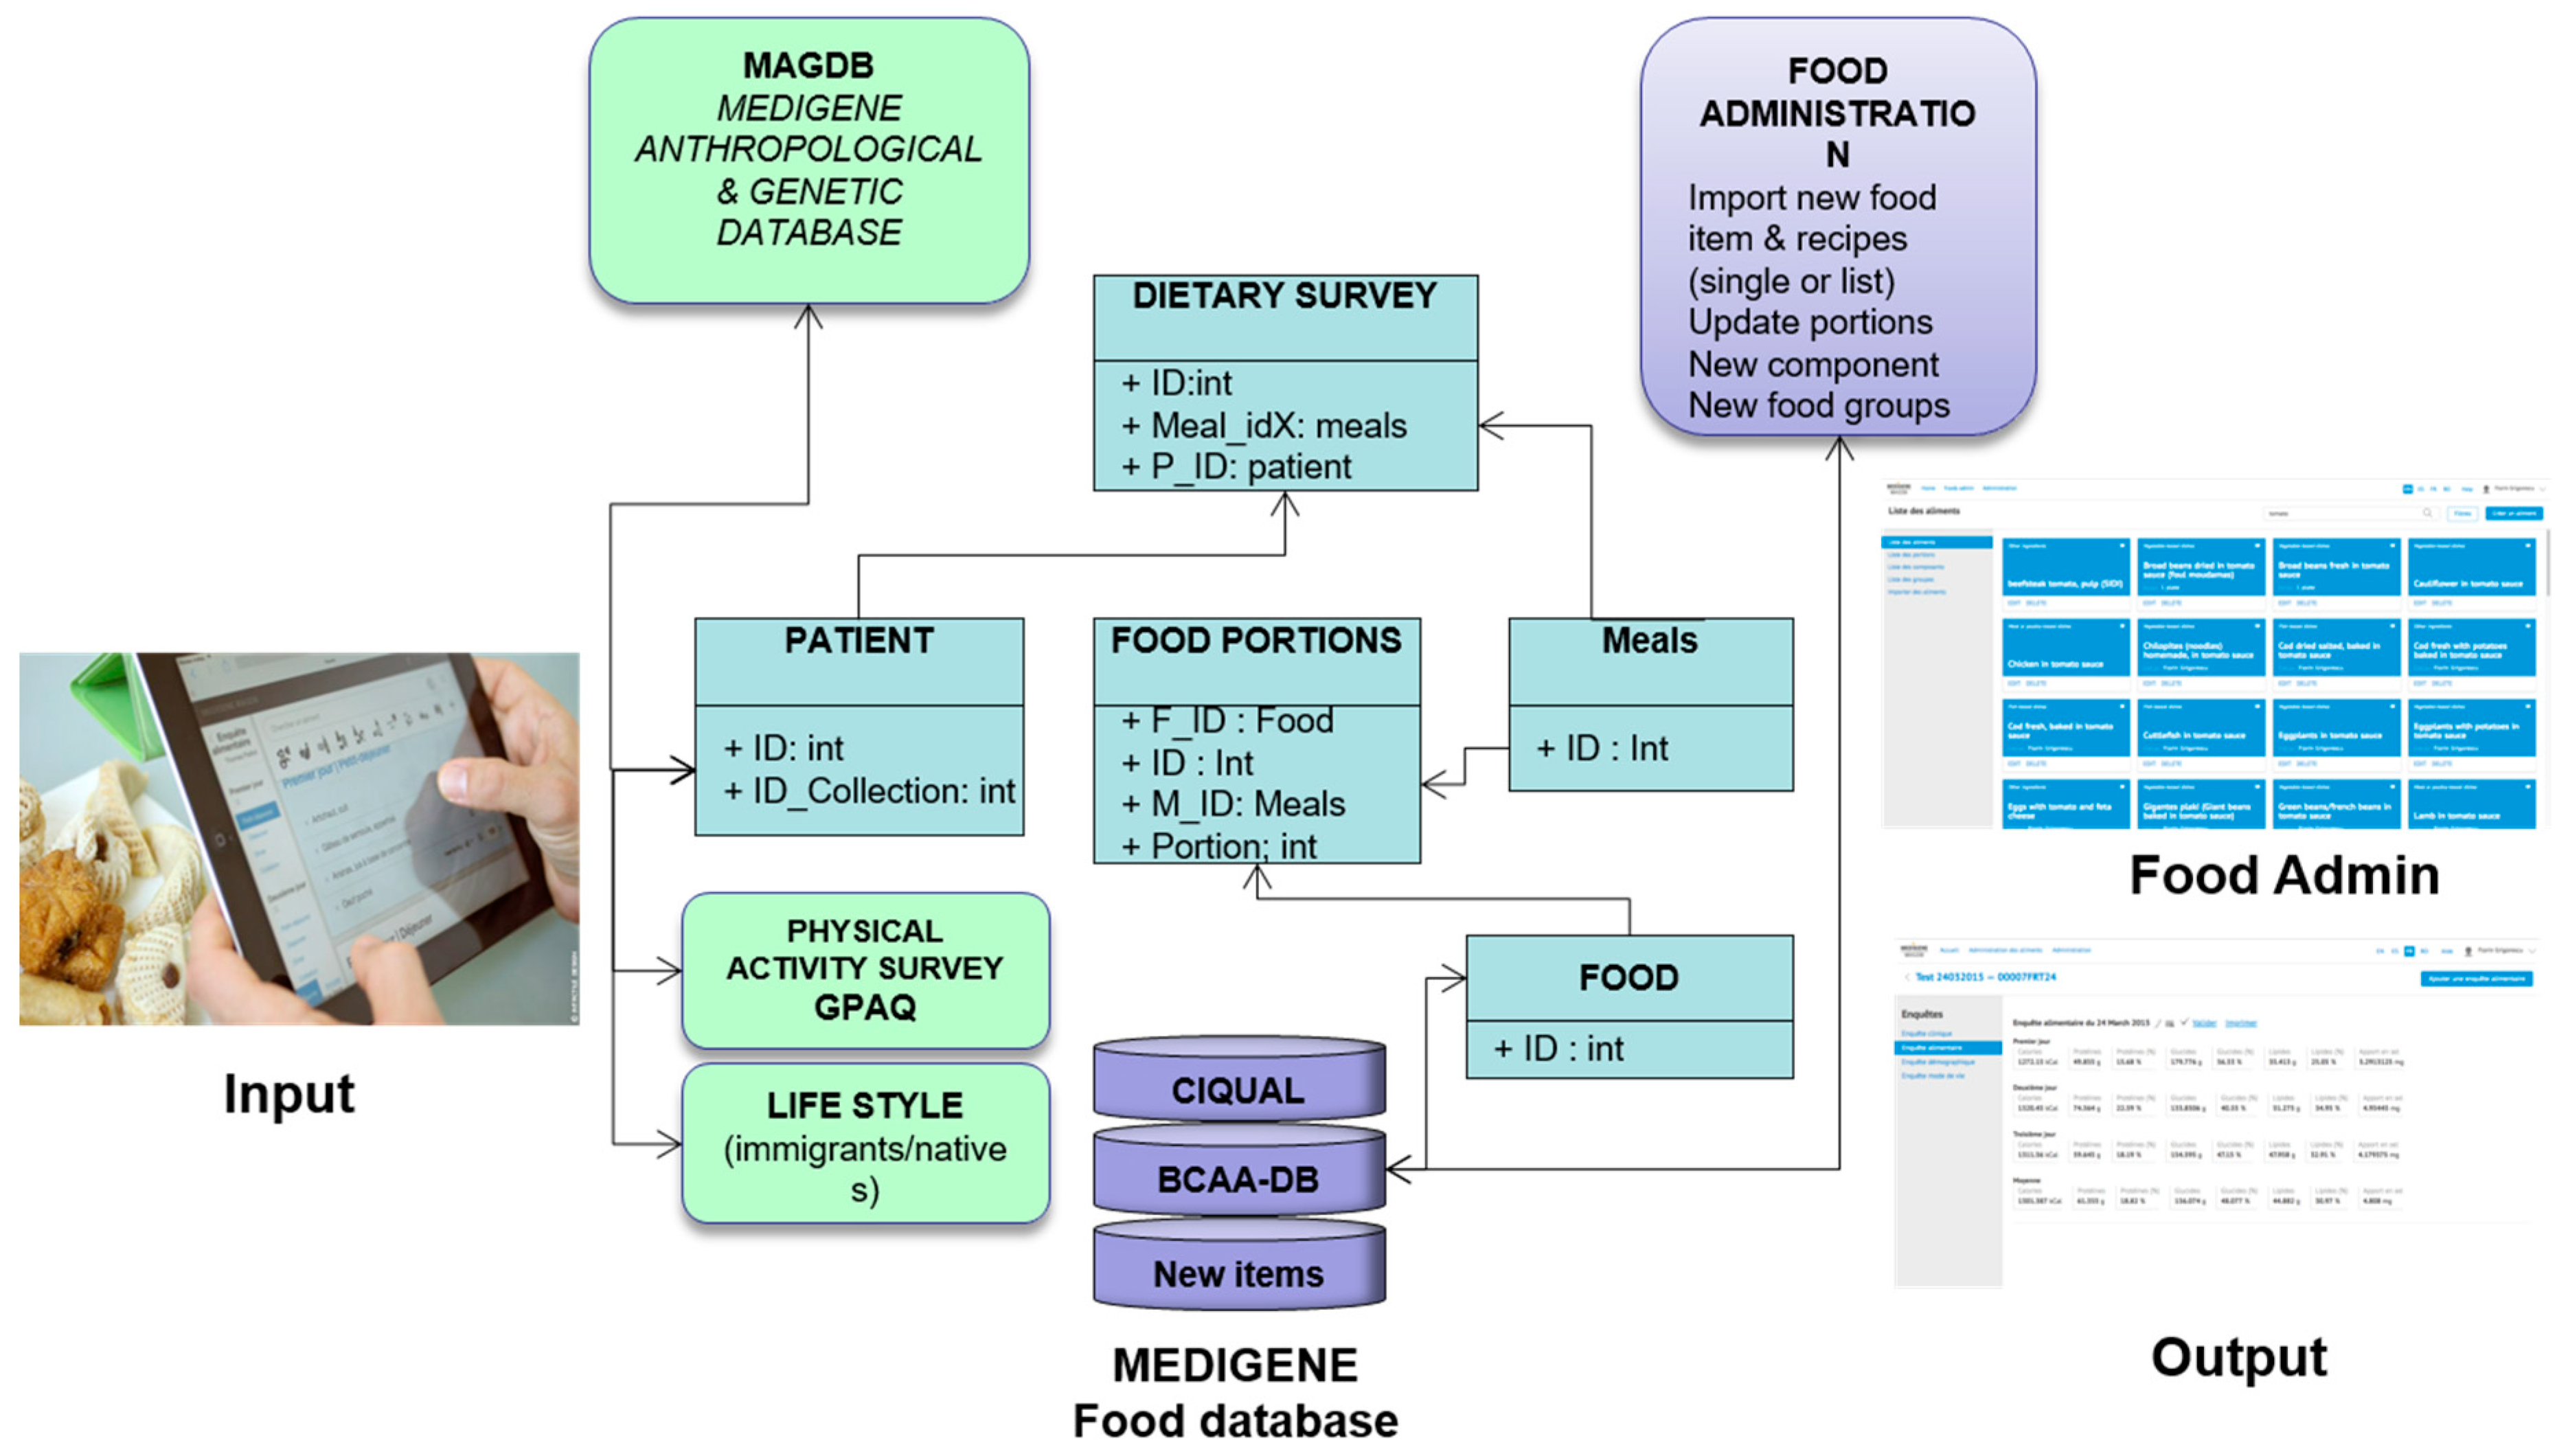
- For the BCAA database, the chief section in the MEDIPAD program is the section for food administration (Food Admin). Through this interface, the administrator is able to obtain the list of food items, groups, and food composition and can manage the following additional functions: (1) manage the list of portions; (2) check the list of nutritional components; (3) create new food groups for research purposes; (4) manually add new food items or recipes; and (5) import food items as bulk in .csv file (screenshots are illustrated in Figure 1). Greek food items and traditional dishes (n = 141) were added from the composition table of foods and Greek dishes of the Hellenic Health Foundation (http://www.hhf-greece.gr/tables/home.aspx?l=en). The source was “Composition tables of foods and Greek dishes”, 3rd edition [49].
- Turkish food items and dishes (n = 72) were included from Turkish Food Composition Database (TürKomp) (http://turkomp.gov.tr/database?type=foods), and recipes calculated from Turkish cuisine had been developed by the Ministry of Health (General Directorate of Primary Health Care & Primary Healthcare Department of Nutrition and Physical Activity) [50].
- Romanian (n = 22) and Moroccan (n = 32) dishes (mixed-dishes) were also added and calculated in SIDI program using the National Composition Table of foods available for Romanian foods (http://hunkbody.ro/tabel-cu-continutul-nutritiv-al-alimentelor/).
3.2. Food Items as Function of BCAA Content
3.3. Major Contributors to BCAA Intake in SPI Surveys
3.4. Evaluation of BCAA Intake in MEDIGENE Compared to Other Studies
4. Discussion
5. Conclusions
Supplementary Materials
Author Contributions
Funding
Acknowledgments
Conflicts of Interest
References
- Garber, A.J. Obesity and type 2 diabetes: Which patients are at risk? Diabetes Obes. Metab. 2012, 14, 399–408. [Google Scholar] [CrossRef] [PubMed]
- Tucker, K.L. Assessment of usual dietary intake in population studies of gene-diet interaction. Nutr. Metab. Cardiovasc. Dis. 2007, 17, 74–81. [Google Scholar] [CrossRef] [PubMed]
- Pekkarinen, M. Methodology in the collection of food consumption data. World Rev. Nutr. Diet. 1970, 12, 145–171. [Google Scholar] [PubMed]
- Halkjær, J.; Olsen, A.; Overvad, K.; Jakobsen, M.U.; Boeing, H.; Buijsse, B.; Palli, D.; Tognon, G.; Du, H.; van der A, D.L.; et al. Intake of total, animal and plant protein and subsequent changes in weight or waist circumference in European men and women: The Diogenes project. Int. J. Obes. 2011, 35, 1104–1113. [Google Scholar] [CrossRef] [PubMed]
- Foster, G.D.; Wyatt, H.R.; Hill, J.O.; McGuckin, B.G.; Brill, C.; Mohammed, B.S.; Szapary, P.O.; Rader, D.J.; Edman, J.S.; Klein, S. A randomized trial of a low-carbohydrate diet for obesity. N. Engl. J. Med. 2003, 348, 2082–2090. [Google Scholar] [CrossRef] [PubMed]
- Layman, D.K. Symposium: Dairy Product Components and Weight Regulation the Role of Leucine in Weight Loss Diets and Glucose Homeostasis. J. Nutr. 2003, 133, 261S–267S. [Google Scholar] [CrossRef] [PubMed]
- Qin, L.Q.; Xun, P.; Bujnowski, D.; Daviglus, M.L.; Van Horn, L.; Stamler, J.; He, K. Higher branched-chain amino acid intake is associated with a lower prevalence of being overweight or obese in middle-aged East Asian and Western adults. J. Nutr. 2011, 141, 249–254. [Google Scholar] [CrossRef] [PubMed]
- Isanejad, M.; LaCroix, A.Z.; Thomson, C.A.; Tinker, L.; Larson, J.C.; Qi, Q.; Qi, L.; Cooper-DeHoff, R.M.; Phillips, L.S.; Prentice, R.L.; et al. Branched-chain amino acid, meat intake and risk of type 2 diabetes in the Women’s Health Initiative. Br. J. Nutr. 2017, 117, 1523–1530. [Google Scholar] [CrossRef] [PubMed]
- Tinker, L.F.; Sarto, G.E.; Howard, B.V.; Huang, Y.; Neuhouser, M.L.; Mossavar-Rahmani, Y.; Beasley, J.M.; Margolis, K.L.; Eaton, C.B.; Phillips, L.S.; et al. Biomarker-calibrated dietary energy and protein intake associations with diabetes risk among postmenopausal women from the Women’s Health Initiative. Am. J. Clin. Nutr. 2011, 94, 1600–1606. [Google Scholar] [CrossRef] [PubMed]
- Fontana, L.; Cummings, N.E.; Arriola Apelo, S.I.; Neuman, J.C.; Kasza, I.; Schmidt, B.A.; Cava, E.; Spelta, F.; Tosti, V.; Syed, F.A.; et al. Decreased Consumption of Branched-Chain Amino Acids Improves Metabolic Health. Cell Rep. 2016, 16, 520–530. [Google Scholar] [CrossRef] [PubMed]
- Lynch, C.J.; Adams, S.H. Branched-chain amino acids in metabolic signalling and insulin resistance. Nat. Rev. Endocrinol. 2014, 10, 723–736. [Google Scholar] [CrossRef] [PubMed]
- Rietman, A.; Schwarz, J.; Tomé, D.; Kok, F.J.; Mensink, M. High dietary protein intake, reducing or eliciting insulin resistance? Eur. J. Clin. Nutr. 2014, 68, 973–979. [Google Scholar] [CrossRef] [PubMed]
- Cortiella, J.; Matthews, D.E.; Hoerr, R.A.; Bier, D.M.; Young, V.R. Leucine kinetics at graded intakes in young men: Quantitative fate of dietary leucine. Am. J. Clin. Nutr. 1988, 48, 998–1009. [Google Scholar] [CrossRef] [PubMed]
- Merz, B.; Frommherz, L.; Rist, M.J.; Kulling, S.E.; Bub, A.; Watzl, B. Dietary Pattern and Plasma BCAA-Variations in Healthy Men and Women-Results from the KarMeN Study. Nutrients 2018, 10, 623. [Google Scholar] [CrossRef] [PubMed]
- Zheng, Y.; Li, Y.; Qi, Q.; Hruby, A.; Manson, J.E.; Willett, W.C.; Wolpin, B.M.; Hu, F.B.; Qi, L. Cumulative consumption of branched-chain amino acids and incidence of type 2 diabetes. Int. J. Epidemiol. 2016, 45, 1482–1492. [Google Scholar] [CrossRef] [PubMed]
- Würtz, P.; Soininen, P.; Kangas, A.J.; Rönnemaa, T.; Lehtimäki, T.; Kähönen, M.; Viikari, J.S.; Raitakari, O.T.; Ala-Korpela, M. Branched-chain and aromatic amino acids are predictors of insulin resistance in young adults. Diabetes Care 2013, 36, 648–655. [Google Scholar] [CrossRef] [PubMed]
- Felig, P.; Marliss, E.; Cahill, G.F., Jr. Plasma amino acid levels and insulin secretion in obesity. N. Engl. J. Med. 1969, 281, 811–816. [Google Scholar] [CrossRef] [PubMed]
- Newgard, C.B.; An, J.; Bain, J.R.; Muehlbauer, M.J.; Stevens, R.D.; Lien, L.F.; Haqq, A.M.; Shah, S.H.; Arlotto, M.; Slentz, C.A.; et al. A branched-chain amino acid-related metabolic signature that differentiates obese and lean humans and contributes to insulin resistance. Cell Metab. 2009, 9, 311–326. [Google Scholar] [CrossRef] [PubMed]
- Walford, G.A.; Ma, Y.; Clish, C.; Florez, J.C.; Wang, T.J.; Gerszten, R.E.; Diabetes Prevention Program Research Group. Metabolite Profiles of Diabetes Incidence and Intervention Response in the Diabetes Prevention Program. Diabetes 2016, 65, 1424–1433. [Google Scholar] [CrossRef] [PubMed]
- Batch, B.C.; Hyland, K.; Svetkey, L.P. Branch chain amino acids: Biomarkers of health and disease. Curr. Opin. Clin. Nutr. Metab. Care 2014, 17, 86–89. [Google Scholar] [CrossRef] [PubMed]
- Bloomgarden, Z. Diabetes and branched-chain amino acids: What is the link? J. Diabetes 2018, 10, 350–352. [Google Scholar] [CrossRef] [PubMed]
- Manoli, I.; Venditti, C.P. Disorders of branched chain amino acid metabolism. Transl. Sci. Rare Dis. 2016, 1, 91–110. [Google Scholar] [CrossRef] [PubMed]
- Haydar, S.; Lautier, C.; Grigorescu, F. Branched chain amino acids at the edge between mendelian and complex disorders. Acta Endocrinol. Buchar. 2018, 14, 238–247. [Google Scholar] [CrossRef]
- Asghari, G.; Farhadnejad, H.; Teymoori, F.; Mirmiran, P.; Tohidi, M.; Azizi, F. High dietary intakes of branched-chain amino acids is associated with increased risk of insulin resistance in adults. J. Diabetes 2018, 10, 357–364. [Google Scholar] [CrossRef] [PubMed]
- Shah, S.H.; Crosslin, D.R.; Haynes, C.S.; Nelson, S.; Turer, C.B.; Stevens, R.D.; Muehlbauer, M.J.; Wenner, B.R.; Bain, J.R.; Laferrère, B.; et al. Branched-chain amino acid levels are associated with improvement in insulin resistance with weight loss. Diabetologia 2012, 55, 321–330. [Google Scholar] [CrossRef] [PubMed]
- Grigorescu, F. New Genetic Approaches in Understanding Susceptibility for Metabolic Syndrome in Immigrant Populations Around Mediterranean Area. Acta Endocrinol. Buchar. 2012, 8, 87–98. [Google Scholar] [CrossRef]
- Tucker, K.L.; Smith, C.E.; Lai, C.Q.; Ordovas, J.M. Quantifying diet for nutrigenomic studies. Annu. Rev. Nutr. 2013, 33, 349–371. [Google Scholar] [CrossRef] [PubMed]
- Beasley, J.M.; Davis, A.; Riley, W.T. Evaluation of a web-based, pictorial diet history questionnaire. Public Health Nutr. 2009, 12, 651–659. [Google Scholar] [CrossRef] [PubMed]
- Gemming, L.; Doherty, A.; Kelly, P.; Utter, J.; Mhurchu, C.N. Feasibility of a SenseCam-assisted 24-h recall to reduce under-reporting of energy intake. Eur. J. Clin. Nutr. 2013, 67, 1095–1099. [Google Scholar] [CrossRef] [PubMed]
- Kong, F.; Tan, J. DietCam: Automatic dietary assessment with mobile camera phones. Pervasive Mob. Comput. 2012, 8, 147–163. [Google Scholar] [CrossRef]
- Forster, H.; Fallaize, R.; Gallagher, C.; O’Donovan, C.B.; Woolhead, C.; Walsh, M.C.; Macready, A.L.; Lovegrove, J.A.; Mathers, J.C.; Gibney, M.J.; et al. Online dietary intake estimation: The Food4Me food frequency questionnaire. J. Med. Internet Res. 2014, 16, e150. [Google Scholar] [CrossRef] [PubMed]
- Touvier, M.; Kesse-Guyot, E.; Méjean, C.; Pollet, C.; Malon, A.; Castetbon, K.; Hercberg, S. Comparison between an interactive web-based self-administered 24 h dietary record and an interview by a dietitian for large-scale epidemiological studies. Br. J. Nutr. 2011, 105, 1055–1064. [Google Scholar] [CrossRef] [PubMed]
- Timon, C.M.; van den Barg, R.; Blain, R.J.; Kehoe, L.; Evans, K.; Walton, J.; Flynn, A.; Gibney, E.R. A review of the design and validation of web- and computer-based 24-h dietary recall tools. Nutr. Res. Rev. 2016, 29, 268–280. [Google Scholar] [CrossRef] [PubMed]
- Blanton, C.A.; Moshfegh, A.J.; Baer, D.J.; Kretsch, M.J. The USDA Automated Multiple-Pass Method accurately estimates group total energy and nutrient intake. J. Nutr. 2006, 136, 2594–2599. [Google Scholar] [CrossRef] [PubMed]
- Slimani, N.; Ferrari, P.; Ocké, M.; Welch, A.; Boeing, H.; Liere, M.; Pala, V.; Amiano, P.; Lagiou, A.; Mattisson, I.; et al. Standardization of the 24-hour diet recall calibration method used in the European prospective investigation into cancer and nutrition (EPIC): General concepts and preliminary results. Eur. J. Clin. Nutr. 2000, 54, 900–917. [Google Scholar] [CrossRef] [PubMed]
- Loth, K.A. Nutritional Data Systems for Research. In Encyclopedia of Feeding and Eating Disorders; Wade, T., Ed.; Springer: Singapore, 2015; pp. 1–3. [Google Scholar]
- Liu, B.; Young, H.; Crowe, F.L.; Benson, V.S.; Spencer, E.A.; Key, T.J.; Appleby, P.N.; Beral, V. Development and evaluation of the Oxford WebQ, a low-cost, web-based method for assessment of previous 24 h dietary intakes in large-scale prospective studies. Public Health Nutr. 2011, 14, 1998–2005. [Google Scholar] [CrossRef] [PubMed]
- Adriouch, S.; Lelong, H.; Kesse-Guyot, E.; Baudry, J.; Lampuré, A.; Galan, P.; Hercberg, S.; Touvier, M.; Fezeu, L.K. Compliance with Nutritional and Lifestyle Recommendations in 13,000 Patients with a Cardiometabolic Disease from the Nutrinet-Santé Study. Nutrients 2017, 9, 546. [Google Scholar] [CrossRef] [PubMed]
- Chi Thanh, P. Logiciel IDI (Information Diététique Intégrée) pour MacIntosh et, P.C. In Les Dossiers d’Agropolis: Alimentation Nutrition Santé; Agropolis Productions: Montpellier, France, 2005; Volume 25. [Google Scholar]
- Suga, H.; Murakami, K.; Sasaki, S. Development of an amino acid composition database and estimation of amino acid intake in Japanese adults. Asia Pac. J. Clin. Nutr. 2013, 22, 188–199. [Google Scholar] [PubMed]
- Westrich, B.J.; Buzzard, I.M.; Gatewood, L.C.; McGovern, P.G. Accuracy and efficiency of estimating nutrient values in commercial food products using mathematical optimization. J. Food Compos. Anal. 1994, 7, 223–239. [Google Scholar] [CrossRef]
- World Medical Association General Assembly. Declaration of Helsinki. Ethical Principles for Medical Research Involving Human Subjects; World Medical Association: Fortaleza, Brazil, 2013. [Google Scholar]
- Expert Panel on Detection, Evaluation, and Treatment of High Blood Cholesterol in Adults. Executive Summary of The Third Report of The National Cholesterol Education Program (NCEP) Expert Panel on Detection, Evaluation, and Treatment of High Blood Cholesterol in Adults (Adult Treatment Panel III). JAMA 2001, 285, 2486–2497. [Google Scholar] [CrossRef]
- Wanner, M.; Hartmann, C.; Pestoni, G.; Martin, B.W.; Siegrist, M.; Martin-Diener, E. Validation of the Global Physical Activity Questionnaire for self-administration in a European context. BMJ Open Sport Exerc. Med. 2017, 3, e000206. [Google Scholar] [CrossRef] [PubMed]
- Questionnaire Mondial sur la Pratique D’activités Physiques (GPAQ). Guide pour L’analyse. Available online: http://www.who.int/ncds/surveillance/steps/GPAQ_Analysis_Guide_FR.pdf (accessed on 1 February 2013).
- ANSES. Actualisation des Repères du PNNS: Révision des Repères de Consommations Alimentaires. Avis de l’Anses, Rapport D’expertise Collective. 2016. Available online: https://www.anses.fr/fr/system/files/NUT2012SA0103Ra-1.pdf (accessed on 5 March 2018).
- Harris, J.A.; Benedict, F.G. A biometric study of basal metabolism in man. Proc. Natl. Acad. Sci. USA 1918, 4, 370–373. [Google Scholar] [CrossRef] [PubMed]
- Lautier, C.; El Mkadem, S.A.; Renard, E.; Brun, J.F.; Gris, J.C.; Bringer, J.; Grigorescu, F. Complex haplotypes of IRS2 gene are associated with severe obesity and reveal heterogeneity in the effect of Gly1057Asp mutation. Hum. Genet. 2003, 113, 34–43. [Google Scholar] [CrossRef] [PubMed]
- Trichopoulou, A.; Georga, K. Composition Tables of Foods and Greek Dishes, 3rd ed.; Parisianou Publications: Athens, GA, USA, 2004; pp. 1–158. [Google Scholar]
- The ministry of Health General Directorate of Primary Health Care. Department of Nutrition and Physical Activity. Available online: http://beslenme.gov.tr/content/files/yayinlar/ingilizce_yayinlar/books/turkish_cuisine1.pdf (accessed on 1 June 2014).
- Block, G.; Dresser, C.M.; Hartman, A.M.; Carroll, M.D. Nutrient sources in the American diet: Quantitative data from the NHANES II survey. I. Vitamins and minerals. Am. J. Epidemiol. 1985, 122, 13–26. [Google Scholar] [CrossRef] [PubMed]
- Thompson, F.E.; Subar, A.F.; Loria, C.M.; Reedy, J.L.; Baranowski, T. Need for technological innovation in dietary assessment. J. Am. Diet. Assoc. 2010, 110, 48–51. [Google Scholar] [CrossRef] [PubMed]
- Parnell, W.R.; Wilson, N.C.; Russell, D.G. Methodology of the 1997 New Zealand National Nutrition Survey. N. Z. Med. J. 2001, 114, 123–126. [Google Scholar] [PubMed]
- Shin, S.; Park, E.; Sun, D.H.; You, T.K.; Lee, M.J.; Hwang, S.; Paik, H.Y.; Joung, H. Development and Evaluation of a Web-based Computer-Assisted Personal Interview System (CAPIS) for Open-ended Dietary Assessments among Koreans. Clin. Nutr. Res. 2014, 3, 115–125. [Google Scholar] [CrossRef] [PubMed]
- Daniel, C.R.; Kapur, K.; McAdams, M.J.; Dixit-Joshi, S.; Devasenapathy, N.; Shetty, H.; Hariharan, S.; George, P.S.; Mathew, A.; Sinha, R. Development of a field-friendly automated dietary assessment tool and nutrient database for India. Br. J. Nutr. 2014, 111, 160–171. [Google Scholar] [CrossRef] [PubMed]
- Brustad, M.; Skeie, G.; Braaten, T.; Slimani, N.; Lund, E. Comparison of telephone vs face-to-face interviews in the assessment of dietary intake by the 24 h recall EPIC SOFT program—The Norwegian calibration study. Eur. J. Clin. Nutr. 2003, 57, 107–113. [Google Scholar] [CrossRef] [PubMed]
- Arab, L.; Wesseling-Perry, K.; Jardack, P.; Henry, J.; Winter, A. Eight self-administered 24-hour dietary recalls using the Internet are feasible in African Americans and Whites: The energetics study. J. Am. Diet. Assoc. 2010, 110, 857–864. [Google Scholar] [CrossRef] [PubMed]
- Sonnenberg, L.; Pencina, M.; Kimokoti, R.; Quatromoni, P.; Nam, B.H.; D’Agostino, R.; Meigs, J.B.; Ordovas, J.; Cobain, M.; Millen, B. Dietary patterns and the metabolic syndrome in obese and non-obese Framingham women. Obes. Res. 2005, 13, 153–162. [Google Scholar] [CrossRef] [PubMed]
- Gavelle, E.; Huneau, J.F.; Mariotti, F. Patterns of Protein Food Intake Are Associated with Nutrient Adequacy in the General French Adult Population. Nutrients 2018, 10, 226. [Google Scholar] [CrossRef] [PubMed]
- Guidelines for Checking Food Composition Data Prior to the Publication of a User Table/Database-Version 1.0. Available online: http://www.fao.org/docrep/017/ap810e/ap810e.pdf (accessed on 1 July 2018).
- Ishikawa-Takata, K.; Takimoto, H. Current protein and amino acid intakes among Japanese people: Analysis of the 2012 National Health and Nutrition Survey. Geriatr. Gerontol. Int. 2018, 18, 723–731. [Google Scholar] [CrossRef] [PubMed]
- Ishihara, J.; Todoriki, H.; Inoue, M.; Tsugane, S.; JPHC FFQ Validation Study Group. Validity of a self-administered food-frequency questionnaire in the estimation of amino acid intake. Br. J. Nutr. 2009, 101, 1393–1399. [Google Scholar] [CrossRef] [PubMed]
- Suga, H.; Asakura, K.; Sasaki, S.; Nojima, M.; Okubo, H.; Hirota, N.; Notsu, A.; Fukui, M.; Date, C. Validation study of a self-administered diet history questionnaire for estimating amino acid intake among Japanese adults. Asia Pac. J. Clin. Nutr. 2018, 27, 638–645. [Google Scholar] [PubMed]
- Pallottini, A.C.; Sales, C.H.; dos Santos Vieira, D.A.; Marchioni, D.M.; Fisberg, R.M. Dietary BCAA Intake Is Associated with Demographic, Socioeconomic and Lifestyle Factors in Residents of São Paulo, Brazil. Nutrients 2017, 9, 449. [Google Scholar] [CrossRef] [PubMed]
- Nagata, C.; Nakamura, K.; Wada, K.; Tsuji, M.; Tamai, Y.; Kawachi, T. Branched-chain amino acid intake and the risk of diabetes in a Japanese community: The Takayama study. Am. J. Epidemiol. 2013, 178, 1226–1232. [Google Scholar] [CrossRef] [PubMed]
- Okekunle, A.P.; Wu, X.; Duan, W.; Feng, R.; Li, Y.; Sun, C. Dietary Intakes of Branched-Chained Amino Acid and Risk for Type 2 Diabetes in Adults: The Harbin Cohort Study on Diet, Nutrition and Chronic Non-Communicable Diseases Study. Can. J. Diabetes 2018, 42, 484–492. [Google Scholar] [CrossRef] [PubMed]


| Food Groups | Method 1 | Method 2 | Method 3 | Method 4 | Method 5 | Total Compiled | Not Compiled |
|---|---|---|---|---|---|---|---|
| Dairy products and cheese | 190 | 0 | 0 | 6 | 0 | 196 | 0 |
| Vegetables, fruits | 177 | 3 | 2 | 5 | 0 | 187 | 22 |
| Cereals and Pasta | 178 | 0 | 1 | 14 | 0 | 193 | 11 |
| Meat, poultry and fish | 248 | 4 | 3 | 13 | 0 | 268 | 5 |
| Sugars and confectionery | 28 | 0 | 0 | 4 | 2 | 34 | 4 |
| Fats and oils | 16 | 0 | 0 | 0 | 25 | 41 | 3 |
| Beverages | 49 | 0 | 0 | 8 | 117 | 174 | 33 |
| Sauces and condiments | 38 | 0 | 0 | 13 | 7 | 58 | 7 |
| Mixed dishes and Soups | 67 | 0 | 0 | 111 | 0 | 178 | 16 |
| Items for particular nutritional uses | 2 | 0 | 0 | 0 | 0 | 2 | 8 |
| Total | 993 | 7 | 6 | 174 | 151 | 1331 | 109 |
| Food Groups (%) | A | B | C | D | E | F |
|---|---|---|---|---|---|---|
| Offal | 0.00 | 0.00 | 0.00 | 2.42 | 4.95 | 5.41 |
| Red meat and poultry | 0.00 | 0.00 | 0.00 | 1.34 | 25.68 | 29.73 |
| Luncheon meats | 0.00 | 0.00 | 0.00 | 7.80 | 13.51 | 7.43 |
| Fish and seafood | 0.00 | 0.00 | 0.54 | 5.38 | 30.18 | 17.57 |
| Milk and dairy products | 0.00 | 0.99 | 24.12 | 5.65 | 3.60 | 5.41 |
| Cheese | 0.00 | 0.00 | 1.08 | 6.45 | 7.21 | 30.41 |
| Eggs and related products | 0.00 | 0.00 | 0.00 | 1.61 | 4.05 | 0.00 |
| Bread, Pasta, cereals | 0.00 | 0.49 | 14.36 | 24.46 | 0.45 | 0.68 |
| Pastries and brioches | 0.00 | 0.00 | 1.63 | 3.49 | 0.00 | 0.00 |
| Cakes | 0.00 | 0.49 | 13.82 | 3.76 | 0.00 | 0.00 |
| Fruits and vegetables | 1.78 | 50.25 | 16.80 | 0.54 | 0.00 | 0.00 |
| Legumes | 0.00 | 0.00 | 1.63 | 2.42 | 0.90 | 0.00 |
| Nuts and seeds | 0.00 | 0.49 | 1.90 | 2.96 | 3.60 | 0.68 |
| Mixed dishes | 0.59 | 6.90 | 10.03 | 26.34 | 4.50 | 1.35 |
| Fats and oil | 15.98 | 5.91 | 1.36 | 0.00 | 0.00 | 0.00 |
| Sugar and confectionery | 3.55 | 5.42 | 2.44 | 2.96 | 0.00 | 0.00 |
| Drinks | 73.96 | 20.69 | 3.52 | 0.27 | 0.90 | 0.00 |
| Herbs, spices and condiments | 4.14 | 8.37 | 6.78 | 2.15 | 0.45 | 1.35 |
| Variable | Q1 | Q2 | Q3 | Q4 | p |
|---|---|---|---|---|---|
| Isoleucine | |||||
| Median | 3.67 | 4.46 | 5.18 | 6.17 | |
| Obesity (9–13) a | 1.00 | 1.19 (0.91–1.55) | 1.48 (1.11–1.96) | 1.60 (1.14–2.24) | 0.0198 |
| Median | 3.60 | 4.47 | 5.19 | 6.21 | |
| Obesity (14–18) a | 1.00 | 0.63 (0.39–1.03) | 0.96 (0.59–2.09) | 0.92 (0.53–1.60) | 0.1936 |
| Leucine | |||||
| Median | 5.97 | 7.27 | 8.48 | 10.14 | |
| Obesity (9–13) a | 1.00 | 1.29 (1.00–1.68) | 1.33 (1.00–1.75) | 1.41 (1.01–1.97) | 0.1330 |
| Median | 5.82 | 7.27 | 8.45 | 10.12 | |
| Obesity (14–18) a | 1.00 | 0.76 (0.47–1.22) | 0.86 (0.51–1.43) | 0.90 (0.52–1.56) | 0.7164 |
| Valine | |||||
| Median | 4.21 | 5.17 | 5.1 | 7.00 | |
| Obesity (9–13) a | 1.00 | 1.21 (0.93–1.57) | 1.29 (0.97–1.71) | 1.57 (1.12–2.20) | 0.0725 |
| Median | 4.14 | 5.12 | 5.96 | 7.04 | |
| Obesity (14–18) a | 1.00 | 0.73 (0.45–1.17) | 0.96 (0.57–1.60) | 0.90 (0.51–1.57) | 0.5141 |
| Total BCAA | |||||
| Median | 13.64 | 17.04 | 19.62 | 23.31 | |
| Obesity (9–13) a | 1.00 | 1.30 (1.00–1.70) | 1.33 (1.00–1.77) | 1.61 (1.15–2.26) | 0.0440 |
| Median | 13.64 | 17.04 | 19.62 | 23.31 | |
| Obesity (14–18) a | 1.00 | 0.68 (0.43–1.10) | 0.93 (0.56–1.54) | 0.91 (0.52–1.58) | 0.3883 |
| Food Groups Contribution (%) | BCAA | Isoleucine | Leucine | Valine |
|---|---|---|---|---|
| Offal | 0.02 | 0.02 | 0.02 | 0.01 |
| Red meat and poultry | 36.30 | 36.42 | 38.04 | 33.60 |
| Luncheon meats | 3.27 | 3.44 | 3.35 | 3.00 |
| Fish and seafood | 2.04 | 2.03 | 2.14 | 1.91 |
| Milk and dairy products | 16.72 | 15.97 | 16.69 | 17.52 |
| Cheese | 9.81 | 11.47 | 7.05 | 12.33 |
| Eggs and related products | 1.10 | 1.07 | 1.05 | 1.18 |
| Bread, Pasta, cereals | 17.30 | 16.67 | 17.86 | 17.03 |
| Pastries and brioches | 2.39 | 2.30 | 2.47 | 2.36 |
| Cakes | 0.64 | 0.64 | 0.63 | 0.64 |
| Fruits and vegetables | 1.72 | 1.84 | 1.75 | 1.56 |
| Legumes | 4.82 | 4.51 | 5.02 | 4.80 |
| Nuts and seeds | 0.05 | 0.05 | 0.05 | 0.05 |
| Mixed dishes | 1.76 | 1.69 | 1.83 | 1.73 |
| Fats and oil | 0.06 | 0.06 | 0.06 | 0.07 |
| Sugar and confectionery | 1.36 | 1.21 | 1.39 | 1.45 |
| Drinks | 0.53 | 0.51 | 0.48 | 0.64 |
| Herbs, spices and condiments | 0.11 | 0.11 | 0.10 | 0.10 |
© 2018 by the authors. Licensee MDPI, Basel, Switzerland. This article is an open access article distributed under the terms and conditions of the Creative Commons Attribution (CC BY) license (http://creativecommons.org/licenses/by/4.0/).
Share and Cite
Haydar, S.; Paillot, T.; Fagot, C.; Cogne, Y.; Fountas, A.; Tutuncu, Y.; Vintila, M.; Tsatsoulis, A.; Thanh Chi, P.; Garandeau, P.; et al. Branched-Chain Amino Acid Database Integrated in MEDIPAD Software as a Tool for Nutritional Investigation of Mediterranean Populations. Nutrients 2018, 10, 1392. https://doi.org/10.3390/nu10101392
Haydar S, Paillot T, Fagot C, Cogne Y, Fountas A, Tutuncu Y, Vintila M, Tsatsoulis A, Thanh Chi P, Garandeau P, et al. Branched-Chain Amino Acid Database Integrated in MEDIPAD Software as a Tool for Nutritional Investigation of Mediterranean Populations. Nutrients. 2018; 10(10):1392. https://doi.org/10.3390/nu10101392
Chicago/Turabian StyleHaydar, Sara, Thomas Paillot, Christophe Fagot, Yannick Cogne, Athanasios Fountas, Yildiz Tutuncu, Madalina Vintila, Agathocles Tsatsoulis, Pham Thanh Chi, Patrick Garandeau, and et al. 2018. "Branched-Chain Amino Acid Database Integrated in MEDIPAD Software as a Tool for Nutritional Investigation of Mediterranean Populations" Nutrients 10, no. 10: 1392. https://doi.org/10.3390/nu10101392
APA StyleHaydar, S., Paillot, T., Fagot, C., Cogne, Y., Fountas, A., Tutuncu, Y., Vintila, M., Tsatsoulis, A., Thanh Chi, P., Garandeau, P., Chetea, D., Badiu, C., Gheorghiu, M., Ylli, D., Lautier, C., Jarec, M., Monnier, L., Normand, C., Šarac, J., ... Grigorescu, F. (2018). Branched-Chain Amino Acid Database Integrated in MEDIPAD Software as a Tool for Nutritional Investigation of Mediterranean Populations. Nutrients, 10(10), 1392. https://doi.org/10.3390/nu10101392