Blood Fatty Acid Status and Clinical Outcomes in Dialysis Patients: A Systematic Review

 ,
, 
 , ,
, ,
Abstract
:1. Introduction
2. Materials and Methods
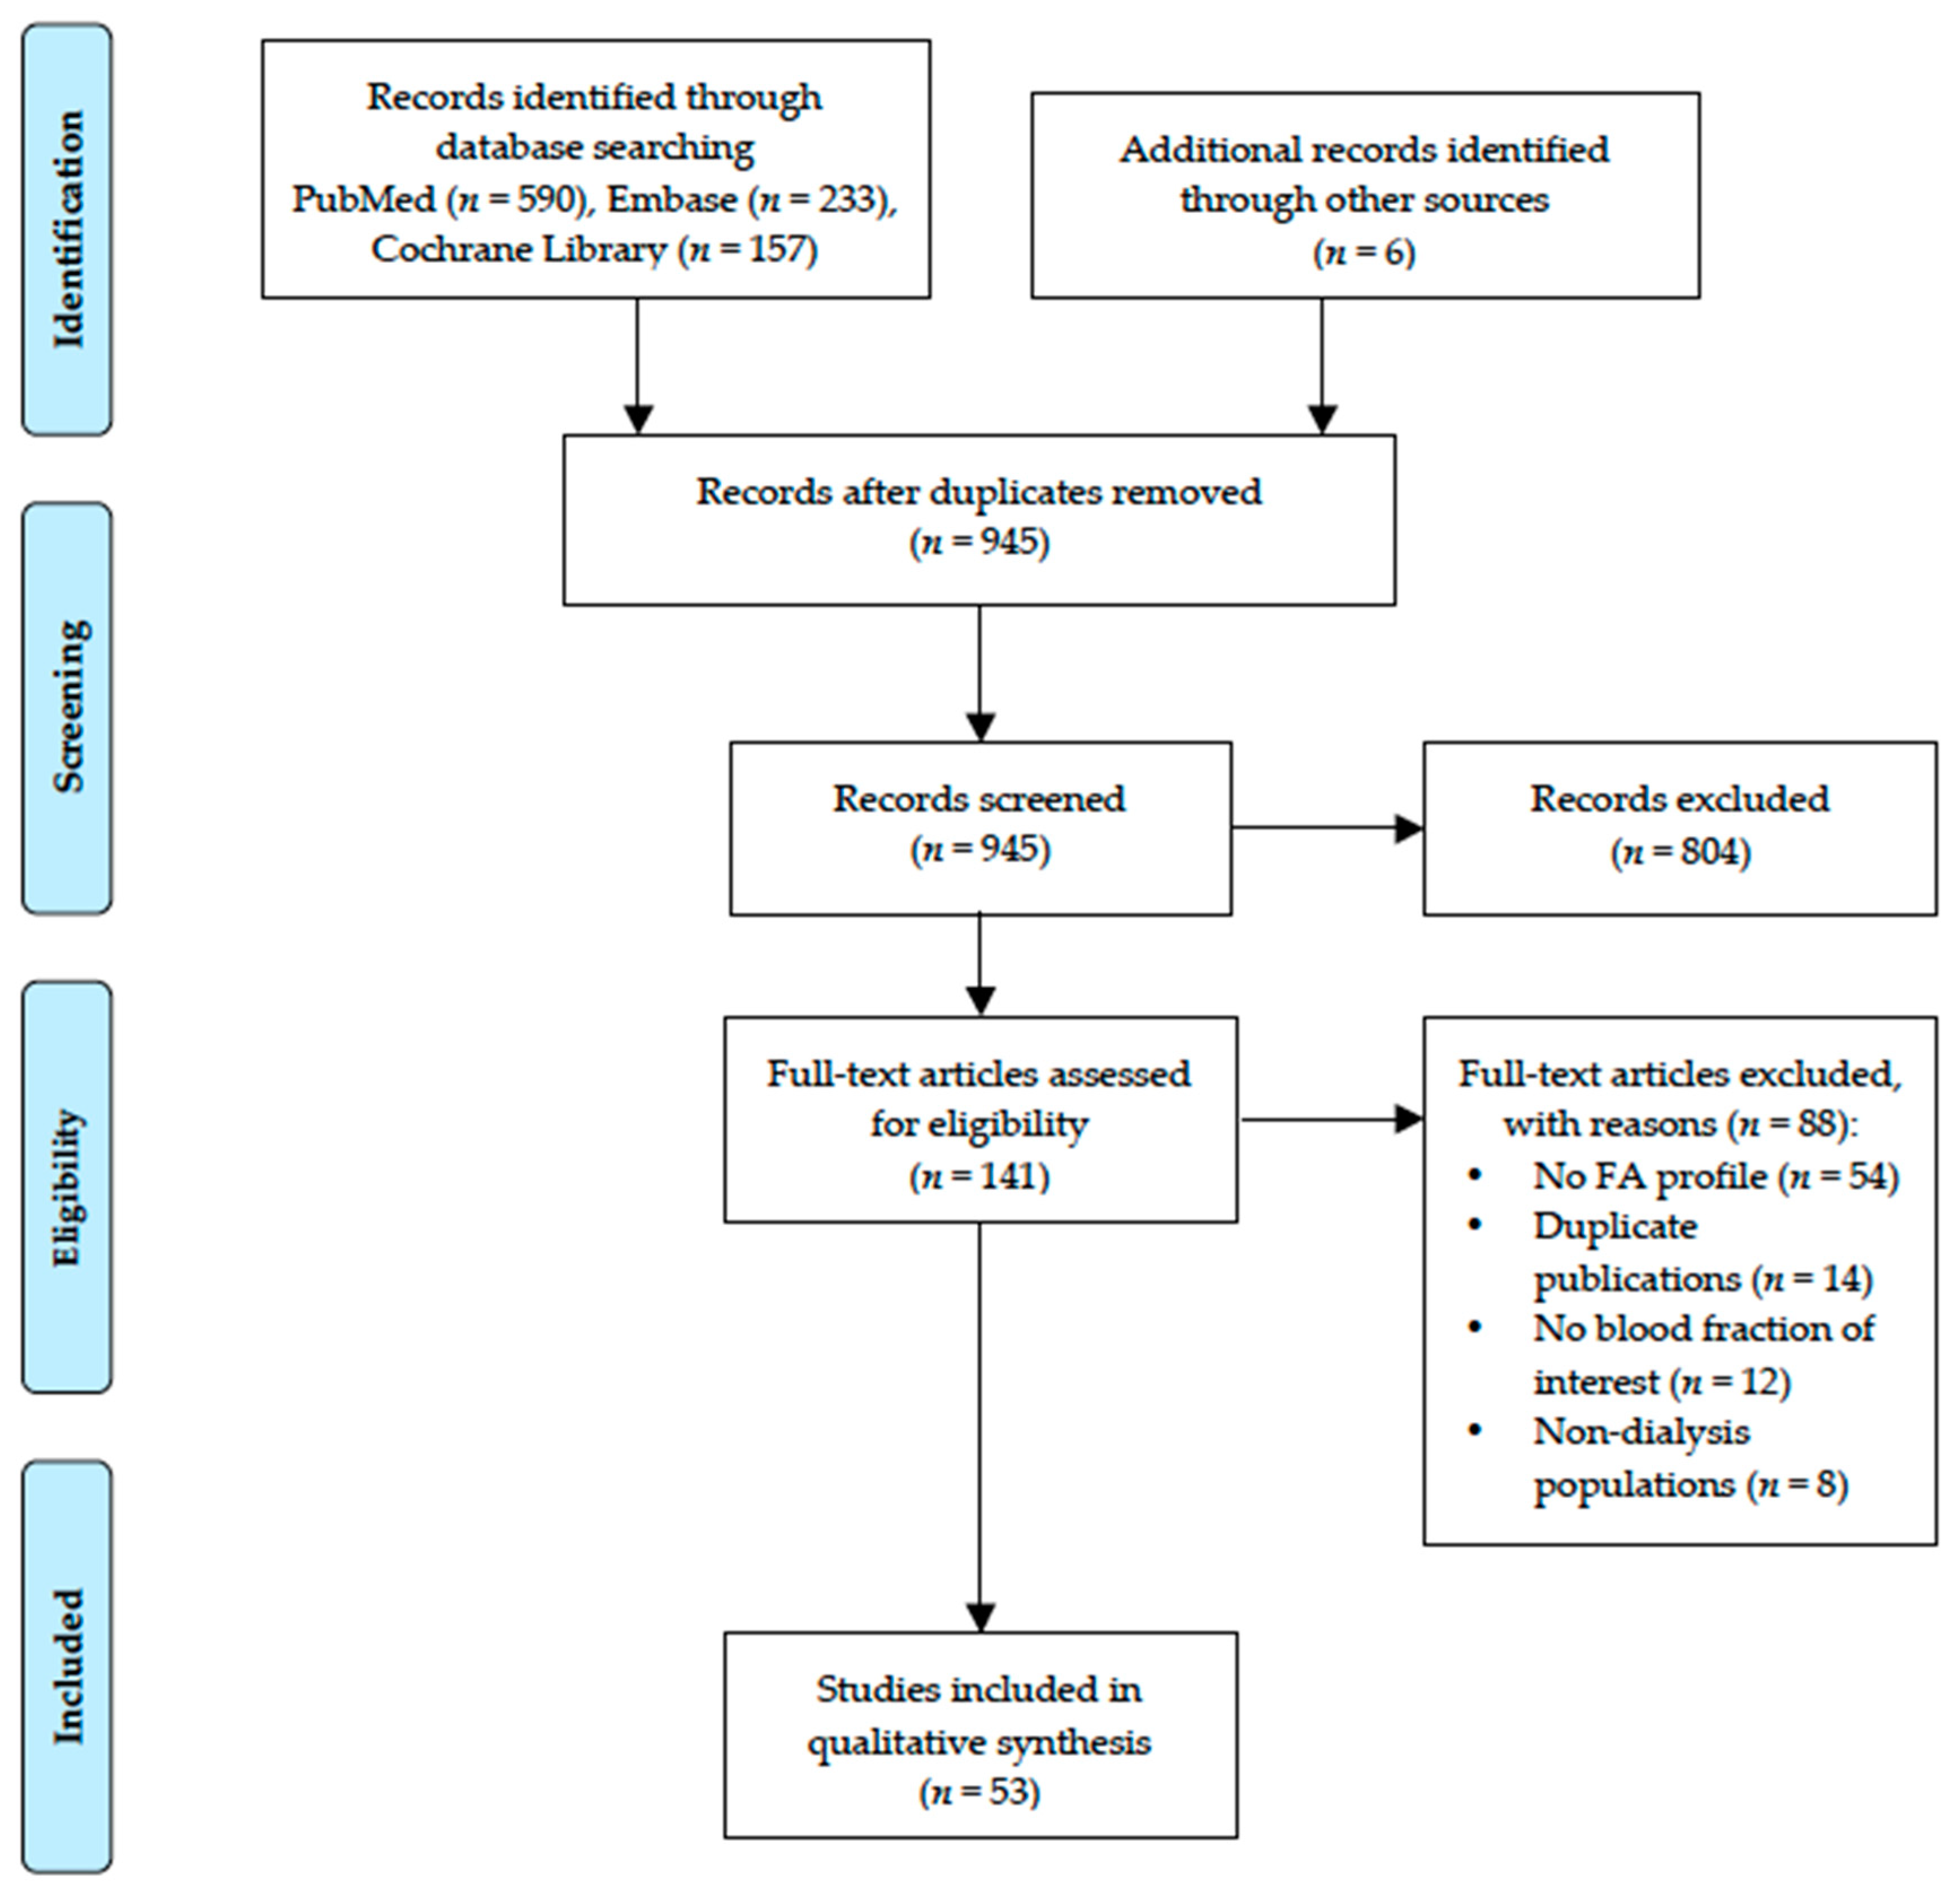
2.1. Data Sources, Search Strategy, and Selection
2.2. Data Extraction
2.3. Quality Assessment
3. Results
3.1. Characteristics of Studies Included
3.2. Blood Fatty Acid Status
3.3. Blood FA Status of Dialysis Patients Compared to Healthy Controls
3.4. Blood FA Predicting Clinical Endpoints
4. Discussion
5. Conclusions
Supplementary Materials
Author Contributions
Funding
Acknowledgments
Conflicts of Interest
References
- United States Renal Data System. 2017 USRDS Annual Data Report: Epidemiology of Kidney Disease in the United States; National Institutes of Health, National Institute of Diabetes and Digestive and Kidney Diseases: Bethesda, MD, USA, 2017. [Google Scholar]
- Van Der Zee, S.; Baber, U.; Elmariah, S.; Winston, J.; Fuster, V. Cardiovascular risk factors in patients with chronic kidney disease. Nat. Rev. Cardiol. 2009, 6, 580–589. [Google Scholar] [CrossRef] [PubMed]
- Kalantar-Zadeh, K.; Block, G.; Humphreys, M.H.; Kopple, J.D. Reverse epidemiology of cardiovascular risk factors in maintenance dialysis patients. Kidney Int. 2003, 63, 793–808. [Google Scholar] [CrossRef] [PubMed]
- Stenvinkel, P.; Carrero, J.J.; Axelsson, J.; Lindholm, B.; Heimbürger, O.; Massy, Z. Emerging biomarkers for evaluating cardiovascular risk in the chronic kidney disease patient: How do new pieces fit into the uremic puzzle? Clin. J. Am. Soc. Nephrol. 2008, 3, 505–521. [Google Scholar] [CrossRef] [PubMed]
- Jackson, K.H.; Harris, W.S. Blood fatty acid profiles: New biomarkers for cardiometabolic disease risk. Curr. Atheroscler. Rep. 2018, 20, 22. [Google Scholar] [CrossRef] [PubMed]
- Del Gobbo, L.C.; Imamura, F.; Aslibekyan, S.; Marklund, M.; Virtanen, J.K.; Wennberg, M.; Yakoob, M.Y.; Chiuve, S.E.; Dela Cruz, L.; Frazier-Wood, A.C. Ω-3 polyunsaturated fatty acid biomarkers and coronary heart disease: Pooling project of 19 cohort studies. JAMA Intern. Med. 2016, 176, 1155–1166. [Google Scholar] [CrossRef] [PubMed]
- Chowdhury, R.; Warnakula, S.; Kunutsor, S.; Crowe, F.; Ward, H.A.; Johnson, L.; Franco, O.H.; Butterworth, A.S.; Forouhi, N.G.; Thompson, S.G. Association of dietary, circulating, and supplement fatty acids with coronary risk: A systematic review and meta-analysis. Ann. Intern. Med. 2014, 160, 398–406. [Google Scholar] [CrossRef] [PubMed]
- Delgado, G.E.; Krämer, B.K.; Lorkowski, S.; März, W.; von Schacky, C.; Kleber, M.E. Individual omega-9 monounsaturated fatty acids and mortality—The Ludwigshafen Risk and Cardiovascular Health Study. J. Clin. Lipidol. 2017, 11, 126–135. [Google Scholar] [CrossRef] [PubMed]
- Kleber, M.E.; Delgado, G.E.; Dawczynski, C.; Lorkowski, S.; März, W.; von Schacky, C. Saturated fatty acids and mortality in patients referred for coronary angiography—The Ludwigshafen Risk and Cardiovascular Health Study. J. Clin. Lipidol. 2018, 12, 455–463. [Google Scholar] [CrossRef] [PubMed]
- Baylin, A.; Campos, H. The use of fatty acid biomarkers to reflect dietary intake. Curr. Opin. Lipidol. 2006, 17, 22–27. [Google Scholar] [CrossRef] [PubMed]
- Hodson, L.; Skeaff, C.M.; Fielding, B.A. Fatty acid composition of adipose tissue and blood in humans and its use as a biomarker of dietary intake. Prog. Lipid Res. 2008, 47, 348–380. [Google Scholar] [CrossRef] [PubMed]
- Novgorodtseva, T.P.; Denisenko, Y.K.; Zhukova, N.V.; Antonyuk, M.V.; Knyshova, V.V.; Gvozdenko, T.A. Modification of the fatty acid composition of the erythrocyte membrane in patients with chronic respiratory diseases. Lipids Health Dis. 2013, 12, 117. [Google Scholar] [CrossRef] [PubMed] [Green Version]
- Aghdassi, E.; Ma, D.W.; Morrison, S.; Hillyer, L.M.; Clarke, S.; Gladman, D.D.; Urowitz, M.B.; Fortin, P.R. Alterations in circulating fatty acid composition in patients with systemic lupus erythematosus: A pilot study. J. Parenter. Enteral Nutr. 2011, 35, 198–208. [Google Scholar] [CrossRef] [PubMed]
- Coviello, G.; Tutino, V.; Notarnicola, M.; Caruso, M.G. Erythrocyte membrane fatty acids profile in colorectal cancer patients: A preliminary study. Anticancer Res. 2014, 34, 4775–4779. [Google Scholar] [PubMed]
- Siguel, E.N.; Lerman, R.H. Prevalence of essential fatty acid deficiency in patients with chronic gastrointestinal disorders. Metabolism 1996, 45, 12–23. [Google Scholar] [CrossRef]
- Shearer, G.C.; Carrero, J.J.; Heimbürger, O.; Barany, P.; Stenvinkel, P. Plasma fatty acids in chronic kidney disease: Nervonic acid predicts mortality. J. Ren. Nutr. 2012, 22, 277–283. [Google Scholar] [CrossRef] [PubMed]
- Stegmayr, B. Dialysis procedures alter metabolic conditions. Nutrients 2017, 9, 548. [Google Scholar] [CrossRef] [PubMed]
- Dasgupta, A.; Kenny, M.; Ahmad, S. Abnormal fatty acid profile in chronic hemodialysis patients: Possible deficiency of essential fatty acids. Clin. Physiol. Biochem. 1990, 8, 238–243. [Google Scholar] [PubMed]
- von Elm, E.; Poglia, G.; Walder, B.; Tramer, M.R. Different patterns of duplicate publication: An analysis of articles used in systematic reviews. JAMA 2004, 291, 974–980. [Google Scholar] [CrossRef] [PubMed]
- Stark, K.D.; Van Elswyk, M.E.; Higgins, M.R.; Weatherford, C.A.; Salem, N. Global survey of the omega-3 fatty acids, docosahexaenoic acid and eicosapentaenoic acid in the blood stream of healthy adults. Prog. Lipid Res. 2016, 63, 132–152. [Google Scholar] [CrossRef] [PubMed]
- Harris, W.S. The omega-3 index as a risk factor for coronary heart disease. Am. J. Clin. Nutr. 2008, 87, 1997S–2002S. [Google Scholar] [CrossRef] [PubMed]
- Critical Appraisal Skills Programme. CASP Cohort Checklist. Available online: https://casp-uk.net/wp-content/uploads/2018/01/CASP-Cohort-Study-Checklist.pdf (accessed on 16 August 2018).
- Friedman, A.N.; Yu, Z.; Denski, C.; Tamez, H.; Wenger, J.; Thadhani, R.; Li, Y.; Watkins, B. Fatty acids and other risk factors for sudden cardiac death in patients starting hemodialysis. Am. J. Nephrol. 2013, 38, 12–18. [Google Scholar] [CrossRef] [PubMed]
- Friedman, A.N.; Yu, Z.; Tabbey, R.; Denski, C.; Tamez, H.; Wenger, J.; Thadhani, R.; Li, Y.; Watkins, B.A. Inverse relationship between long-chain n-3 fatty acids and risk of sudden cardiac death in patients starting hemodialysis. Kidney Int. 2013, 83, 1130–1135. [Google Scholar] [CrossRef] [PubMed]
- Terashima, Y.; Hamazaki, K.; Itomura, M.; Tomita, S.; Kuroda, M.; Hirata, H.; Hamazaki, T.; Inadera, H. Inverse association between docosahexaenoic acid and mortality in patients on hemodialysis during over 10 years. Hemodial. Int. 2014, 18, 625–631. [Google Scholar] [CrossRef] [PubMed] [Green Version]
- Friedman, A.N.; Saha, C.; Watkins, B.A. Feasibility study of erythrocyte long-chain omega-3 polyunsaturated fatty acid content and mortality risk in hemodialysis patients. J. Ren. Nutr. 2008, 18, 509–512. [Google Scholar] [CrossRef] [PubMed]
- Huang, X.; Stenvinkel, P.; Qureshi, A.; Cederholm, T.; Barany, P.; Heimbürger, O.; Lindholm, B.; Risérus, U.; Carrero, J. Clinical determinants and mortality predictability of stearoyl-co A desaturase-1 activity indices in dialysis patients. J. Intern. Med. 2013, 273, 263–272. [Google Scholar] [CrossRef] [PubMed]
- An, W.; Kim, S.; Kim, K.; Lee, S.; Park, Y.; Kim, H.; Vaziri, N. Comparison of fatty acid contents of erythrocyte membrane in hemodialysis and peritoneal dialysis patients. J. Ren. Nutr. 2009, 19, 267–274. [Google Scholar] [CrossRef] [PubMed]
- An, W.; Son, Y.; Kim, S.; Kim, K.; Bae, H.; Lee, S.; Park, Y.; Kim, H.; Vaziri, N. Association of adiponectin and leptin with serum lipids and erythrocyte omega-3 and omega-6 fatty acids in dialysis patients. Clin. Nephrol. 2011, 75, 195–203. [Google Scholar] [CrossRef] [PubMed]
- An, W.; Lee, S.; Son, Y.; Kim, S.; Kim, K.; Han, J.; Bae, H.; Park, Y. Effect of omega-3 fatty acids on the modification of erythrocyte membrane fatty acid content including oleic acid in peritoneal dialysis patients. Prostaglandins Leukot. Essent. Fatty Acids 2012, 86, 29–34. [Google Scholar] [CrossRef] [PubMed]
- An, W.S.; Lee, S.M.; Son, Y.K.; Kim, S.E.; Kim, K.H.; Han, J.Y.; Bae, H.R.; Rha, S.H.; Park, Y. Omega-3 fatty acid supplementation increases 1, 25-dihydroxyvitamin D and fetuin-A levels in dialysis patients. Nutr. Res. 2012, 32, 495–502. [Google Scholar] [CrossRef] [PubMed]
- Begum, R.; Belury, M.A.; Burgess, J.R.; Peck, L.W. Supplementation with n-3 and n-6 polyunsaturated fatty acids: Effects on lipoxygenase activity and clinical symptoms of pruritus in hemodialysis patients. J. Ren. Nutr. 2004, 14, 233–241. [Google Scholar] [CrossRef]
- De Fijter, C.; Popp-Snijders, C.; Oe, L.P.; Tran, D.D.; van der Meulen, J.; Donker, A. Does additional treatment with fish oil mitigate the side effects of recombinant human erythropoietin in dialysis patients? Haematologica 1995, 80, 332–334. [Google Scholar] [PubMed]
- De Gomez Dumm, N.T.; Giammona, A.M.; Touceda, L.A.; Raimondi, C. Lipid abnormalities in chronic renal failure patients undergoing hemodialysis. Medicina (B Aires) 2001, 61, 142–146. [Google Scholar] [PubMed]
- De Mattos, A.M.; da Costa, J.A.C.; Júnior, A.A.J.; Chiarello, P.G. Omega-3 fatty acid supplementation is associated with oxidative stress and dyslipidemia, but does not contribute to better lipid and oxidative status on hemodialysis patients. J. Ren. Nutr. 2017, 27, 333–339. [Google Scholar] [CrossRef] [PubMed]
- Delarue, J.; Guillodo, M.-P.; Guillerm, S.; Elbaz, A.; Marty, Y.; Cledes, J. Fish oil attenuates adrenergic overactivity without altering glucose metabolism during an oral glucose load in haemodialysis patients. Br. J. Nutr. 2008, 99, 1041–1047. [Google Scholar] [CrossRef] [PubMed]
- Delmas-Beauvieux, M.-C.; Combe, C.; Peuchant, E.; Carbonneau, M.-A.; Dubourg, L.; de Précigout, V.; Aparicio, M.; Clerc, M. Evaluation of red blood cell lipoperoxidation in hemodialysed patients during erythropoietin therapy supplemented or not with iron. Nephron 1995, 69, 404–410. [Google Scholar] [CrossRef] [PubMed]
- Dessì, M.; Noce, A.; Bertucci, P.; Noce, G.; Rizza, S.; De Stefano, A.; di Villahermosa, S.M.; Bernardini, S.; De Lorenzo, A.; Di Daniele, N. Plasma and erythrocyte membrane phospholipids and fatty acids in italian general population and hemodialysis patients. Lipids Health Dis. 2014, 13, 54. [Google Scholar] [CrossRef] [PubMed]
- Esaki, S.; Iwahori, M.-T.; Takagi, Y.; Wada, T.; Morita, S.; Sonoki, H.; Nakao, T. Effects of a novel nutritional formula enriched with eicosapentaenoic acid and docosahexaenoic acid specially developed for tube-fed hemodialysis patients. J. Ren. Nutr. 2017, 27, 127–131. [Google Scholar] [CrossRef] [PubMed]
- Friedman, A.N.; Moe, S.M.; Perkins, S.M.; Li, Y.; Watkins, B.A. Fish consumption and omega-3 fatty acid status and determinants in long-term hemodialysis. Am. J. Kidney Dis. 2006, 47, 1064–1071. [Google Scholar] [CrossRef] [PubMed]
- Friedman, A.N.; Yu, Z.; Tabbey, R.; Denski, C.; Tamez, H.; Wenger, J.; Thadhani, R.; Li, Y.; Watkins, B.A. Low blood levels of long-chain n-3 polyunsaturated fatty acids in us hemodialysis patients: Clinical implications. Am. J. Nephrol. 2012, 36, 451–458. [Google Scholar] [CrossRef] [PubMed]
- Friedman, A.N.; Kim, J.; Kaiser, S.; Pedersen, T.L.; Newman, J.W.; Watkins, B.A. Association between plasma endocannabinoids and appetite in hemodialysis patients: A pilot study. Nutr. Res. 2016, 36, 658–662. [Google Scholar] [CrossRef] [PubMed] [Green Version]
- Girelli, D.; Azzini, M.; Olivieri, O.; Guarini, P.; Trevisan, M.T.; Lupo, A.; Bernich, P.; Panzetta, G.; Corrocher, R. Red blood cells and platelet membrane fatty acids in non-dialyzed and dialyzed uremies. Clin. Chim. Acta 1992, 211, 155–166. [Google Scholar] [CrossRef]
- Hamazaki, T.; Nakazawa, R.; Tateno, S.; Shishido, H.; Isoda, K.; Hattori, Y.; Yoshida, T.; Fujita, T.; Yano, S.; Kumagai, A. Effects of fish oil rich in eicosapentaenoic acid on serum lipid in hyperlipidemic hemodialysis patients. Kidney Int. 1984, 26, 81–84. [Google Scholar] [CrossRef] [PubMed]
- Hamazaki, K.; Terashima, Y.; Itomura, M.; Sawazaki, S.; Inagaki, H.; Kuroda, M.; Tomita, S.; Hirata, H.; Inadera, H.; Hamazaki, T. Docosahexaenoic acid is an independent predictor of all-cause mortality in hemodialysis patients. Am. J. Nephrol. 2011, 33, 105–110. [Google Scholar] [CrossRef] [PubMed]
- Holler, C.; Auinger, M.; Ulberth, F.; Irsigler, K. Eicosanoid precursors: Potential factors for atherogenesis in diabetic CAPD patients? Perit. Dial. Int. 1996, 16, S250–S253. [Google Scholar] [PubMed]
- Huang, X.; Stenvinkel, P.; Qureshi, A.R.; Risérus, U.; Cederholm, T.; Bárány, P.; Heimbürger, O.; Lindholm, B.; Carrero, J.J. Essential polyunsaturated fatty acids, inflammation and mortality in dialysis patients. Nephrol. Dial. Transpl. 2012, 27, 3615–3620. [Google Scholar] [CrossRef] [PubMed] [Green Version]
- Kim, H.I.; An, W.S. Comparison of fetuin-A, vitamin D, monounsaturated fatty acid, and vascular calcification on plain radiography between dialysis modalities. Iran J. Kidney Dis. 2013, 7, 453–460. [Google Scholar] [PubMed]
- Koorts, A.; Viljoen, M.; Kruger, M. Red blood cell fatty acid profile of chronic renal failure patients receiving maintenance haemodialysis treatment. Prostaglandins Leukot. Essent. Fatty Acids 2002, 67, 13–18. [Google Scholar] [CrossRef] [PubMed]
- Lee, S.M.; Son, Y.K.; Kim, S.E.; An, W.S. The effects of omega-3 fatty acid on vitamin D activation in hemodialysis patients: A pilot study. Mar. Drugs 2015, 13, 741–755. [Google Scholar] [CrossRef] [PubMed]
- Madsen, T.; Christensen, J.H.; Svensson, M.; Witt, P.M.; Toft, E.; Schmidt, E.B. Marine n-3 polyunsaturated fatty acids in patients with end-stage renal failure and in subjects without kidney disease: A comparative study. J. Ren. Nutr. 2011, 21, 169–175. [Google Scholar] [CrossRef] [PubMed]
- Marangoni, R.; Civardi, F.; Suuino, R.; Colombo, R.; Marangoni, F.; Mosconi, C.; Galli, C. Plasma lipids and fatty acid levels in chronically uremic patients undergoing blood purification with different methods. Artif. Organs 1992, 16, 625–629. [Google Scholar] [CrossRef] [PubMed]
- Nakamura, N.; Fujita, T.; Kumasaka, R.; Murakami, R.; Shimada, M.; Shimaya, Y.; Osawa, H.; Yamabe, H.; Okumura, K. Serum lipid profile and plasma fatty acid composition in hemodialysis patients-comparison with chronic kidney disease patients. In Vivo 2008, 22, 609–611. [Google Scholar] [PubMed]
- Oh, J.; Kim, S.; Sin, Y.; Kim, J.; Park, Y.; Bae, H.; Son, Y.; Nam, H.; Kang, H.; An, W. Comparison of erythrocyte membrane fatty acid contents in renal transplant recipients and dialysis patients. Transpl. Proc. 2012, 44, 2932–2935. [Google Scholar] [CrossRef] [PubMed]
- Pazda, M.; Stepnowski, P.; Sledzinski, T.; Chmielewski, M.; Mika, A. Suitability of selected chromatographic columns for analysis of fatty acids in dialyzed patients. Biomed. Chromatogr. 2017, 31, e4006. [Google Scholar] [CrossRef] [PubMed]
- Peck, L.W.; Monsen, E.R.; Ahmad, S. Effect of three sources of long-chain fatty acids on the plasma fatty acid profile, plasma prostaglandin E2 concentrations, and pruritus symptoms in hemodialysis patients. Am. J. Clin. Nutr. 1996, 64, 210–214. [Google Scholar] [CrossRef] [PubMed] [Green Version]
- Perunicic-Pekovic, G.B.; Rasic, Z.R.; Pljesa, S.I.; Sobajic, S.S.; Djuricic, I.; Maletic, R.; Ristic-Medic, D.K. Effect of n-3 fatty acids on nutritional status and inflammatory markers in haemodialysis patients. Nephrology 2007, 12, 331–336. [Google Scholar] [CrossRef] [PubMed]
- Peuchant, E.; Salles, C.; Vallot, C.; Wone, C.; Jensen, R. Increase of erythrocyte resistance to hemolysis and modification of membrane lipids induced by hemodialysis. Clin. Chim. Acta 1988, 178, 271–282. [Google Scholar] [CrossRef]
- Peuchant, E.; Carbonneau, M.-A.; Dubourg, L.; Thomas, M.-J.; Perromat, A.; Vallot, C.; Clerc, M. Lipoperoxidation in plasma and red blood cells of patients undergoing haemodialysis: Vitamins A, E, and iron status. Free Radic. Biol. Med. 1994, 16, 339–346. [Google Scholar] [CrossRef]
- Ristić, V.; Tepšić, V.; Ristić-Medić, D.; Peruničić, G.; Rašić, Z.; Poštić, M.; Arsić, A.; Blaženčić-Mladenović, V.; Ristić, G. Plasma and erythrocyte phospholipid fatty acids composition in Serbian hemodialyzed patients. Ren. Fail. 2006, 28, 211–216. [Google Scholar] [CrossRef] [PubMed]
- Ristic-Medic, D.; Perunicic-Pekovic, G.; Rasic-Milutinovic, Z.; Takic, M.; Popovic, T.; Arsic, A.; Glibetic, M. Effects of dietary milled seed mixture on fatty acid status and inflammatory markers in patients on hemodialysis. Sci. World J. 2014, 2014. [Google Scholar] [CrossRef] [PubMed]
- Sertoglu, E.; Kurt, I.; Tapan, S.; Uyanik, M.; Serdar, M.A.; Kayadibi, H.; El-Fawaeir, S. Comparison of plasma and erythrocyte membrane fatty acid compositions in patients with end-stage renal disease and type 2 diabetes mellitus. Chem. Phys. Lipids 2014, 178, 11–17. [Google Scholar] [CrossRef] [PubMed]
- Shoji, T.; Kakiya, R.; Hayashi, T.; Tsujimoto, Y.; Sonoda, M.; Shima, H.; Mori, K.; Fukumoto, S.; Tahara, H.; Shioi, A. Serum n-3 and n-6 polyunsaturated fatty acid profile as an independent predictor of cardiovascular events in hemodialysis patients. Am. J. Kidney Dis. 2013, 62, 568–576. [Google Scholar] [CrossRef] [PubMed]
- Sikorska-Wiśniewska, M.; Mika, A.; Śledziński, T.; Małgorzewicz, S.; Stepnowski, P.; Rutkowski, B.; Chmielewski, M. Disorders of serum omega-3 fatty acid composition in dialyzed patients, and their associations with fat mass. Ren. Fail. 2017, 39, 406–412. [Google Scholar] [CrossRef] [PubMed] [Green Version]
- Son, Y.K.; Lee, S.M.; Kim, S.E.; Kim, K.H.; Lee, S.Y.; Bae, H.R.; Han, J.Y.; Park, Y.; An, W.S. Association between vascular calcification scores on plain radiographs and fatty acid contents of erythrocyte membrane in hemodialysis patients. J. Ren. Nutr. 2012, 22, 58–66. [Google Scholar] [CrossRef] [PubMed]
- Svensson, M.; Schmidt, E.B.; Jørgensen, K.A.; Christensen, J.H.; Group, O.S. n-3 fatty acids as secondary prevention against cardiovascular events in patients who undergo chronic hemodialysis: A randomized, placebo-controlled intervention trial. Clin. J. Am. Soc. Nephrol. 2006, 1, 780–786. [Google Scholar] [CrossRef] [PubMed]
- Taccone-Gallucci, M.; Lubrano, R.; Belli, A.; Citti, G.; Morosetti, M.; Meloni, C.; Elli, M.; Mazzarella, V.; Tozzo, C.; Meschini, L. Lack of oxidative damage in serum polyunsaturated fatty acids before and after dialysis in chronic uremic patients. Int. J. Artif. Organs 1989, 12, 515–518. [Google Scholar] [CrossRef] [PubMed]
- Talwaker, R.T.; Kotchen, T.A.; Welch, W.J.; Curtis, J.J.; Galla, J.H. Different mechanisms for the increased enzymatic activity of renin in plasma of patients with chronic renal failure and patients receiving glucocorticoid therapy. J. Clin. Endocrinol. Metab. 1980, 50, 989–993. [Google Scholar] [CrossRef] [PubMed]
- Tsuzuki, D.; Sumino, K.; Yokoyama, M. Analysis of 7-ketocholesterol in low density lipoprotein and fatty acid composition in erythrocyte membranes of patients on maintenance hemodialysis and healthy controls. Clin. Chim. Acta 2000, 295, 155–168. [Google Scholar] [CrossRef]
- Umemoto, N.; Ishii, H.; Kamoi, D.; Aoyama, T.; Sakakibara, T.; Takahashi, H.; Tanaka, A.; Yasuda, Y.; Suzuki, S.; Matsubara, T. Reverse association of omega-3/omega-6 polyunsaturated fatty acids ratios with carotid atherosclerosis in patients on hemodialysis. Atherosclerosis 2016, 249, 65–69. [Google Scholar] [CrossRef] [PubMed]
- Westhuyzen, J.; Saltissi, D.; Stanbury, V. Oxidative stress and erythrocyte integrity in end-stage renal failure patients hemodialysed using a vitamin e-modified membrane. Ann. Clin. Lab. Sci. 2003, 33, 3–10. [Google Scholar] [PubMed]
- Yerlikaya, F.H.; Mehmetoglu, I.; Kurban, S.; Tonbul, Z. Plasma fatty acid composition in continuous ambulatory peritoneal dialysis patients: An increased omega-6/omega-3 ratio and deficiency of essential fatty acids. Ren. Fail. 2011, 33, 819–823. [Google Scholar] [CrossRef] [PubMed]
- Yoshimoto-Furuie, K.; Yoshimoto, K.; Tanaka, T.; Saima, S.; Kikuchi, Y.; Shay, J.; Horrobin, D.; Echizen, H. Effects of oral supplementation with evening primrose oil for six weeks on plasma essential fatty acids and uremic skin symptoms in hemodialysis patients. Nephron 1999, 81, 151–159. [Google Scholar] [CrossRef] [PubMed]
- Zabel, R.; Ash, S.; King, N.; Naslund, E.; Bauer, J. Gender differences in the effect of fish oil on appetite, inflammation and nutritional status in haemodialysis patients. J. Hum. Nutr. Diet. 2010, 23, 416–425. [Google Scholar] [CrossRef] [PubMed]
- Saifullah, A.; Watkins, B.A.; Saha, C.; Li, Y.; Moe, S.M.; Friedman, A.N. Oral fish oil supplementation raises blood omega-3 levels and lowers c-reactive protein in haemodialysis patients—A pilot study. Nephrol. Dial. Transpl. 2007, 22, 3561–3567. [Google Scholar] [CrossRef] [PubMed]
- Ratnayake, W.N.; Galli, C. Fat and fatty acid terminology, methods of analysis and fat digestion and metabolism: A background review paper. Ann. Nutr. Metab. 2009, 55, 8–43. [Google Scholar] [CrossRef] [PubMed]
- Micha, R.; Khatibzadeh, S.; Shi, P.; Fahimi, S.; Lim, S.; Andrews, K.G.; Engell, R.E.; Powles, J.; Ezzati, M.; Mozaffarian, D. Global, regional, and national consumption levels of dietary fats and oils in 1990 and 2010: A systematic analysis including 266 country-specific nutrition surveys. BMJ 2014, 348, g2272. [Google Scholar] [CrossRef] [PubMed] [Green Version]
- Khor, B.-H.; Narayanan, S.S.; Sahathevan, S.; Gafor, A.H.A.; Daud, Z.A.M.; Khosla, P.; Sabatino, A.; Fiaccadori, E.; Chinna, K.; Karupaiah, T. Efficacy of nutritional interventions on inflammatory markers in haemodialysis patients: A systematic review and limited meta-analysis. Nutrients 2018, 10, 397. [Google Scholar] [CrossRef] [PubMed]
- Bazeley, J.; Bieber, B.; Li, Y.; Morgenstern, H.; de Sequera, P.; Combe, C.; Yamamoto, H.; Gallagher, M.; Port, F.K.; Robinson, B.M. C-reactive protein and prediction of 1-year mortality in prevalent hemodialysis patients. Clin. J. Am. Soc. Nephrol. 2011, 6, 2452–2461. [Google Scholar] [CrossRef] [PubMed]
- Friedman, A.N.; Siddiqui, R.; Watkins, B.A. Acute rise of omega-3 polyunsaturated fatty acids during hemodialysis treatment. J. Ren. Nutr. 2008, 18, 301–303. [Google Scholar] [CrossRef] [PubMed]
- Chen, D.; Chen, H.; Chen, L.; Vaziri, N.D.; Wang, M.; Li, X.; Zhao, Y. The link between phenotype and fatty acid metabolism in advanced chronic kidney disease. Nephrol. Dial. Transpl. 2017, 32, 1154–1166. [Google Scholar] [CrossRef] [PubMed]
- Oberg, B.P.; McMenamin, E.; Lucas, F.L.; McMonagle, E.; Morrow, J.; Ikizler, T.A.; Himmelfarb, J. Increased prevalence of oxidant stress and inflammation in patients with moderate to severe chronic kidney disease. Kidney Int. 2004, 65, 1009–1016. [Google Scholar] [CrossRef] [PubMed]
- Ayala, A.; Muñoz, M.F.; Argüelles, S. Lipid peroxidation: Production, metabolism, and signaling mechanisms of malondialdehyde and 4-hydroxy-2-nonenal. Oxid. Med. Cell. Longev. 2014, 2014. [Google Scholar] [CrossRef] [PubMed]
- Carrero, J.J.; Aguilera, A.; Stenvinkel, P.; Gil, F.; Selgas, R.; Lindholm, B. Appetite disorders in uremia. J. Ren. Nutr. 2008, 18, 107–113. [Google Scholar] [CrossRef] [PubMed]
- Roach, L.A.; Lambert, K.; Holt, J.L.; Meyer, B.J. Diet quality in patients with end-stage kidney disease undergoing dialysis. J. Ren. Care 2017, 43, 226–234. [Google Scholar] [CrossRef] [PubMed] [Green Version]
- Baker, E.J.; Miles, E.A.; Burdge, G.C.; Yaqoob, P.; Calder, P.C. Metabolism and functional effects of plant-derived omega-3 fatty acids in human. Prog. Lipid Res. 2016, 64, 30–56. [Google Scholar] [CrossRef] [PubMed]
- Paganelli, F.; Maixent, J.-M.; Duran, M.-J.; Parhizgar, R.; Pieroni, G.; Sennoune, S. Altered erythrocyte n-3 fatty acids in mediterranean patients with coronary artery disease. Int. J. Cardiol. 2001, 78, 27–32. [Google Scholar] [CrossRef]
- Adragao, T.; Pires, A.; Lucas, C.; Birne, R.; Magalhaes, L.; Goncalves, M.; Negrao, A.P. A simple vascular calcification score predicts cardiovascular risk in haemodialysis patients. Nephrol. Dial. Transpl. 2004, 19, 1480–1488. [Google Scholar] [CrossRef] [PubMed] [Green Version]
- Eilander, A.; Harika, R.K.; Zock, P.L. Intake and sources of dietary fatty acids in Europe: Are current population intakes of fats aligned with dietary recommendations? Eur. J. Lipid Sci. Technol. 2015, 117, 1370–1377. [Google Scholar] [CrossRef] [PubMed] [Green Version]
- King, I.B.; Lemaitre, R.N.; Kestin, M. Effect of a low-fat diet on fatty acid composition in red cells, plasma phospholipids, and cholesterol esters: Investigation of a biomarker of total fat intake. Am. J. Clin. Nutr. 2006, 83, 227–236. [Google Scholar] [CrossRef] [PubMed]
- Endo, J.; Arita, M. Cardioprotective mechanism of omega-3 polyunsaturated fatty acids. J. Cardiol. 2016, 67, 22–27. [Google Scholar] [CrossRef] [PubMed]
- Serhan, C.N. Resolution phase of inflammation: Novel endogenous anti-inflammatory and proresolving lipid mediators and pathways. Annu. Rev. Immunol. 2007, 25, 101–137. [Google Scholar] [CrossRef] [PubMed]
- Muka, T.; Kiefte-de Jong, J.C.; Hofman, A.; Dehghan, A.; Rivadeneira, F.; Franco, O.H. Polyunsaturated fatty acids and serum C-reactive protein: The Rotterdam study. Am. J. Epidemiol. 2015, 181, 846–856. [Google Scholar] [CrossRef] [PubMed]
- Virtanen, J.K.; Mursu, J.; Voutilainen, S.; Tuomainen, T.-P. The associations of serum n-6 polyunsaturated fatty acids with serum C-reactive protein in men: The Kuopio Ischaemic Heart Disease Risk Factor Study. Eur. J. Clin. Nutr. 2018, 72, 342–348. [Google Scholar] [CrossRef] [PubMed]
- Su, H.; Liu, R.; Chang, M.; Huang, J.; Wang, X. Dietary linoleic acid intake and blood inflammatory markers: A systematic review and meta-analysis of randomized controlled trials. Food Funct. 2017, 8, 3091–3103. [Google Scholar] [CrossRef] [PubMed]
- Fokkema, M.; Smit, E.; Martini, I.; Woltil, H.; Boersma, E.; Muskiet, F. Assessment of essential fatty acid and ω3-fatty acid status by measurement of erythrocyte 20:3ω9 (mead acid), 22:5ω6/20:4ω6 and 22:5ω6/22:6ω3. Prostaglandins Leukot. Essent. Fatty Acids 2002, 67, 345–356. [Google Scholar] [CrossRef] [PubMed]


| Author (year) | Country | n | Mean Age (year) | Gender (M/F) | Dialysis | Dialysis Vintage (month) | Study Type | Blood Fraction | Instrumentation |
|---|---|---|---|---|---|---|---|---|---|
| An (2009) [28] | Korea | 29 | 59.5 | 15/14 | HD, PD | 43.6 | CS | Erythrocyte | GC |
| An (2011) [29] | Korea | 73 | 57.3 | 44/29 | HD, PD | 72.3 | CS | Erythrocyte | GC |
| An (2012) [30] | Korea | 14 | 52.1 | 7/7 | PD | 46.9 | INT | Erythrocyte | GC |
| An (2012) [31] | Korea | 43 | 57.4 | 20/23 | HD, PD | 46.5 | INT | Erythrocyte | GC |
| Begum (2004) [32] | USA | 22 | 55.8 | 13/9 | HD | 63.7 | INT | Erythrocyte | GLC |
| Dasgupta (1990) [18] | USA | 9 | 46.0 | 3/6 | HD | 72.0 | CS | Total plasma | GC-MS |
| de Fijter (1995) [33] | NL | 32 | N/A | N/A | N/A | N/A | INT | PL | GC-FID |
| de Gomez Dumm (2001) [34] | Argentina | 10 | 33.3 | 6/4 | HD | 60 | PC | Total plasma | GLC-FID |
| de Mattos (2017) [35] | Brazil | 88 | 52.0 | 57/31 | HD | 54.4 | INT | Total serum | GC |
| Delarue (2008) [36] | France | 8 | 62.0 | 6/2 | HD | ≥ 6 | INT | TAG | GC |
| Delmas-Beauvieux (1995) [37] | France | 40 | 58.1 | 19/21 | HD | ≥ 6 | CS | Erythrocyte | GC |
| Dessi (2014) [38] | Italy | 99 | 69.3 | 59/40 | HD | 65.8 | CS | PL, Erythrocyte | GC-MS |
| Esaki (2017) [39] | Japan | 10 | 74.7 | 7/3 | HD | 100.8 | INT | Total serum | N/A |
| Friedman (2006) [26,40] | USA | 75 | 53.8 | 48/27 | HD | N/A | CS | Total plasma, erythrocyte | GC-FID |
| Friedman (2012) [23,24,41] | USA | 400 | 66.4 | 232/ 168 | HD | N/A | CS | Total serum, PL, TAG & CE | GC-FID |
| Friedman (2016) [42] | USA | 20 | 55.0 | 11/9 | HD | 96.0 | CS | PL | GC |
| Girelli (1992) [43] | Italy | 32 | 61.9 | 16/16 | HD, PD | 42.0 | CS | Erythrocyte | GC |
| Hamazaki (1984) [44] | Japan | 12 | N/A | 3/9 | HD | 31.0 | INT | Total plasma | GC |
| Hamazaki (2011) [25,45] | Japan | 176 | 64.1 | 96/80 | HD | 92.4 | PC | Erythrocyte | GC |
| Holler (1995) [46] | Austria | 26 | 48.2 | 14/12 | PD | N/A | CS | Total serum | GC |
| Huang (2012) [27,47] | Sweden | 222 | 57.0 | 135/87 | HD, PD | 12.0 | PC | PL | GLC |
| Kim (2013) [48] | Korea | 61 | 56.0 | 44/17 | HD, PD | 48.1 | CS | Erythrocyte | GC |
| Koorts (2002) [49] | S. Africa | 14 | 37.3 | 9/5 | HD | 69.9 | CS | Erythrocyte | GLC-FID |
| Lee (2015) [50] | Korea | 15 | 62.1 | 5/10 | HD | ≥ 6 | INT | Erythrocyte | GC |
| Madsen (2011) [51] | Denmark | 44 | 63 | 29/15 | HD | 30.0 | CS | PL | GC-FID |
| Marangoni (1992) [52] | Italy | 18 | 48.7 | 10/8 | HD | ≥ 6 | CS | TAG, CE, PL | GLC |
| Nakamura (2008) [53] | Japan | 17 | 57.0 | N/A | HD | N/A | CS | Total plasma | GC |
| Oh (2012) [54] | Korea | 68 | 56.4 | 27/41 | HD, PD | 49.0 | CS | Erythrocyte | GC |
| Pazda (2017) [55] | Poland | 28 | 50.7 | 15/13 | PD | N/A | CS | Total serum | GC-FID |
| Peck (1996) [56] | USA | 25 | 49.8 | 13/12 | HD | N/A | INT | Total plasma | GC |
| Perunicic-Pekovic (2007) [57] | Serbia | 35 | N/A | N/A | HD | N/A | INT | Erythrocyte | GLC |
| Peuchant (1988) [58] | France | 22 | N/A | N/A | HD | 78.0 | CS | Erythrocyte | GC-FID |
| Peuchant (1994) [59] | France | 14 | 51.0 | 5/9 | HD | 96.0 | CS | Total plasma, erythrocyte | GLC |
| Ristic (2006) [60] | Serbia | 37 | 52.0 | 21/16 | HD | 72.0 | CS | PL, erythrocyte | GC |
| Ristic-Medic (2014) [61] | Serbia | 30 | 55.0 | 18/12 | HD | 57.1 | INT | PL | GC |
| Sertoglu (2014) [62] | Turkey | 40 | 58.0 | 21/19 | HD | N/A | CS | Total plasma, erythrocyte | GC-FID |
| Shoji (2013) [63] | Japan | 517 | 61.0 | 325/ 192 | HD | 110.4 | PC | Total serum | GC |
| Sikorska-Wisiewska (2017) [64] | Poland | 33 | 55.8 | 18/15 | HD, PD | 12.2 | CS | Total serum | GC-EI-MS |
| Son (2012) [65] | Korea | 31 | 56.2 | 10/21 | HD | 46.1 | CS | Erythrocyte | GC |
| Svensson (2006) [66] | Denmark | 206 | 67.0 | 133/73 | HD | 44.0 | INT | PL | GC-FID |
| Taccone-Galluci (1989) [67] | Italy | 10 | N/A | 6/4 | HD | 27.0 | CS | Total serum | GC |
| Talwalker (1980) [68] | USA | 10 | 49.0 | 10/0 | N/A | N/A | CS | TAG & CE, PL | GLC |
| Tsuzuki (2000) [69] | Japan | 20 | 55.6 | 11/9 | HD | 80.4 | CS | Erythrocyte | GC-MS |
| Umemoto (2016) [70] | Japan | 367 | 66.0 | 237/130 | HD | 109.2 | CS | Total serum | GC |
| Westhuyzen (2003) [71] | Australia | 12 | 69.2 | 7/5 | HD | N/A | INT | Erythrocyte | GC-FID |
| Yerlikaya (2011) [72] | Turkey | 51 | 47.8 | 21/30 | PD | 65.4 | CS | Total plasma | GC-MS |
| Yoshimoto-Furuie (1999) [73] | Japan | 16 | 52.7 | 6/10 | HD | 62.4 | INT | TAG, CE, PL | GC |
| Zabel (2010) [74] | Australia | 28 | 61.0 | 14/14 | HD | 19.5 | INT | PL | GC |
| Author (year) | Country | 14:0 | 16:0 | 18:0 | Total SFA | 16:1n-7 | 18:1n-9 | Total MUFA | 18:2n-6 | 20:4n-6 | 22:4n-6 | Total n-6 PUFA | 18:3n-3 | 20:5n-3 | 22:5n-3 | 22:6n-3 | n-3 index | Total n-3 PUFA | Total PUFA | n-6/n-3 |
|---|---|---|---|---|---|---|---|---|---|---|---|---|---|---|---|---|---|---|---|---|
| Total Serum/Plasma | ||||||||||||||||||||
| Asia | ||||||||||||||||||||
| Hamazaki (1984) [44] | Japan | 22.7 | 5.0 | 3.5 | 22.6 | 31.5 | 3.8 | 1.1 | 1.2 | 1.9 | ||||||||||
| Nakamura (2008) [53] | Japan | 30.1 | 5.2 | 0.1 | 0.8 | 2.3 | 0.7 | 4.1 | ||||||||||||
| Esaki (2017) [39] | Japan | 21.9 | 5.9 | 25.7 | 27.4 | 5.8 | 1.0 | 1.1 | 2.9 | |||||||||||
| Shoji (2013) a,b [63] | Japan | 139 | 53 | 100 | ||||||||||||||||
| Umemoto (2016) a,b [70] | Japan | 149 | 173 | 60 | 100 | 165 | ||||||||||||||
| Yerlikaya (2011) [72] | Turkey | 0.7 | 21.6 | 8.1 | 34.5 | 1.5 | 9.2 | 27.5 | 23.7 | 4.6 | 28.6 | 0.7 | 0.9 | 2.6 | 38.0 | 19.5 | ||||
| Sertoglu (2014) a [62] | Turkey | 48 | 308 | 104 | 26 | 357 | 495 | 115 | 634 | 6 | 15 | 20 | ||||||||
| Europe | ||||||||||||||||||||
| Taccone-Galluci (1989) [67] | Italy | 1.3 | 21.6 | 8.0 | 2.1 | 29.9 | 20.6 | 7.3 | 0.6 | 0.6 | 0.9 | 2.6 | ||||||||
| Peuchant (1994) [59] | France | 1.3 | 26.0 | 11.3 | 22.3 | 24.2 | 7.7 | 0.6 | 0.9 | 2.6 | ||||||||||
| Holler (1996) [46] | Austria | 6.1 | 0.4 | |||||||||||||||||
| Pazda (2017) [55] | Poland | 1.0 | 23.4 | 7.1 | 32.5 | 2.8 | 29.1 | 32.7 | 23.2 | 5.4 | 0.1 | 29.9 | 0.3 | 0.8 | 0.4 | 1.5 | 3.1 | |||
| Sikorska-Wisiewska (2017) [64] | Poland | 26.3 | 3.8 | 4.0 | 0.2 | 0.5 | 1.2 | 3.4 | ||||||||||||
| 28.4 | 3.7 | 3.9 | 0.2 | 0.6 | 1.1 | 3.6 | ||||||||||||||
| North America | ||||||||||||||||||||
| Dasgupta (1990) [18] | USA | 2.5 | 21.9 | 14.3 | 4.7 | 15.4 | 26.6 | 6.0 | 0.2 | 0.7 | 2.1 | |||||||||
| Peck (1996) [56] | USA | 20.0 | 28.0 | 5.7 | 0.6 | 0.5 | ||||||||||||||
| Friedman (2006) [40] | USA | 0.6 | 19.8 | 7.6 | 28.4 | 1.4 | 23.6 | 27.3 | 26.7 | 8.4 | 0.3 | 0.7 | 0.4 | 0.4 | 1.3 | 1.7 | 40.4 | |||
| Friedman (2012) b [41] | USA | 20.2 | 6.8 | 28.0 | 2.3 | 23.9 | 28.2 | 28.3 | 7.5 | 0.5 | 0.3 | 0.4 | 1.3 | 40.9 | ||||||
| South America | ||||||||||||||||||||
| de Gomez Dumm (2001) [34] | Argentina | 19.4 | 6.4 | 3.1 | 24.3 | 31.9 | 7.5 | 0.9 | 0.6 | 0.6 | 1.4 | |||||||||
| de Mattos (2017) [35] | Brazil | 5.6 | 0.7 | 0.6 | 0.6 | |||||||||||||||
| Triacylglycerol | ||||||||||||||||||||
| Asia | ||||||||||||||||||||
| Yoshimoto-Furuie (1999) [73] | Japan | 23.6 | 1.6 | 2.1 | 1.2 | 3.8 | ||||||||||||||
| Europe | ||||||||||||||||||||
| Marangoni (1992) [52] | Italy | 31.0 | 5.0 | 4.0 | 45.0 | 12.0 | 1.0 | |||||||||||||
| Delarue (2008) a [36] | France | 8 | 10 | |||||||||||||||||
| North America | ||||||||||||||||||||
| Talwalker (1980) [68] | USA | 3.4 | 38.9 | 7.1 | 3.8 | 38.8 | 0.8 | 0.9 | ||||||||||||
| Cholesteryl Esters | ||||||||||||||||||||
| Asia | ||||||||||||||||||||
| Yoshimoto-Furuie (1999) [73] | Japan | 51.0 | 6.0 | 0.6 | 2.9 | 1.7 | ||||||||||||||
| Europe | ||||||||||||||||||||
| Marangoni (1992) [52] | Italy | 15.0 | 2.0 | 5.0 | 26.0 | 45.0 | 6.0 | |||||||||||||
| North America | ||||||||||||||||||||
| Talwalker (1980) [68] | USA | 3.7 | 30.6 | 4.8 | 6.3 | 32.2 | 2.9 | 5.1 | ||||||||||||
| Triacylglycerol and Cholesteryl Esters | ||||||||||||||||||||
| Friedman (2012) b [41] | USA | 17.8 | 4.4 | 22.4 | 2.4 | 28.1 | 32.8 | 33.3 | 5.1 | 0 | 0 | 0 | 0 | 39.3 | ||||||
| Phospholipids | ||||||||||||||||||||
| Asia | ||||||||||||||||||||
| Yoshimoto-Furuie (1999) [73] | Japan | 23.1 | 9.1 | 0.3 | 0.4 | 3.1 | 1.1 | 7.6 | ||||||||||||
| Australia | ||||||||||||||||||||
| Zabel (2010) [74] | Australia | 10.3 | 1.1 | 4.1 | ||||||||||||||||
| Europe | ||||||||||||||||||||
| Marangoni (1992) [52] | Italy | 37.0 | 15.0 | 1.0 | 13.0 | 13.0 | 8.0 | |||||||||||||
| Dessi (2014) a [38] | Italy | 408 | 133 | 5 | 9 | 49 | ||||||||||||||
| de Fijter (1995) [33] | NL | 4.3 | ||||||||||||||||||
| Svensson (2006) [66] | Denmark | 1.5 | 4.0 | |||||||||||||||||
| Madsen (2011) [51] | Denmark | 9.7 | 1.6 | 1.1 | 4.1 | |||||||||||||||
| Ristic (2006) b [60] | Serbia | 28.1 | 15.7 | 43.8 | 0.4 | 13.1 | 13.5 | 25.5 | 11.1 | 0.4 | 39.0 | 0.3 | 0.5 | 3.0 | 3.8 | 9.6 | ||||
| Ristic-Medic (2014) [61] | Serbia | 25.3 | 16.4 | 41.8 | 0.4 | 13.8 | 14.6 | 24.5 | 11.6 | 0.6 | 39.3 | 0.1 | 0.2 | 0.5 | 2.8 | 3.5 | 42.7 | 11.3 | ||
| Huang (2012) [27,47] | Sweden | 30.4 | 14.5 | 0.5 | 13.7 | 19.7 | 9.2 | 0.3 | 1.6 | 1.2 | 4.9 | 39.9 | ||||||||
| North America | ||||||||||||||||||||
| Talwalker (1980) [68] | USA | 2.9 | 44.4 | 21.7 | 3.0 | 18.0 | 1.8 | 1.2 | ||||||||||||
| Friedman (2012) b [41] | USA | 22.6 | 17.6 | 40.9 | 2.4 | 15.6 | 19.1 | 18.7 | 10.5 | 0.3 | 0.3 | 0.8 | 2.8 | 36.9 | ||||||
| Friedman (2016) [42] | USA | 19.2 | 13.5 | 0.4 | 2.4 | |||||||||||||||
| Erythrocytes | ||||||||||||||||||||
| Asia | ||||||||||||||||||||
| Tsuzuki (2000) [69] | Japan | 54.0 | 19.2 | 8.5 | 1.6 | 1.2 | 4.9 | 26.8 | ||||||||||||
| Hamazaki (2011) [45] | Japan | 26.8 | 15.0 | 0.4 | 13.4 | 9.1 | 11.6 | 2.0 | 2.5 | 7.7 | 2.0 | |||||||||
| An (2009) [28] | Korea | 0.2 | 22.6 | 16.4 | 39.2 | 0.6 | 12.8 | 14.0 | 11.9 | 14.7 | 1.5 | 29.8 | 0.3 | 3.1 | 3.1 | 10.2 | 13.3 | 16.7 | 46.3 | 1.9 |
| 0.3 | 23.2 | 15.8 | 39.4 | 0.9 | 14.5 | 16.0 | 10.5 | 14.7 | 1.5 | 28.4 | 0.3 | 3.0 | 2.7 | 9.8 | 12.8 | 15.9 | 44.3 | 1.9 | ||
| An (2011) [29] | Korea | 14.7 | 29.8 | 0.3 | 3.1 | 3.1 | 10.2 | 16.7 | ||||||||||||
| 14.7 | 28.4 | 0.3 | 3.0 | 2.7 | 9.8 | 15.9 | ||||||||||||||
| An (2012) [30] | Korea | 0.7 | 23.5 | 11.5 | 35.7 | 1.2 | 17.1 | 18.5 | 18.6 | 12.0 | 33.5 | 0.7 | 1.7 | 7.1 | 8.9 | 11.1 | 44.7 | 3.1 | ||
| An (2012) [31] | Korea | 0.6 | 28.0 | 17.2 | 46.0 | 2.1 | 16.8 | 19.5 | 13.0 | 10.2 | 26.0 | 0.5 | 1.3 | 2.9 | 4.0 | 5.4 | 31.5 | 6.2 | ||
| Oh (2012) [54] | Korea | 0.7 | 23.8 | 12.1 | 36.8 | 1.4 | 16.9 | 18.7 | 18.1 | 11.1 | 31.9 | 0.6 | 2.0 | 1.5 | 6.6 | 8.6 | 10.7 | 42.7 | 3.4 | |
| Son (2012) [65] | Korea | 0.6 | 23.3 | 12.2 | 36.3 | 1.0 | 16.2 | 17.6 | 18.5 | 11.4 | 1.2 | 32.6 | 0.5 | 2.1 | 1.7 | 7.3 | 9.4 | 11.7 | 44.3 | |
| Kim (2013) [48] | Korea | 16.1 | 17.6 | |||||||||||||||||
| 17.7 | 19.7 | |||||||||||||||||||
| Lee (2015) [50] | Korea | 0.5 | 25.6 | 19.4 | 46.0 | 0.7 | 15.9 | 17.6 | 9.8 | 10.6 | 24.6 | 0.3 | 1.4 | 6.7 | 8.1 | 10.6 | 35.2 | 2.8 | ||
| Sertoglu (2014) a [62] | Turkey | 33 | 22 | 51 | 8 | 30 | 35 | 42 | 83 | 3 | 5 | 6 | ||||||||
| Australia | ||||||||||||||||||||
| Westhuyzen (2003) [71] | Australia | 22.8 | 16.9 | 43.8 | 15.5 | 19.5 | 8.6 | 16.7 | 3.3 | 0.8 | 7.3 | 36.7 | ||||||||
| Europe | ||||||||||||||||||||
| Girelli (1992) [43] | Italy | 21.5 | 16.7 | 44.4 | 15.5 | 16.0 | 8.4 | 23.5 | 6.8 | 39.3 | ||||||||||
| 21.7 | 17.1 | 46.4 | 17.4 | 17.9 | 8.4 | 19.8 | 6.4 | 35.4 | ||||||||||||
| Dessi (2014) a [38] | Italy | 117 | 145 | 0.2 | 3 | 45 | ||||||||||||||
| Peuchant (1988) [58] | France | 0.8 | 29.4 | 23.0 | 13.4 | 7.9 | 11.7 | 2.1 | 0.5 | 3.2 | ||||||||||
| Peuchant (1994) [59] | France | 0.8 | 25.7 | 22.6 | 13.4 | 9.5 | 13.8 | 2.7 | 2.7 | 4.1 | ||||||||||
| Delmas-Beauvieux (1995) [37] | France | 12.5 | 11.9 | 2.3 | 1.6 | 4.8 | ||||||||||||||
| Ristic (2006) [60] | Serbia | 21.6 | 19.3 | 40.9 | 17.9 | 17.9 | 14.8 | 15.3 | 3.5 | 34.9 | 0.2 | 1.2 | 4.3 | 6.0 | 5.9 | |||||
| Perunicic-Pekovic (2007) [57] | Serbia | 7.4 | 0.2 | 0.6 | 2.0 | |||||||||||||||
| Africa | ||||||||||||||||||||
| Koorts (2002) [49] | South Africa | 0.3 | 22.3 | 17.4 | 45.9 | 0.2 | 13.3 | 16.9 | 10.4 | 14.8 | 3.9 | 31.7 | 0.2 | 0.2 | 1.4 | 3.7 | 5.6 | 37.2 | 5.8 | |
| North America | ||||||||||||||||||||
| Begum (2004) [32] | USA | 30.3 | 24.5 | 23.4 | 9.0 | 6.9 | 1.8 | 18.9 | 0.2 | 0.1 | 0.6 | 1.8 | 2.7 | |||||||
| Friedman (2006) [26,40] | USA | 0.1 | 15.0 | 15.7 | 31.2 | 0.2 | 13.9 | 11.2 | 9.4 | 17.7 | 5.2 | 0.03 | 0.3 | 2.4 | 4.7 | 5.0 | 42.9 | |||
| Total Serum/Plasma | TAG/CE [68] | PL | Erythrocyte | |
|---|---|---|---|---|
| SFA | ||||
| 14:0 | ↔ [18,40,55,59,62,72] | ↔ | ↔ [68] | ↔ [49,54,58,59,62], ↓ [28,40] |
| 16:0 | ↔ [18,40,55,59,62,72], ↑ [34] | ↔ | ↔ [60,68] | ↔ [28,49,54,58,59,60,62], ↓ [40,71] |
| 18:0 | ↔ [18,34,40,55,62,72], ↓ [59] | ↔ | ↔ [60,68] | ↔ [28,40,49,58,60,62], ↑ [59,71], ↓ [54] |
| Total SFA | ↔ [40,55], ↑ [72] | ↔ | ↔ [60] | ↔ [28,49,60,71], ↓ [40,54], ↑ [69] |
| MUFA | ||||
| 16:1n-7 | ↔ [18,40,55,62,72], ↑ [34] | ↔ | ↔ [60,68] | ↓ [28,40,62], ↔ [49,54] |
| 18:1n-9 | ↑ [18,34,40,55,56,59,64], ↔ [62,72] | ↔ | ↑ [60], ↔ [68] | ↔ [40,58,60,62,71], ↑ [28,49,54], ↓ [59] |
| Total MUFA | ↑ [40,55,72] | ↔ | ↑ [60] | ↔ [40,60,69,71], ↑ [49,54], ↓ [28] |
| n-6 PUFA | ||||
| 18:2n-6 | ↓ [18,34,40,55,59,72], ↔ [56,62] | ↓ | ↔ [42,60], ↓ [38,68] | ↓ [38,40,62,69], ↔ [49,58,59,60,71], ↑ [28,54] |
| 20:4n-6 | ↓ [18,34,56,59,64,72], ↔ [40,46,55,62], ↑ [51,63] | ↔ | ↔ [60,68], ↓ [38], ↑ [42] | ↔ [49,54,58,60,62,71], ↑ [28,29,40,59], ↓ [38,57] |
| 22:4n-6 | ↔ [40,55,59], ↓ [34] | ↔ [60] | ↔ [49,58,59,60,71], ↓ [28,69], ↑ [40] | |
| Total n-6 PUFA | ↔ [62,72], ↓ [55,64] | ↓ [60] | ↑ [28,29,54], ↔ [60,62], ↓ [49] | |
| n-3 PUFA | ||||
| 18:3n-3 | ↔ [40,56], ↓ [18,55,64] | ↔ [38] | ↓ [28,29,38,40], ↔ [49], ↑ [54] | |
| 20:5n-3 | ↓ [34,46,51,56,64], ↔ [40,55,62,72], ↑ [63] | ↓ [38,42,60] | ↔ [28,29,38,40,54,58,62], ↓ [49,57,60,71] | |
| 22:5n-3 | ↔ [18,40,59], ↓ [34], ↑ [55] | ↔ [60] | ↔ [28,29,49,54,57,60], ↓ [69], ↑ [40,59] | |
| 22:6n-3 | ↓ [34,40,51,64,72], ↔ [18,59,62], ↑ [55,63] | ↔ [38,42], ↓ [60] | ↓ [38,54,57,60,62], ↔ [28,29,49,59,69,71], ↑ [40,58] | |
| n-3 Index | ↓ [40] | ↔ [38] | ↔ [28,38], ↑ [40], ↓ [54] | |
| Total n-3 PUFA | ↓ [64,72], ↔ [55,62] | ↓ [60] | ↔ [28,29,49,62], ↓ [54,60] | |
| Total PUFA | ↓ [40], ↔ [72] | ↓ [49,69], ↑ [28,40], ↔ [54,71] | ||
| n-6/n-3 | ↔ [40,72] | ↔ [60] | ↔ [28,49,60], ↓ [40], ↑ [54] |
| Author, Year | Country | n | Dialysis Vintage (month) | Follow Up (year) | Blood Fraction | FA of Interest | Endpoints (Events) † |
|---|---|---|---|---|---|---|---|
| Friedman, 2008 [26] | USA | 93 | N/A | 2.1 * | Erythrocyte | n-3 index | HR (95% CI) of death: Omega-3 index (below median, 4.69%): 2.48 (0.88–6.95), p = 0.085 |
| Hamazaki, 2011 [45] | Japan | 176 | 92.4 | 5 | Erythrocyte | DHA | HR (95% CI) for all-cause mortality: T3 (>8.1%) vs. T1 (<7.2%): 0.43 (0.21–0.88) |
| Huang, 2012 [47] | Sweden | 222 | 12 | 1.5 | PL | LA, ALA, MA LC n-3 | HR (95% CI) for all-cause mortality: LA: 0.89 (0.79–0.99) ALA: 0.89 (0.65–1.23) MA: 1.33 (1.17–1.52) LC n-3: 0.91 (0.72–1.16) |
| Friedman, 2013 [23] | USA | 400 | N/A | 1 | Total serum, PL | Total SFA, DPA | OR (95% CI) for sudden cardiac death: Total serum Total SFA: 1.01 (1.00–1.02), p = 0.0258 DPA: 0.70 (0.51–0.97), p = 0.0334 PL DPA: 0.82 (0.69–0.98) ‡, p = 0.0254 |
| Friedman, 2013 [24] | USA | 400 | N/A | 1 | PL | LC n-3 | OR (95% CI) for sudden cardiac death: Q4 (4.15–15.11%) vs. Q1 (1.27–3.07%): 0.20 (0.08–0.51), p = 0.001 |
| Shoji, 2013 [63] | Japan | 517 | 110.4 | 5 | Total serum | (EPA + DHA)/AA ratio | HR (95% CI) for CV events: Q1 (0.63–0.83) vs. Q4 (1.54–2.03): 1.92 (1.25–2.95), p = 0.005 |
| Terashima, 2014 [25] | Japan | 176 | 92.4 | 10 | Erythrocyte | DHA, OA | HR (95% CI) for all-cause mortality: DHA T3 (>8.1%) vs. T1 (<7.2%): 0.52 (0.30–0.91) OA T3 (>13.8%) vs. T1 (<13.3%): 0.46 (0.25–0.84) |
© 2018 by the authors. Licensee MDPI, Basel, Switzerland. This article is an open access article distributed under the terms and conditions of the Creative Commons Attribution (CC BY) license (http://creativecommons.org/licenses/by/4.0/).
Share and Cite
Khor, B.-H.; Narayanan, S.S.; Chinna, K.; Gafor, A.H.A.; Daud, Z.A.M.; Khosla, P.; Sundram, K.; Karupaiah, T. Blood Fatty Acid Status and Clinical Outcomes in Dialysis Patients: A Systematic Review. Nutrients 2018, 10, 1353. https://doi.org/10.3390/nu10101353
Khor B-H, Narayanan SS, Chinna K, Gafor AHA, Daud ZAM, Khosla P, Sundram K, Karupaiah T. Blood Fatty Acid Status and Clinical Outcomes in Dialysis Patients: A Systematic Review. Nutrients. 2018; 10(10):1353. https://doi.org/10.3390/nu10101353
Chicago/Turabian StyleKhor, Ban-Hock, Sreelakshmi Sankara Narayanan, Karuthan Chinna, Abdul Halim Abdul Gafor, Zulfitri Azuan Mat Daud, Pramod Khosla, Kalyana Sundram, and Tilakavati Karupaiah. 2018. "Blood Fatty Acid Status and Clinical Outcomes in Dialysis Patients: A Systematic Review" Nutrients 10, no. 10: 1353. https://doi.org/10.3390/nu10101353