1. Introduction
The detection and quantification of terrain and vegetation in detailed 3D point clouds has immensely advanced earth and ecological applications [
1]. In landslide research, new applications have been initiated, such as ‘detection and mapping’, ‘hazard assessment and monitoring’ and ‘modelling of landslides’ [
2]. Although major advances have been made on the mechanical behavior of landslides, ample attention
has not
been paid to the combined temporal effects that landslides have on land cover, topography and above ground biomass (AGB).
To explore and quantify these effects, temporal very high resolution (VHR) orthophotos and data derived from Light Detection and Ranging (LiDAR) technology are analyzed using an object-based image analysis (OBIA) approach. Studies on change analyses often use combinations of unique sensor characteristics for the optimization of classification results. Examples are combinations of remote sensing imagery from different sensors, for example high resolution with low resolution imagery, and spectral information with elevation information. Such data synergy using OBIA has successfully been applied to improve classification accuracy of land-cover change (LCC) alone [
3,
4,
5,
6], specifically for landslide detection capabilities [
7,
8,
9], and addressing only the monitoring capabilities of deep-seated landslides [
8,
9,
10], while few studies focus on combinations of these [
11]. OBIA generally outperforms pixel-based approaches in land-use change studies [
8], although hybrid approaches [
12,
13] may in some cases lead to higher accuracies. OBIA derives homogeneous image-objects with their corresponding radiometric and elevation characteristics [
14] and provides in-depth opportunities to analyze fine-scale effects of landslides on their surroundings. Data synergy results in homogeneous objects with similar elevation and spectral attributes and is considered highly effective for segmentation [
3,
15,
16].
Embedding detailed elevation data into the landscape change analysis also provides the opportunity to analyze changes in topography. LiDAR-based digital terrain model (DTM) and digital surface model (DSM) differencing [
17] may reveal detailed changes in topography of forested and non-forested parts of the landslide and may aid the interpretation of temporal landslide development and its relation to event-based loss of trees and terrain surface.
Although landslides are common processes, they may cause continuous or sudden changes in the topography and land cover. For foresters, especially the potential and actual loss of above ground biomass is a prime factor in the management of slopes that are vulnerable to landslides. Common applications in forestry mainly focus on forest structure [
3,
18,
19], the monitoring of forest canopy height [
4,
15,
20] or land cover classification [
21,
22,
23,
24]. Forest cover in a landslide-affected area can be quantified by applying tree specific allometric relations and tree metrics derived from multi-temporal LiDAR-based canopy height models [
25].
We present a robust object-based approach, integrating three aspects of landscape change; LCC, topographical and AGB in a single workflow in eCognition. The workflow uses data synergy and context-based classification to quantify and optimize landscape changes of an active deep-seated landslide near the village of Doren in Austria.
2. Materials and Methods
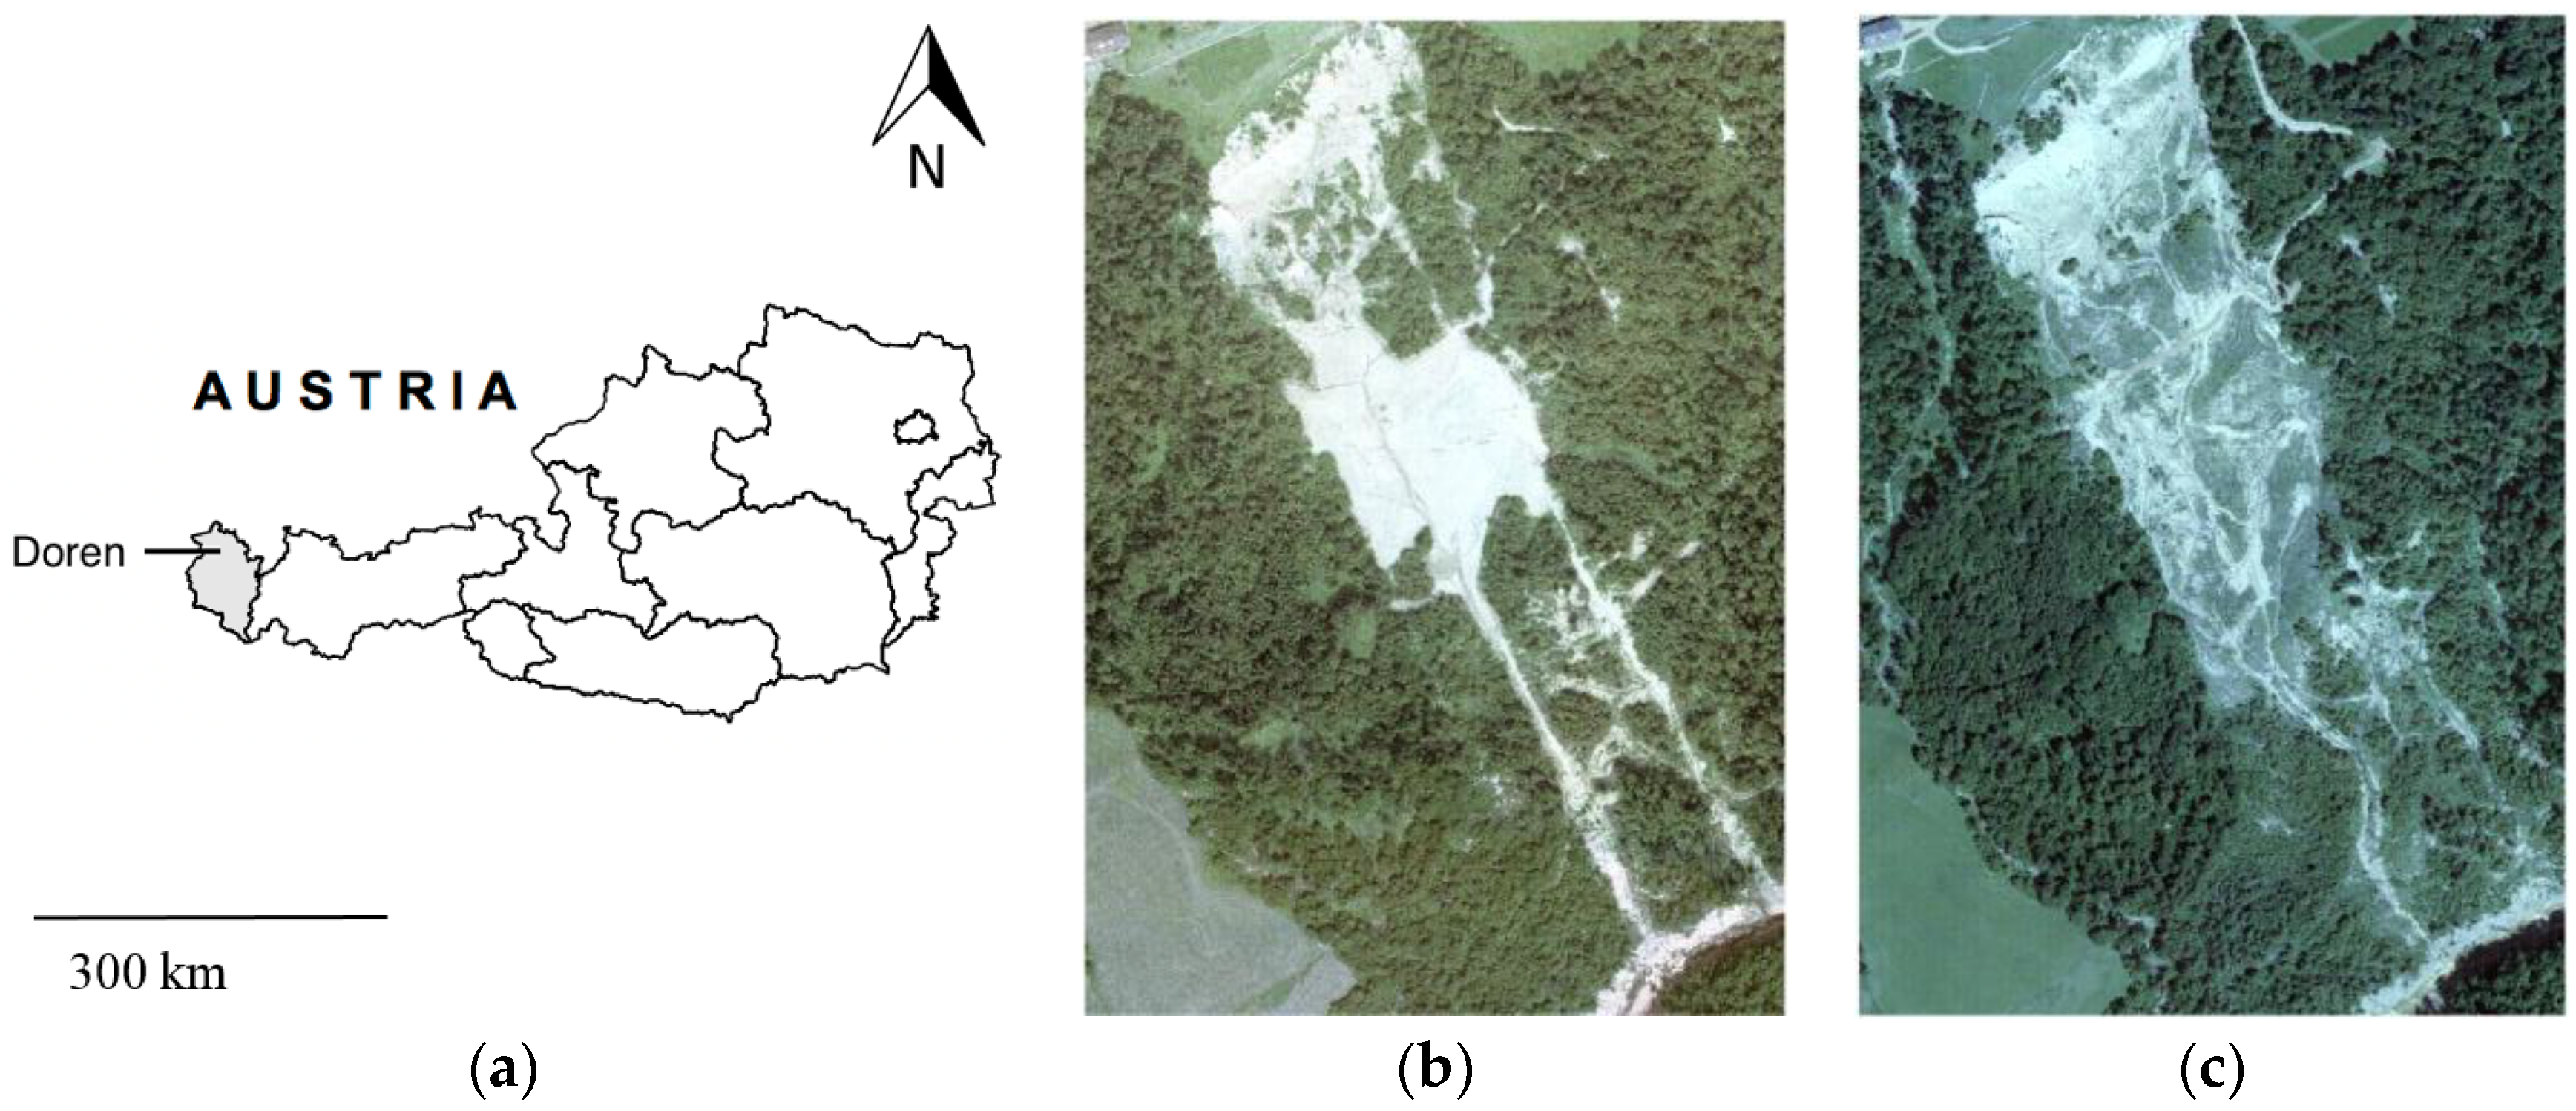
The landslide near Doren is located in the north of the province of Vorarlberg (
Figure 1) along the river Weißach and is historically active since 1847. Major landslide events occurred in 1927, 1935 and 1988, during which 2–3 × 10
6 m
3 was mobilized as rock- and soil slides, and debris flows. The deformation, movement direction and scarp stability of the landslide have been studied with multi-temporal terrestrial and airborne laser scanning and UAV flights since 2003 [
26,
27]. Ghuffar et al. [
26] evaluated the 3D motion of the Doren landslide using a range flow algorithm on airborne and terrestrial LiDAR. Landslide activity is closely related to the underlying geology, which is formed by a tilted sedimentary sequence of alternating Molasse marls, sandstone and conglomerates [
28]. In combination with a highly-fractured rock mass, groundwater can preferentially flow to potential failure planes, and thus reactivate the landslide. Another instability factor is that the underlying bedrock was glacially eroded during the last ice age and covered by 5–10 m of low-permeable subglacial till, which has partly been eroded by the Weißach River. The forest cover is dominated by Norway spruce and Beech with understory of shrubs, and many small open spots in between. Meadows, shrubs and infrastructure are present in the upper, stable low-angle slopes (
Figure 1).
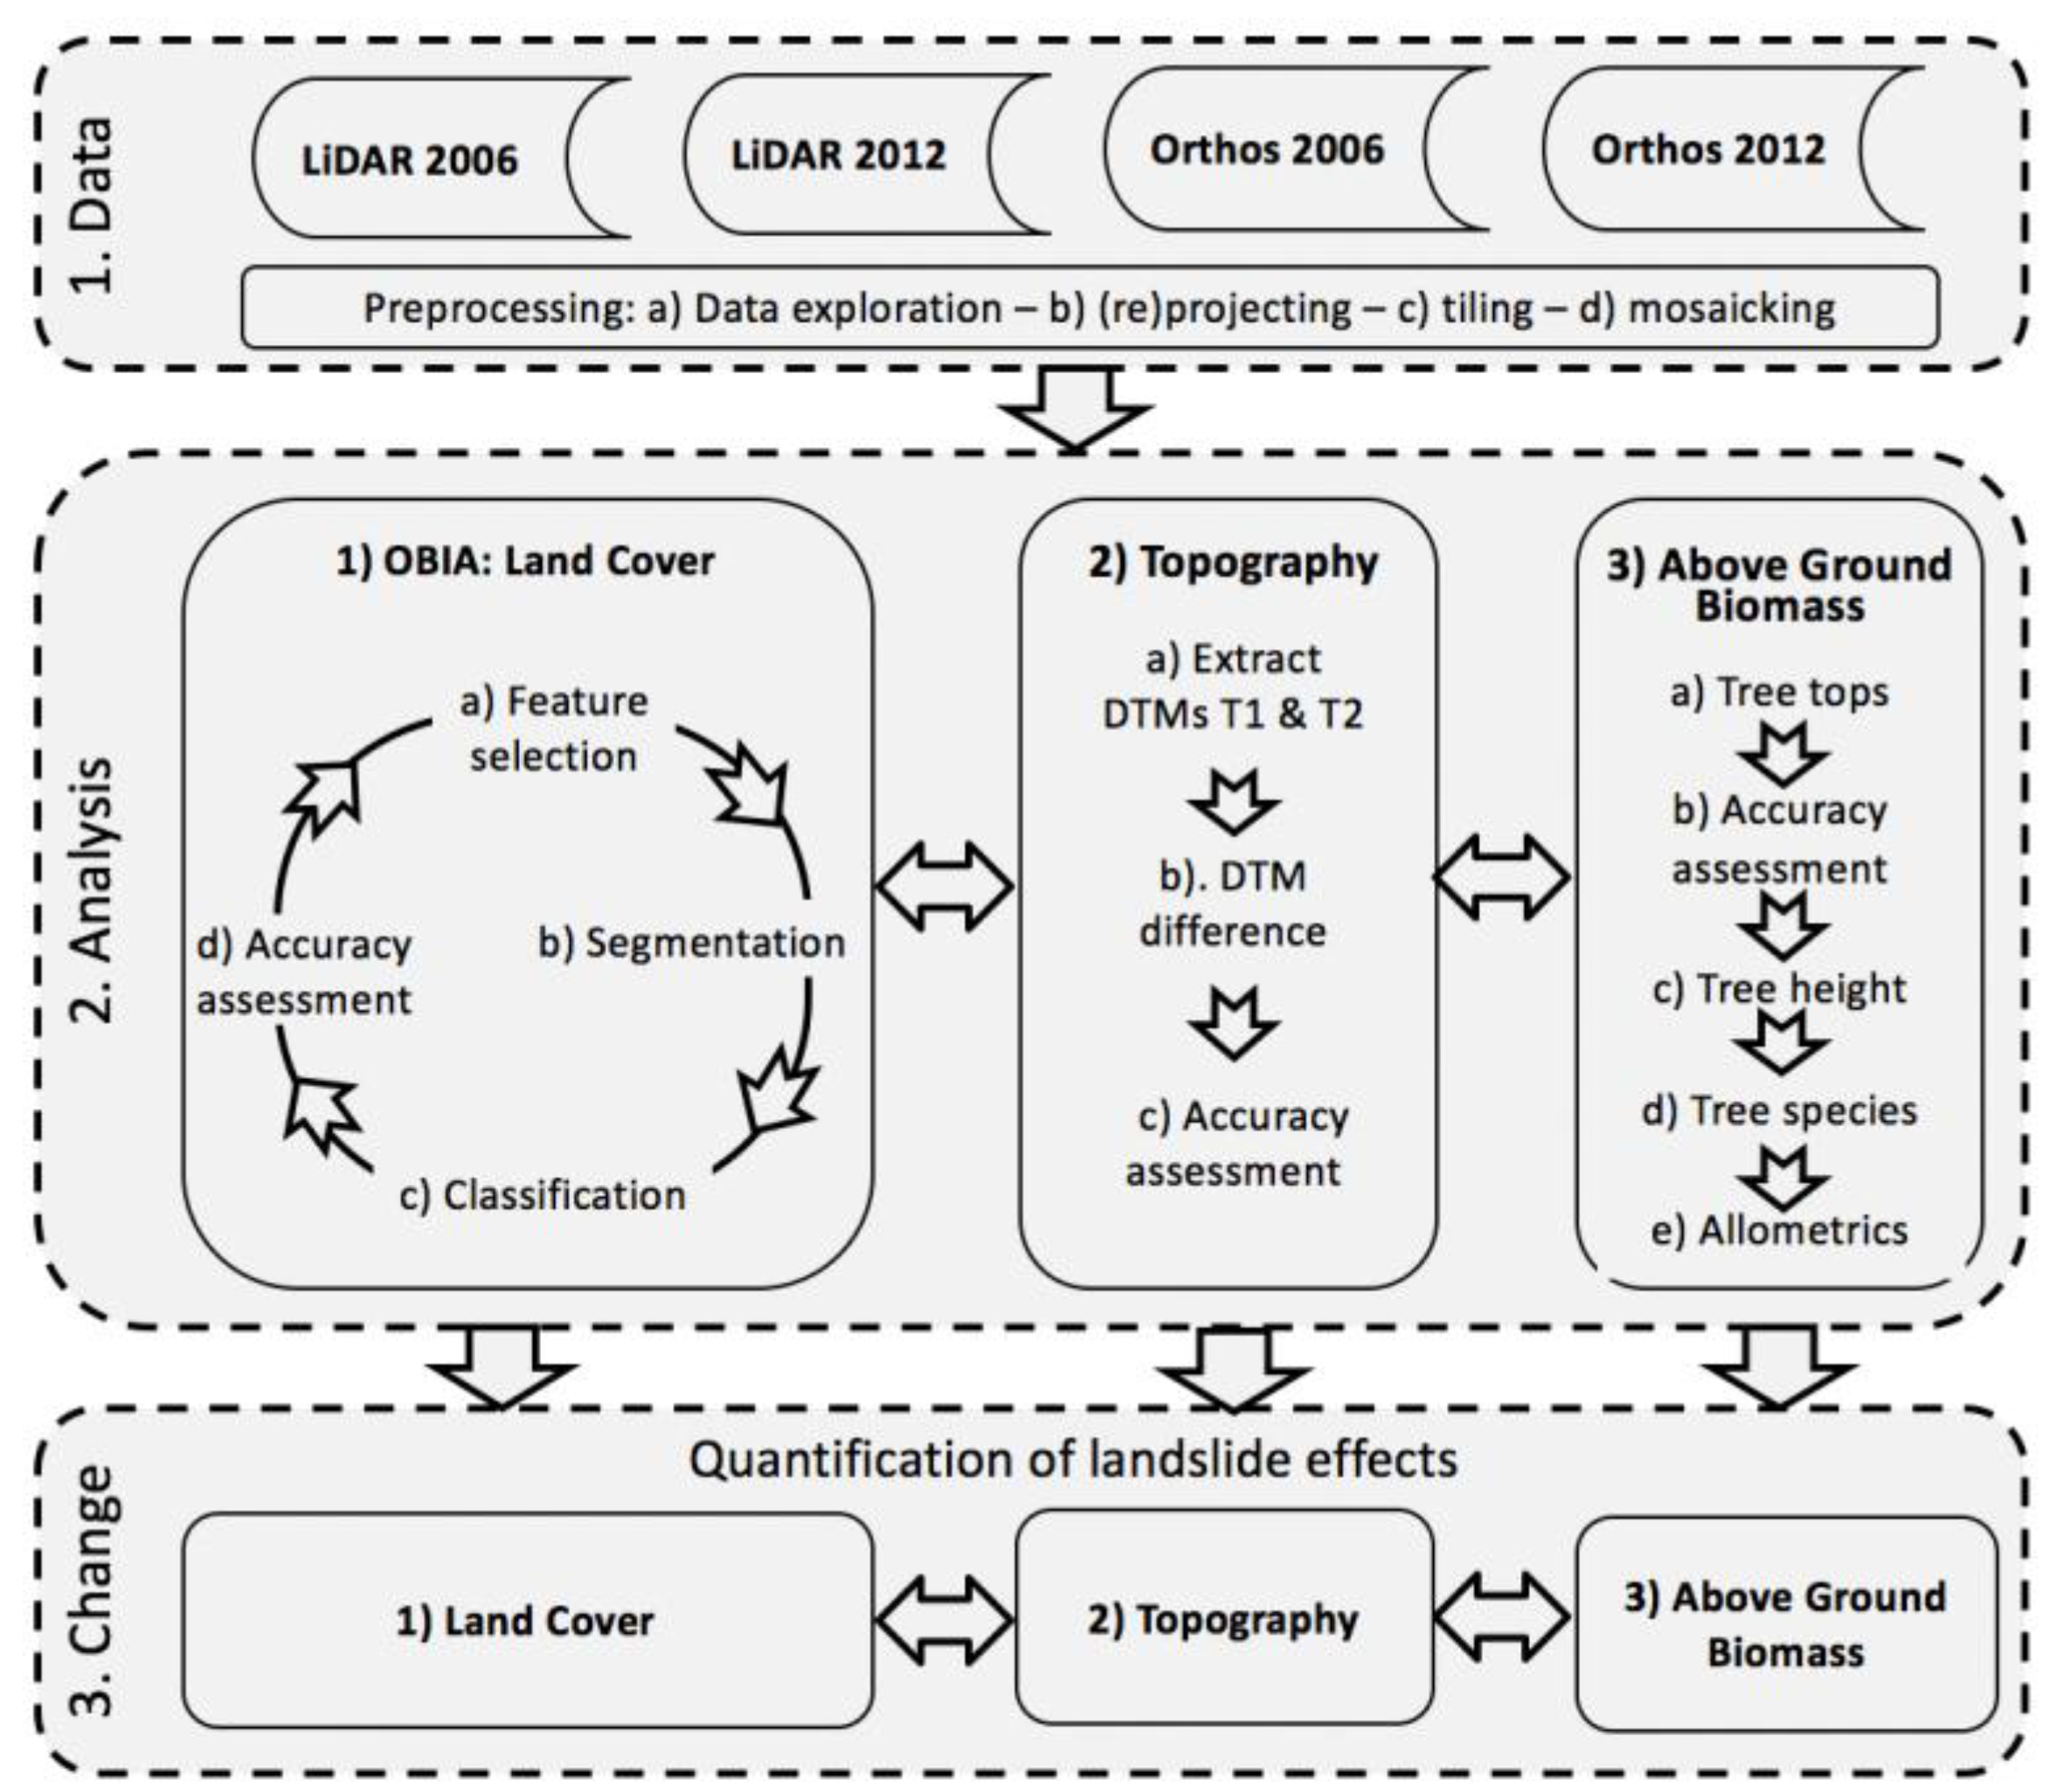
Figure 2 presents the workflow, that consists of three main sections; (1) Data, which includes data preprocessing, (2) Analysis and (3) Change. The Analysis and the Change sections consists of three procedures: (1) LCC, (2) Topography and (3) AGB, which have been subdivided into several sub-routines (a–e).
2.1. Data
Data of the study area were obtained from the ‘Land Vorarlberg’ and the ‘Landes-vermessungsamt Feldkirch’ via the VoGIS repository [
29]. In
Table 1 the metadata of the available true color orthophotos (TCO) and multiple return LiDAR input datasets are listed. Preprocessing of the LiDAR data was performed with the LAStools 1.4 (Rapidlasso GmbH Gilching Germany) extension for ArcGIS 10.3 to align the projection of all data into the local coordinate system of Austria (MGI Austria Lambert: EPSG Projection) and to interpolate the 2012 point-cloud LiDAR data into a DTM. The point cloud was filtered into ground elevation points and vegetation points using the maximum first return and minimum last return of the point cloud in eCognition 9.0. The vegetation points were then processed into a Canopy Height Model (CHM). The 2012 LiDAR data were downscaled to 1 m resolution, similar to 2006, to increase computational performance. Elevation differences measured from 50 fixed objects has shown that elevation differences as a result of data inaccuracy, remain below 30 cm. In an active large landslide, this is not considered as a major problem, because elevation differences may well exceed tens of meters between two time periods, which is the case in our study. In addition, an existing vegetation reference dataset available from the VoGIS repository [
29] was used to determine the percentages of coniferous and deciduous tree cover in the study area.
2.2. Analysis
2.2.1. OBIA: Land Cover
Feature selection (
Figure 2). Land-cover classes have been determined, based on their occurrence in the close surroundings of the landslide affected area, notably: bare soil, grass and shrub land, forest (Norway spruce and beech), water, road and buildings. Feature space optimization (FSO) is used to calculate the feature combinations with the highest separation distance [
30]. Two hundred samples per land-cover class were manually classified based on orthophoto recognition. FSO was applied to twelve features derived from either the orthophotos or the LiDAR data. These parameters are: the mean and standard deviation of the red (R), green (G) and blue (B) bands, mean green ratio (G/(R + G + B), mean greenness (1/G), mean brightness, mean CHM, mean length/width ratio and mean rectangular fit.
Segmentation (
Figure 2). To determine the optimal segmentation parameters, an iterative algorithm was developed that produces 125 unique parameter combinations using scale parameter of 10, 20, 30, 40 and 50, shape parameters of 0.1, 0.3, 0.5, 0.7 and 0.9 compactness parameters of 0.1, 0.3, 0.5, 0.7 and 0.9 comparable to the method of Clinton et al. [
31]. The resulting objects were then visually compared to the corresponding orthophotos, and evaluated for over-and under segmentation [
6]. Additionally, the local-variance based ESP2 tool developed by Drăguţ et al. [
32] was used. The smallest scale level determined by the ESP2 tool was 46 for the 2006 and 51 for 2012. Since the methods of Clinton et al. [
31] and Drăguţ et al. [
32] provided similar results, an average scale parameter of 50 was used. The shape and compactness parameters were selected at 0.3 and 0.5 respectively. Both the spectral information from the orthophotos and the LiDAR-derived canopy height model (CHM) were used as input data for segmentation.
Classification (
Figure 2). The classification consists of two subroutines: (1) a stratified membership classification based on the parameter thresholds obtained through FSO and (2) context-based improvements based on context, geometry, spectral and elevation characteristics. The membership thresholds were deliberately set to be conservative to optimize the workflows’ performance which works well in a diverse heterogeneous landscape such as a landslide. The context-based rulesets improve the classification accuracy after execution of the initial stratified membership-based classification. The context-based rulesets use the spectral characteristics, elevation information and contextual information to tackle shadowing effects, to improve classification of fine-scale features, small open spots in the forest and cope with confusion between bare soil on orthophotos and the LiDAR model. Subsequently, the results of six classifications, three for 2006 and three for 2012, based on a single orthophoto, a single LiDAR dataset and the synergy of both datasets are compared to study the effect on classification accuracy.
Accuracy assessment (
Figure 2). Classification accuracy assessment was performed by random selection of 250–300 objects based on their relative occurrence in the six land-cover classes. A standard confusion error matrix was calculated to include the user and producer accuracies and kappa statistics according to the method described by Congalton [
33].
2.2.2. Topography
Extraction of DTM’s of time 1 (T1) and time 2 (T2) (
Figure 2). The 2006 DTM (T1) was provided by the ‘Land Vorarlberg’ (see
Table 1). The 2012 DTM (T2) was obtained from the raw point cloud by nearest neighbor interpolation of the ground elevation points.
DTM difference (
Figure 2). The DTM difference was obtained by subtracting DTM 2006 from DTM 2012. Topographical volumetric change was calculated for each land cover class by multiplying the topographical change raster with pixel size (0.125 m × 0125 m).
Accuracy assessment (
Figure 2). To determine the propagation error of DTM differencing the method of Wheaton et al. [
34] was used. The propagation error in the DTM differencing process caused maximum uncertainties of 0.29 m. This represents 0.0066 m
3 per pixel of volumetric change. Therefore, volumetric changes <0.01 m
3 are disregarded and considered as ‘no change areas’, similar to findings of Latypov [
35].
2.2.3. Above Ground Biomass
Tree top extraction (
Figure 2). The CHM was calculated by subtracting the DTM from the DSM. A local-maxima algorithm called “Find Local Extrema” [
36] was used to derive tree top locations on areas previously classified as forest.
Accuracy assessment (
Figure 2). Assessment of the results generated by the local-maxima algorithm was performed by manual inspection and comparison of the generated canopy tops with the CHM and orthophotos in a 3D ArcScene environment, which allows for detailed zooming and panning.
Tree height (
Figure 2). Individual tree height was calculated by multiplying the rasterized CHM with the binary tree top locations.
Tree species (
Figure 2). Based on the forest inventory map [
29] 89.0% of the study area is vegetated. The vegetation cover is divided into deciduous forest (67.7%), coniferous forest (32.8%) and shrubland (0.4%).
Allometrics (
Figure 2). According to Maier et al. [
12] and the Austrian Forest Inventory [
37] the Norway Spruce and Beech are the dominant tree species in Vorarlberg. Therefore, the allometric equations for AGB calculation for Norway Spruce and Austrian Beech were used [
38,
39,
40]:
where DBH = diameter at breast height (cm) and H = tree height (m)
where B = biomass (kg)
The allometric equations are used to first calculate the diameter at breast height [R2 = 0.880; R2 = 0.783] and subsequently the biomass using the height of the tree tops [R2 = 0.946; R2 = 0.997].
2.3. Change Analysis: Land Cover, Topography and Above Ground Biomass
After land cover classification, a post-classification change detection is applied using image differencing [
2,
11]. Image differencing compares two image objects hierarchies through an additional segmentation process and a knowledge-based fuzzy-logic change detection ruleset. The topographical volumetric change is the product of the DTM differencing of DTMs T1 and T2. The AGB change is calculated by subtracting the 2006 from the 2012 AGB and interpreting spatial AGB changes in relation to the landslide.
4. Discussion
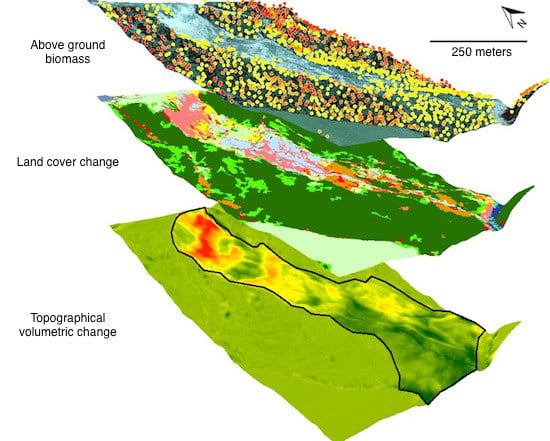
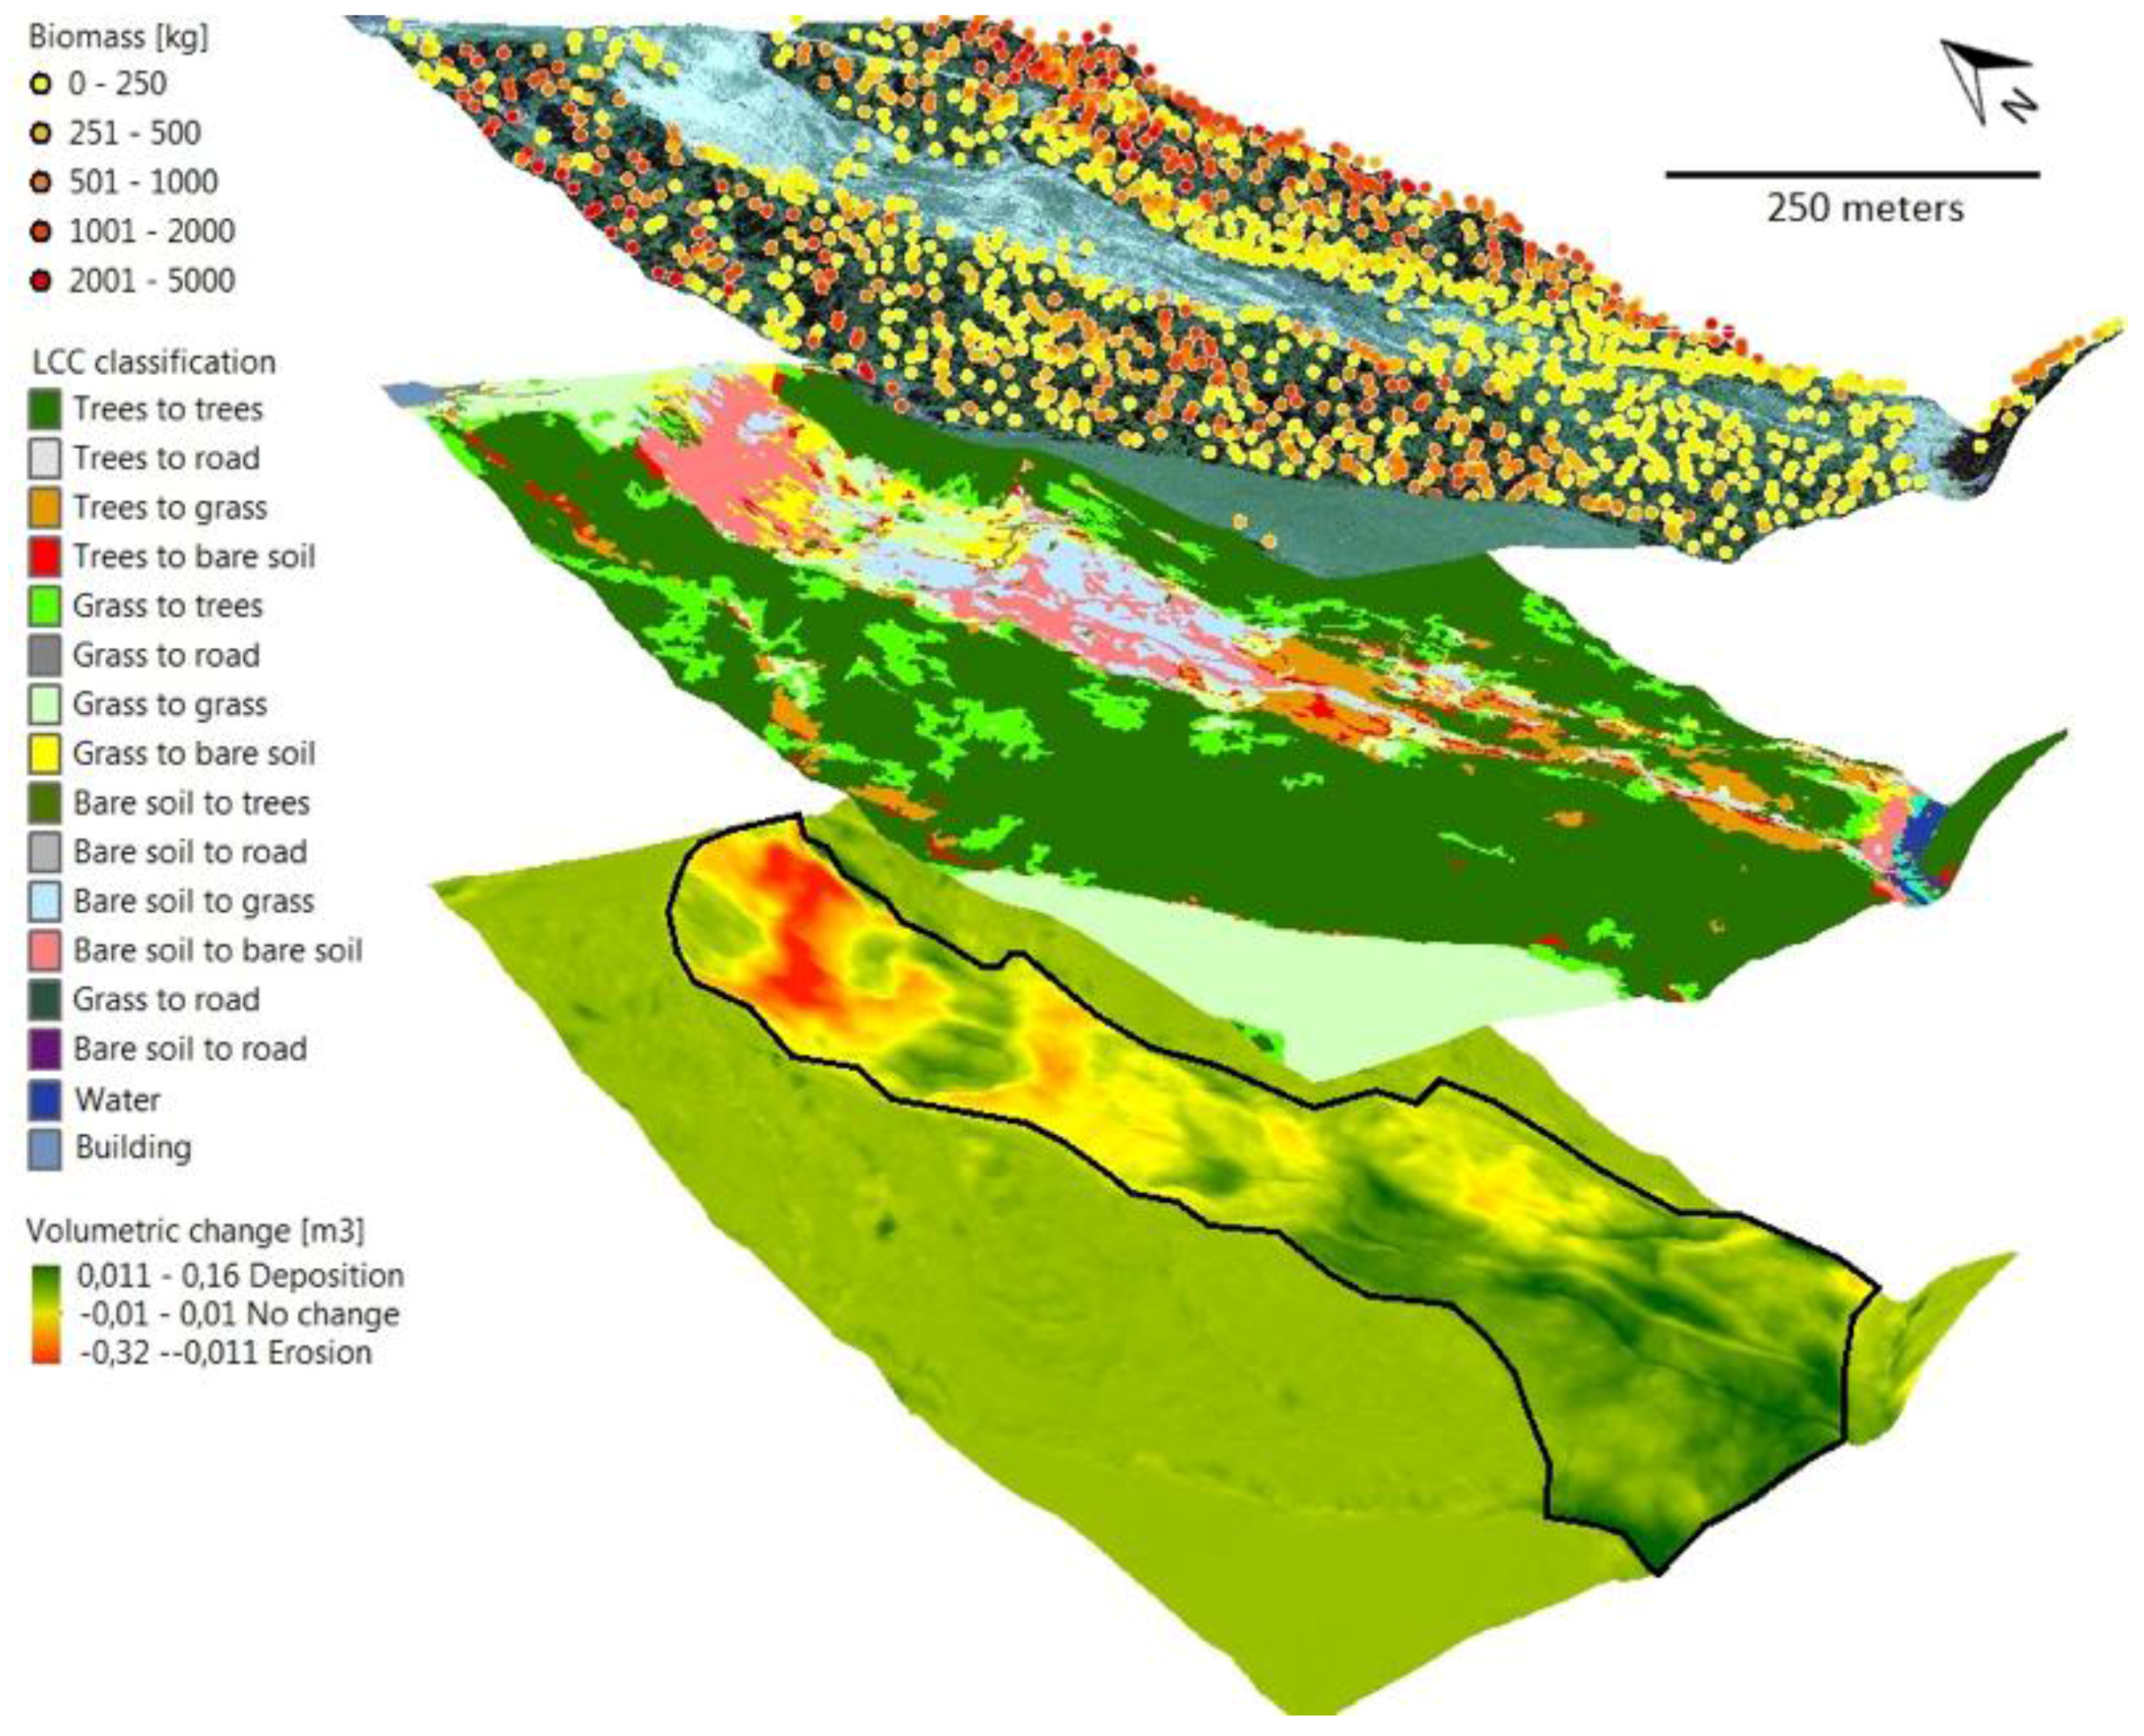
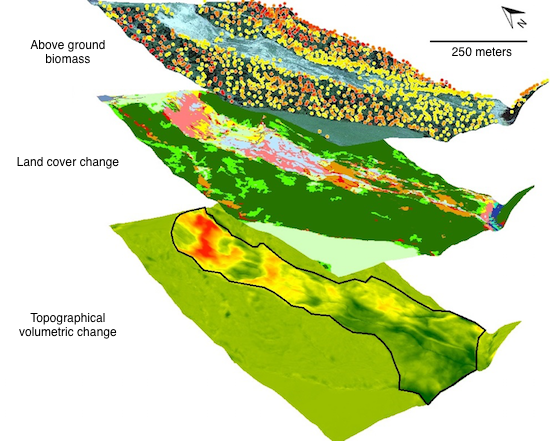
The combined results of the land-cover, topographic and biomass change show detailed change patterns that align well with the effects and the dynamics of landslide behaviour. The DEM differencing (
Figure 3 lower panel) shows a step-wise pattern of removal and deposition within the upper landslide body and scar area, that fits well to ‘slide-type’ movements [
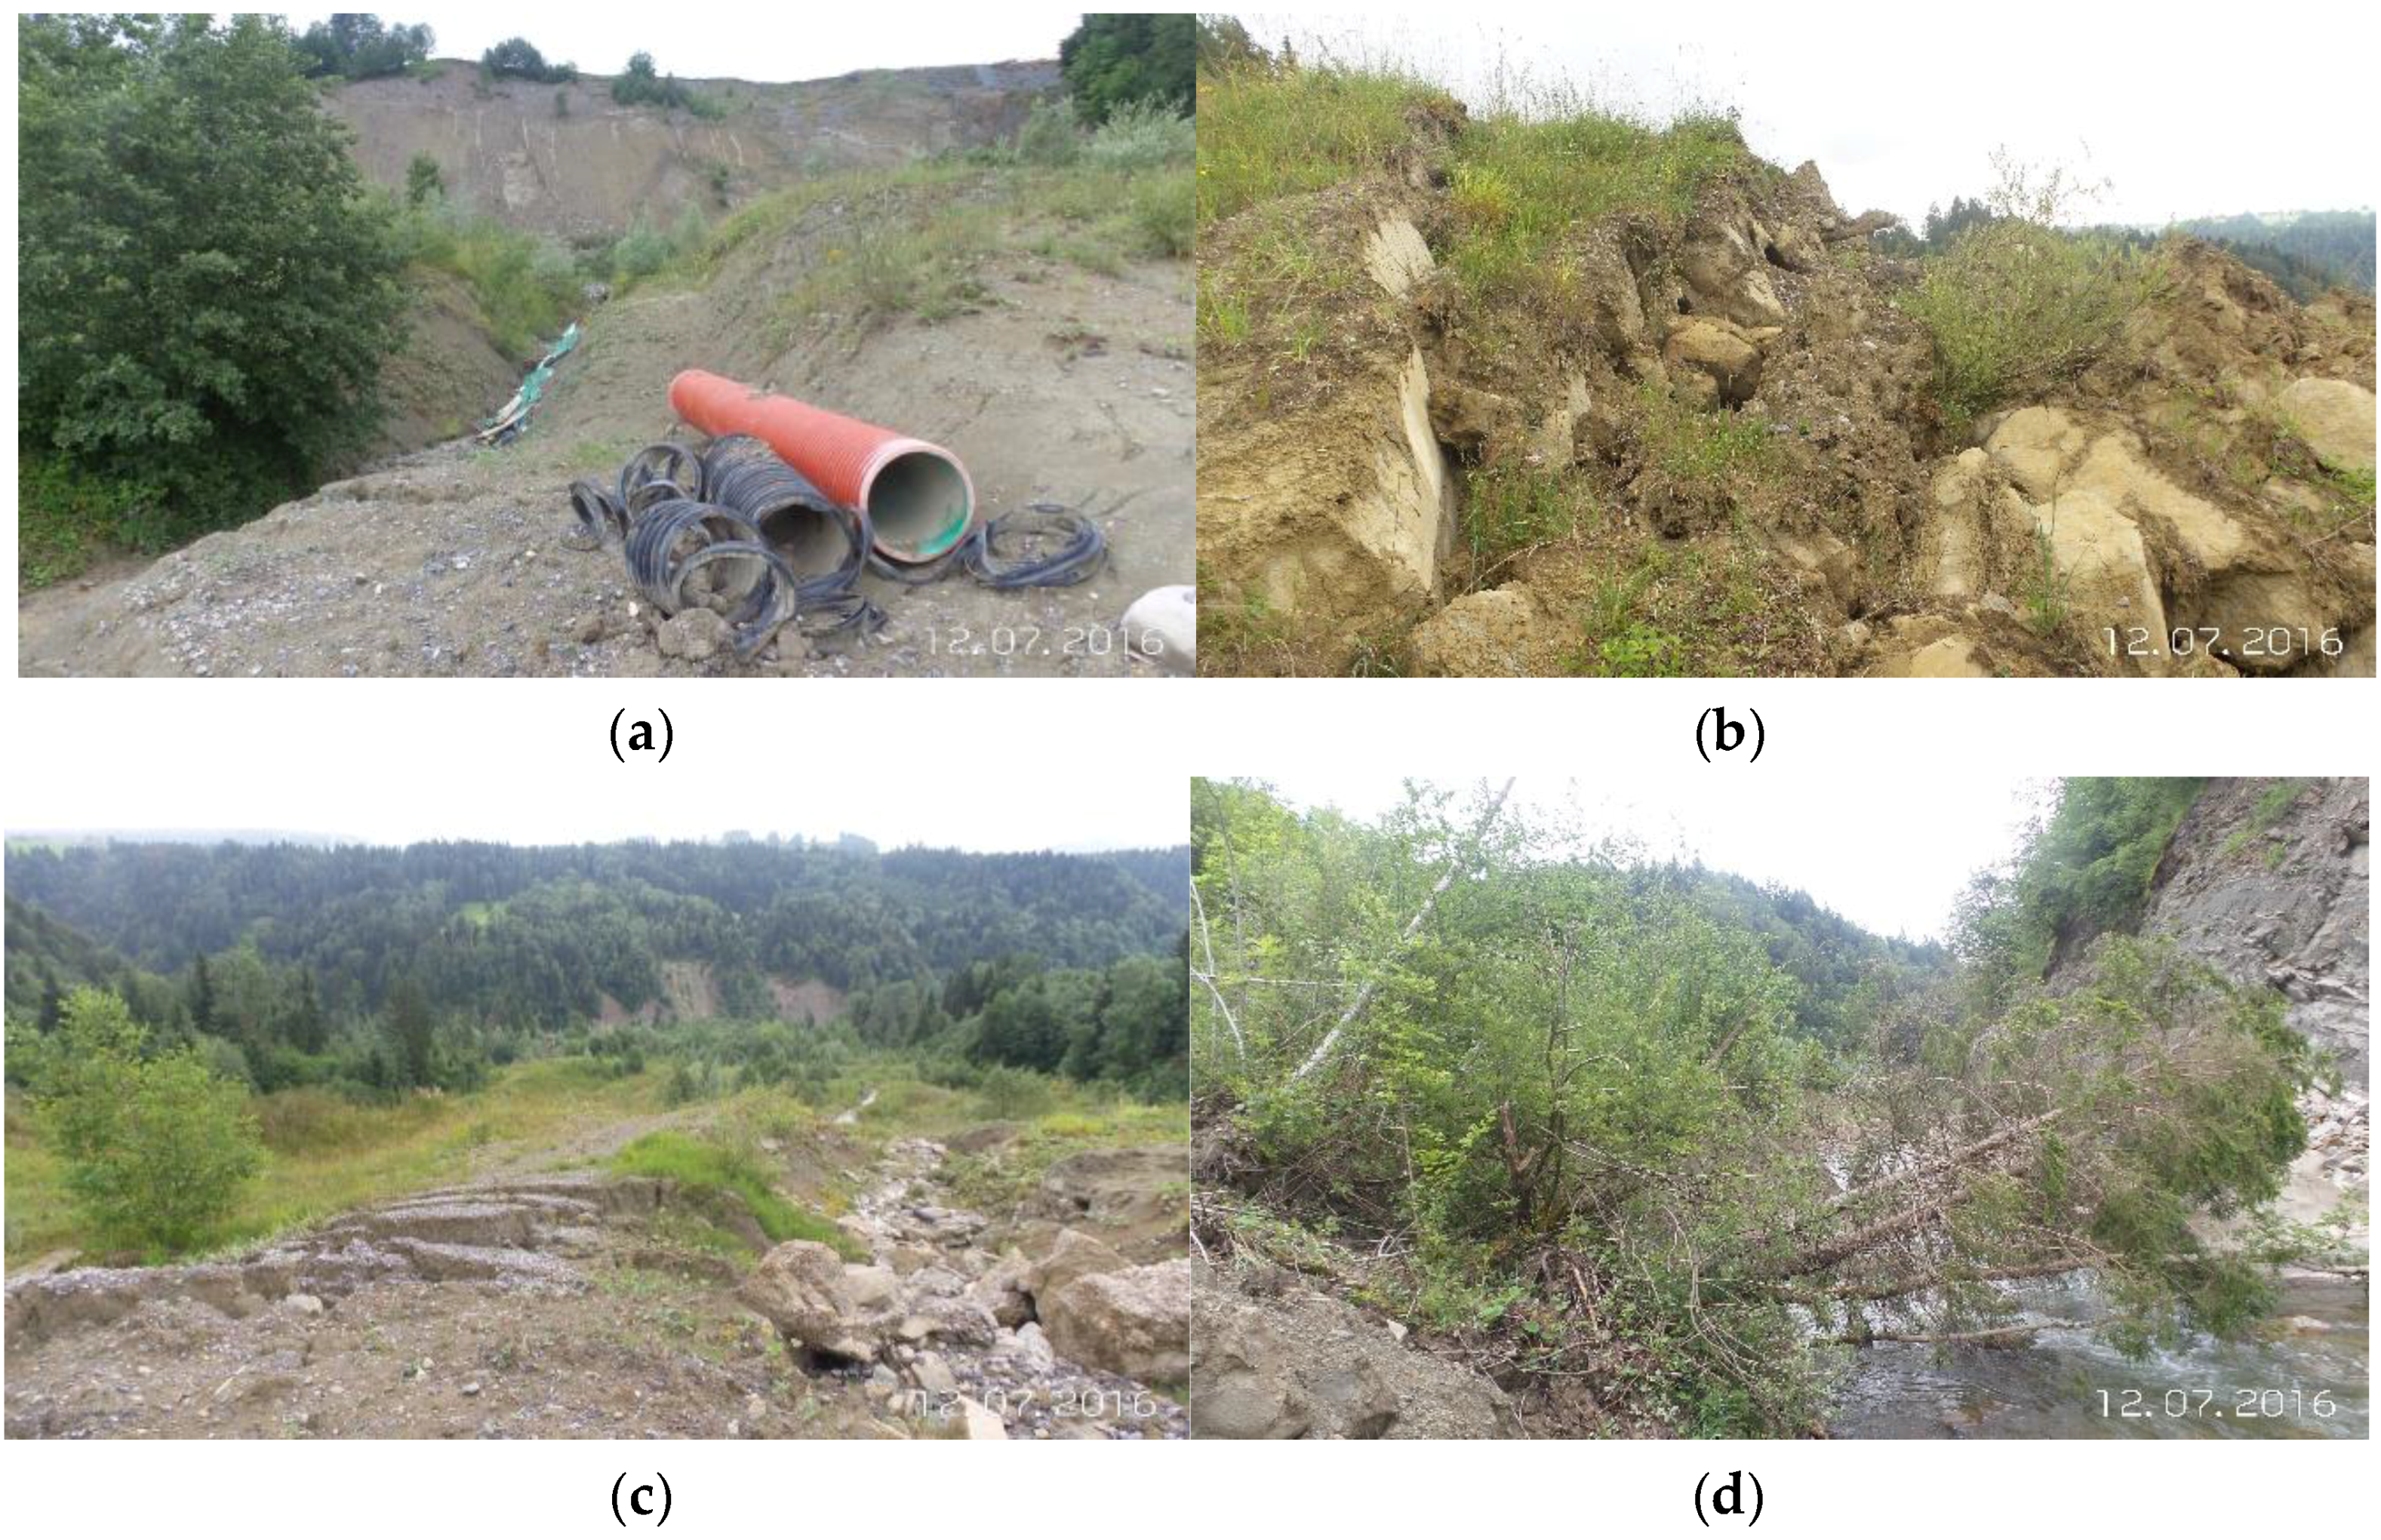
27]. On the contrary, the lower section indicates ‘flow-type’ depositional processes. The largest topographic changes occur along the main scarp on areas classified as bare soil, in contrast to the stable forested areas outside the landslide area, which remained unchanged. These landslide patterns were also observed during field visits, which confirmed extensive deposition into the lower forested area, without causing total removal of trees (
Figure 4). In total, the forest area slightly increased by 0.86% compared to 2006, while biomass decreased 8.3%. This difference can be attributed to the decrease of relatively large trees (>500 kg) in the deposition area of the landslide, while ‘from grassland to forest’ accounts for a large increase in surface area, but only contributes to small biomass gain. Therefore, biomass change in a landslide area should be interpreted in the light of the landslide processes and temporal dynamics of the landslide effects.
Classification based solely on orthophotos resulted in misclassification of classes that are spectrally similar, such as forest and grass-and shrubland, while classification based solely on LiDAR caused misclassification between objects with similar elevation characteristics, such as grassland and bare soil. These misclassifications are the result of large overlap in the feature space, as apparent from the FSO. Orthophoto-based classification does, however, separate grassland from bare soil, while LiDAR-based classification separates forests from grassland and bare soil. The spectral and elevation synergy between the datasets, therefore, results in improved classification of all land-use classes.
The use of data synergy improved the classification accuracy of LCC with 15–26% compared to single dataset usage, similar to findings of other studies that also concluded improvements using data synergy [
3,
18,
24,
25,
41]. However, data synergy also introduces small locational errors due to mismatches between the datasets. The added value of data synergy lies in the use of contextual improvements in the OBIA approach to overcome these small mismatches. Similarly, large local spectral variations caused by shadows, canopy openings, crown texture [
25,
42], and LiDAR-based errors can be overcome. An example of such a LiDAR error is that locally, steep bare slopes showed a CHM higher than two meters. Although data synergy provides a solution for such errors, it remains unsure what the effect of temporal differences between the orthophotos and LiDAR acquisition is in a dynamic landslide area. Many different LiDAR filtering [
28] and interpolation [
43] techniques exist, which all impact the DSM and DTM quality [
44,
45] differently. Incorrect filtering of ground and non-ground returns can influence the landscape change analysis [
18]. Although our results seem reliable and valid, it should be kept in mind that differences in raw LiDAR point densities and the selected filtering and interpolation techniques may cause error propagation when using the data synergy approach.
The depositional toe of the landslide area showed less pronounced elevation change, in contrast to the upper denudation area, which is characterized by higher elevation change. Therefore, the accuracy of topographical change in landslide areas is often better for denudation than deposition processes [
46] unless steep slopes with low LiDAR point densities are considered [
47], which do occur on the main scarp. Sailer et al. [
48] showed that the error of DTM differencing increased with lower point densities and higher roughness values and slope [
49]. Anders et al. [
50] concluded that lack of LiDAR points below dense forests hindered accurate topographic change detection. Contrary to the research of Sailer et al. [
48] and Anders et al. [
50], most topographic change below dense forest falls within the DTM uncertainty range of −0.01 to 0.01 m
3, which indicates no change.
A large fraction of the variation in the regression modeling of AGB can be explained by the elevation of individual trees [
5]. The allometric biomass equations used in this research have a R
2 of 0.946 and R
2 = 0.997 [
38,
40]. Therefore, accuracy of the AGB estimates mainly depends on the LiDAR quality, the local-maxima algorithm and whether the most appropriate allometric equations are used. For a completely reliable representation of tree crowns, a minimum LiDAR density of 5 points/m
2 is required [
51] while the utilized data contain only 2 points/m
2 for 2006 and >4 points/m
2 for 2012. Since no reference datasets were available visual inspection of the delineated canopy tops was performed on the CHM in the 3D environment of ArcScene [
52,
53]. This showed satisfying outcome, although several common errors were noticed, such as closely aggregated canopy tops on steep slopes and erroneous identification of multiple canopy tops due to branching [
54,
55] and omitting understory trees [
56].
Landslide management is currently considered more feasible than governing all the natural conditions leading to instability [
57]. Bräuer and Tuttas [
56] acknowledge the need for continued monitoring of mass movement to assess and manage environmental risk posed by the Doren landslide. Even though mitigation of the deep-seated landslide started 80 years ago, the Doren landslide still endangers nearby real estate. This research provides a simple method to monitor the effects of landslides to its surroundings which could support management decisions and solutions to the long-term landslide rehabilitation problem in Doren.
The transferability of the workflow to other areas has great potential due to the conservative membership parameters and contextual improvements. However, large VHR LiDAR datasets require efficient computing power, which implies that use of cloud computing facilities seems a logical step, especially considering that the quality and availability of these datasets will improve in the near future [
3,
58,
59].


