Article

GDP Spatialization and Economic Differences in South China Based on NPP-VIIRS Nighttime Light Imagery

1
School of Geographic and Oceanographic Sciences, Nanjing University, Nanjing 210023, China
2
Collaborative Innovation Center of South China Sea Studies, Nanjing 210023, China
3
State Key Laboratory of Resources and Environmental Information Systems, Institute of Geographic Sciences and Natural Resources Research, Chinese Academy of Sciences, Beijing 100101, China
4
Jiangsu Center for Collaborative Innovation in Geographic Information Resource Development and Application, Nanjing 210023, China
5
University of Chinese Academy of Sciences, Beijing 100049, China
*
Author to whom correspondence should be addressed.
Remote Sens. 2017, 9(7), 673; https://doi.org/10.3390/rs9070673
Submission received: 27 April 2017 / Revised: 27 June 2017 / Accepted: 29 June 2017 / Published: 1 July 2017
(This article belongs to the Special Issue Societal and Economic Benefits of Earth Observation Technologies)

Abstract

:
Accurate data on gross domestic product (GDP) at pixel level are needed to understand the dynamics of regional economies. GDP spatialization is the basis of quantitative analysis on economic diversities of different administrative divisions and areas with different natural or humanistic attributes. Data from the Visible Infrared Imaging Radiometer Suite (VIIRS), carried by the Suomi National Polar-orbiting Partnership (NPP) satellite, are capable of estimating GDP, but few studies have been conducted for mapping GDP at pixel level and further pattern analysis of economic differences in different regions using the VIIRS data. This paper produced a pixel-level (500 m × 500 m) GDP map for South China in 2014 and quantitatively analyzed economic differences among diverse geomorphological types. Based on a regression analysis, the total nighttime light (TNL) of corrected VIIRS data were found to exhibit R2 values of 0.8935 and 0.9243 for prefecture GDP and county GDP, respectively. This demonstrated that TNL showed a more significant capability in reflecting economic status (R2 > 0.88) than other nighttime light indices (R2 < 0.52), and showed quadratic polynomial relationships with GDP rather than simple linear correlations at both prefecture and county levels. The corrected NPP-VIIRS data showed a better fit than the original data, and the estimation at the county level was better than at the prefecture level. The pixel-level GDP map indicated that: (a) economic development in coastal areas was higher than that in inland areas; (b) low altitude plains were the most developed areas, followed by low altitude platforms and low altitude hills; and (c) economic development in middle altitude areas, and low altitude hills and mountains remained to be strengthened.

1. Introduction

Gross domestic product (GDP) is an important indicator of the economic performance of a country or region. With the accelerating process of urbanization, development patterns of different regions present more prominent regional differences. However, there are many problems to measure GDP using socioeconomic statistics, such as the inconsistency of statistical scales and the uniformity of data within the statistical unit, which make it difficult to reflect differences in regional economic development at fine scales. There are also problems with inconsistent borders during overlay analysis between the statistical data based on administrative units, and vegetation patterns and natural disaster data based on geographic units. Identifying how to accurately measure GDP at fine scales is of great importance to understanding the dynamic changes in regional economies and meeting the needs of interdisciplinary research.
Compared with traditional socioeconomic census, remote sensing imagery has obvious advantages in describing the spatial distribution of GDP. Nighttime light data are frequently used to describe the intensity of economic activities on the earth surface, and have been widely used in the estimation of socioeconomic parameters.
Previous studies have used the nighttime light data from the Defense Meteorological Satellite Program-Operational Linescan System (DMSP-OLS) to investigate economic activities at different scales. For example, Elvidge et al. [1] found a high correlation between the area lit and GDP for 21 counties in North America using the DMSP-OLS nighttime light data. Similar studies were carried out in the European Union countries, China and the United States, revealing that the regression coefficients of the total nighttime light (TNL) and GDP were in the range of 0.8 to 0.9 [2,3,4]. In addition, studies have produced maps of economic activity at 5 km and 1 km resolution based on the relationships between economic parameters and nighttime radiance from DMSP-OLS nighttime light data [5,6].
Despite the strong capacity of DMSP-OLS nighttime imagery to investigate economic activities at both global and regional scales, the lack of on-board radiometric calibration and limited radiometric detection capacity inevitably reduce the correlations between economic activities and detected nighttime light [7,8]. A new generation of nighttime light data collected by the Visible Infrared Imaging Radiometer Suite (VIIRS) carried by the Suomi National Polar-Orbiting Partnership (NPP) satellite was released freely in 2013 [9,10]. The NPP-VIIRS data have a higher resolution (about 500 m) than the 1 km-resolution DMSP-OLS data. Moreover, the wider radiometric detection range solves over-saturation problems and the on-board radiometric calibration increases the data quality [10]. Several studies have suggested that the NPP-VIIRS data might be more indicative for economic development than DMSP-OLS data at both provincial and city scales because of their more positive responses to economic indicators [11,12,13]. At present, studies of GDP estimation using NPP-VIIRS data are relatively new, and most focus on responses of nighttime light radiance to economic variables at regional scales. However, studies using NPP-VIIRS data for the estimation of economic variables at pixel-level scales are less common, and moreover, no analysis has been done on the regional differentiation of economic maps simulated from NPP-VIIRS data.
Although previous studies utilized night light brightness for quantitatively estimating and mapping socioeconomic activities differed slightly in their approaches and scopes, one common point is that their focus is often confined to urbanization processes and anthropogenic activity intensities. The land surface, which supports human life and production, however, has received less attention. As a natural factor restricting the urban expansion and demographic dynamics, the role of topography and geomorphology cannot be ignored. A fully understanding of spatial-temporal differences of economic status among different terrain and geomorphological types is a first step in exploring the complex interactions between landform and anthropogenic activities, and contributes to provide decision-making for a region’s sustainable planning and development.
South China contains not only the highly-developed Pearl River Delta region, but also southwestern poverty-stricken areas, reflecting large differences in regional economies. As the major economic zone in the northern part of the South China Sea, fully understanding its economic status can help to provide a basis for China’s development planning and policy formulation, and also offer decision support for the 21st Century Maritime Silk Road. In this study, the spatial distribution of GDP at 500 m × 500 m in South China in 2014 was simulated using NPP-VIIRS data, and the economic differences among diverse geomorphological types were quantitatively analyzed. Firstly, a method was proposed to correct the original NPP-VIIRS data. Secondly, four nighttime light indices from the corrected data over South China at both prefecture and county levels were calculated. They were subsequently applied in the regression analysis between nighttime light indices and GDP. Thirdly, the best regression model was selected to simulate the pixel-level GDP and the final GDP map was produced using a GDP linear calibration model. Finally, by overlaying with the basic geomorphological types in South China, the total GDP and GDP intensity among different geomorphological units in South China were quantitatively calculated to analyze the intensity of economic activities in different geomorphological types.

2. Case Study Area and Data

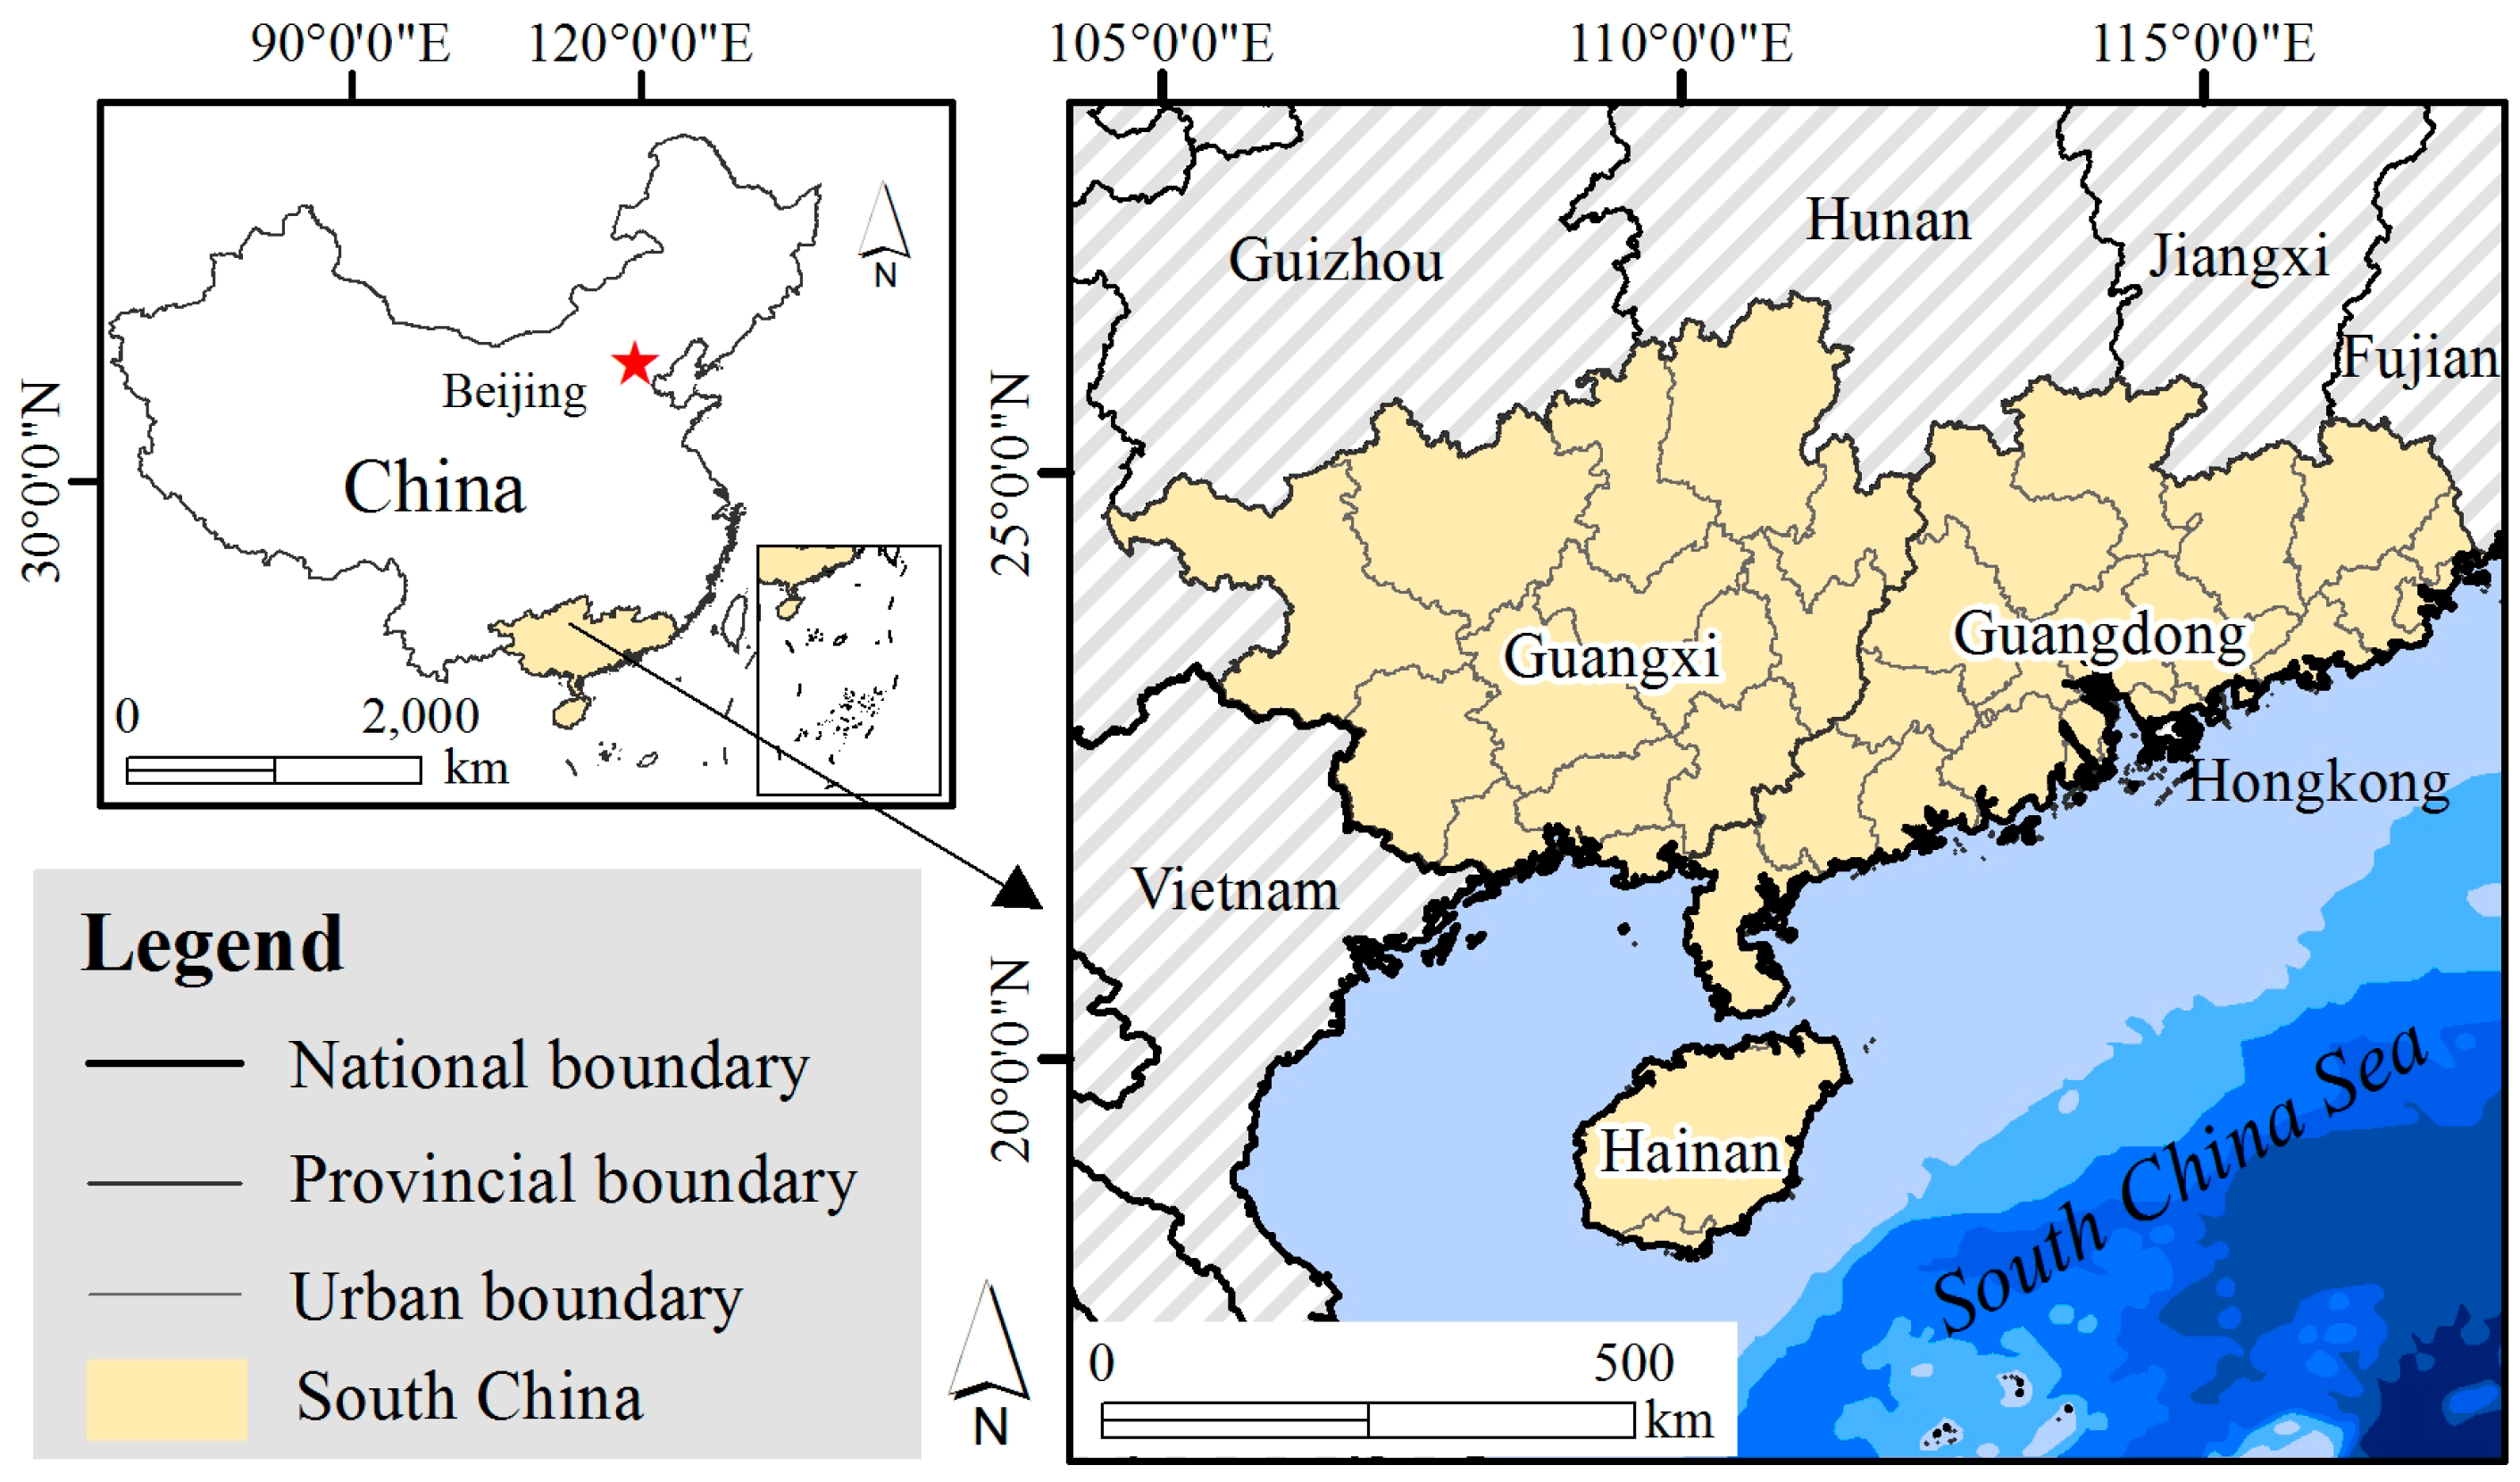
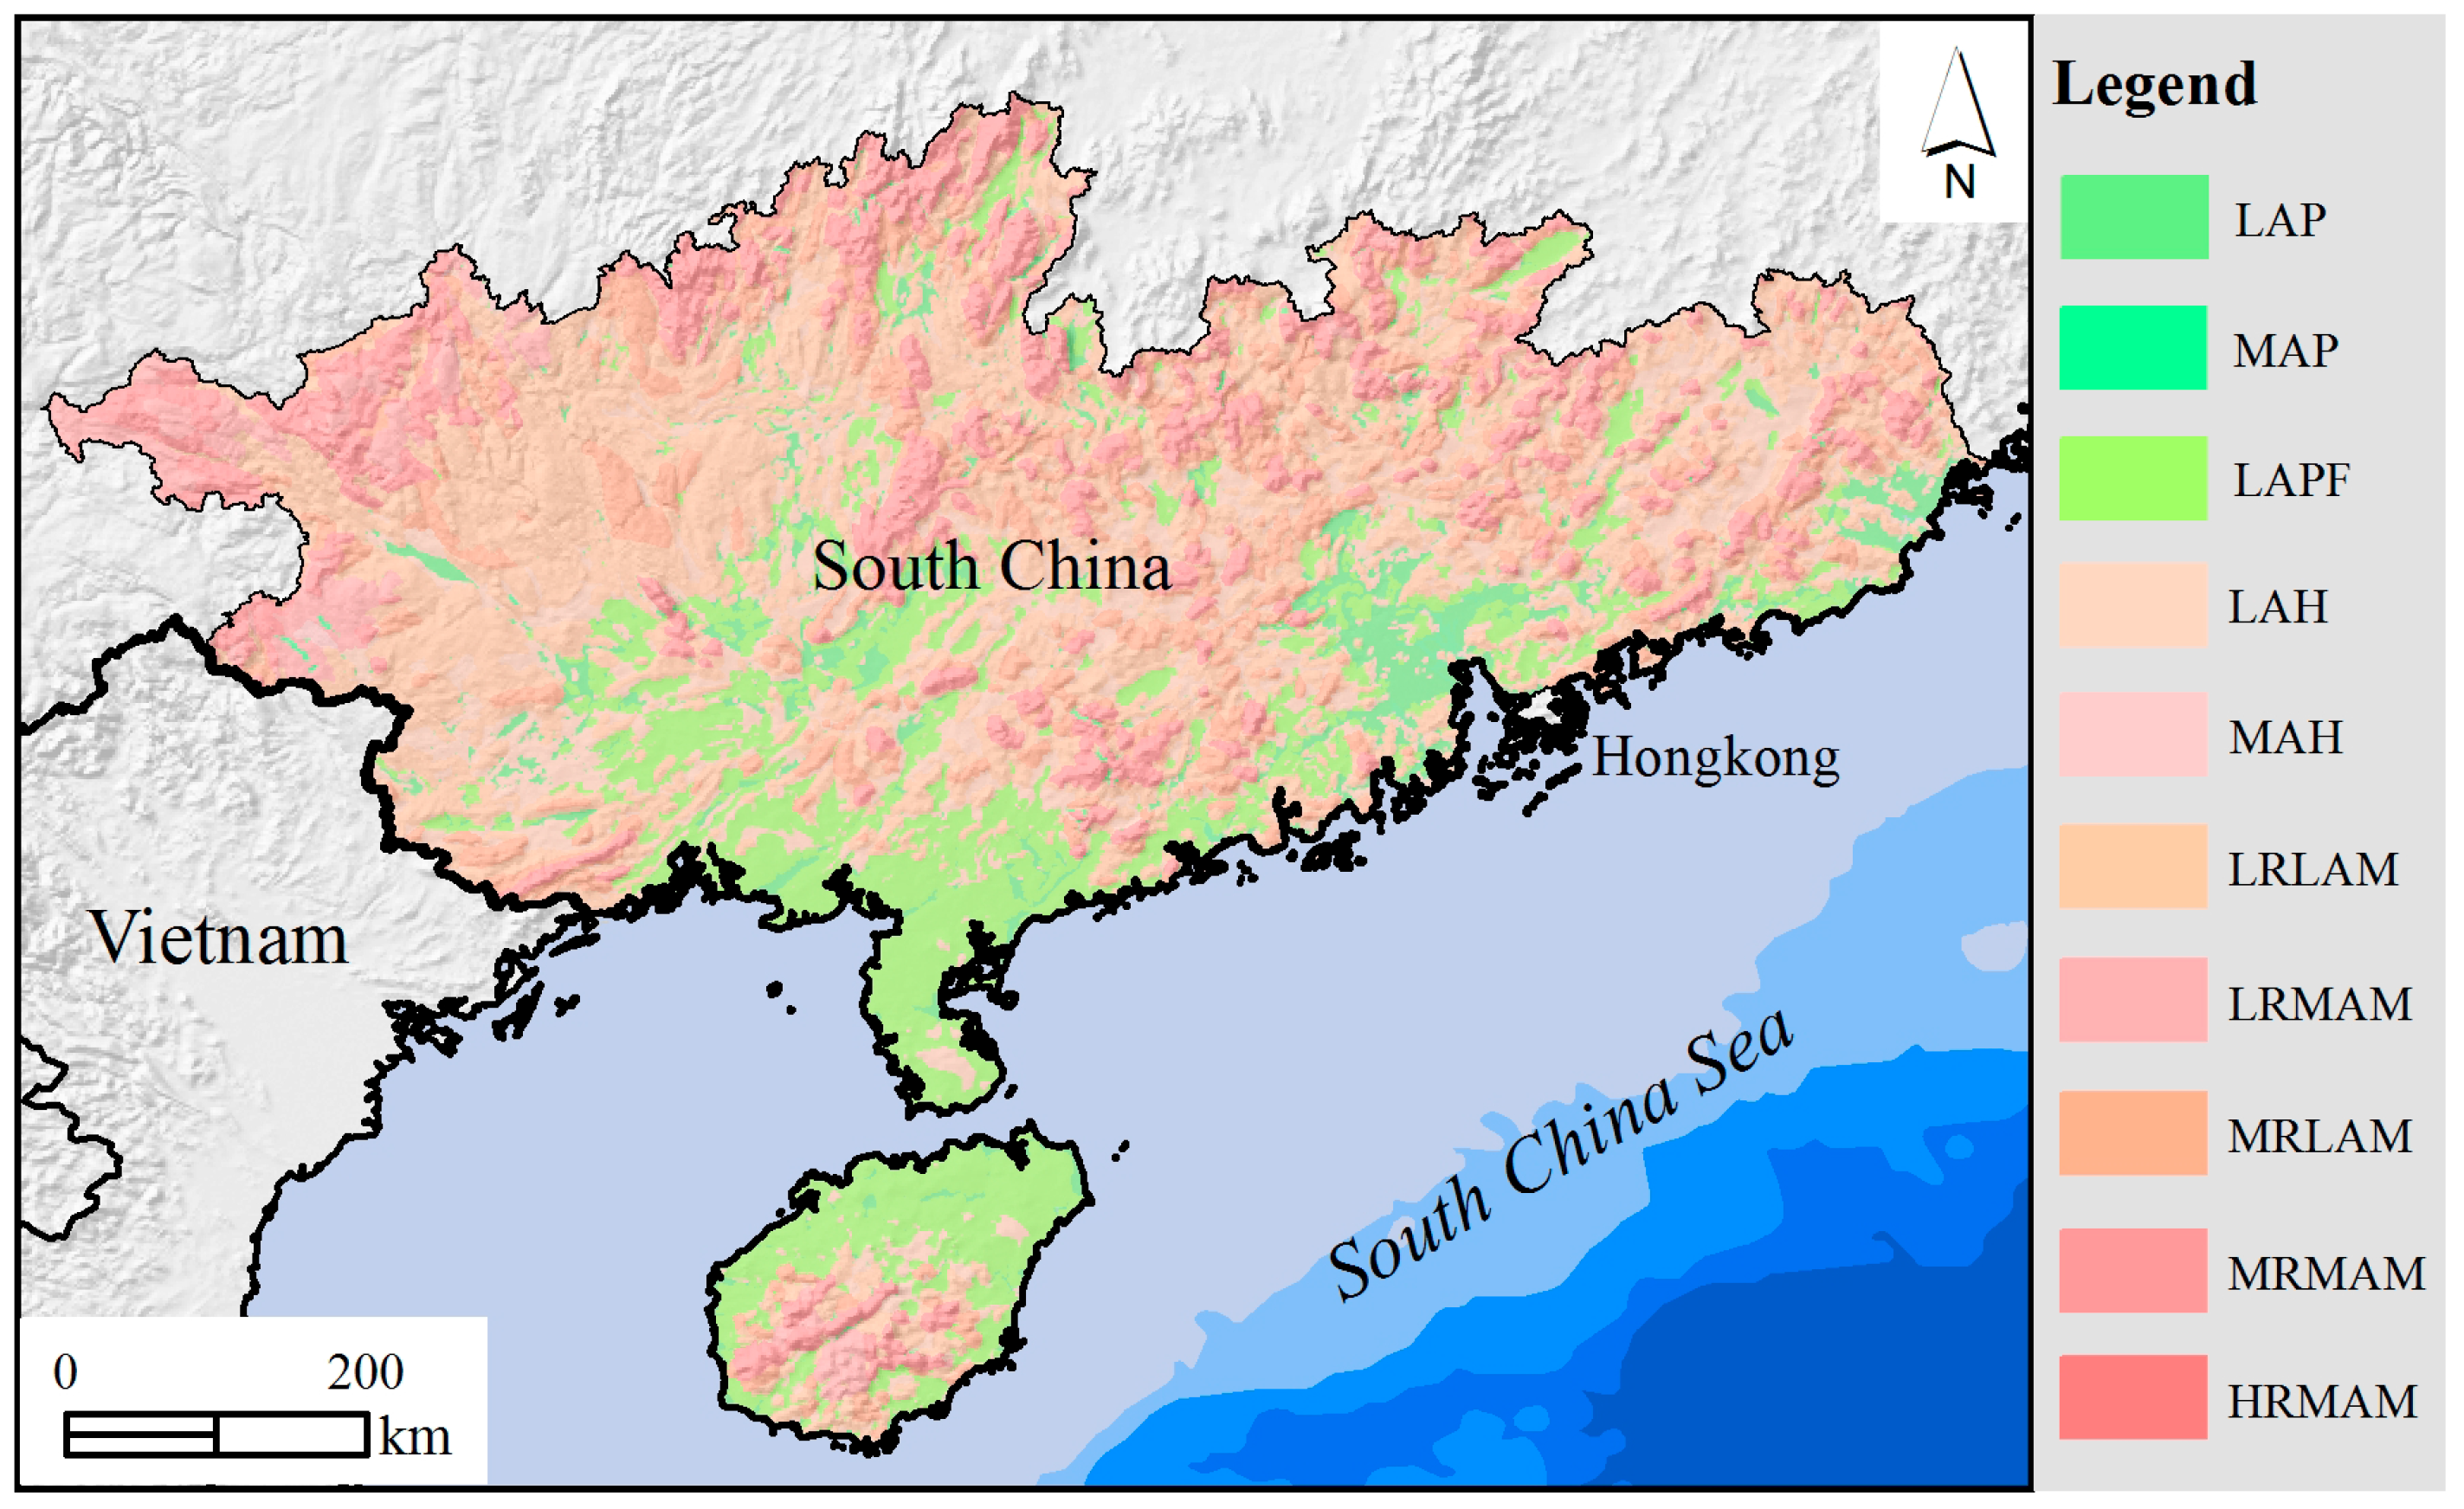
2.1. Case Study Area

South China (104°25′E–117°20′E, 18°9′N–26°24′N) is one of the seven geographical divisions in China with a total area of 447,881 km2 (Figure 1). It is located in the southern part of China and consists of three provinces (Guangdong, Guangxi and Hainan), including 38 prefecture-level cities, and 286 county-level cities, districts or counties. Because not all statistical data at the level of county administrative units can be obtained, some districts were consolidated to generate several new county-level units for analysis in this study.

2.2. Data Collection

2.2.1. Visible Infrared Imaging Radiometer Suite (VIIRS) Nighttime Light Data

The version 1 series of global VIIRS nighttime light images for the year 2014 were provided by the Earth Observation Group, National Geophysical Data Center (NGDC) at the National Oceanic and Atmospheric Administration (NOAA) (downloaded from https://www.ngdc.noaa.gov/eog/viirs/download_monthly.html). The VIIRS Day/Night Band cloud free composites data are produced monthly, and contain spatially gridded nocturnal radiance values across human settlements at a spatial resolution of 15 arc-seconds spanning the latitudinal zones of 65°S–75°N. In this study, the monthly nighttime light images for China were extracted and projected to an Albers equal area conic projection with a spatial resolution of 500 m. Then, the VIIRS nighttime light images for South China, spanning months 1–12 for the year 2014, were extracted. A composite VIIRS nighttime light image for South China was generated by averaging pixel brightness from the 12 images, and formed the original VIIRS data for South China in this study (Figure 2a).

2.2.2. Defense Meteorological Satellite Program (DMSP) Nighttime Light Data

The version 4 composite DMSP-OLS stable nighttime light data, derived from NOAA/NGDC, are grid-based annual data composites spanning 1992–2012 with a digital number (DN) between 0 and 63 and a 30 arc-second (approximately 1 km at the equator) spatial resolution for pixels. To reduce the yearly variations and response differences among sensors, a second order regression model [14,15] was used to empirically calibrate the annual nighttime light products, which were matched with the composite of F12 in 1999. As the corrected data in 2013 had not been available, the closest available corrected data were used for this research. Thus, the imagery for China in 2012 was projected into the Albers equal area conic projection and resampled to a spatial resolution of 500 m × 500 m. The DMSP imagery for South China in this study was extracted from processed DMSP-OLS data for China (Figure 2b).

2.2.3. Statistical Economic Data

Applications of nighttime light data for quantitatively estimating socioeconomic parameters have been well documented in previous studies using statistical data [5,16]. To investigate the quantitative relationships between VIIRS nighttime light signals and GDP for South China in 2014, the statistical GDP data for prefecture- and county-level units in South China were collected from the 2015 China City Statistical Yearbook, 2015 Guangdong Statistical Yearbook, 2015 Guangxi Statistical Yearbook, and 2015 Hainan Statistical Yearbook. It is noted that the 2015 China City Statistical Yearbook records all prefecture-level GDP and certain county-level GDP in 2014, whereas the provincial statistical yearbooks record the GDP for most of the county-level administrative units in provinces of Guangdong, Guangxi and Hainan in 2014. One unavoidable problem was the incompleteness and inconsistency of the statistical data from different sources, which made the work of data collation more critical. In this study, the prefecture-level GDP was obtained from the China City Statistical Yearbook, whereas the county-level GDP was mainly collected from provincial statistical yearbooks. For several county-level units with no data, county-level units belonging to the same prefecture-level unit were amalgamated and the total GDP of the newly merged units was calculated through subtraction. Based on this criterion, 38 prefecture-level and 190 county-level GDPs were summarized (Table A1). Boundaries for some county-level units were also merged to achieve spatial consistency with the corresponding statistical data.

2.2.4. Geomorphological Data

Geomorphological data were derived from 1:1,000,000 digital geomorphological database of China. The digital geomorphological data were obtained with visual interpretation from Landsat TM/ETM images, SRTM-DEM, and geology data [17]. The database contains seven data hierarchies, including basic morphology, genesis, sub-genesis, morphology, micro-morphology, slope and aspect, material composition and lithology [18]. Basic morphological types were created using two controlling factors: altitude and relief, and have been widely used in research on land cover change [19,20], urbanization [21,22,23] and cultivated land evaluation [24,25]. In this study, data of basic morphological types for South China were extracted. Their classification standard and spatial distribution are shown in Table 1 and Figure 3.

3. Methods

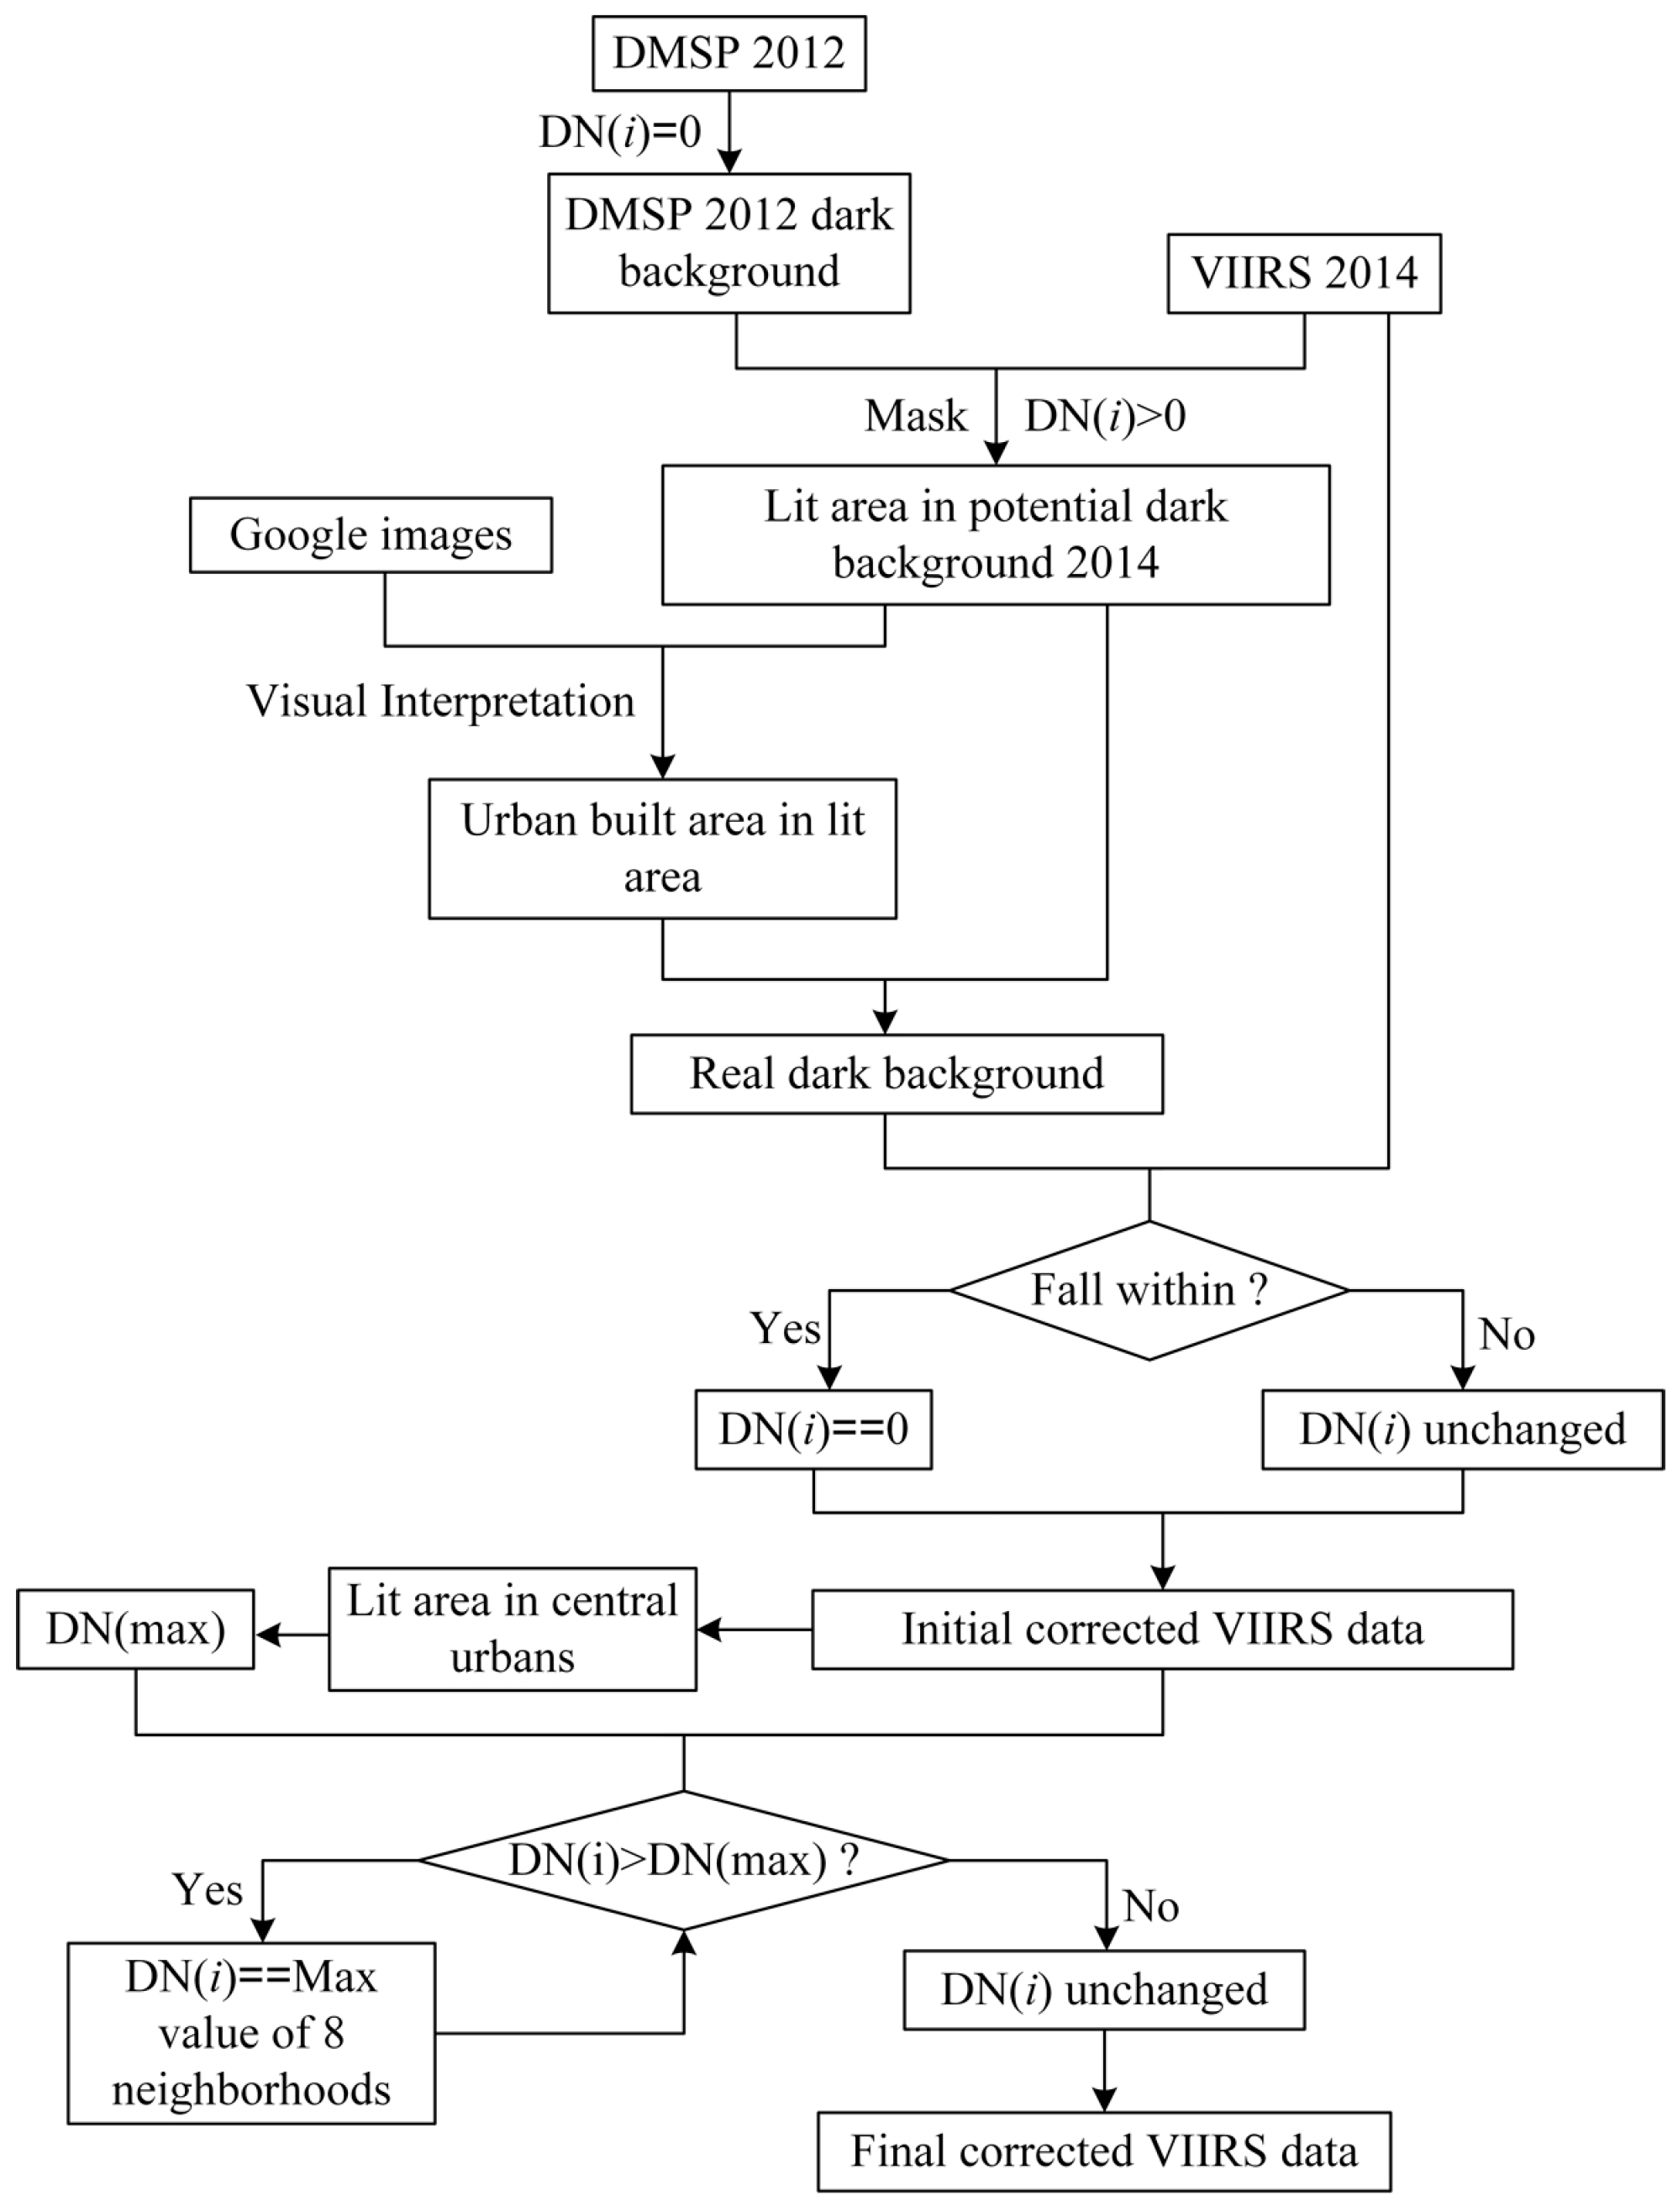
3.1. Correction of the VIIRS Nighttime Light Data

The NPP-VIIRS data are preliminary product, which have not been filtered to screen out lights from auroras, fires, gas flares, volcanoes, and background noise [26,10]. These confounding factors are irrelevant to economic activities, and can limit the accuracy and reliability in GDP estimation.
In this study, a sequence of preprocessing procedures was employed to reduce these interference factors in the original NPP-VIIRS data. Based on the hypothesis noted in previous studies that lit areas in the DMSP-OLS are the same as those in the NPP-VIIRS data in adjacent years [11,13,27], it is appropriate to assign same lit areas in similar years. Compared with the VIIRS data in 2014, the closest corrected DMSP-OLS data were available for the year 2012. Accordingly, the 2012 corrected DMSP-OLS data were used for lighting correction of VIIRS nighttime light data in 2014. The processing procedures are shown in Figure 4. Firstly, a mask with all pixels with DN value of 0 from the DMSP-OLS data in 2012 was generated to get the dark background of DMSP-OLS data in 2012. Next, lit areas in the potentially dark background of VIIRS data in 2014 were generated by extraction analysis. Based on that, Google Earth images were applied to extract the corresponding urban built area by visual interpretation. The real dark background of VIIRS data in 2014 was obtained by removing the urban regions of lit areas in the potential background. Lastly, we assigned the values of pixels that fell within the real dark background to 0, leaving the initial corrected VIIRS data without the background noise. The initial corrected data could provide a fair performance for GDP estimation, but a few outliers which were probably caused by stable lights from fires of oil or gas also needed to be corrected. Cities of Shenzhen, Zhuhai and Guangzhou in Guangdong province, Liuzhou and Nanning in Guangxi province, and Haikou and Sanya in Hainan province are the most developed cities in each province. Therefore, pixel values of other areas should not exceed values of these cities theoretically. The highest DN value across these cities in each province was used as a threshold to detect outliers in each province. Pixels whose DN value were larger than the threshold were assigned to the maximum DN value within the pixel’s immediate eight neighbors. If the maximum DN value was also larger than the threshold, the values of pixels of its eight-neighborhood area were selected for a second comparison. After this process, the final corrected VIIRS data were generated with all pixels in each province less than the threshold.

3.2. Calculation of Nighttime Light Indices

Nighttime light indices have been used to reflect socioeconomic level, such as total nighttime light (TNL), average nighttime light intensity (I), proportion of intensely lit area (S), and compounded nighttime light index (CNLI). TNL refers to the sum of the DN value of lighting within an administrative unit [12,13,27]. I is the ratio of TNL to the maximum nighttime light within an administrative unit [28,29]. S is defined as the ratio of the lit pixel area to the area of administrative unit [12,29]. CNLI is identified as the product of average light intensity and proportion of intensely lit area [30]. These nighttime light indices are calculated using following equations:
V T N L = ( D N i × n i ) ,
V I = V T N L / ( D N m a x × N L ) ,
V S = A N / A ,
V C N L I = V I × V S ,
where VTNL, VI, VS, VCNLI denote the value of TNL, I, S, and CNLI, respectively; D N i and n i denote the pixel value of the i level lighting and its corresponding pixel number within an administrative unit, respectively; D N m a x and N L denote the maximum value of lighting and the total pixel number of lit area within an administrative unit, respectively; and A N and A denote the area of lit pixels within an administrative unit and the total area of the administrative unit, respectively.

3.3. Regression Model and Simulation of GDP

To date, many regression models have been used for delineating the quantitative relationships between socioeconomic variables and VIIRS nighttime light signals [12,13,27,28,31,32]. Because lighting variables and socioeconomic parameters are different for diverse research scales, a single regression model may not be able to estimate the GDP accurately at different levels of administrative unit. To make the simulated GDP at the pixel level closer to the statistical data, four regression models (linear model, quadratic polynomial model, power function, and exponential function), together with the four commonly used light indices mentioned above, were selected to evaluate the quantitative relationships between VIIRS light indices and GDP in both prefectural-level and county-level units. Based on these regression analyses, the optimal regression model and light index was used to simulate GDP. A relative error was used to evaluate the capacity of the best light index to predict GDP.
e = ( g g ) / g ,
where g denotes the real GDP and g’ denotes the calculated GDP.

3.4. GDP Spatialization: Correction of Simulated GDP

To map the spatial distribution of GDP (GDP spatialization), GDP at the administrative unit scale needs to be disaggregated to the pixel scale. However, high deviations may occur because the simulated GDP at pixel level based on the optimal regression model was calculated directly using the light pixel value rather than the total nighttime light value [11,13,27]. Therefore, it is necessary to make corrections of the simulated GDP for each pixel in the administrative unit. The equation for correcting the simulated GDP at pixel level is shown below [33]:
G D P P = ( G D P t / G D P s ) × G D P i ,
where G D P P represents the corrected GDP of a pixel, G D P t is the statistical GDP of each administrative unit, G D P s is the sum of corresponding simulated GDP at pixel level by the optimal regression model, and G D P i is the simulated GDP of a pixel.

4. Results

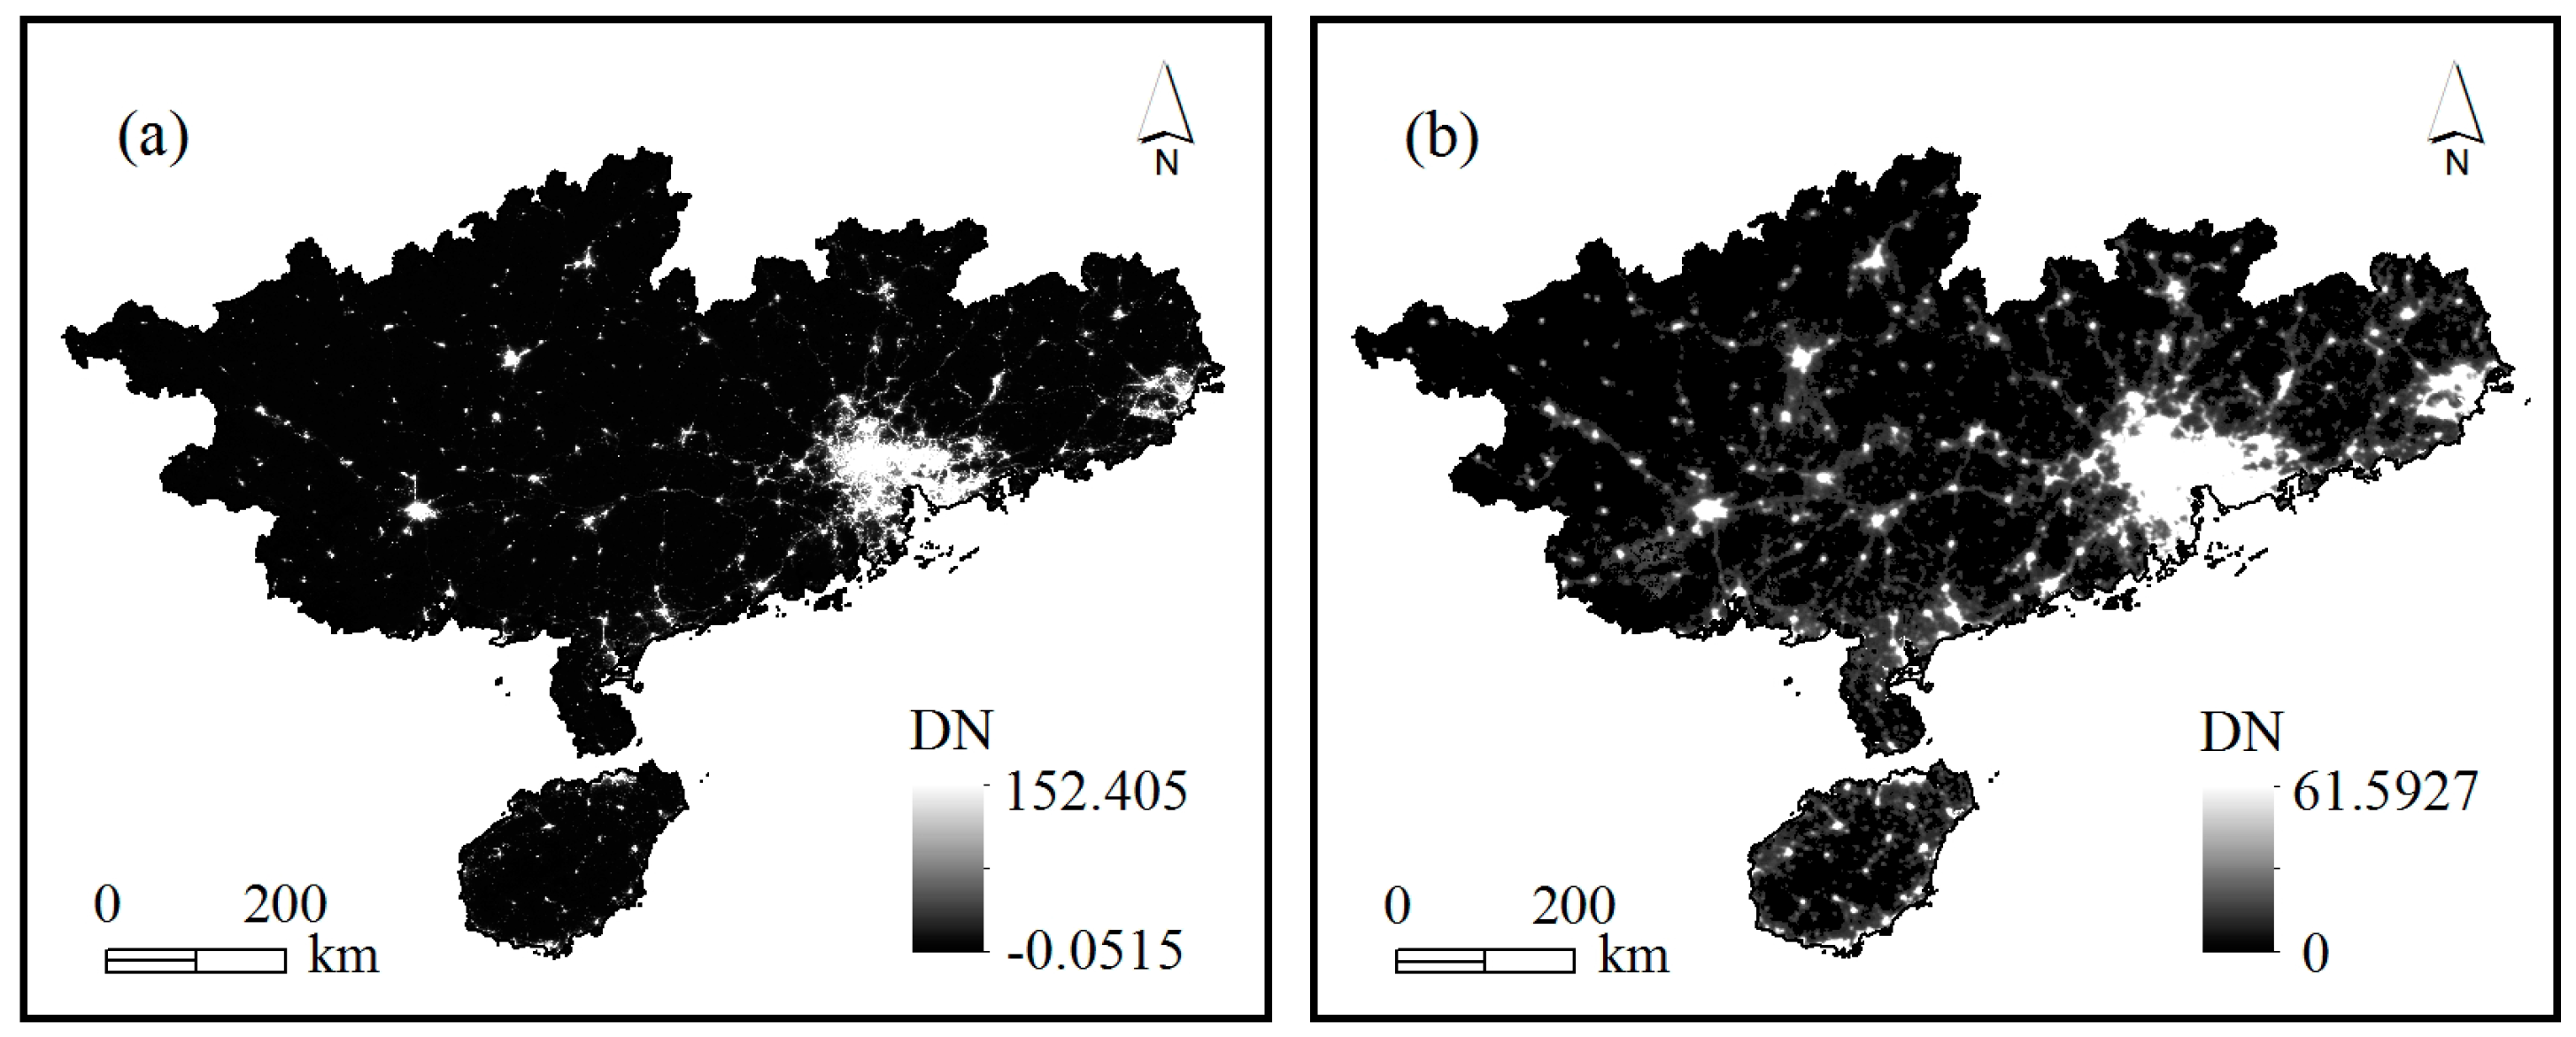
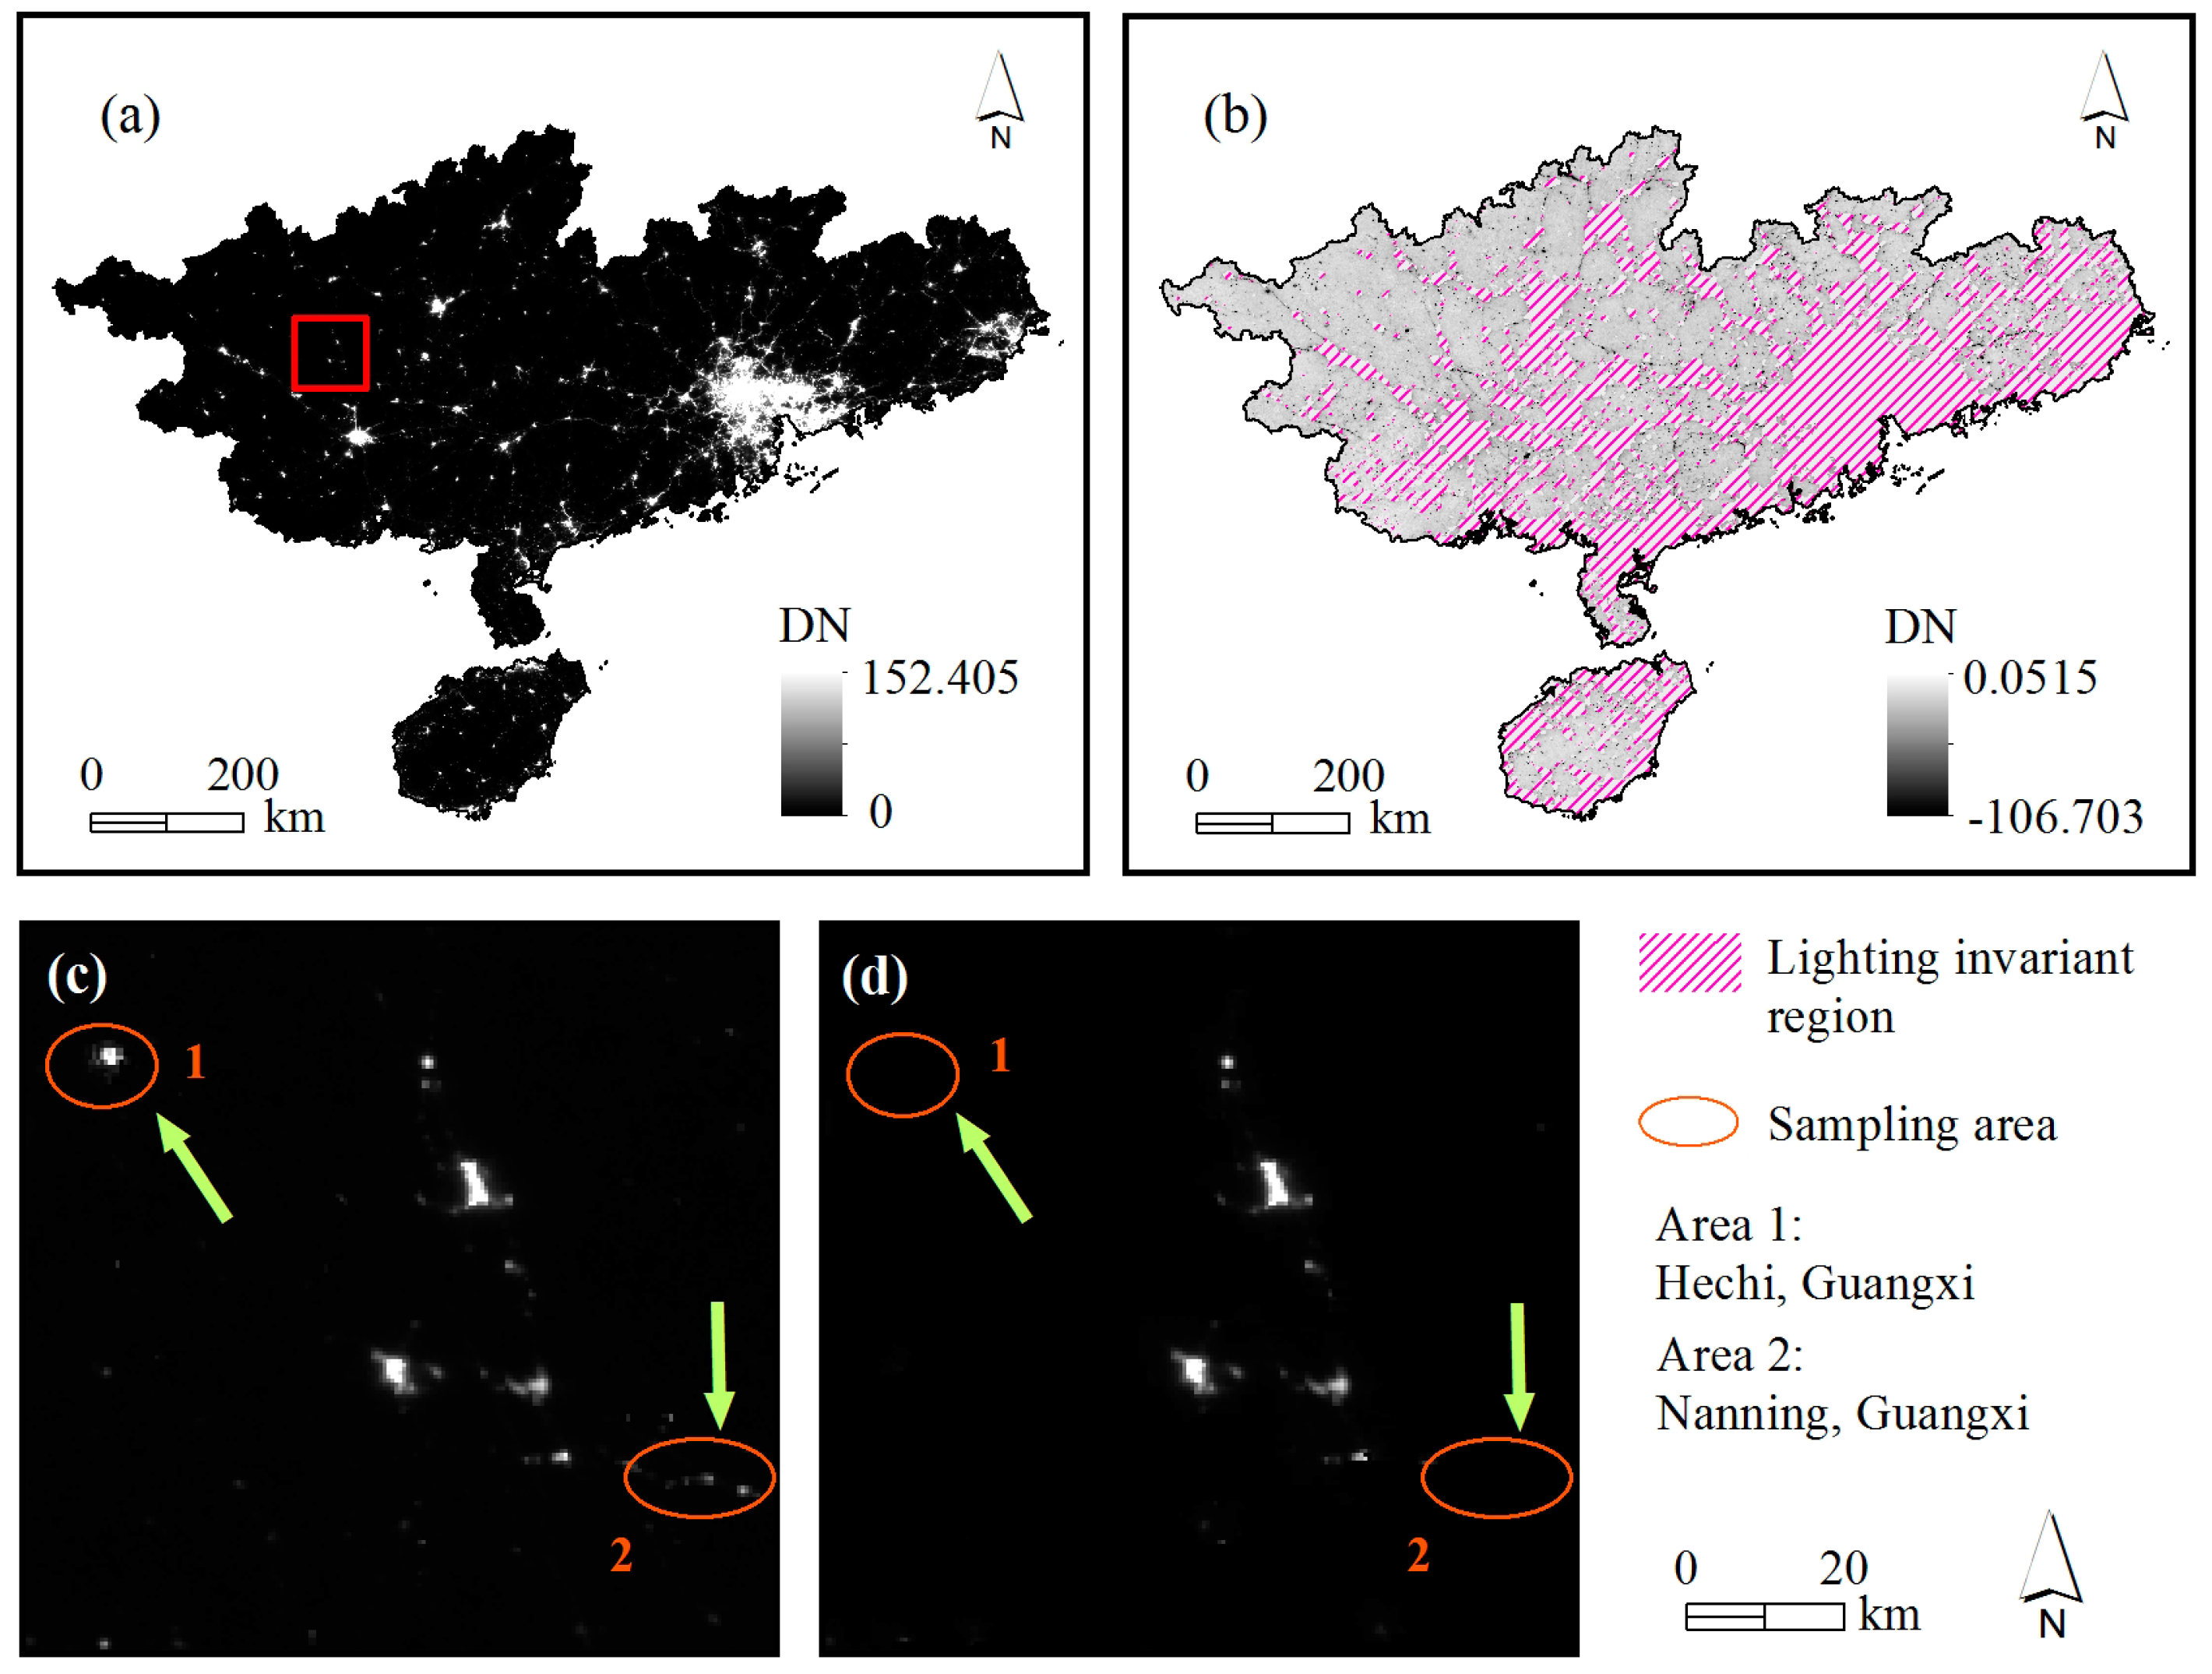
4.1. Correction Results for the VIIRS Nighttime Light Data

Figure 5a shows the corrected NPP-VIIRS data for South China in 2014. Figure 5b illustrates the difference between the lighting value of the corrected and original imagery. The region bounded by the rectangle in Figure 5a was magnified in Figure 5c and Figure 5d. As can be seen in Figure 5, the proposed lighting correction method could correct some lit areas with weak light and abnormally strong light, as well as pixels with negative DN values in the original NPP-VIIRS data. The range of difference between the corrected lighting and the original lighting was from −106.703 to 0.052, and 1,791,484 pixels were corrected. Sampling area No. 1 in Figure 5 was located in Hechi city, Guangxi Province. Some bright areas located in the northwest of Dahua County (Figure 5c) became dimmer in the corrected data (Figure 5d). The lit area No. 1 indicated by the red circle and yellow arrow in Figure 5c was the Yantan Reservoir. Lights before correction might be caused by vessels working at night. The sampling area No. 2 in Figure 5 was in Nanning city, Guangxi Province. The lit area No. 2 indicated by the red circle and yellow arrow was a state road across the southeast of Mashan county, which was removed in the corrected imagery (Figure 5d). The lit area of reservoir and state road in Figure 5 were located in suburb area, where light from vessels and vehicles were not persistent. Comparison results show that our correction method can remove the background noise and short-time lighting from VIIRS data. The corrected VIIRS data we used were focused on simulation of stable GDP and therefore might ignore that of non-persistent GDP. Because all raster were processed using a unified standard, the corrected VIIRS data should be relatively reliable for GDP estimation.

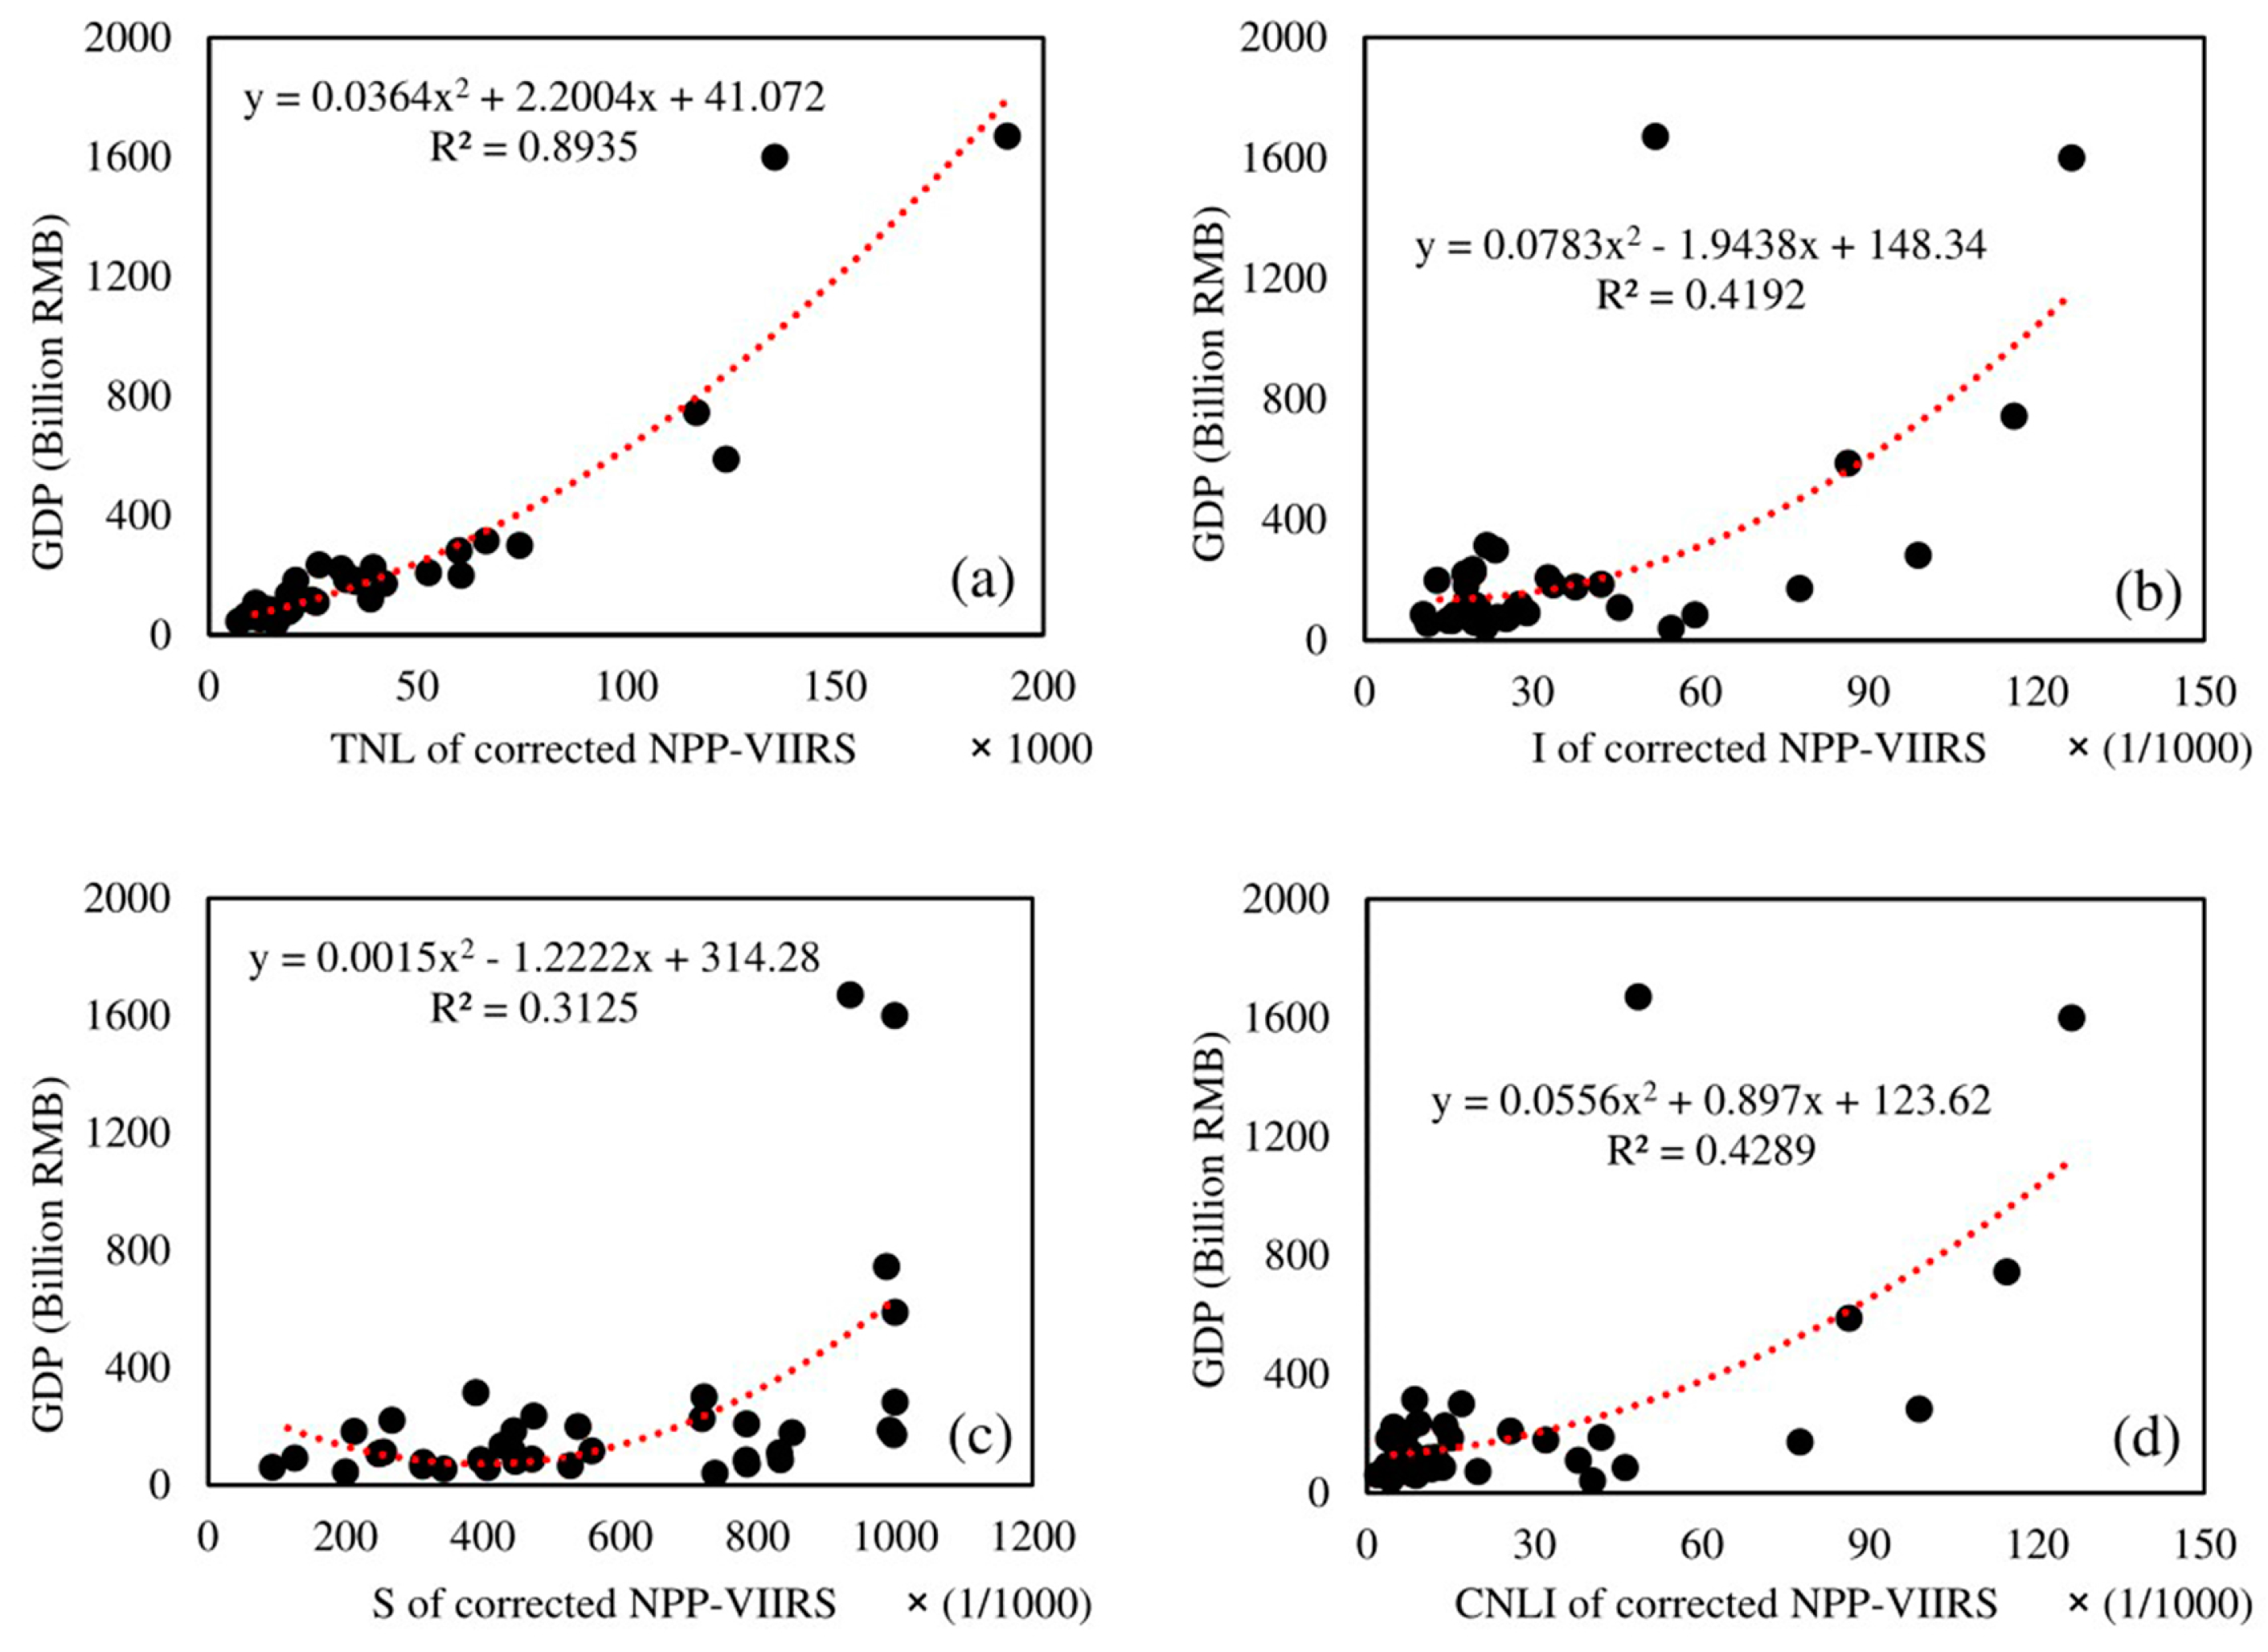
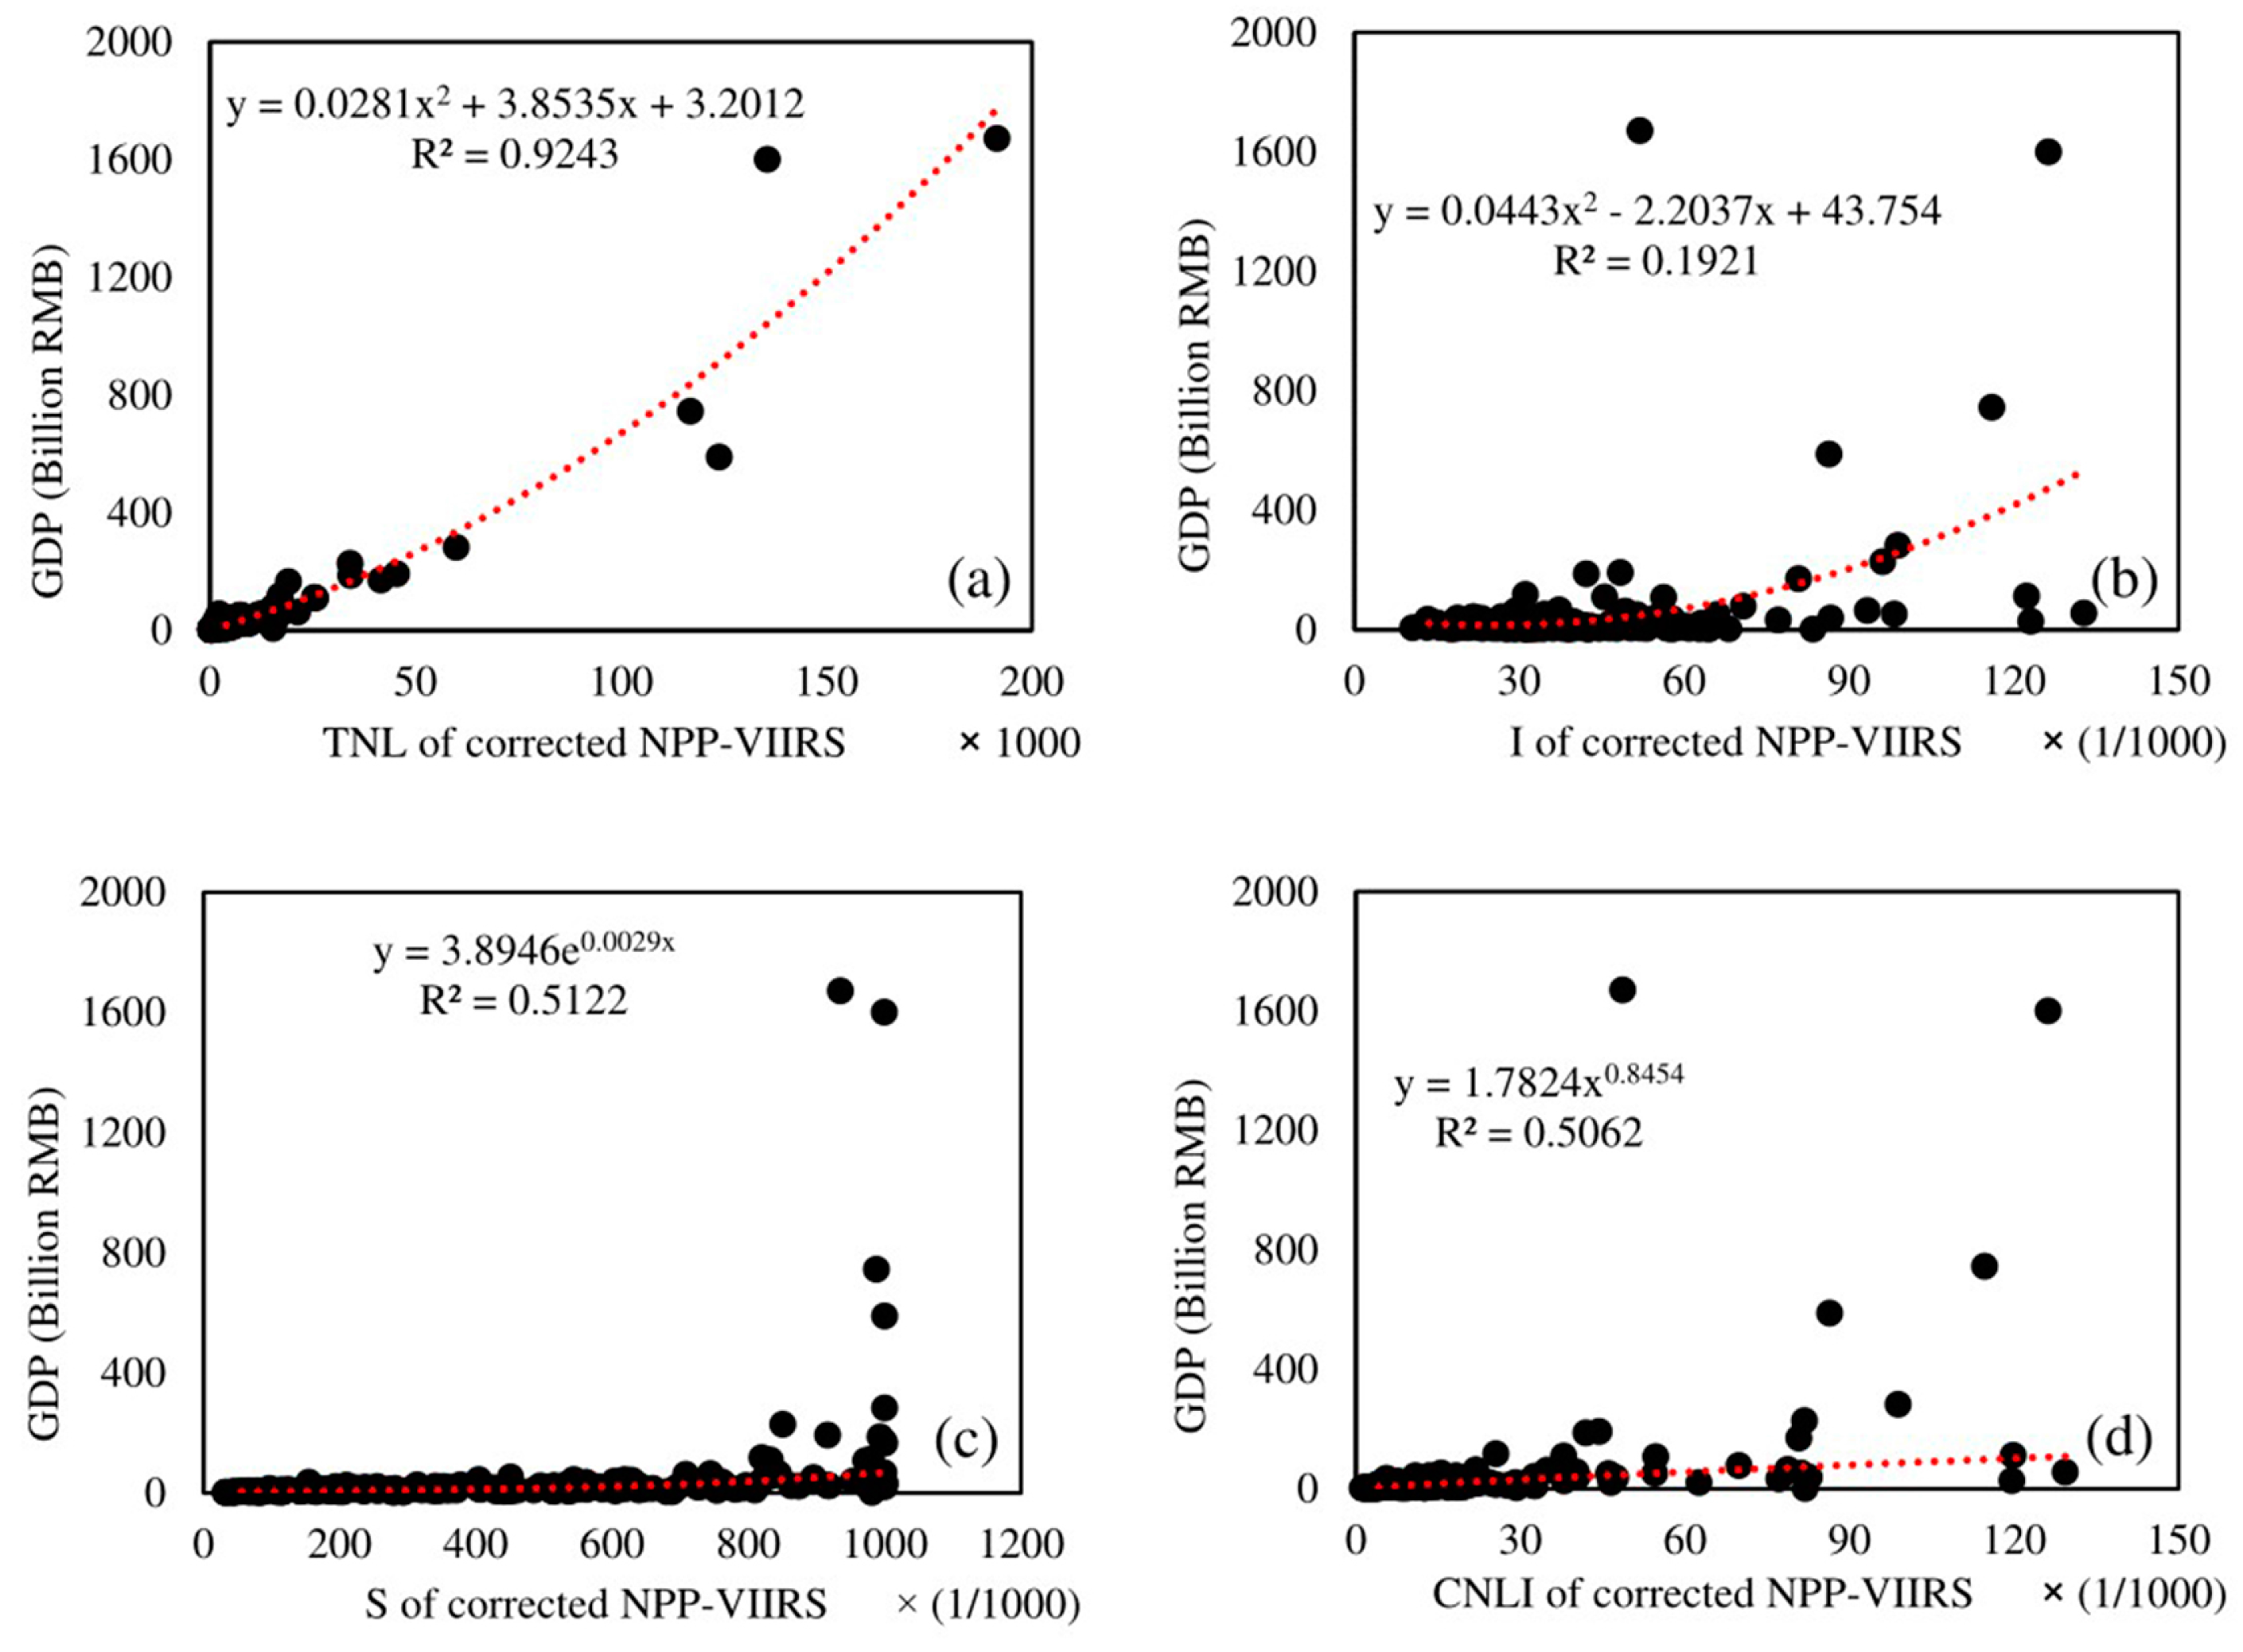
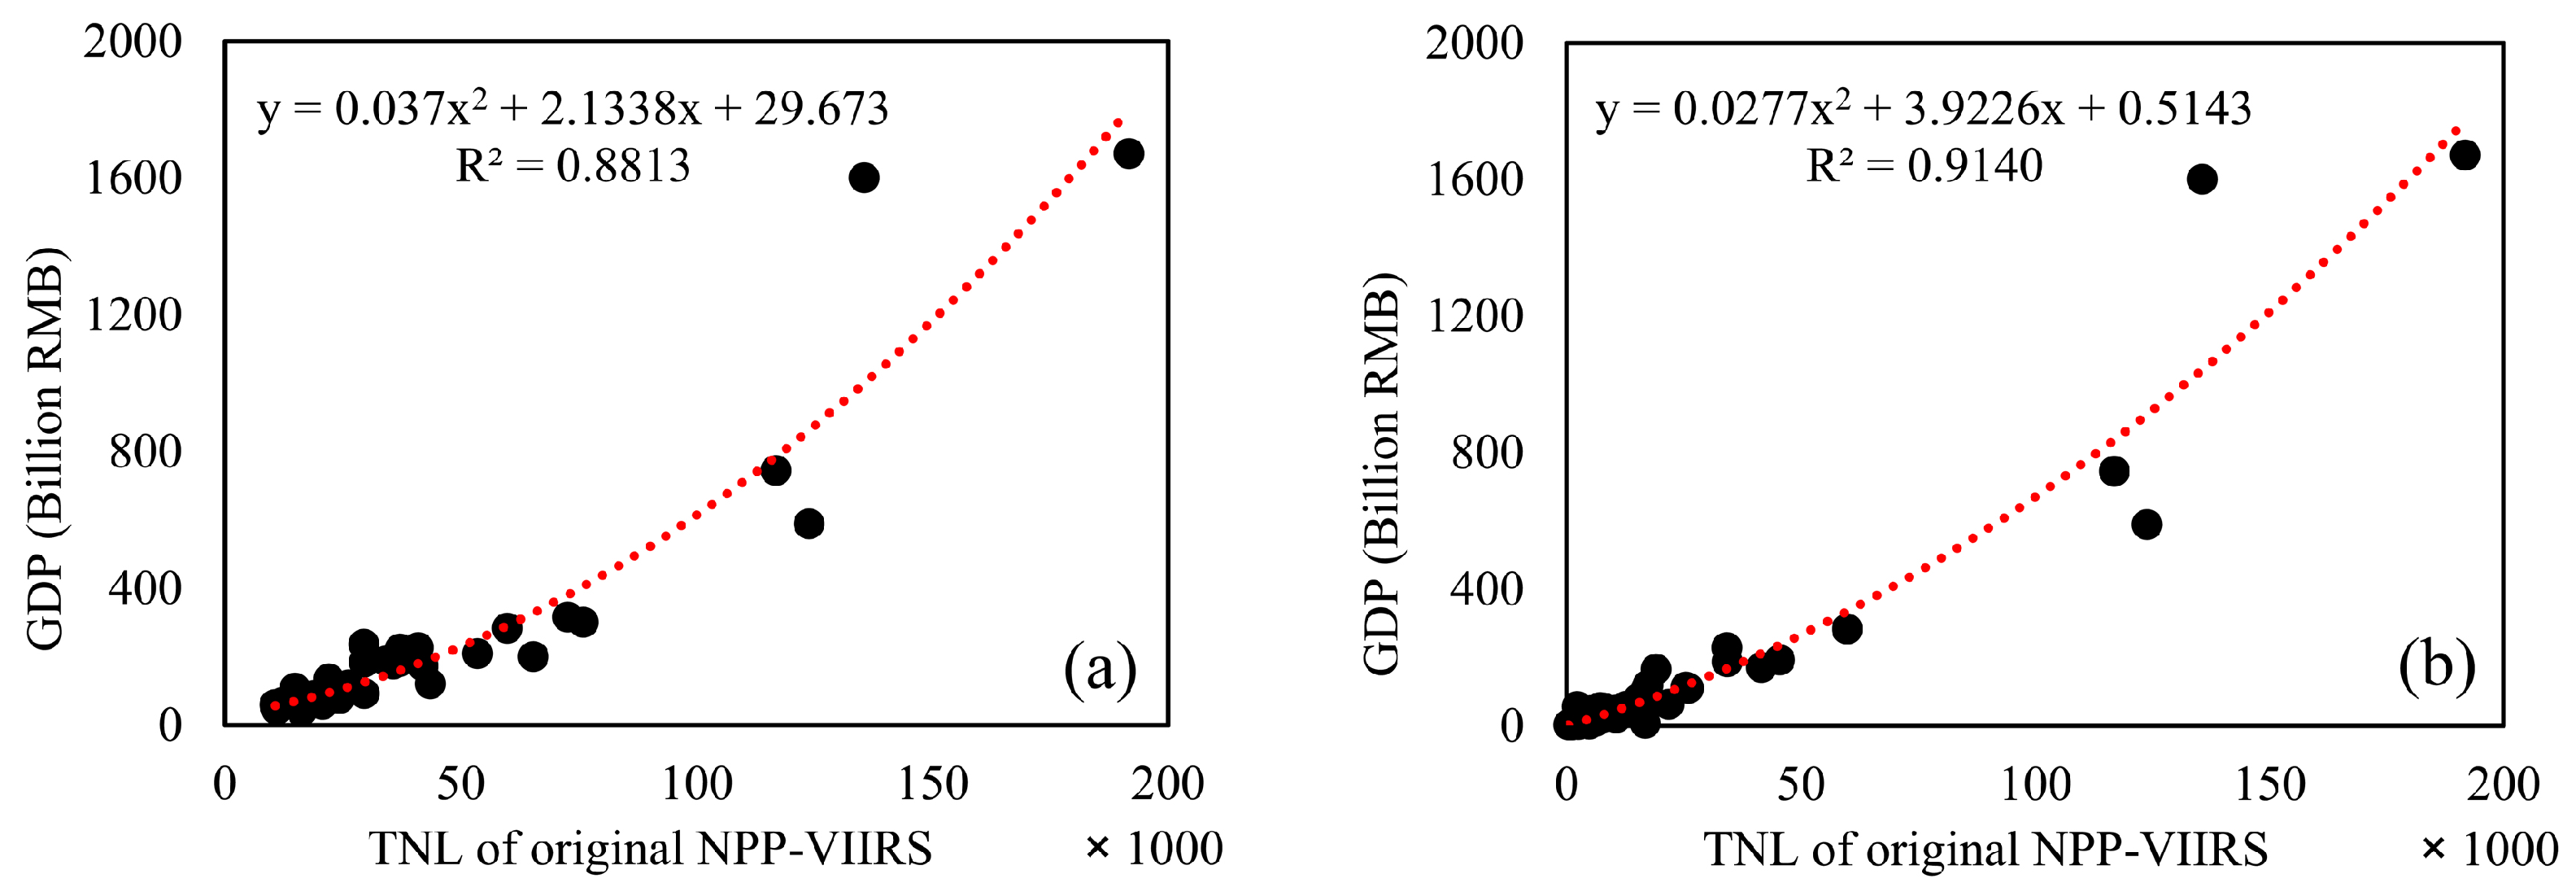
4.2. Regression Results

For the corrected NPP-VIIRS data, obvious quadratic polynomial relationships between the GDP and four light indices at the prefecture level were found (Figure 6). At the prefecture level, the R2 value of the TNL from corrected NPP-VIIRS data and GDP was 0.8935 (Figure 6a), whereas that of other indices were much lower with R2 of 0.4192, 0.3125 and 0.4289 for I, S and CNLI, respectively (Figure 6b–d). Clearly, the most significant statistical relationship between the TNL and the GDP was found at the prefectural-level scale in South China, indicating that this index is suitable for GDP estimation.
The regression results at the county level revealed various relationships between GDP and the four light indices (Figure 7). The quantitative relationship between GDP and TNL (R2 = 0.9243) was portrayed by a quadratic polynomial model (Figure 7a), whereas that between GDP and the other light indices showed weak correlations. I value showed a much weaker response to GDP (R2 = 0.1921), using a quadratic polynomial model (Figure 7b). Figure 7c represented a weak exponential relationship between GDP and S with an R2 value of 0.5122 under the best simulation. The quantitative relationship between GDP and CNLI (R2 = 0.5062) was simulated by a power function (Figure 7d). Similar to regression results at the prefecture scale, TNL was the best light index for simulating GDP at the county-level scale. Moreover, a more significant quadratic polynomial relationship between GDP and TNL at the county-level scale was found than that at the prefectural-level scale in South China (R2 = 0.9243 vs. R2 = 0.8935). The outlier in Figure 6b,d represented processed results for Guangzhou city in Guangdong province. The extremely low I and CNLI values for Guangzhou might be caused by the high value of maximum nighttime light and the large proportion of lit areas of Guangzhou in 2014 based on a combined analysis with Equations (2) and (4).
Apart from the regression analysis for the corrected NPP-VIIRS data, the TNL-GDP relationships at the prefecture and county level from the original NPP-VIIRS data were also evaluated (Figure 8). At the prefecture level, the R2 value of the TNL from the original NPP-VIIRS data and GDP was 0.8813, which was a little lower than that from the corrected data (R2 = 0.8935). Similarly, at the county level, the R2 value of the TNL from the original NPP-VIIRS data and GDP was lower than that from the corrected data (R2 = 0.9140 vs. R2 = 0.9243). In addition, a more significant quadratic polynomial relationship between the GDP and TNL at the county-level scale was found than that at the prefecture-level scale in South China (R2 = 0.9140 vs. R2 = 0.8813).
The absolute relative error (ARE) denotes the absolute value of relative error and has been widely used to further assess the capacity of the corrected and original NPP-VIIRS data in simulating GDP [11,13,27]. For ease of display, we divided the ARE into three classes: 0–25% for high accuracy, 25–50% for moderate accuracy and >50% for inaccuracy. The predictability for the corrected and original NPP-VIIRS imagery was quantified with the three indices listed in Table 2. Overall, the ARE values of the corrected VIIRS data were much lower than those of the original NPP-VIIRS data. At the prefecture level, there were 24 prefecture units with high accuracy in 38 regions (63.16%) when GDP was predicted from the corrected NPP-VIIRS data, but only 22 prefecture units with high accuracy when GDP was predicted from the original data. The ratios of the inaccurate predictions from both the corrected and original NPP-VIIRS data were the same (7.89%). At the county level, the corrected NPP-VIIRS data also showed a better capacity in simulating GDP, with 49.47% of higher accuracy compared to 46.31% from the original data. The percentage of inaccurate simulation of GDP using the corrected NPP-VIIRS data and that using the original data were the same (24.74%). Considering that the calculated ARE was based on different scales, the difference between values of the prefecture units and county units was trivial. In summary, the comparative analysis of R2 values and ARE confirmed that the corrected NPP-VIIRS data in this study were more reliable in simulating GDP at both the prefecture and county level than the original NPP-VIIRS data.

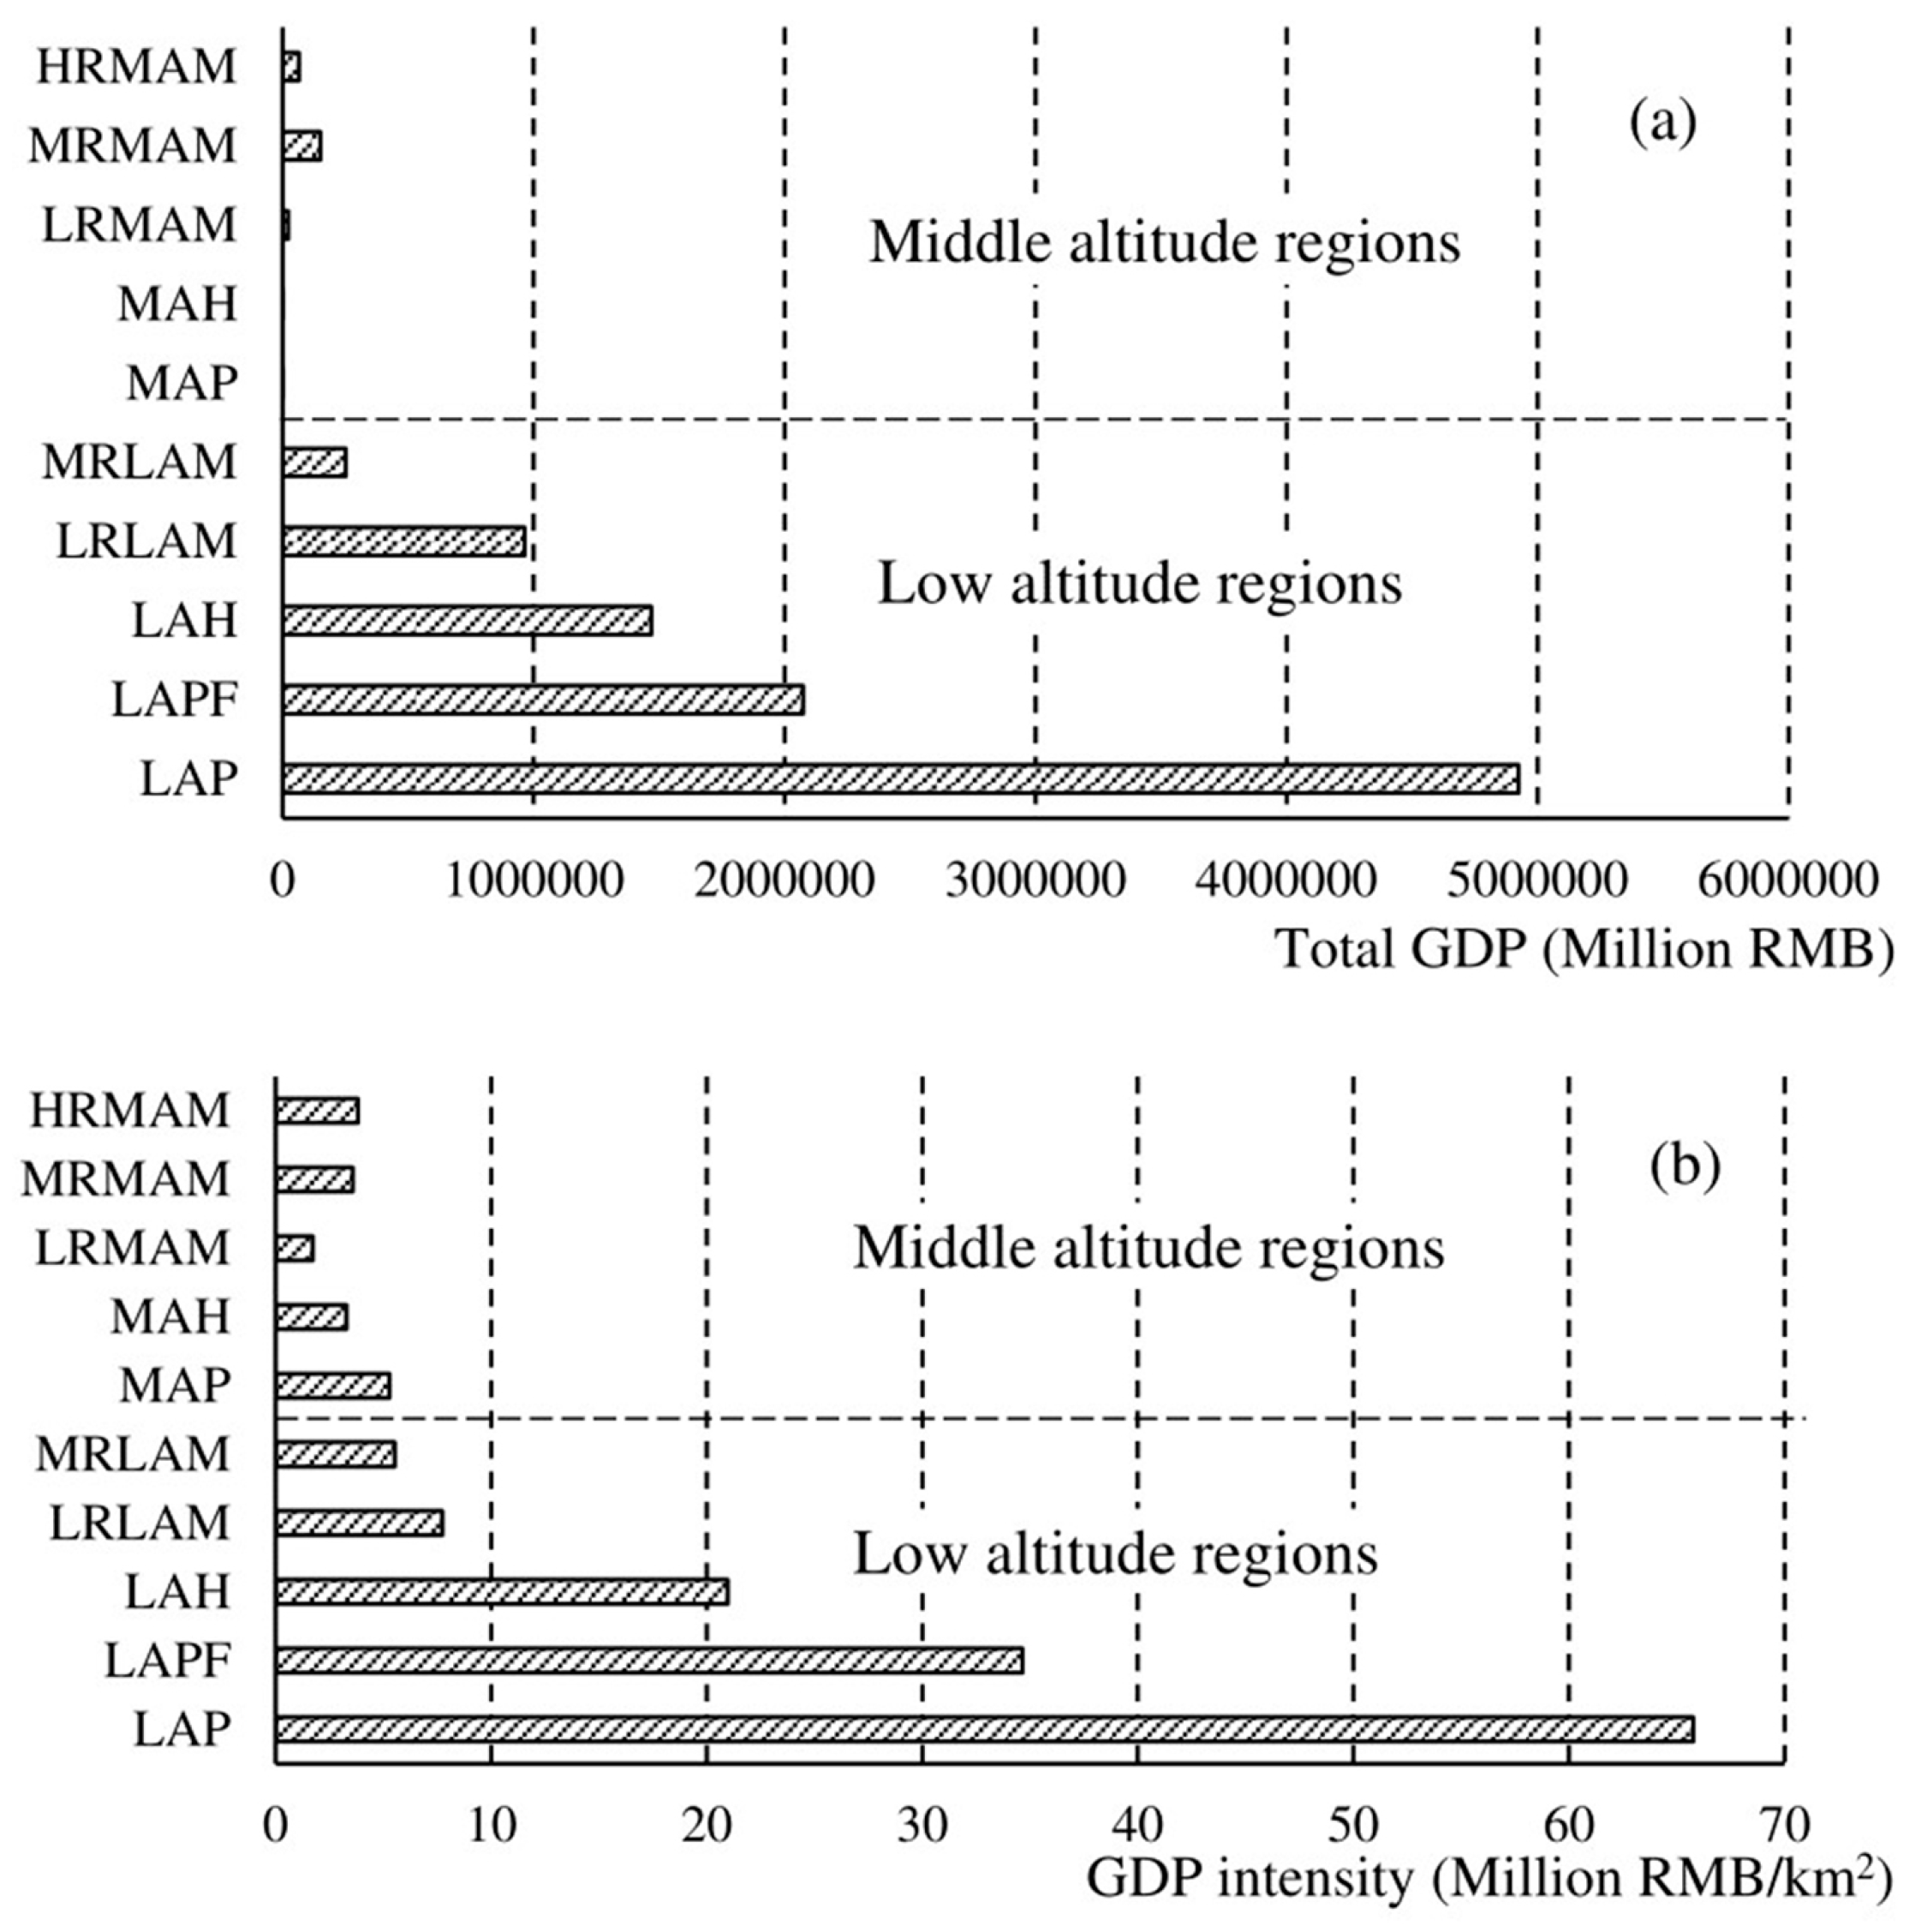
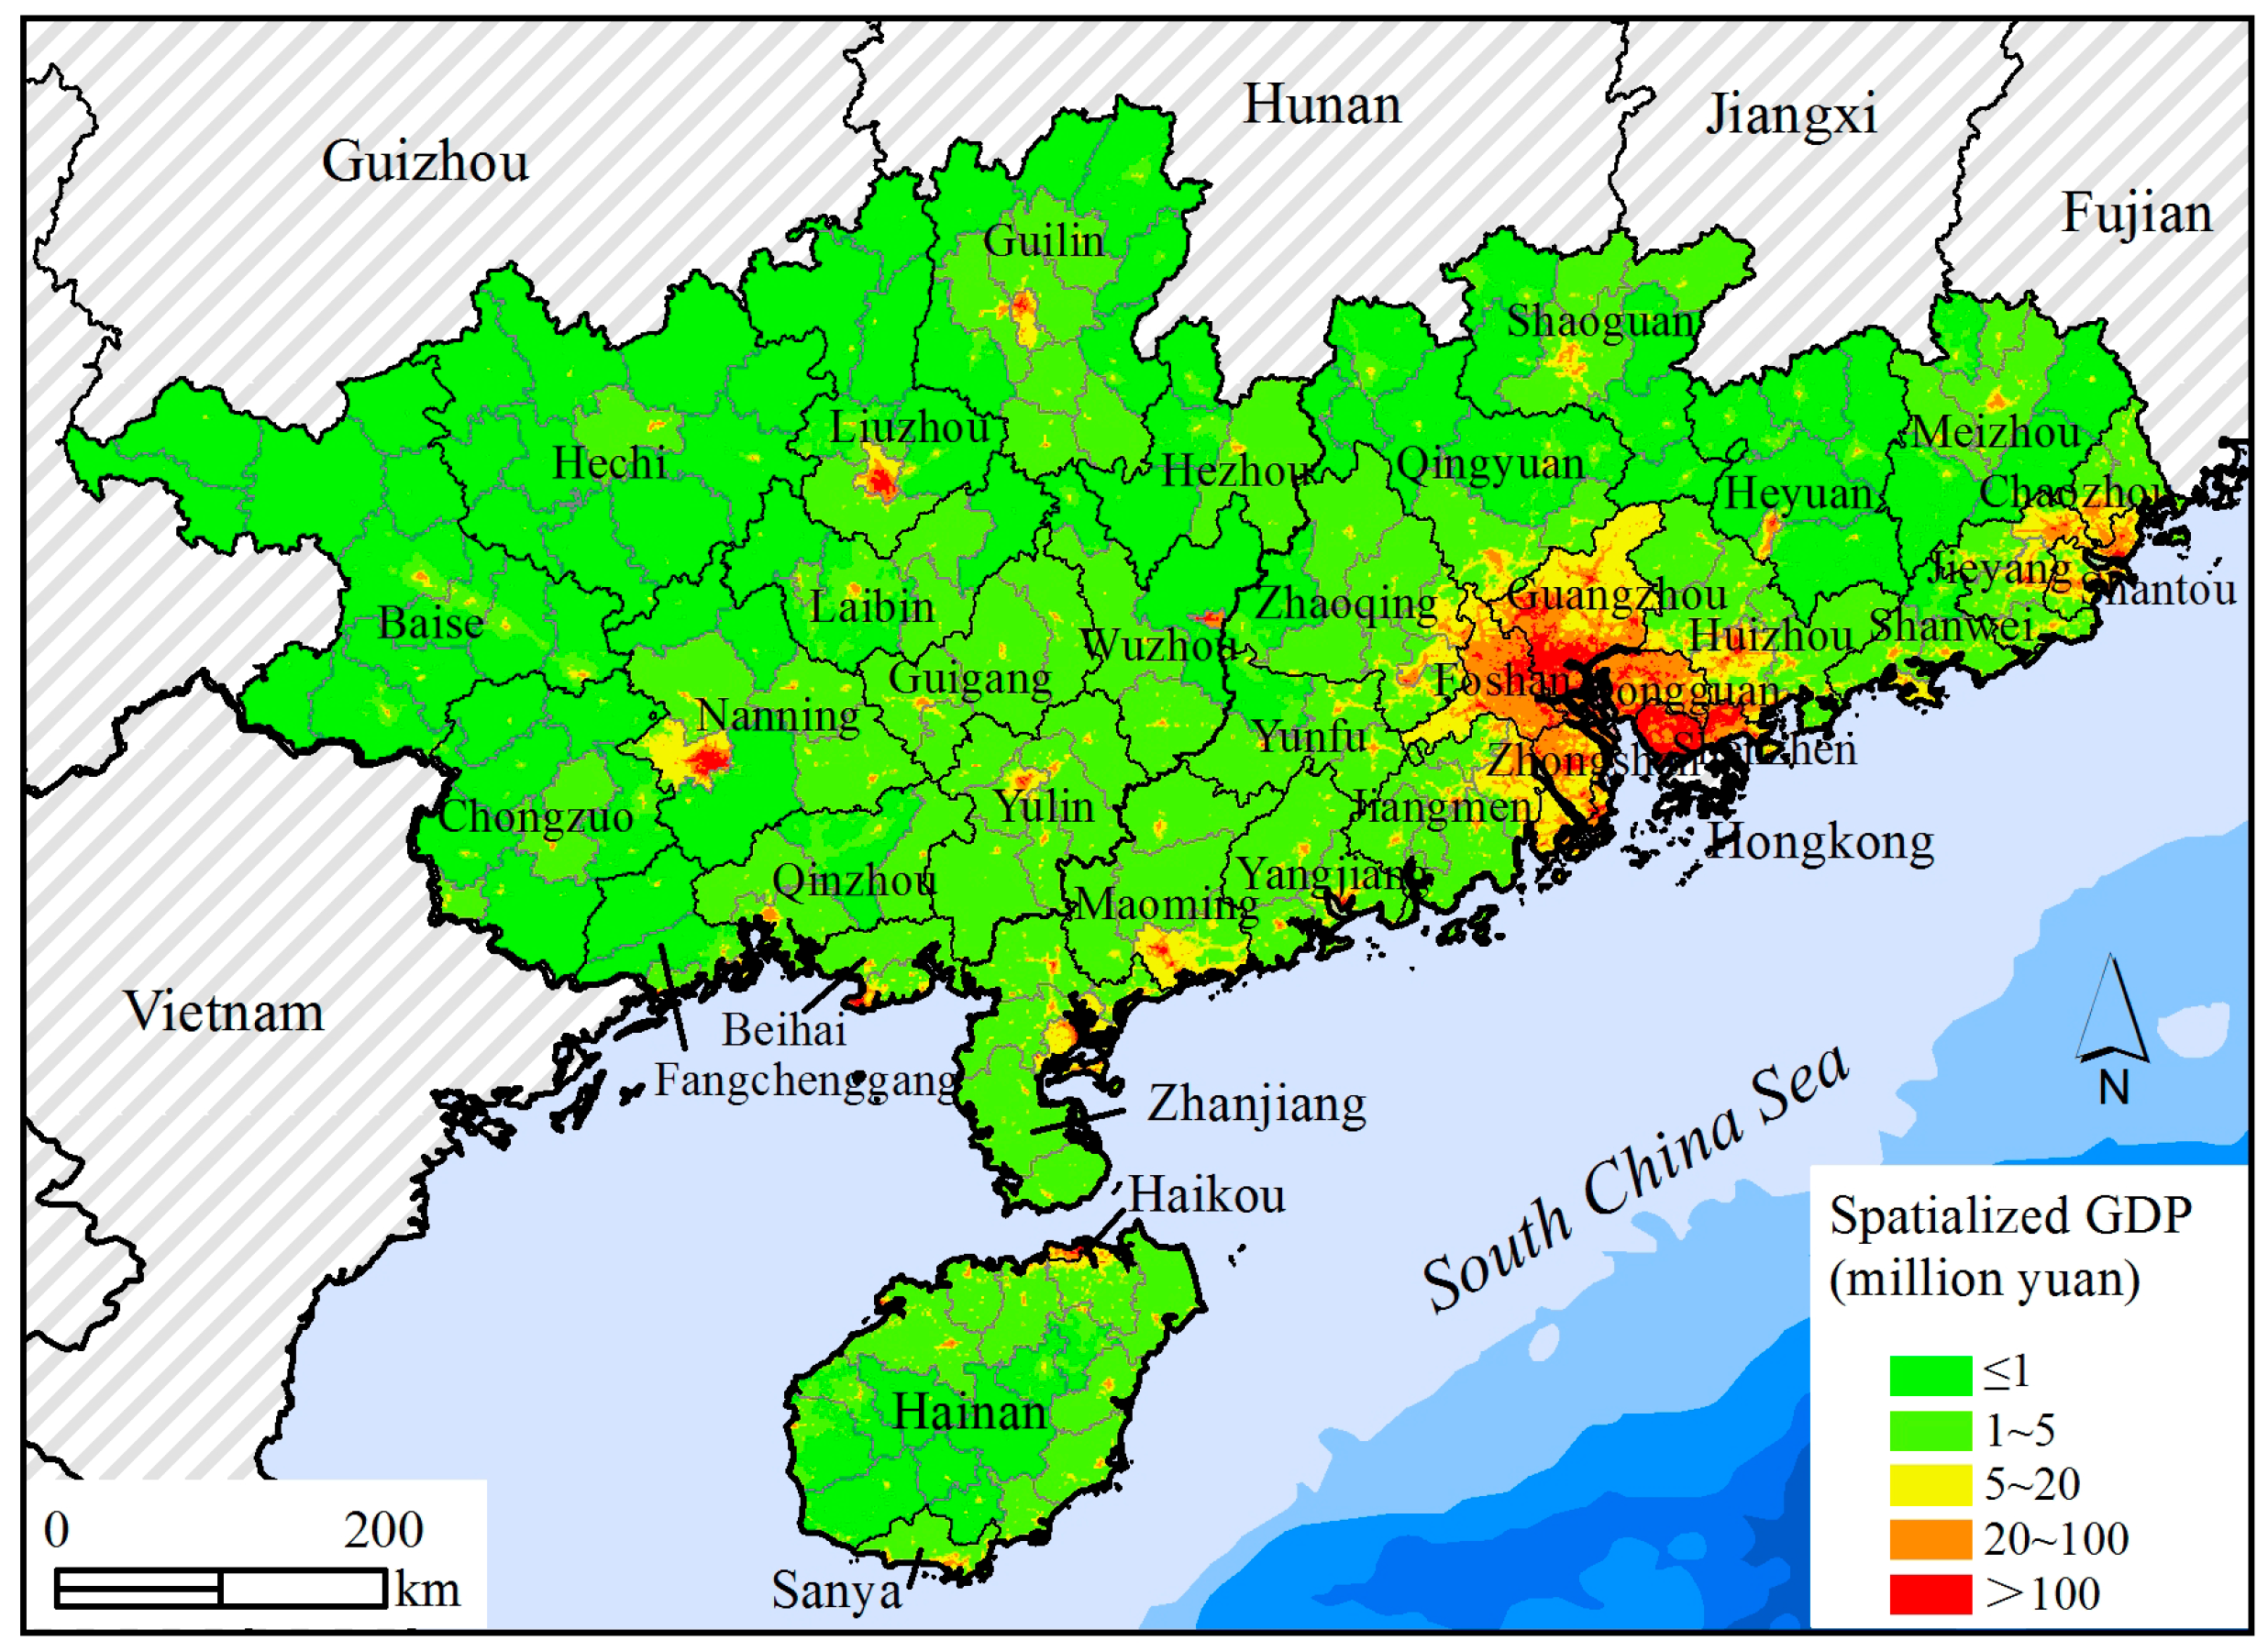
4.3. Spatialization Results

Based on the GDP spatialization model in Section 3.4, a spatial GDP map for South China in 2014 was produced using the corrected NPP-VIIRS data and the regression model at the county level. Figure 9 shows the pixel-level (500 m × 500 m) GDP map, which was simulated from the regression model firstly at county-level units and then corrected by formula (6). The high GDPs were concentrated in capital cities and developed cities for each province. The cities of Guangzhou, Foshan, Shenzhen, Dongguan and Zhongshan in Guangdong province; Nanning, Liuzhou and Guilin in Guangxi province; and Haikou in Hainan province all have different areas of high GDP regions (red regions), where high levels of urbanization and socioeconomic development were agglomerated. At the county level, the distribution of pixel-level GDP for South China in 2014 showed a certain spatial variability. County-level units with higher GDP levels were generally located in the southeast coastal areas, while those with lower GDP levels were distributed in western and northern inland areas. Each county-level unit had at least two different GDP levels, and administrative units with higher GDPs showed a more pronounced spatial heterogeneity. Moreover, GDPs in coastal regions of the Pearl River Delta were extremely high. Combined with the reality, county-level units with higher GDP levels were usually the localities of city districts, and those owing lower GDP levels far away from the red or orange areas were non-city districts.
Comparing Figure 3 and Figure 9, there seemed to be some correlation between GDP and geomorphological features. GDP values were generally high in regions with simple landforms. Figure 10 revealed the distribution characteristics of GDP within different geomorphological types in South China in the year of 2014. Both the total GDP and its intensity in the low altitude regions showed higher values than those in the middle altitude ones. The low altitude plain of South China had the largest GDP value and GDP intensity in 2014 with up to nearly 5,000,000 million Yuan and 66 million Yuan per square kilometer, respectively. Compared with GDPs in the low altitude plain, total GDP and its intensity were a bit lower in the units of other low altitude geomorphological types (low altitude platform, low altitude hill, low-relief low altitude mountain, and middle-relief low altitude mountain), and reflected a gradually declining trend. In the middle altitude regions, GDP intensity in the middle altitude plain areas was relative high, followed by middle altitude hills. In summary, during the year of 2014, the low altitude plain had the most active economic activities in South China, and low altitude regions were more economically developed than middle altitude regions. Moreover, plains and platforms were the main economic zones in South China, and the GDPs of mountainous areas remained to be developed. These results for the economic differences in different geomorphological types are consistent with our general understanding, which helps to verify the accuracy of pixel-level GDP in this study from another angle.

5. Discussion

In this study, the relationships between nighttime indices and GDP at the prefecture and county level for South China in 2014 were quantitatively assessed. Since the fit between TNL and GDP at the county level proved to be more reliable, each county-level GDP was disaggregated to an individual pixel based on pixel values of corrected NPP-VIIRS data and then a linear correction method was used for GDP spatialization. Spatial variations of GDP were clearly exhibited by the GDP map. Based on this, the difference between the spatialized GDP and statistical GDP within a prefecture unit ranged from −24,000 Yuan to 35,000Yuan, and that within a county-level unit ranged from −34,000 Yuan to 80,000 Yuan. From the regression analysis (Figure 11), we can determine that the spatialized GDP from the corrected NPP-VIIRS data in 2014 basically coincided with the GDP from the statistical yearbooks, again verifying that the pixel-level GDP could accurately reflect the real status of the economy in South China in 2014.
Although the corrected NPP-VIIRS nighttime light data improved the accuracy of GDP estimation, results of spatialized GDP still contained some uncertainties, caused by following factors. Firstly, the reliability of statistical data directly affects the accuracy of regression models and spatialized results since the statistical data are the basis for the regression analysis. Secondly, despite the preprocessing procedures used in this study to reduce the background noise from the original NPP-VIIRS data, the corrected NPP-VIIRS data still inevitably contain some noises, which may affect the GDP estimation. Thirdly, missing statistics at county-level units may also affect the accuracy of the results. For example, during the process of statistical collection and consolidation, statistical data of a few county-level units within the same prefecture-level units were missing. To match the available statistical GDP to the boundaries of administrative units as closely as possible, county-level units with missing data, located in the same prefecture-level unit, were merged to generate a new county-level unit. Thus, the total GDP of the new unit was calculated by the total GDP of prefecture-level unit and the GDPs of county-level units, which may cause the confusion of data scale. Fourthly, using VIIRS single data, it is difficult to fully and accurately express the spatial heterogeneity of GDP distribution, and may lead to an overestimation or underestimation of GDP at the local area. For areas where steel and thermal power generation are the main industries, the local high lighting may lead to a GDP overvaluation, while for areas dominated by industries of coal and iron ore, lighting cannot fully reflect GDP output, resulting in a lower estimation of GDP. In summary, it is likely to enhance the accuracy of GDP estimation by improving the availability and quality of statistical data and NPP-VIIRS data, introducing multi-source data and optimizing the methods of nighttime light data correction. In addition, responses of NPP-VIIRS nighttime light data to economic activities vary across study areas, scales and periods. Understanding how to quantify the diverse relationships between light brightness and economic parameters and build a common model for all cases may be the key issue for the evaluation of regional GDP in a quick and reliable way.
The major contributions of this study are twofold. Firstly, previous studies have used linear or log-linear models to statistically fit the relationships between the locally average or total nighttime light radiance and corresponding socioeconomic variables across the county-level, prefecture-level and province-level scales, whereas this research calculated common nighttime light indices of statistical units at different scales and explored the best fitting model for each case. Accordingly, the notable advantage of TNL in predicting GDP was verified and the quadratic polynomial model was proved to be more suitable in fitting the relationships between locally TNL and GDP rather than the simple linear relationship used in previous studies. Secondly, although the utility of NPP-VIIRS nighttime light data for assessing economic activities has been extensively verified through the significant correlations of nighttime light brightness and corresponding economic variables, no research has reported the ability of NPP-VIIRS data to estimate pixel-level GDP. The spatialized GDP in this study was obtained through linear correction, which greatly reduced the deviation of pixel-level GDP simulated by the pixel value of light brightness. The spatialization of GDP provides more accurate and efficient data sources for GDP statistics at pixel-level scales, which will benefit a comprehensive understanding of the dynamics of local economies and the decision making for sustainable economic development.
When analyzing the economic spatial distribution of South China, we mainly focused on the economic differences among diverse geomorphological types. Compared to the influence of anthropogenic factors, that of topography and geomorphology on economic development has gradually declined. However, no previous study has clearly demonstrated that the role of landform can be ignored. Although it seems that we did not find any new findings from the quantitative results in 2014, with the accelerated urbanization and industrial transformation, analysis on long-term spatial-temporal differences of economic status among different geomorphological types would help to obtain valuable findings, which is of great significance for regional sustainable development.
Since statistical data in 2015 were not available at the beginning of this experiment, the statistical data and monthly NPP-VIIRS nighttime light images in 2014 were selected to study the latest economic pattern of South China. Currently, a series of NPP-VIIRS data are available including monthly composites from April 2012 to November 2016. As NOAA/NGDC is working to produce more NPP-VIIRS data with higher quality, further research can be focused on multi-temporal image analysis for revealing the spatiotemporal patterns of GDP. In addition, other types of data, including geomorphological data, land cover data, population data, disaster data, and ecological data shall be applied to study economic development and its impact on the ecological environment and human activities, and to explore the coupled mechanism between economic development and ecological environment.

6. Conclusions

GDP is an important indicator for reflecting the intensity of economic activities, and the spatialization of GDP can provide an important basis for the overlay analysis of natural and human factors. In this study, composite annual NPP-VIIRS data were obtained by averaging the pixel brightness of monthly NPP-VIIRS nighttime light data. As the composite NPP-VIIRS data are a preliminary product, a sequence of correction procedures were employed to reduce the background noises and high-value anomalies. Based on the corrected NPP-VIIRS data, optimal regression models between the nighttime light indices and corresponding GDP statistical data at both the prefecture and county level were established. Through the analysis of estimated results, the best regression model was selected to spatialize the GDP, and the spatial distribution of GDP was produced based on a pixel size of 500 m × 500 m in South China in 2014. Finally, using the basic geomorphological types in South China, we analyzed the spatial characteristics of GDP within different geomorphological units in South China to explore the intensity of economic activities under different geomorphological environments.
The TNL brightness was found to exhibit a strong capacity in reflecting the real status of the regional economy. Quadratic polynomial relationships were found between the TNL brightness of NPP-VIIRS data and the corresponding GDP at both prefecture level and county level in the case study for South China, among which the corrected NPP-VIIRS nighttime light data showed a better fit than the original data, and the county-level fit was better than the prefecture-level fit.
The linearized correction of the simulated GDP greatly improved the accuracy of GDP estimation, resulting in a more realistic and detailed reflection of the spatial distribution of GDP in South China in 2014. The GDP of coastal areas was generally higher than that of inland areas, and the economy of the Pearl River Delta region was extremely active.
The total GDP and its intensity in the low altitude region of South China were significantly higher than those in the middle altitude region. Compared with platforms, hills and mountains, the economy in plains was more active, especially plains in the low altitude region. The low altitude plain was the most economically developed area in South China, followed by low altitude platforms and low altitude hills. Economic development in the middle altitude region and low altitude hills and mountains remained to be strengthened. These results are consistent with our general understandings, and will contribute to verifying the accuracy of pixel-level GDP from another angle.

Acknowledgments

The authors express gratitude to Yongbo Liu at University of Guelph, Canada and anonymous reviewers for improving the manuscript. This study was supported by the Surveying and Mapping Geoinformation Nonprofit Specific Project (201512033), the Major State Basic Research Development Program of China (2015CB954101), and the National Natural Science Foundation of China (41171332 and 41571388).

Author Contributions

Min Zhao and Weiming Cheng conceived and designed the experiments; Min Zhao and Chenghu Zhou performed the experiments; Zhao Min, Weiming Cheng, Chenghu Zhou, and Manchun Li analyzed the data; and Min Zhao, Weiming Cheng, Nan Wang and Qiangyi Liu wrote the paper.

Conflicts of Interest

The authors declare no conflict of interest.

Appendix

Table A1. A list of the prefecture-level and county-level administrative units for South China. The county-level units we used are in the last column.
ProvincePrefecture-Level UnitOriginal County-Level UnitFinal County-Level Unit
GuangdongGuangzhouGuangzhou MunicipalityGuangzhou and Zengcheng and Conghua
GuangdongGuangzhouZengcheng Municipality
GuangdongGuangzhouConghua Municipality
GuangdongShaoguanShaoguan MunicipalityShaoguan and Qujiang
GuangdongShaoguanQujiang County
GuangdongShaoguanShixing CountyShixing County
GuangdongShaoguanRenhua CountyRenhua County
GuangdongShaoguanWengyuan CountyWengyuan County
GuangdongShaoguanRuyuan Yao A.C.Ruyuan Yao A.C.
GuangdongShaoguanXinfeng CountyXinfeng County
GuangdongShaoguanLechang MunicipalityLechang Municipality
GuangdongShaoguanNanxiong MunicipalityNanxiong Municipality
GuangdongShenzhenShenzhen MunicipalityShenzhen Municipality
GuangdongZhuhai Zhuhai MunicipalityZhuihai Municipality
GuangdongShantouShantou MunicipalityShantou Municipality
GuangdongShantouNan’ao CountyNan’ao County
GuangdongFoshanFoshan MunicipalityFoshan Municipality
GuangdongJiangmenJiangmen MunicipalityJiangmen Municipality
GuangdongJiangmenTaishan MunicipalityTaishan Municipality
GuangdongJiangmenKaiping MunicipalityKaiping Municipality
GuangdongJiangmenHeshan MunicipalityHeshan Municipality
GuangdongJiangmenEnping MunicipalityEnping Municipality
GuangdongZhanjiangZhanjiang MunicipalityZhanjiang Municipality
GuangdongZhanjiangSuixi CountySuixi County
GuangdongZhanjiangXuwen CountyXuwen County
GuangdongZhanjiangLianjiang MunicipalityLianjiang Municipality
GuangdongZhanjiangLeizhou MunicipalityLeizhou Municipality
GuangdongZhanjiangWuchuan MunicipalityWuchuan Municipality
GuangdongMaomingMaoming MunicipalityMaoming and Dianbai
GuangdongMaomingDianbai County
GuangdongMaomingGaozhou MunicipalityGaozhou Municipality
GuangdongMaomingHuazhou MunicipalityHuazhou Municipality
GuangdongMaomingXinyi MunicipalityXinyi Municipality
GuangdongZhaoqingZhaoqing MunicipalityZhaoqing Municipality
GuangdongZhaoqingGuangning CountyGuangning County
GuangdongZhaoqingHuaiji CountyHuaiji County
GuangdongZhaoqingFengkai CountyFengkai County
GuangdongZhaoqingDeqing CountyDeqing County
GuangdongZhaoqingGaoyao MunicipalityGaoyao Municipality
GuangdongZhaoqingSihui MunicipalitySihui Municipality
GuangdongHuizhouHuizhou MunicipalityHuizhou Municipality
GuangdongHuizhouBoluo CountyBoluo County
GuangdongHuizhouHuidong CountyHuidong County
GuangdongHuizhouLongmen CountyLongmen County
GuangdongMeizhouMeizhou MunicipalityMeizhou and Mei
GuangdongMeizhouMei County
GuangdongMeizhouDapu CountyDapu County
GuangdongMeizhouFengshun CountyFengshun County
GuangdongMeizhouWuhua CountyWuhua County
GuangdongMeizhouPingyuan CountyPingyuan County
GuangdongMeizhouJiaoling CountyJiaoling County
GuangdongMeizhouXingning MunicipalityXingning Municipality
GuangdongShanweiShanwei MunicipalityShanwei Municipality
GuangdongShanweiHaifeng CountyHaifeng County
GuangdongShanweiLuhe CountyLuhe County
GuangdongShanweiLufeng MunicipalityLufeng Municipality
GuangdongHeyuanHeyuan MunicipalityHeyuan Municipality
GuangdongHeyuanZijin CountyZijin County
GuangdongHeyuanLongchuan CountyLongchuan County
GuangdongHeyuanLianping CountyLianping County
GuangdongHeyuanHeping CountyHeping County
GuangdongHeyuanDongYuan CountyDongYuan County
GuangdongYangjiangYangjiang MunicipalityYangjiang and Yangdong
GuangdongYangjiangYangdong County
GuangdongYangjiangYangxi CountyYangxi County
GuangdongYangjiangYangchun MunicipalityYangchun Municipality
GuangdongQingyuanQingyuan MunicipalityQiangyuan and Qingxin
GuangdongQingyuanQingxin County
GuangdongQingyuanFogang CountyFogang County
GuangdongQingyuanYangshan CountyYangshan County
GuangdongQingyuanLianshan Zhuang and Yao A.C.Lianshan Zhuang and Yao A.C.
GuangdongQingyuanLiannan Yao A.C.Liannan Yao A.C.
GuangdongQingyuanYingde MunicipalityYingde Municipality
GuangdongQingyuanLianzhou MunicipalityLianzhou Municipality
GuangdongDongguanDongguan MunicipalityDongguan Municipality
GuangdongZhongshanZhongshan MunicipalityZhongshan Municipality
GuangdongChaozhouChaozhou MunicipalityChaozhou and Chaoan
GuangdongChaozhouChaoan County
GuangdongChaozhouRaoping CountyRaoping County
GuangdongJieyangJieyang MunicipalityJieyang and Jiedong
GuangdongJieyangJiedong County
GuangdongJieyangJiexi CountyJiexi County
GuangdongJieyangHuilai CountyHuilai County
GuangdongJieyangPuning MunicipalityPuning Municipality
GuangdongYunfuYunfu MunicipalityYunfu and Yun’an
GuangdongYunfuYun’an County
GuangdongYunfuXinxing CountyXinxing County
GuangdongYunfuYu’nan CountyYu’nan County
GuangdongYunfuLuoding MunicipalityLuoding Municipality
GuangxiNanningNanning MunicipalityNanning Municipality
GuangxiNanningYongning CountyYongning County
GuangxiNanningWuming CountyWuming County
GuangxiNanningLongan CountyLongan County
GuangxiNanningMashan CountyMashan County
GuangxiNanningShanglin CountyShanglin County
GuangxiNanningBinyang CountyBinyang County
GuangxiNanningHeng CountyHeng County
GuangxiLiuzhou Liuzhou MunicipalityLiuzhou Municipality
GuangxiLiuzhouLiujiang CountyLiujiang County
GuangxiLiuzhouLiucheng CountyLiucheng County
GuangxiLiuzhouLuzhai CountyLuzai County
GuangxiLiuzhouRongan CountyRongan County
GuangxiLiuzhouRongshui Miao A.C.Rongshui Miao A.C.
GuangxiLiuzhouSanjiang Dong A.C.Sanjiang Dong A.C.
GuangxiGuilinGuilin MunicipalityGuilin Municipality
GuangxiGuilinYangshuo CountyYangshuo County
GuangxiGuilinLingui CountyLingui County
GuangxiGuilinLingchuan CountyLingchuan County
GuangxiGuilinQuanzhou CountyQuanzhou County
GuangxiGuilinXing’an CountyXing’an County
GuangxiGuilinYongfu CountyYongfu County
GuangxiGuilinGuanyang CountyGuanyang County
GuangxiGuilinLongsheng Ge A.C.Longsheng Ge A.C.
GuangxiGuilinZiyuan CountyZiyuan County
GuangxiGuilinPingle CountyPingle County
GuangxiGuilinLipu CountyLipu County
GuangxiGuilinGongcheng Yao A.C.Gongcheng Yao A.C.
GuangxiWuzhouWuzhou MunicipalityWuzhou Municipality
GuangxiWuzhouCangwu CountyCangwu County
GuangxiWuzhouTeng CountyTeng County
GuangxiWuzhouMengshan CountyMengshan County
GuangxiWuzhouCenxi MunicipalityCenxi Municipality
GuangxiBeihaiBeihai MunicipalityBeihai Municipality
GuangxiBeihaiHepu CountyHepu County
GuangxiFangchenggangFangchenggang MunicipalityFangchenggang Municipality
GuangxiFangchenggangFangcheng DistrictFangcheng District
GuangxiFangchenggangShangsi CountyShangsi County
GuangxiFangchenggangDongxing MunicipalityDongxing Municipality
GuangxiQinzhouQinzhou MunicipalityQinzhou Municipality
GuangxiQinzhouQinbei DistrictQinbei District
GuangxiQinzhouLingshan CountyLingshan County
GuangxiQinzhouPubei CountyPubei County
GuangxiGuigangGuigang MunicipalityGuigang Municipality
GuangxiGuigangGangbei DistrictGangbei and Qintang
GuangxiGuigangQintang District
GuangxiGuigangPingnan CountyPingnan County
GuangxiGuigangGuiping MunicipalityGuiping Municipality
GuangxiYulinYulin MunicipalityYulin Municipality
GuangxiYulinRong CountyRong County
GuangxiYulinLuchuan CountyLuchuan County
GuangxiYulinBobai CountyBobai County
GuangxiYulinXingye CountyXingye County
GuangxiYulinBeiliu MunicipalityBeiliu Municipality
GuangxiBaise Baise MunicipalityBaise Municipality
GuangxiBaiseTianyang CountyTianyang County
GuangxiBaiseTiandong CountyTiandong County
GuangxiBaisePingguo CountyPingguo County
GuangxiBaiseDebao CountyDebao County
GuangxiBaiseJingxi CountyJingxi County
GuangxiBaiseNapo CountyNapo County
GuangxiBaiseLingyun CountyLingyun County
GuangxiBaiseLeye CountyLeye County
GuangxiBaiseTianlin CountyTianlin County
GuangxiBaiseXilin CountyXilin County
GuangxiBaiseLonglin Ge A.C.Longlin Ge A.C.
GuangxiHezhouHezhou MunicipalityHezhou Municipality
GuangxiHezhouZhaoping CountyZhaoping County
GuangxiHezhouZhongshan CountyZhongshan County
GuangxiHezhouFuchuan Yao A.C.Fuchuan Yao A.C.
GuangxiHechiHechi MunicipalityHechi Municipality
GuangxiHechiNandan CountyNandan County
GuangxiHechiTiane CountyTiane County
GuangxiHechiFengshan CountyFengshan County
GuangxiHechiDonglan CountyDonglan County
GuangxiHechiLuocheng Mulao A.C.Luocheng Mulao A.C.
GuangxiHechiHuanjiang Maonan A.C.Huangjiang Maonan A.C.
GuangxiHechiBama Yao A.C.Bama Yao A.C.
GuangxiHechiDu’an Yao A.C.Du’an Yao A.C.
GuangxiHechiDahua Yao A.C.Dahua Yao A.C.
GuangxiHechiYizhou MunicipalityYizhou Municipality
GuangxiLaibinLaibin MunicipalityLaibin Municipality
GuangxiLaibinXincheng CountyXincheng County
GuangxiLaibinXiangzhou CountyXiangzhou County
GuangxiLaibinWuxuan CountyWuxuan County
GuangxiLaibinJinxiu Yao A.C.Jinxiu Yao A.C.
GuangxiLaibinHeshan MunicipalityHeshan Municipality
GuangxiChongzuoChongzuo MunicipalityChongzuo Municipality
GuangxiChongzuoFusui CountyFusui County
GuangxiChongzuoNingming CountyNingming County
GuangxiChongzuoLongzhou CountyLongzhou County
GuangxiChongzuoDaxin CountyDaxin County
GuangxiChongzuoTiandeng CountyTiandeng County
GuangxiChongzuoPingxiang MunicipalityPingxiang Municipality
Hainan HaikouHaikou MunicipalityHaikou Municipality
HainanSanyaSanya MunicipalitySanya Municipality
HainanProvincial countyWuzhishan MunicipalityWuzhishan Municipality
HainanProvincial countyQionghai MunicipalityQionghai Municipality
HainanProvincial countyDanzhou MunicipalityDanzhou Municipality
HainanProvincial countyWenchang MunicipalityWenchang Municipality
HainanProvincial countyWanning MunicipalityWanning Municipality
HainanProvincial countyDongfang MunicipalityDongfang Municipality
HainanProvincial countyDing’an CountyDing’an County
HainanProvincial countyTunchang CountyTunchang County
HainanProvincial countyChengmai CountyChengmai County
HainanProvincial countyLingao CountyLingao County
HainanProvincial countyBaisha Li A.C.Baisha Li A.C.
HainanProvincial countyChangjiang Li A.C.Changjiang Li A.C.
HainanProvincial countyLedong Li A.C.Ledong Li A.C.
HainanProvincial countyLingshui Li A.C.Lingshui Li A.C.
HainanProvincial countyBaoting Li and Miao A.C.Baoting Li and Miao A.C.
HainanProvincial countyQiongzhong Li and Miao A.C.Qiongzhong Li and Miao A.C.
1 A.C. is the abbreviation of Autonomous County.

References

  1. Elvidge, C.D.; Baugh, K.E.; Kihn, E.A.; Kroehl, H.W.; Davis, E.R.; Davis, C.W. Relation between satellite observed visible-near infrared emissions, population, economic activity and electric power consumption. Int. J. Remote. Sens. 1997, 18, 1373–1379. [Google Scholar] [CrossRef]
  2. Doll, C.N.H.; Muller, J.P.; Morley, J.G. Mapping regional economic activity from night-time light satellite imagery. Ecol. Econ. 2006, 57, 75–92. [Google Scholar] [CrossRef]
  3. Zhao, N.Z.; Currit, N.; Samson, E. Net primary production and gross domestic product in China derived from satellite imagery. Ecol. Econ. 2011, 70, 921–928. [Google Scholar] [CrossRef]
  4. Forbes, D.J. Multi-scale analysis of the relationship between economic statistics and DMSP-OLS night light images. GISci. Remote. Sens. 2013, 50, 483–499. [Google Scholar] [CrossRef]
  5. Doll, C.N.H.; Muller, J.P.; Elvidge, C.D. Night-time imagery as a tool for global mapping of socioeconomic parameters and greenhouse gas emissions. Ambio 2000, 29, 157–162. [Google Scholar] [CrossRef]
  6. Ghosh, T.; Powell, R.L.; Elvidge, C.D.; Baugh, K.E.; Sutton, P.C.; Anderson, S. Shedding light on the global distribution of economic activity. Open Geogr. J. 2010, 3, 148–161. [Google Scholar] [CrossRef]
  7. Letu, H.; Hara, M.; Yagi, H.; Naoki, K.; Tana, G.; Nishio, F.; Shuhei, O. Estimating energy consumption from night-time DMPS/OLS imagery after correcting for saturation effects. Int. J. Remote. Sens. 2010, 31, 4443–4458. [Google Scholar] [CrossRef]
  8. Zhao, N.Z.; Ghosh, T.; Samson, E. Mapping spatio-temporal changes of Chinese electric power consumption using night-time imagery. Int. J. Remote. Sens. 2012, 33, 6304–6320. [Google Scholar] [CrossRef]
  9. Baugh, K.; Hsu, F.C.; Elvidge, C.; Zhizhin, M. Nighttime lights compositing using the VIIRS day-night band: Preliminary results. Proc. Asia Pac. Adv. Netw. 2013, 35, 70–86. [Google Scholar] [CrossRef]
  10. Elvidge, C.D.; Baugh, K.; Zhizhin, M.; Hsu, F.C. Why VIIRS data are superior to DMSP for mapping nighttime lights. Proc. Asia Pac. Adv. Netw. 2013, 35, 62–69. [Google Scholar] [CrossRef]
  11. Li, X.; Xu, H.M.; Chen, X.L.; Li, C. Potential of NPP-VIIRS nighttime light imagery for modeling the regional economy of China. Remote. Sens. 2013, 5, 3057–3081. [Google Scholar] [CrossRef]
  12. Ma, T.; Zhou, C.H.; Pei, T.; Haynie, S.; Fan, J.F. Responses of Suomi-NPP VIIRS-derived nighttime lights to socioeconomic activity in China’s cities. Remote. Sens. Lett. 2014, 5, 165–174. [Google Scholar] [CrossRef]
  13. Shi, K.F.; Yu, B.L.; Huang, Y.X.; Hu, Y.J.; Yin, B.; Chen, Z.Q.; Chen, L.J.; Wu, J.P. Evaluating the ability of NPP-VIIRS nighttime light data to estimate the gross domestic product and the electric power consumption of China at multiple scales: A comparison with DMSP-OLS data. Remote. Sens. 2014, 6, 1705–1724. [Google Scholar] [CrossRef]
  14. Elvidge, C.D.; Ziskin, D.; Baugh, K.E.; Tuttle, B.T.; Ghosh, T.; Pack, D.W.; Erwin, E.H.; Zhizhin, M. A fifteen year record of global natural gas flaring derived from satellite data. Energies 2009, 2, 595–622. [Google Scholar] [CrossRef]
  15. Ma, T.; Zhou, Y.K.; Zhou, C.H.; Haynie, S.; Pei, T.; Xu, T. Night-time light derived estimation of spatio-temporal characteristics of urbanization dynamics using DMSP/OLS satellite data. Remote. Sens. Environ. 2015, 158, 453–464. [Google Scholar] [CrossRef]
  16. Propastin, P.; Kappas, M. Assessing satellite-observed nighttime lights for monitoring socioeconomic parameters in the Republic of Kazakhstan. GISci. Remote. Sens. 2012, 49, 538–557. [Google Scholar] [CrossRef]
  17. Cheng, W.M.; Zhou, C.H.; Chai, H.X.; Zhao, S.M.; Liu, H.J.; Zhou, Z.P. Research and compilation of the Geomorphologic Atlas of the People’s Republic of China (1:1,000,000). J. Geogr. Sci. 2011, 21, 89–100. [Google Scholar] [CrossRef]
  18. Cheng, W.M.; Zhou, C.H.; Li, B.Y.; Shen, Y.C.; Zhang, B.P. Structure and contents of layered classification system of digital geomorphology for China. J. Geogr. Sci. 2011, 21, 771–790. [Google Scholar] [CrossRef]
  19. He, W.C.; Zhao, S.M.; Cheng, W.M. Analysis of land cover change on basic geomorphic types in Shanxi Province. J. Geo-Inf. Sci. 2016, 18, 210–219. (In Chinese) [Google Scholar] [CrossRef]
  20. Zhao, M.; Cheng, W.M.; Huang, K.; Wang, N.; Liu, Q.Y. Research on land cover change in Beijing-Tianjin-Hebei Region during the last 10 years based on different geomorphic units. J. Nat. Res. 2016, 31, 252–264. (In Chinese) [Google Scholar] [CrossRef]
  21. Zhao, M.; Cheng, W.M.; Huang, K. Spatial characteristics of urban development and its correlation with macro geomorphology in Beijing-Tianjin-Hebei Region for recent 21 years. J. Geo-Inf. Sci. 2015, 17, 917–926. (In Chinese) [Google Scholar] [CrossRef]
  22. Zhao, M.; Cheng, W.M.; Liu, Q.Y.; Wang, N. Spatiotemporal measurement of urbanization levels based on multiscale units: A case study of the Bohai Rim Region in China. J. Geogr. Sci. 2016, 26, 531–548. [Google Scholar] [CrossRef]
  23. Zhao, M.; Cheng, W.M.; Zhou, C.H.; Li, M.C.; Wang, N.; Liu, Q.Y. Spatial differentiation and morphologic characteristics of China’s urban core zones based on geomorphologic partition. J. Appl. Remote. Sens. 2017, 11, 016041. [Google Scholar] [CrossRef]
  24. Cheng, W.M.; Chai, H.X.; Fang, Y.; Zhou, C.H.; Tian, C.Y. Analysis of cultivated land based on water resources regionalization and geomorphologic characteristics in Xinjiang, China. J. Nat. Res. 2012, 27, 1809–1822. (In Chinese) [Google Scholar] [CrossRef]
  25. Fang, Y.; Cheng, W.M.; Zhou, C.H.; Chen, X.; Tian, C.Y. Suitability evaluation of land cultivation in Xinjiang based on multiple natural geographical factors. J. Geo-Inf. Sci. 2015, 17, 846–854. (In Chinese) [Google Scholar] [CrossRef]
  26. Schroeder, W.; Oliva, P.; Giglio, L.; Csiszar, I.A. The new VIIRS 375 m active fire detection data product: Algorithm description and initial assessment. Remote. Sens. Environ. 2014, 143, 85–96. [Google Scholar] [CrossRef]
  27. Shi, K.F.; Yu, B.L.; Hu, Y.J.; Huang, C.; Chen, Y.; Huang, Y.X.; Chen, Z.Q.; Wu, J.P. Modeling and mapping total freight traffic in China using NPP-VIIRS nighttime light composite data. GISci. Remote. Sens. 2015, 52, 274–289. [Google Scholar] [CrossRef]
  28. Ma, T.; Zhou, Y.K.; Wang, Y.J.; Zhou, C.H.; Haynie, S.; Xu, T. Diverse relationships between Suomi-NPP VIIRS night-time light and multi-scale socioeconomic activity. Remote. Sens. Lett. 2014, 5, 652–661. [Google Scholar] [CrossRef]
  29. Chen, J.; Zhuo, L.; Shi, P.J.; Ichinose, T. The study on urbanization process in China based on DMSP/OLS data: Development of a light index for urbanization level estimation. J. Remote. Sens. 2003, 7, 168–175. (In Chinese) [Google Scholar] [CrossRef]
  30. Zhuo, L.; Shi, P.J.; Chen, J.; Ichinose, T. Application of compound night light index derived from DMSP/OLS data to urbanization analysis in China in the 1990s. Acta Geogr. Sin. 2003, 58, 893–902. (In Chinese) [Google Scholar] [CrossRef]
  31. Chen, X.; Nordhaus, W. A test of the new VIIRS lights data set: Population and economic output in Africa. Remote. Sens. 2015, 7, 4937–4947. [Google Scholar] [CrossRef]
  32. Yu, B.L.; Shi, K.F.; Hu, Y.J.; Huang, C.; Chen, Z.Q.; Wu, J.P. Poverty Evaluation Using NPP-VIIRS Nighttime Light Composite Data at the County Level in China. IEEE J. Sel. Top. Appl. Earth Obs. Remote. Sens. 2015, 8, 1217–1229. [Google Scholar] [CrossRef]
  33. Li, F.; Wei, A.X.; Mi, X.N.; Sun, G.T. An approach of GDP spatialization in Hebei province using NPP-VIIRS nighttime light data. J. Xinyang Norm. Univ.: Nat. Sci. Ed. 2016, 29, 152–156. (In Chinese) [Google Scholar] [CrossRef]
Figure 1. An overview of the South China study area.
Remotesensing 09 00673 g001
Figure 2. Spatial distribution of nighttime light data across South China: (a) the composite National Polar-Orbiting Partnership-Visible Infrared Imaging Radiometer Suite (NPP-VIIRS) nighttime light brightness in 2014; and (b) the corrected Defense Meteorological Satellite Program-Operational Linescan System (DMSP-OLS) nighttime light brightness in 2012.
Remotesensing 09 00673 g002
Figure 3. Spatial distribution of the basic geomorphological types in South China.
Remotesensing 09 00673 g003
Figure 4. Processing flow chart for lighting correction of VIIRS nighttime light data.
Remotesensing 09 00673 g004
Figure 5. (a) The corrected VIIRS nighttime light data for South China in 2014. The region bounded by the red rectangle is the sampling area. (b) The difference between the corrected and original lighting. The red shaded area is the lit area where the lighting value is not modified. (c) The original; and (d) corrected imagery of sampling region are Hechi (area No. 1) and Nanning (area No. 2). The two example lit areas that were removed during correction are indicated by red circles and yellow arrows.
Remotesensing 09 00673 g005
Figure 6. Statistical relationships between GDP and four light indices for corrected VIIRS data at the prefecture level: (a) the total nighttime light (TNL); (b) average nighttime light intensity (I); (c) proportion of intensely lit area (S); and (d) compounded nighttime light index (CNLI).
Remotesensing 09 00673 g006
Figure 7. Statistical relationships between GDP and four light indices of corrected VIIRS data at the county level: (a) total nighttime light (TNL); (b) average nighttime light intensity (I); (c) proportion of intensely lit area (S); and (d) compounded nighttime light index (CNLI).
Remotesensing 09 00673 g007
Figure 8. Statistical relationships between GDP and the total nighttime light (TNL) for the original VIIRS data at: (a) prefecture level; and (b) county level.
Remotesensing 09 00673 g008
Figure 9. The pixel-level (500 m × 500 m) GDP map for South China in 2014.
Remotesensing 09 00673 g009
Figure 10. (a) Total GDP; and (b) GDP intensity of basic geomorphological types of South China in 2014.
Remotesensing 09 00673 g010
Figure 11. Relationships between statistical GDP and spatialized GDP from the corrected VIIRS data at: (a) prefecture level; and (b) county level.
Remotesensing 09 00673 g011
Table 1. Characteristics of the basic geomorphological types in South China.
Basic Geomorphological TypesType AbbreviationAltitudeRelief
Low altitude plainLAP<1000 m<30 m
Middle altitude plainMAP1000 m–3500 m<30 m
Low altitude platformLAPF<1000 m>30 m
Low altitude hillLAH<1000 m<200 m
Middle altitude hillMAH1000 m–3500 m<200 m
Low-relief low altitude mountainLRLAM<1000 m200 m–500 m
Low-relief middle altitude mountainLRMAM<1000 m200 m–500 m
Middle-relief low altitude mountainMRLAM1000 m–3500 m500 m–1000 m
Middle-relief middle altitude mountainMRMAM1000 m–3500 m500 m–1000 m
High-relief middle altitude mountainHRMAM1000 m–3500 m1000 m–2500 m
Table 2. Accuracy at different levels of the simulated GDP.
Region and DataPercent of Relative Error of the Simulated GDP (%)
High AccuracyModerate AccuracyInaccuracy
Prefectural levelCorrected NPP-VIIRS data63.1628.957.89
Original NPP-VIIRS data57.8934.227.89
County levelCorrected NPP-VIIRS data49.4725.7924.74
Original NPP-VIIRS data46.3128.9524.74

