
Assessment of the Daily Cloud-Free MODIS Snow-Cover Product for Monitoring the Snow-Cover Phenology over the Qinghai-Tibetan Plateau


1
State Key Laboratory of Cryospheric Sciences, Northwest Institute of Eco-Environment and Resources, Chinese Academy of Sciences, Lanzhou 730000, Gansu, China
2
University of Chinese Academy of Sciences, Beijing 100049, China
3
Laboratory of Remote Sensing and Geospatial Science, Lanzhou Library, Northwest Institute of Eco-Environment and Resources, Chinese Academy of Sciences, Lanzhou 730000, Gansu, China
4
College of Urban and Environmental Sciences, Peking University, Beijing 100871, China
*
Author to whom correspondence should be addressed.
Remote Sens. 2017, 9(6), 585; https://doi.org/10.3390/rs9060585
Submission received: 7 May 2017
/
Revised: 31 May 2017
/
Accepted: 7 June 2017
/
Published: 10 June 2017
Abstract
:Snow cover plays a crucial role in surface hydrology and energy balance, especially in the Qinghai-Tibetan Plateau (QTP). This study used 12 years (2000–2011) of ground-observed snow depth at 87 meteorological stations to assess and verify the accuracy of the daily cloud-free snow-cover product from the Moderate Resolution Imaging Spectroradiometer (MODIS) over the QTP. On average, the daily cloud-free MODIS snow-cover product correctly identified the occurrence of snow cover with an accuracy of 90.74%, ranging from 54.39% to 99.07% among the 87 sites. The MODIS-derived data have large uncertainties in identifying the snow-cover phenology on the threshold of FSC >0 and FSC >50% (FSC, fractional snow cover). However, the MODIS-derived data can capture the interannual variability of the snow-cover phenology as compared with in situ observations. This study highlights the uncertainties in the daily snow-free MODIS snow-cover product to reflect snow-cover phenology over the QTP.

1. Introduction
Snow cover is an important land-surface variable, especially in the Qinghai-Tibetan Plateau (QTP), and profoundly impacts surface energy exchange, and regional climate, hydrology, and ecosystems [1,2,3]. The QTP, the world’s largest and highest plateau—with an average elevation exceeding 4000 m above sea level—is “the sensitive area” for global climate change [4]. Snow cover is often regarded as an indicator of climate change in the QTP, and is closely linked with the general circulation and monsoon systems over eastern and southern Asia during spring and summer [5,6]. The snow cover over the QTP strongly determines the regional water sources in western China, and regulates the runoff of several major rivers (e.g., the Yangtze River, and the Yellow River) [7,8]. In the context of global warming, changes in snow cover and snow depth have great significance for predicting the regional feedback to climate change.
In response to climate warming, the snow cover phenology has experienced remarkable changes. Numerous studies have robustly documented a shortening of snow cover duration [9,10,11,12], with a delayed snow starting date and advanced snow ending date [9,11,13,14,15], at both a local and regional scale. For example, Peng et al. [11] found a shrinking snow-cover duration over the past 27 years (1980–2006) from 636 meteorological stations in the Northern Hemisphere. Most published estimates of snow-cover phenology have mainly focused on the high latitude regions of the Northern Hemisphere [12,15], and conclusions were made from in situ observations and model simulations. There are a few studies exploring the changes in snow-cover phenology with MODIS snow-cover products in the QTP.
Remotely sensed data provide temporally and spatially continuous information over land surfaces, and are useful for accurately parameterizing snow cover. When compared with various satellite-based snow-cover products, the Moderate Resolution Imaging Spectroradiometer (MODIS) snow-cover products have advantages in terms of temporal and spatial resolution. Because the microwave remote-sensing data (i.e., Scanning Multichannel Microwave Radiometer (SMMR) data, Special Sensor Microwave/Imager (SSM/I) data, and Advanced Microwave Scanning Radiometer-E (AMSR-E) data, 25 km or coarser resolution) have lower spatial resolution and are affected by many factors such as land-use type and weather conditions, they are only appropriate for hemispheric- or larger-scale snow research [16]. Even though Landsat data (i.e., Landsat Multispectral Scanner System (MSS), Landsat Thematic Mapper (TM), and Landsat Enhanced Thematic Mapper Plus (ETM+)) have a much higher spatial resolution (30 m) than a MODIS snow product, they are not widely used in snow monitoring due to their low temporal resolution (16 days). Available since 2000, the MODIS images are superior to either Landsat—due to higher temporal resolution—or Advanced Very High Resolution Radiometer (AVHRR) data and passive microwave snow data—due to higher spatial resolution and data quality in mapping a snow-covered area—and therefore have an advantage for Earth observation missions [17,18]. Currently, the MODIS snow-cover products have been widely used to monitor snow cover in various regions [19,20,21,22,23,24], especially at high latitudes and in European high mountain regions [20,21,25,26,27,28,29].
In general, the MODIS snow-cover products reflect changes in snow cover over these regions very well. For example, Simic et al. [30] found that a MODIS snow-cover product at 500 m spatial resolution generally has a level of more than 90% agreement with in situ measurements in Canada. However, cloud coverage in MODIS snow-cover products was the main limitation in many applications [31,32]. A series of methods have been proposed to reduce the cloud obscuration when using the MODIS snow-cover products. For example, the method of combining images from MODIS Terra and MODIS Aqua data can decrease cloud coverage by 10%–20% [33,34]. Using information from neighboring non-cloud covered pixels in time or space remarkably reduced clouds from 63% to 55% [35], but this method reduced the snow detection ability in short snow events with a composite data increase. An approach that combined MODIS images with a passive microwave AMSR-E product was available in all weather conditions [36], but it decreased the spatial resolution for pixels covered by cloud due to the passive microwave product’s coarse spatial resolution (25 km for the AMSR-E compared to 500 m for the MODIS). All of the approaches described above are useful for minimizing cloud cover in a standard MODIS snow-cover product, but they sacrifice temporal and spatial resolution, and induce some uncertainties to a certain degree. As noted in Tang et al. [37], based on a cubic spline interpolation algorithm, the cloud-gap-filled method can effectively eliminate the cloud obscuration of MODIS fractional snow cover (FSC) images using the observations in cloud-free days for each cloud pixel (with mean absolute error less than 0.1). Therefore, the daily cloud-free MODIS snow-cover product was evaluated in this study by in situ observations.
When compared with mountainous terrain or high latitudes (where there is always more snow cover), the QTP presents unique climatic conditions and terrain heterogeneity. In particular, the dry climate background and high wind speeds over the QTP may produce complex snow-cover situations [38]. The objectives of this study are to: (1) assess and verify the accuracy of a daily cloud-free MODIS snow-cover product at 500 m resolution, based on in situ observations at 87 sites through 2000–2011 over the QTP; and (2) evaluate the abilities of the daily cloud-free MODIS snow-cover product to identify the snow starting time, the snow ending time, and the snow-cover duration.
2. Data and Method
2.1. Study Area
The Qinghai-Tibetan Plateau covers an area of 2.96 × 10⁶ km2 at an average elevation of 4500 m (Figure 1). It is characterized by a semiarid climate, with a mean annual precipitation below 450 mm [39]. The mean annual temperature decreases from the edges of the plateau towards the center with altitude, ranging from −15 °C to 10 °C [40].
2.2. Daily Cloud-Free MODIS Snow-Cover Product
The daily cloud-free MODIS snow-cover product—published on the West Data Centre in China (http://westdc.westgis.ac.cn/)—was used in this study. The daily fractional snow cover (FSC) was provided in the MOD10A1 snow maps at 500 m resolution in the MODIS snow products Collection 5 [17]. Based on a daily MODIS FSC product, the daily cloud-free MODIS product was developed by a cloud-gap-filled method using a cubic spline interpolation algorithm to fill in data gaps by clouds [37]. The mean absolute error of the retrieved FSC data by the cloud-gap-filled method is 0.092, according to Tang et al. [37].
A snow-cover year was defined in this research as extending from August to the following July. The snow starting time was defined as the first FSC >0 [15] or FSC >50% [21] in the latter half of the year (August–December), while the snow ending time was defined as the last FSC >0 [15] or FSC >50% [21] in the first half of the following year (January–July). The snow-cover duration was defined as the number of days from the snow starting time to the snow ending time (including intermediate melting processes) [14]. Snow-cover days was defined as the total number of days when the FSC was more than 0 or 50% in a hydrological year (from August to the following July).
2.3. In Situ Snow Depth Observations
In this study, the daily snow depth for the QTP was collected from 87 national meteorological stations of the China Meteorological Administration (Figure 1). According to the specifications for surface meteorological observation, the “trace” records of daily snow depth were all reassigned to a value of 0.5 cm.
The snow starting time was identified as the time when a snow depth of ≥1 cm was first observed in the latter half of the year (August–December), whereas the snow ending time was defined as the time when the last snow depth occurrence was ≥1 cm in the first half of the following year (January–July). For any site, the year was omitted from the analysis if the missing records occurred between August 1 and the snow starting time or between the snow ending time and July 31 [14]. Furthermore, if both the snow starting time and the snow ending time occurred during a half-year period (January to July or August to December), the corresponding year at this site was not considered [14]. Accordingly, snow-cover days was defined as the total number of days when the snow depth was more than 0 in a hydrological year (i.e., the day is counted when there is snow present).
According to the above data preparation, the snow phenology data were divided into four categories, when considering the availability of both MODIS data and in situ data: (1) 0 value (no snow cover phenology was detected at least one of the two data sets); (2) in half year (both the snow starting time and the snow ending time were detected in a half-year period (January to July or August to December)); (3) available data (used data in this analysis; i.e., the snow starting time was detected in the latter half of the year and the snow ending time was detected in the first half of the year); and (4) missing data (missing data except for the above data category) (Figure 2). As a result, based on the threshold of snow depth ≥1 cm, snow phenology data in 71 sites was available when choosing the threshold of FSC >0, while the data in 40 sites were available when choosing the threshold of FSC >50%.
2.4. Evaluation of MODIS Snow Product
The evaluation was performed from 26 February 2000 to 31 December 2011. The confusion matrix comparing the daily cloud-free MODIS snow-cover product data against in situ observations is shown in Table 1. In Table 1, a and d represent the total numbers for correct snow and no snow, respectively. The b portion represents the total number of snow days missing, which indicates that the MODIS product identified uncovered land (no snow) at a certain location, but snow was present in the in situ observations; this event was described as an omission error.
Omission error (classifying snow as no snow) = b/(a + b + c + d)
When MODIS data indicated snow cover, but the in situ observation was snow-free, the event was labeled as a commission error. The total number of commission errors is presented in the c portion of the table.
Commission error (classifying no snow as snow) = c/(a + b + c + d)
Hence, the overall accuracy (OA), was then defined as:
Overall accuracy = (a + d)/(a + b + c + d)
The snow detection rate is defined as the ratio of snow-cover days detected by the MODIS sensor to the total number of snow-cover events:
Snow detection rate = a/(a + b)
2.5. Sensitivity Analysis
The sensitivity analysis was performed in snow detection rate and snow-cover phenology. For snow detection rate, ten spaced values ranging from 1 cm to 10 cm for snow depth and 0 to k (k = 10, 20, 30, …, 100%) for FSC have been tested. For snow-cover phenology, a two-entry confusion matrix has been computed when both the snow depth and the FSC exceed a threshold value. That is, when snow depth ≥ i cm (i = 1, 2, …, 10 cm) and FSC > j (j = 0, 10, …, 90%), we computed the snow starting time, the snow ending time, and the snow-cover duration. The difference between in situ derived and MODIS-derived snow-cover phenology was indicated by absolute difference (i.e., days difference).
3. Results
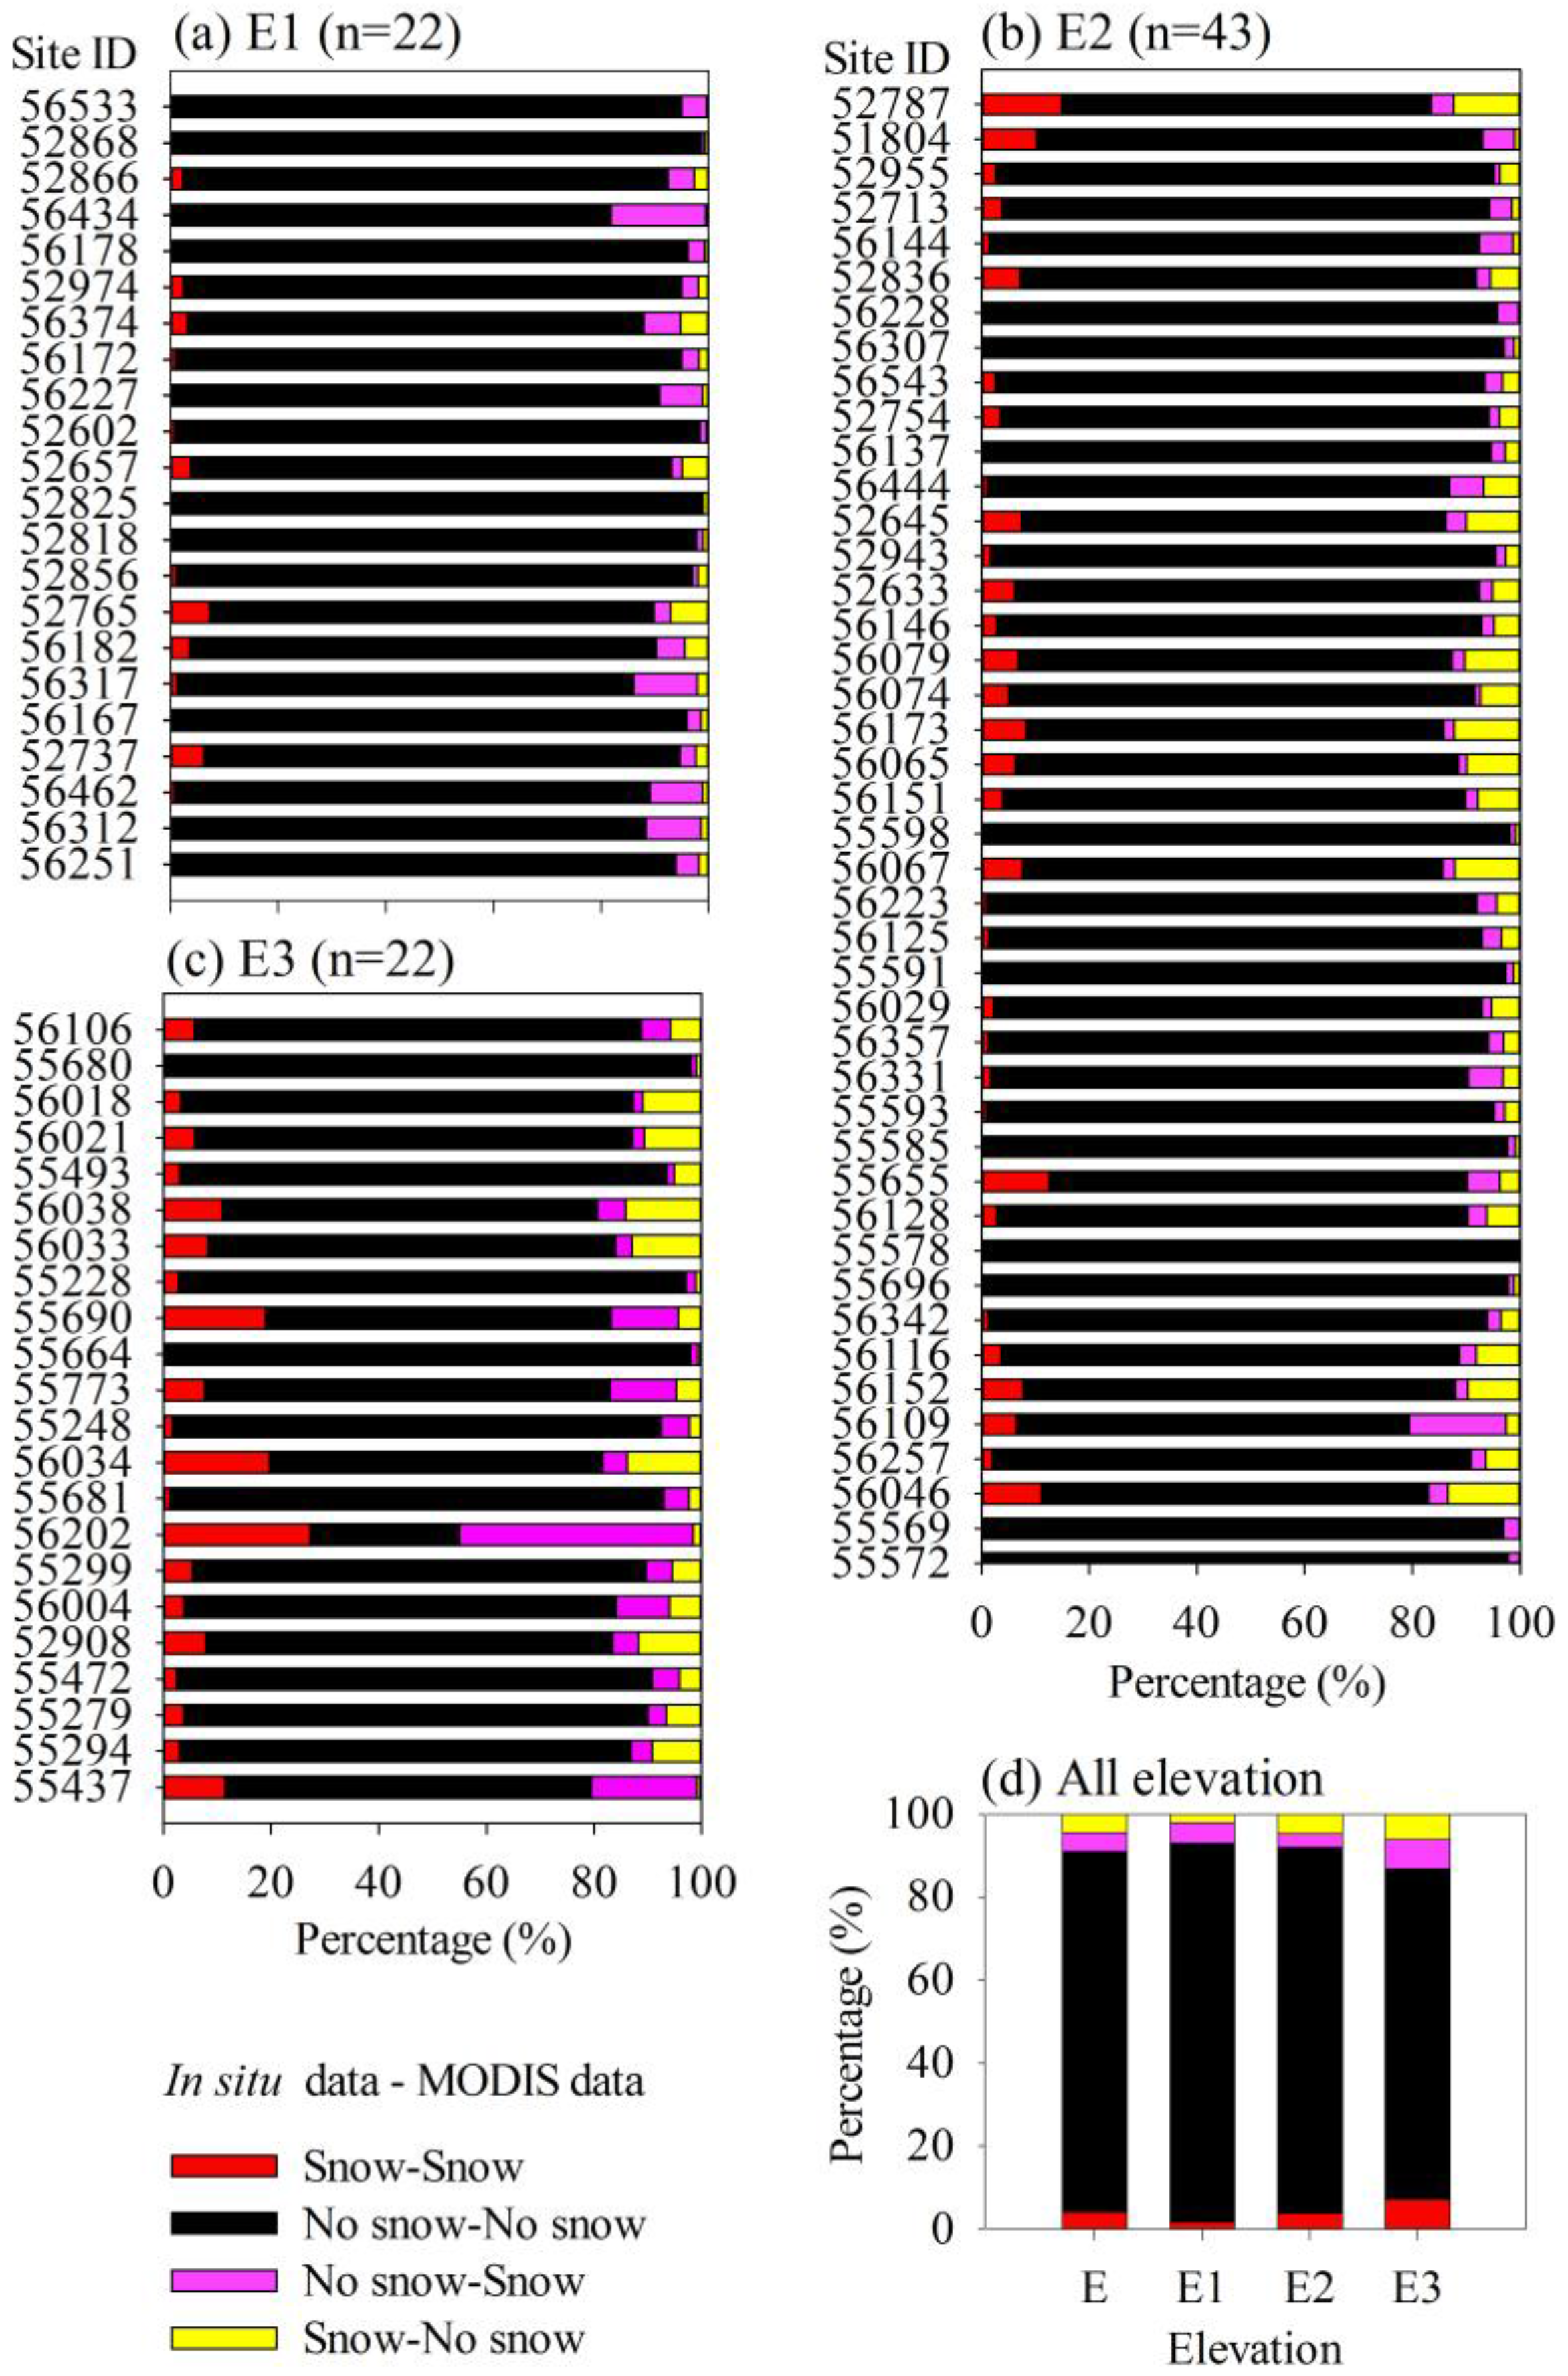
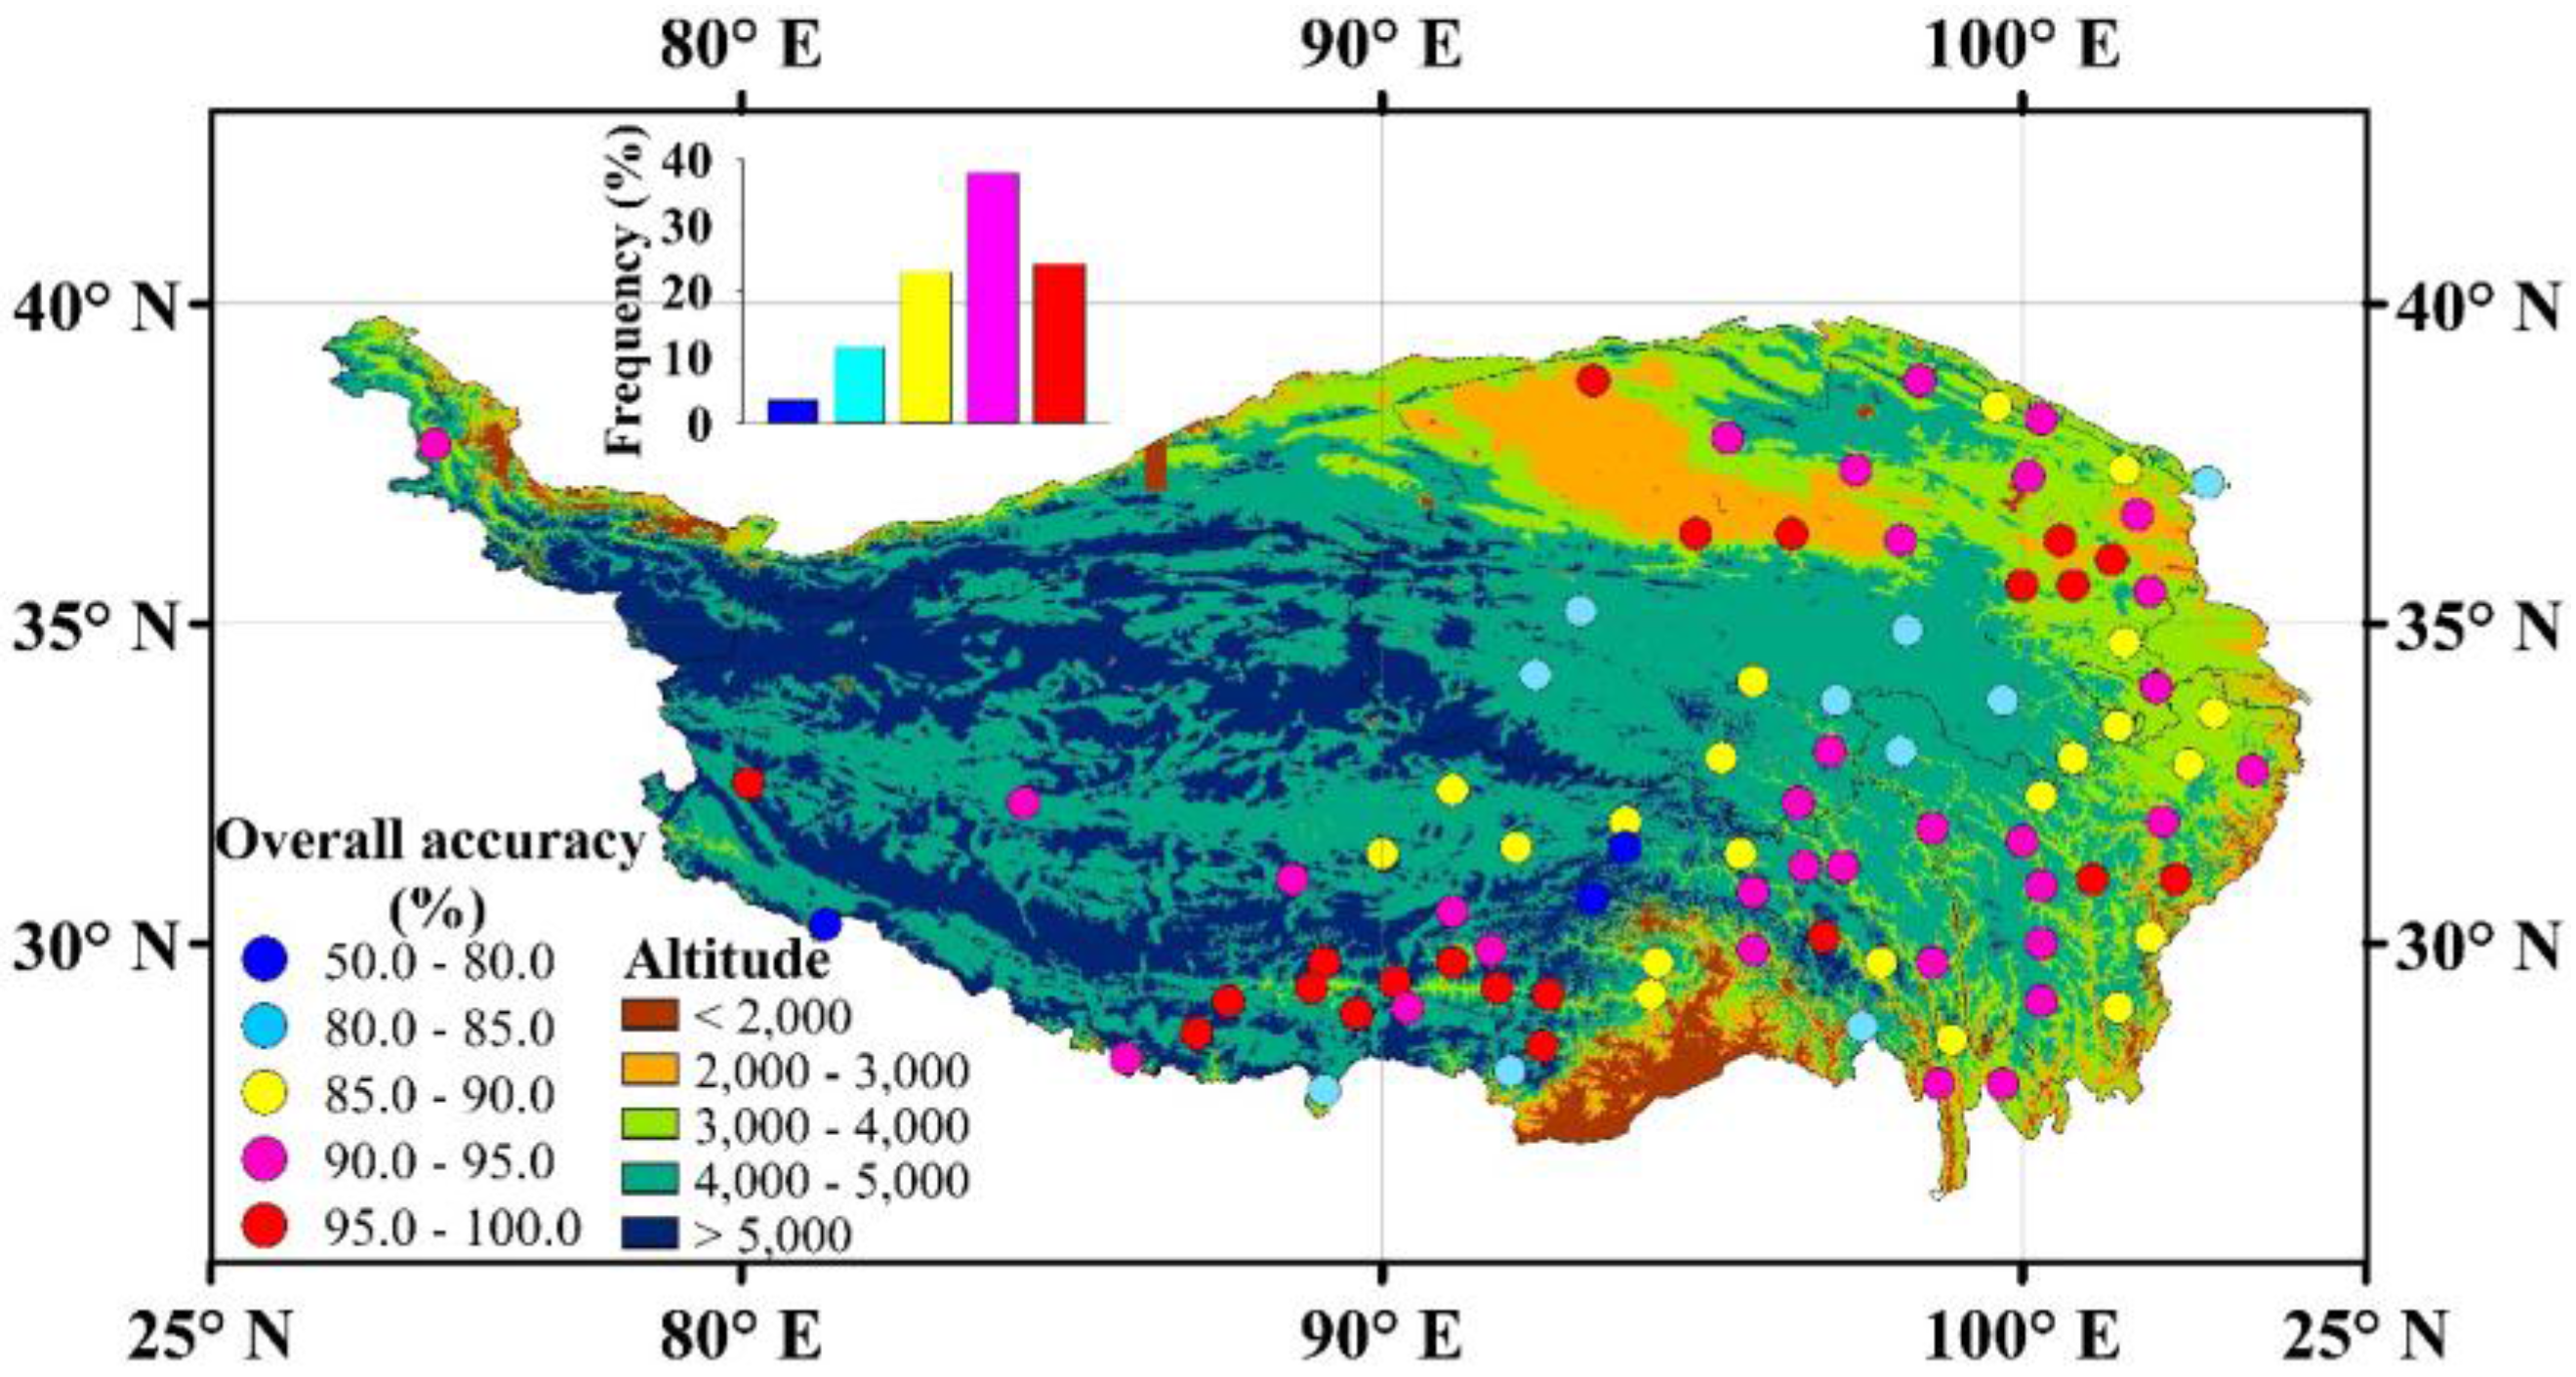
The daily cloud-free MODIS snow-cover product showed high performance for predicting the occurrence of snow cover. On average, the MODIS product correctly predicted the occurrence of snow cover at all sites with 90.74% accuracy (OA), with a range from 54.39% to 99.07% (Figure 3). The omission error (OE) (i.e., percentage of missed snow-cover occurrences) was 4.69%, and the commission error (CE) (i.e., percentage of overestimated snow-cover occurrences) was 4.57% (Figure 3 and Figure 4). The stations in the E1 elevation gradient (elevation ≤3000 m) had the highest OA (92.83%); these stations in the E1 elevation gradient also had the lowest CE (2.19%), and lower OE (4.98%) (Figure 4). In contrast, the stations in the E3 elevation gradient (elevation >4000 m) showed the lowest OA (86.49%), as well as the highest CE values (6.28%) and OE values (7.23%). There was an extreme spatial variability in OA due to the complex terrain over the QTP, with higher overall accuracy distributed in the eastern part of the Himalayas, Nyainqentanglha, and the southeastern portion of the Qinghai-Tibetan Plateau (Figure 4).
The snow detection rate (i.e., the number of detected snow-cover occurrences among total snow-cover events) of the MODIS snow-cover product with different snow depth measurements was also evaluated (Figure 5). On average, the snow detection rate was 82.09% when the snow depth was greater than 4 cm, whereas it decreased to 49.78% when the snow depth was less than 4 cm. Among all the 31,615 in situ observed snow data events, the daily cloud-free MODIS product classified 14,966 of them as snow (47.34%), but misclassified 16,649 of them as no snow (52.66%). Among different months, the snow detection rate was higher in winter, especially in snow depth above 4 cm (Figure 6a). Similarly, higher values were found in different years when the snow depth was more than 4 cm (Figure 6b). These results imply that the MODIS snow detection rate strongly depends on snow depth.
The MODIS-derived snow-cover days in more than half of the available data appear lower than in situ snow-cover days during 2000–2010 on both the threshold of FSC >0 and FSC >50% (Figure 7). Although there was a strong relationship between the two datasets on the two thresholds, the differences still exist. For example, when compared with in situ observations, the MODIS-derived snow-cover days were on average 0.63 days less, and with a high standard deviation (28.69 days), on the threshold of FSC >0 (Figure 7a).
When choosing a threshold of FSC >0 (data from 71 sites were available), the MODIS product resulted in an earlier snow starting time at 59.15% of the stations, an earlier snow ending time, and a longer snow-cover duration at 56.34% of stations, as compared with in situ observations (Figure 8a–c). On the contrary, when choosing a threshold of FSC >50% (data from 40 sites were available), the MODIS product showed a later snow starting time at 75.0% of stations, an earlier snow ending time at 95.0% of stations, and a shorter snow cover duration at 95% of stations, as compared with the in situ observations (Figure 8d–f). On the threshold of FSC >0, the MODIS product underestimated the snow starting time and snow ending time, while overestimating the snow-cover duration at about half of the sites. These underestimated or overestimated stations were primarily located in lower-latitude regions, especially in the southeastern portion of the QTP (Figure 9). Similarly, on the threshold of FSC >50%, the MODIS product overestimated the snow starting time, but underestimated the snow ending time and the snow-cover duration in mid-latitude regions (Figure 9).
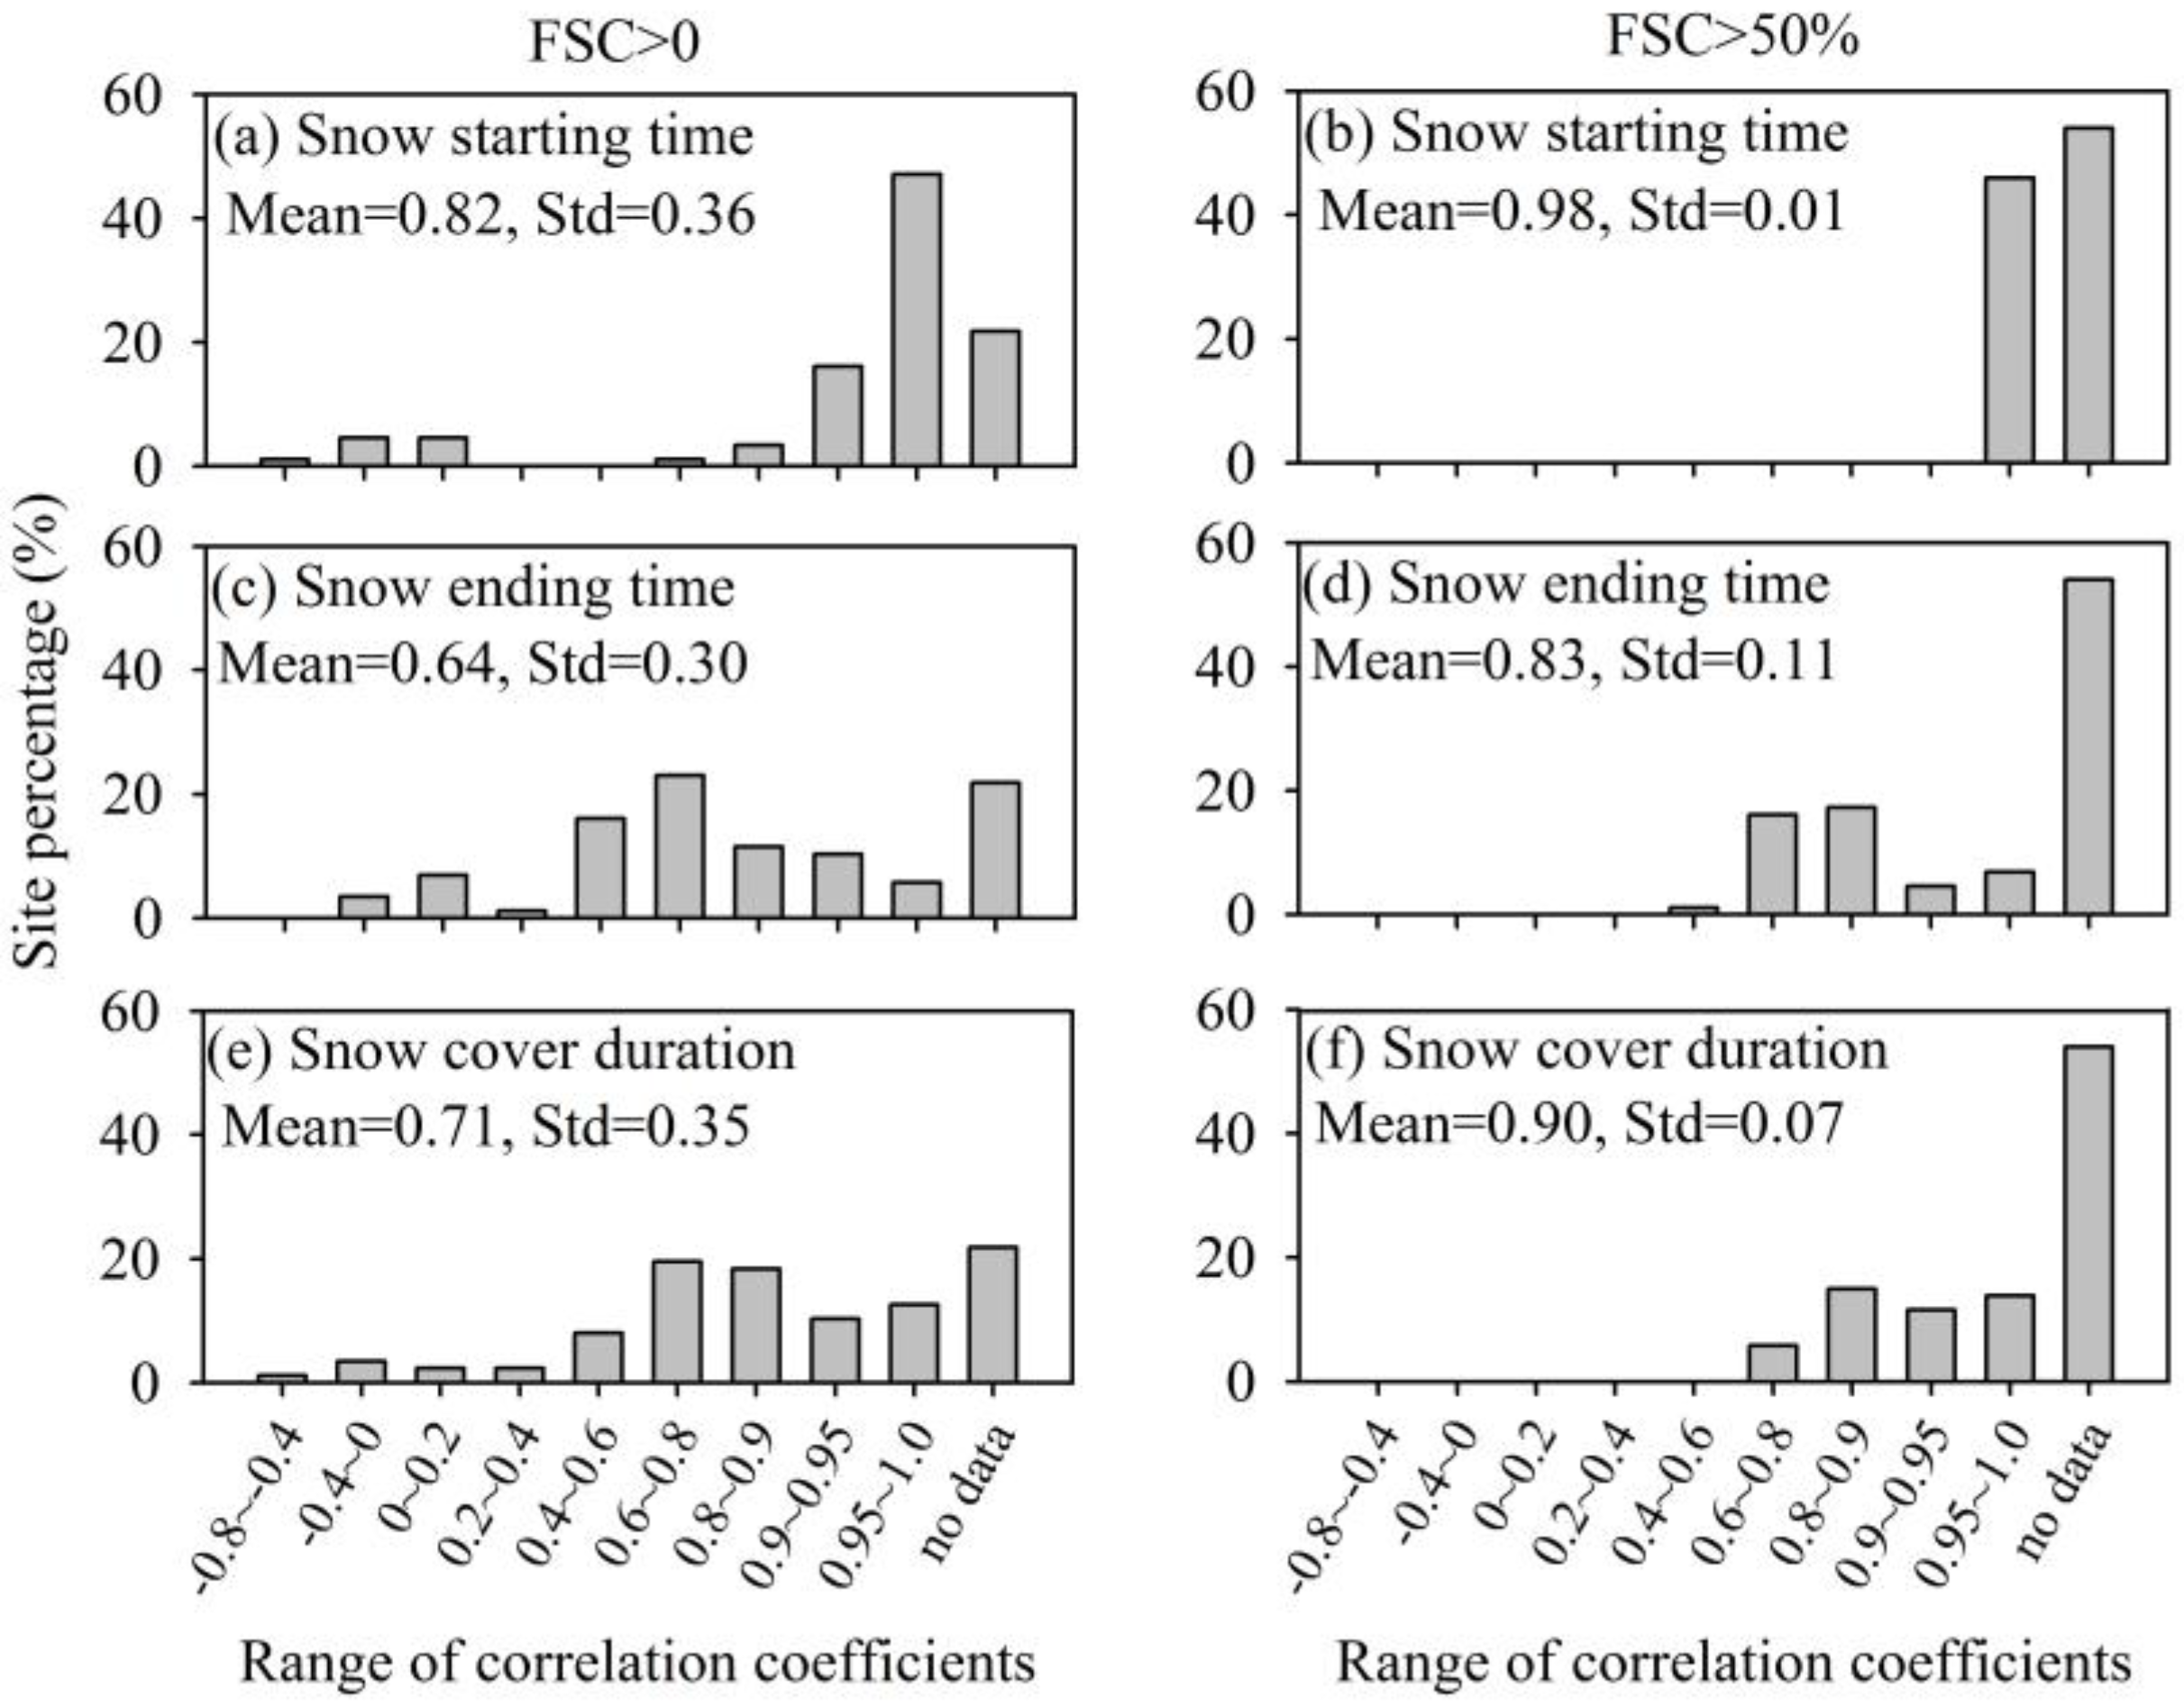
The ability to capture interannual variability was investigated at 71 sites and 40 sites, with more than three observations on the threshold of FSC >0 and FSC >50%. The results indicated that the MODIS-derived data on the threshold of FSC >50% performed better in capturing the interannual variability of the snow-cover phenology than the threshold of FSC >0 (Figure 10), though a big difference still exists between the two datasets (Figure 9). When choosing the threshold of FSC >50%, the mean values of the correlation coefficient (r) of the in situ data-derived snow-cover phenology and the MODIS data-derived snow-cover phenology attained 0.98 in the snow starting time, 0.83 in the snow ending time, and 0.90 in the snow-cover duration, respectively (Figure 10b,d,f). From the long-term changing trend in annual snow-cover phenology, the MODIS-derived data on the threshold of FSC >50% and in situ data have the same changing trends in snow starting time and snow-cover duration, even though there are no statistically significant changes (Table 2). During 2000–2010, on average, the snow-cover duration derived by MODIS data (on the threshold of FSC >50%) was 152.24 ± 10.15 d, which was 46.02 days shorter than that derived by in situ observations (198.26 ± 8.52 d). However, on the threshold of FSC >0, the MODIS data-derived snow-cover duration was extended by 7.89 days as compared with in situ observations during this period.
4. Discussion
In this study, the OA of the daily cloud-free MODIS snow-cover product over the QTP was about 90.74% when compared with in situ observations. The OA here is close to previous studies, which found that OA is about 90%–91% over the QTP [24,41]. This result also verified that the accuracy of the daily MODIS snow-cover products reaches 93% in other parts of the world under clear sky conditions [17], as previous studies have shown [30,42,43,44]. Possible reasons for this higher OA include several factors, such as the different levels of MODIS snow-cover products, and various method choices for mitigating the cloud obscuration. In general, previous studies indicated that the MODIS snow-cover products were in good agreement with available satellite and in situ snow data sets. For example, the daily MODIS FSC snow-cover product (MOD10A1) at 500 m resolution can identify 89% of snow cover for clear-sky days [21].
Snow cover over the QTP has distinct characteristics compared to mountainous terrain or high-latitude regions. Snow in the QTP is often shallow, patchy (low FSC), and frequently of short duration [45]. Except for the effect of moist air coming from southern Asia, these characteristics may result from the complex topography and higher wind speed in the QTP, which can influence MODIS accuracy and snow-cover distribution. For example, previous studies in different study areas have indicated that the MODIS snow-cover products tend to lose snow-cover classification accuracy in the presence of complex topography, forested areas, and human activities [17,42,46]. Moreover, due to large areas of flat plateau terrain, the wind speed near the surface (2 m above the land surface) in the QTP (4.19 ± 1.19 m s−1) is higher than in other regions of the world (3.16 ± 2.25 m s−1) [38], which may result in snow-cover redistribution in a short time. That is, snow may be moved and accumulate in valleys and lowlands, resulting in accuracy losses. This could explain why a higher omission error rate (classifying snow as no snow) exists at lower-elevation stations.
The snow detection rate increased with increasing snow depth. With increasing snow depth, the OA of the daily cloud-free MODIS product tended to increase. When the snow depth is less than 4 cm, the MODIS product has high OE by classifying snow as no snow. In these thin snow conditions, snow cover is more likely to melt away as cloud cover disappears and the temperature rapidly increases [31]. Through all investigated years, the snow detection rate was relatively low in 2010 because of the lowest snow cover days (data not shown). Snow events also more likely occurred over an only limited area of the satellite observation pixel under thin snow conditions [41]; the result was that the satellite snow product was more likely to classify the pixel as a snow-free surface. Similarly, when the snow depth was above 4 cm, the pixel was more likely to be entirely covered by snow, resulting in the higher overall accuracy of the MODIS snow-cover product. A previous study showed that the 8-day MODIS snow-cover product at 500 m resolution has high accuracies when mapping snow (94%) and land (99%) at a snow depth above 4 cm under clear sky conditions, but a very low accuracy (<39%) at a snow depth below 4 cm [31]. In addition, the MODIS data are greatly affected by mixed pixels, while the in situ data only represent the stations.
When compared with the in situ-derived snow-cover phenology, our result showed that the MODIS-derived snow cover phenology has large uncertainties. No significant trends were found in snow starting time, snow ending time and snow-cover duration by MODIS-derived data. The short-term time scale and the choice of ‘optimal’ threshold values in identifying snow-cover phenology may lead to this result. A recent study using in situ observations indicated a significantly shorter snow-cover duration during 1960–2010, which was jointly controlled by a later snow starting time and an earlier snow ending time at the same region [14]. Further studies need a long-term time scale of MODIS snow-cover products to identify the snow-cover phenology.
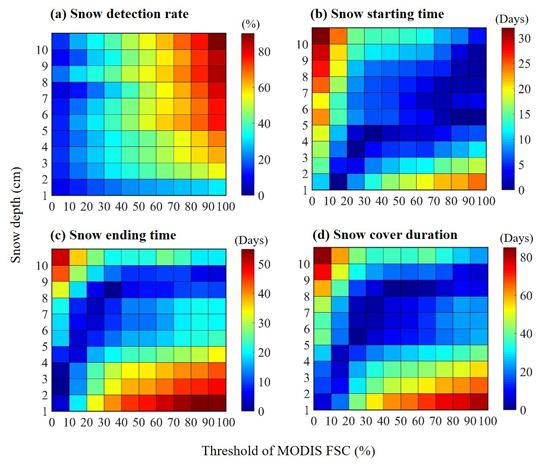
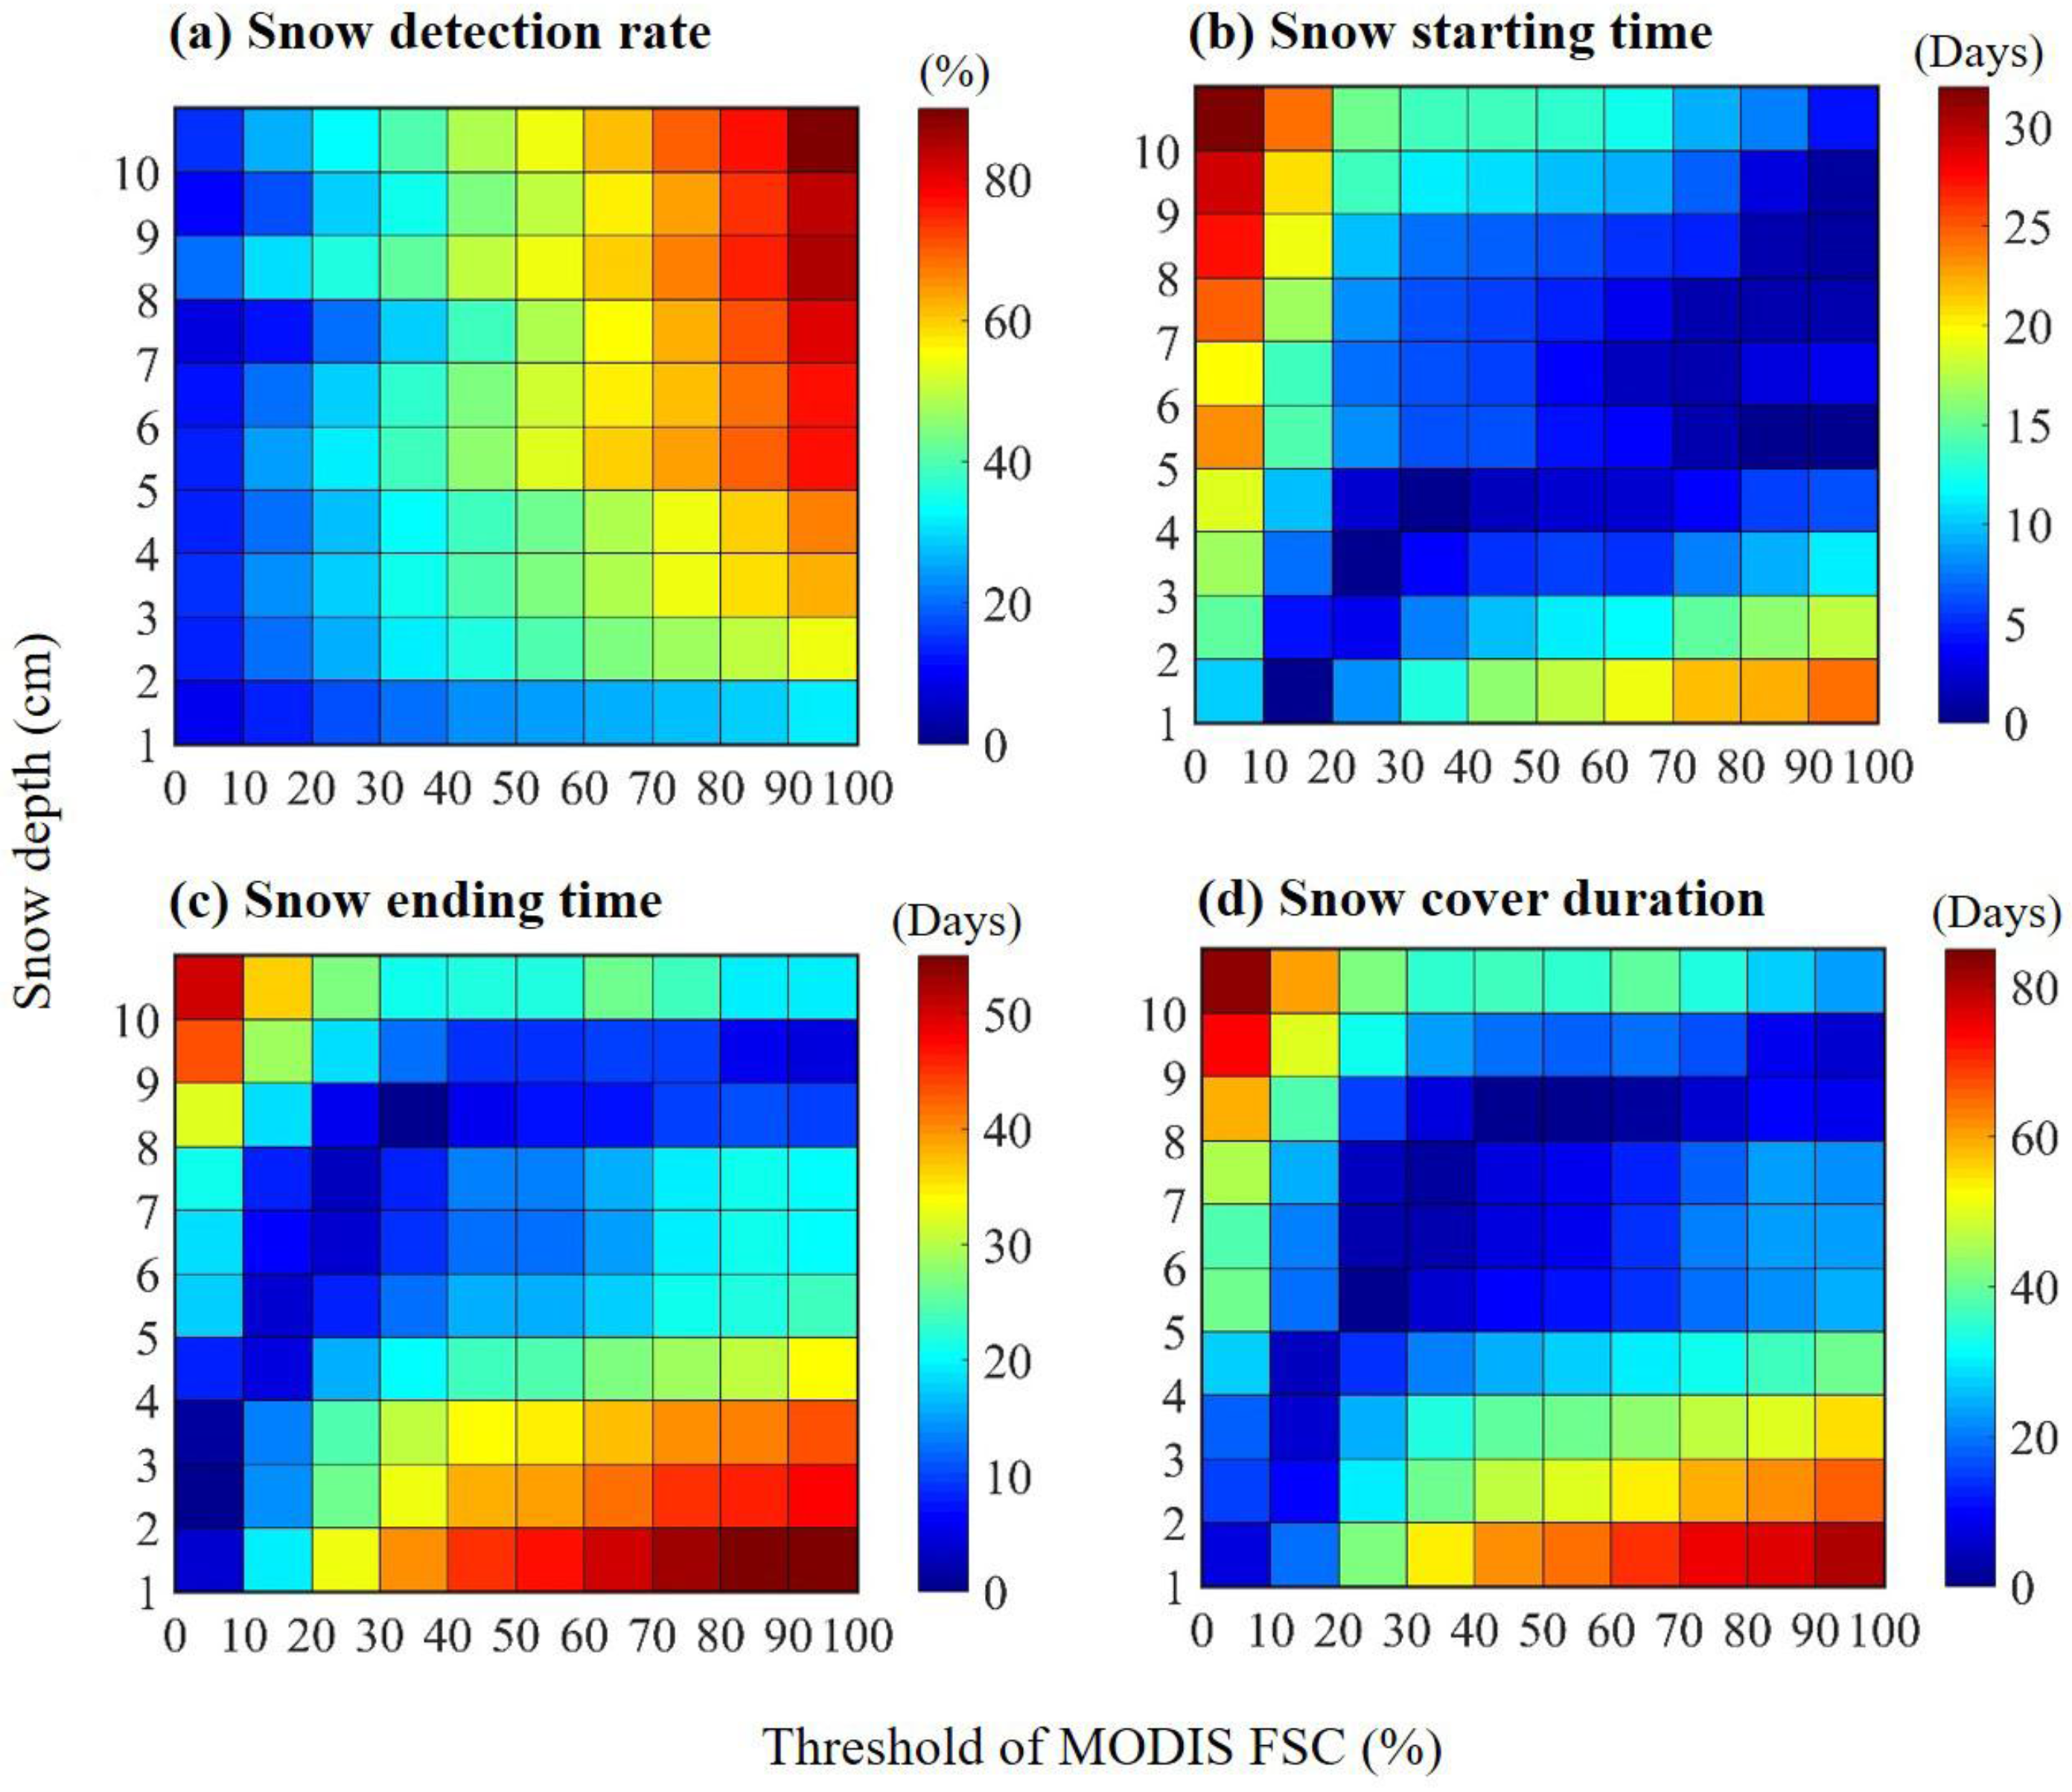
Previous studies recommended the threshold values range from 0.01 m [14,35] to 0.1 m [47] for snow depth, and 0 [15] to 50% for FSC [21,37]. The results in the two thresholds showed a big difference in identifying snow-cover phenology (Figure 8 and Figure 9). A sensitivity study of snow detection rate and errors on snow phenological variables (i.e., snow starting time, snow ending time, and snow cover duration) to the thresholds on snow depth and FSC also display this big difference (Figure 11). The snow detection rate increased with increasing snow depth (Figure 11a), and a relatively high threshold for snow depth value can improve the detection rate. However, our results showed that a high threshold for snow depth cannot improve the identification of snow-cover phenology. This question should be considered when choosing a threshold to identify the snow-cover phenology in different regions. In this study, we suggested that the threshold of 0.01 m for snow depth and 0 for FSC were more suitable to identify snow-cover phenology in QTP when concerned with the characteristics of the thin snow depth in the QTP.
Note that most ground stations are located in inhabited, lower-altitude river valleys, where elevations are usually below 5000 m. The depopulated western region of the QTP needs high-resolution satellite snow-mapping products to monitor the spatial and temporal snow-cover distribution. Besides, although the MODIS snow-cover products have been used successfully in various climatological and hydrological applications [15,20,48,49,50], due to the complex effects of snow cover on land-surface energy and water balances, the uncertainties in climate models introduced by MODIS snow-cover products should be considered.
5. Conclusions
This study has supported the evaluation and verification of the daily cloud-free MODIS snow product at 500 m resolution compared with in situ observations during 2000–2011 over the QTP. The overall accuracy of the daily cloud-free MODIS product was 90.74%, with omission error values of 4.69% and commission error values of 4.57%. The shallow snow depth and mixed pixel effect derived from the MODIS snow-cover product caused the OE and CE. Compared with in situ observations, the snow-cover product exhibited different snow-cover phenology when choosing the threshold of FSC >0 and FSC >50%. The results obtained here verify that the daily cloud-free MODIS snow-cover product has high accuracy to reflect snow cover and snow phenology, but there still exist uncertainties. Further studies cannot ignore the wind speed and complex terrain in the QTP when using the MODIS snow-cover products.
Acknowledgments
This study was supported by Key Project of Chinese Academy of Sciences (CAS) (KJZD-EW-G03-04), One Hundred Person Project of CAS, and National Science Foundation for Excellent Young Scholars of China (41322005). We are grateful to Hongjie Xie for his valuable revision suggestions. We are grateful to Zhiguang Tang for his data suggestions.
Author Contributions
Wenping Yuan conceived and designed this research; Wenfang Xu performed analysis and calculations; Wenfang Xu and Wenping Yuan wrote and revised the paper. Hanqing Ma, and Donghai Wu contributed revision suggestions.
Conflicts of Interest
The authors declare no conflict of interest.
References
- Yang, K.; Wu, H.; Qin, J.; Lin, C.; Tang, W.; Chen, Y. Recent climate changes over the Tibetan Plateau and their impacts on energy and water cycle: A review. Glob. Planet. Chang. 2014, 112, 79–91. [Google Scholar] [CrossRef]
- Yao, T.; Thompson, L.; Yang, W.; Yu, W.; Gao, Y.; Guo, X.; Yang, X.; Duan, K.; Zhao, H.; Xu, B.; et al. Different glacier status with atmospheric circulations in Tibetan Plateau and surroundings. Nat. Clim. Chang. 2012, 2, 663–667. [Google Scholar] [CrossRef]
- Euskirchen, E.S.; McGuire, A.D.; Chapin, F.S. Energy feedbacks of northern high-latitude ecosystems to the climate system due to reduced snow cover during 20th century warming. Glob. Chang. Biol. 2007, 13, 2425–2438. [Google Scholar] [CrossRef]
- Kang, S.; Xu, Y.; You, Q.; Flügel, W.A.; Pepin, N.; Yao, T. Review of climate and cryospheric change in the Tibetan Plateau. Environ. Res. Lett. 2010, 5, 015101. [Google Scholar] [CrossRef]
- Chen, L. The role of the anomalous snow cover over the Qinghai-Xizang Plateau and ENSO in the great floods of 1998 in the Changjiang River valley. Chin. J. Atmos. Sci. 2001, 25, 184–192. (In Chinese) [Google Scholar]
- Yang, S. ENSO-snow-monsoon associations and seasonal-interannual prediction. Clim. Dyn. 1996, 16, 2038–2051. [Google Scholar] [CrossRef]
- Immerzeel, W.W.; Droogers, P.; de Jong, S.M.; Bierkens, M.F.P. Large-scale monitoring of snow cover and runoff simulation in Himalayan river basins using remote sensing. Remote Sens. Environ. 2009, 113, 40–49. [Google Scholar] [CrossRef]
- Barnett, T.P.; Adam, J.C.; Lettenmaier, D.P. Potential impacts of a warming climate on water availability in snow-dominated regions. Nature 2005, 438, 303–309. [Google Scholar] [CrossRef] [PubMed]
- Choi, G.; Robinson, D.A.; Kang, S. Changing northern hemisphere snow seasons. J. Clim. 2010, 23, 5305–5310. [Google Scholar] [CrossRef]
- Flanner, M.G.; Shell, K.M.; Barlage, M.; Perovich, D.K.; Tschudi, M.A. Radiative forcing and albedo feedback from the northern hemisphere cryosphere between 1979 and 2008. Nat. Geosci. 2011, 4, 151–155. [Google Scholar] [CrossRef]
- Peng, S.; Piao, S.; Ciais, P.; Friedlingstein, P.; Zhou, L.; Wang, T. Change in snow phenology and its potential feedback to temperature in the northern hemisphere over the last three decades. Environ. Res. Lett. 2013, 8, 014008. [Google Scholar] [CrossRef]
- Chen, X.; Liang, S.; Cao, Y. Satellite observed changes in the northern hemisphere snow cover phenology and the associated radiative forcing and feedback between 1982 and 2013. Environ. Res. Lett. 2016, 11, 084002. [Google Scholar] [CrossRef]
- Ke, C.Q.; Li, X.C.; Xie, H.; Liu, X.; Kou, C. Variability in snow cover phenology in China from 1952 to 2010. Hydrol. Earth Syst. Sci. Discuss. 2015, 12, 4471–4506. [Google Scholar] [CrossRef]
- Xu, W.; Ma, L.; Ma, M.; Zhang, H.; Yuan, W. Spatial–temporal variability of snow cover and depth in the Qinghai–Tibetan Plateau. J. Clim. 2017, 30, 1521–1533. [Google Scholar] [CrossRef]
- Chen, X.; Liang, S.; Cao, Y.; He, T.; Wang, D. Observed contrast changes in snow cover phenology in northern middle and high latitudes from 2001–2014. Sci. Rep. 2015, 5, 16820. [Google Scholar] [CrossRef] [PubMed]
- Liu, J.; Chen, R. Studying the spatiotemporal variation of snow-covered days over china based on combined use of MODIS snow-covered days and in situ observations. Theor. Appl. Climatol. 2011, 106, 355–363. [Google Scholar] [CrossRef]
- Hall, D.K.; Riggs, G.A. Accuracy assessment of the MODIS snow products. Hydrol. Process. 2007, 21, 1534–1547. [Google Scholar] [CrossRef]
- Hall, D.K.; Riggs, G.A.; Salomonson, V.V.; DiGirolamo, N.E.; Bayr, K.J. MODIS snow-cover products. Remote Sens. Environ. 2002, 83, 181–194. [Google Scholar] [CrossRef]
- Huang, X.; Deng, J.; Wang, W.; Feng, Q.; Liang, T. Impact of climate and elevation on snow cover using integrated remote sensing snow products in Tibetan Plateau. Remote Sens. Environ. 2017, 190, 274–288. [Google Scholar] [CrossRef]
- Chen, X.; Liang, S.; Cao, Y.; He, T. Distribution, attribution, and radiative forcing of snow cover changes over China from 1982 to 2013. Clim. Chang. 2016, 137, 363–377. [Google Scholar] [CrossRef]
- Marchane, A.; Jarlan, L.; Hanich, L.; Boudhar, A.; Gascoin, S.; Tavernier, A.; Filali, N.; Le Page, M.; Hagolle, O.; Berjamy, B. Assessment of daily MODIS snow cover products to monitor snow cover dynamics over the Moroccan Atlas mountain range. Remote Sens. Environ. 2015, 160, 72–86. [Google Scholar] [CrossRef]
- Ault, T.W.; Czajkowski, K.P.; Benko, T.; Coss, J.; Struble, J.; Spongberg, A.; Templin, M.; Gross, C. Validation of the MODIS snow product and cloud mask using student and NWS cooperative station observations in the Lower Great Lakes Region. Remote Sens. Environ. 2006, 105, 341–353. [Google Scholar] [CrossRef]
- Wunderle, S.; Gross, T.; Hüsler, F. Snow Extent Variability in Lesotho Derived from MODIS Data (2000–2014). Remote Sens. 2016, 8, 448. [Google Scholar] [CrossRef]
- Pu, Z.; Xu, L.; Salomonson, V.V. MODIS/Terra observed seasonal variations of snow cover over the Tibetan Plateau. Geophys. Res. Lett. 2007, 34. [Google Scholar] [CrossRef]
- Gao, J.; Williams, M.W.; Fu, Xu.; Wang, G.; Gong, T. Spatiotemporal distribution of snow in eastern Tibet and the response to climate change. Remote Sens. Environ. 2012, 121, 1–9. [Google Scholar] [CrossRef]
- Dietz, A.J.; Wohner, C.; Kuenzer, C. European Snow Cover Characteristics between 2000 and 2011 Derived from Improved MODIS Daily Snow Cover Products. Remote Sens. 2012, 4, 2432–2454. [Google Scholar] [CrossRef]
- Zhou, H.; Aizen, E.; Aizen, V. Deriving long term snow cover extent dataset from AVHRR and MODIS data: Central Asia case study. Remote Sens. Environ. 2013, 136, 146–162. [Google Scholar] [CrossRef]
- Singh, S.K.; Rathore, B.P.; Bahuguna, I.M. Snow cover variability in the Himalayan-Tibetan region. Int. J. Climatol. 2014, 34, 446–452. [Google Scholar] [CrossRef]
- Surer, S.; Akyurek, Z. Evaluating the utility of the EUMETSAT HSAF snow recognition product over mountainous areas of eastern Turkey. Hydrol. Sci. J. 2012, 57, 1684–1694. [Google Scholar] [CrossRef]
- Simic, A.; Fernandes, R.; Brown, R.; Romanov, P.; Park, W. Validation of VEGETATION, MODIS, and GOES+ SSM/I snow-cover products over Canada based on surface snow depth observations. Hydrol. Process. 2004, 18, 1089–1104. [Google Scholar] [CrossRef]
- Wang, X.; Xie, H.; Liang, T. Evaluation of MODIS snow cover and cloud mask and its application in Northern Xinjiang, China. Remote Sens. Environ. 2008, 112, 1497–1513. [Google Scholar] [CrossRef]
- Tekeli, A.E.; Akyürek, Z.; Arda Şorman, A.; Şensoy, A.; Ünal Şorman, A. Using MODIS snow cover maps in modeling snowmelt runoff process in the eastern part of Turkey. Remote Sens. Environ. 2005, 97, 216–230. [Google Scholar] [CrossRef]
- Wang, X.; Xie, H.; Liang, T.; Huang, X. Comparison and validation of MODIS standard and new combination of terra and aqua snow cover products in northern Xinjiang, China. Hydrol. Process. 2009, 23, 419–429. [Google Scholar] [CrossRef]
- Xie, H. Development and assessment of combined terra and aqua snow cover products in Colorado Plateau, USA and northern Xinjiang, China. J. Appl. Remote Sens. 2009, 3, 033559. [Google Scholar] [CrossRef]
- Parajka, J.; Blöschl, G. Validation of MODIS snow cover images over Austria. Hydrol. Earth Syst. Sci. 2006, 3, 1569–1601. [Google Scholar] [CrossRef]
- Liang, T.; Zhang, X.; Xie, H.; Wu, C.; Feng, Q.; Huang, X.; Chen, Q. Toward improved daily snow cover mapping with advanced combination of MODIS and AMSR-E measurements. Remote Sens. Environ. 2008, 112, 3750–3761. [Google Scholar] [CrossRef]
- Tang, Z.; Wang, J.; Li, H.; Yan, L. Spatiotemporal changes of snow cover over the Tibetan Plateau based on cloud-removed moderate resolution imaging spectroradiometer fractional snow cover product from 2001 to 2011. J. Appl. Remote Sens. 2013, 7, 073582. [Google Scholar] [CrossRef]
- Yuan, W.; Xu, W.; Ma, M.; Chen, S.; Liu, W. Improved snow cover model in terrestrial ecosystem models over the Qinghai–Tibetan Plateau. Agric. For. Meteorol. 2016, 218–219, 161–170. [Google Scholar] [CrossRef]
- Wang, G.; Hu, H.; Li, T. The influence of freeze–thaw cycles of active soil layer on surface runoff in a permafrost watershed. J. Hydrol. 2009, 375, 438–449. [Google Scholar] [CrossRef]
- You, Q.; Fraedrich, K.; Ren, G.; Pepin, N.; Kang, S. Variability of temperature in the Tibetan Plateau based on homogenized surface stations and reanalysis data. Int. J. Climatol. 2013, 33, 1337–1347. [Google Scholar] [CrossRef]
- Yang, J.; Jiang, L.; Ménard, C.B.; Luojus, K.; Lemmetyinen, J.; Pulliainen, J. Evaluation of snow products over the Tibetan Plateau. Hydrol. Process. 2015, 29, 3247–3260. [Google Scholar] [CrossRef]
- Klein, A. Validation of daily MODIS snow cover maps of the Upper Rio Grande River Basin for the 2000–2001 snow year. Remote Sens. Environ. 2003, 86, 162–176. [Google Scholar] [CrossRef]
- Huang, X.; Liang, T.; Zhang, X.; Guo, Z. Validation of MODIS snow cover products using landsat and ground measurements during the 2001–2005 snow seasons over northern Xinjiang, China. Int. J. Remote Sens. 2011, 32, 133–152. [Google Scholar] [CrossRef]
- Şorman, A.Ü.; Akyürek, Z.; Şensoy, A.; Tekeli, A.E. Commentary on comparison of MODIS snow cover and albedo products with ground observations over the mountainous terrain of Turkey. Hydrol. Earth Syst. Sci. 2007, 11, 1353–1360. [Google Scholar]
- Qin, D.; Liu, S.; Li, P. Snow Cover Distribution, Variability, and Response to Climate Change in Western China. J. Clim. 2006, 19, 1820–1833. [Google Scholar] [CrossRef]
- Arsenault, K.R.; Houser, P.R.; De Lannoy, G.J.M. Evaluation of the MODIS snow cover fraction product. Hydrol. Process. 2014, 28, 980–998. [Google Scholar] [CrossRef]
- Gao, Y.; Xie, H.; Yao, T.; Xue, C. Integrated assessment on multi-temporal and multi-sensor combinations for reducing cloud obscuration of MODIS snow cover products of the Pacific Northwest USA. Remote Sens. Environ. 2010, 114, 1662–1675. [Google Scholar] [CrossRef]
- Yuan, W.; Xu, B.; Chen, Z.; Xia, J.; Xu, W.; Chen, Y.; Wu, X.; Fu, Y. Validation of China-wide interpolated daily climate variables from 1960 to 2011. Theor. Appl. Climatol. 2015, 119, 689–700. [Google Scholar]
- Akyurek, Z.; Surer, S.; Beser, Ö. Investigation of the snow-cover dynamics in the Upper Euphrates Basin of Turkey using remotely sensed snow-cover products and hydrometeorological data. Hydrol. Process. 2011, 25, 3637–3648. [Google Scholar] [CrossRef]
- Zhang, G.Q.; Xie, H.J.; Yao, T.D.; Liang, T.G.; Kang, S.C. Snow cover dynamics of four lake basins over Tibetan Plateau using time series MODIS data (2001–2010). Water Resour. Res. 2012, 48, W10529. [Google Scholar] [CrossRef]
Figure 1.
Distribution of meteorological stations over Qinghai-Tibetan Plateau in China. The gray shaded area indicates the region of the Qinghai-Tibetan Plateau, and the dots show the 87 meteorological stations.
Figure 1.
Distribution of meteorological stations over Qinghai-Tibetan Plateau in China. The gray shaded area indicates the region of the Qinghai-Tibetan Plateau, and the dots show the 87 meteorological stations.
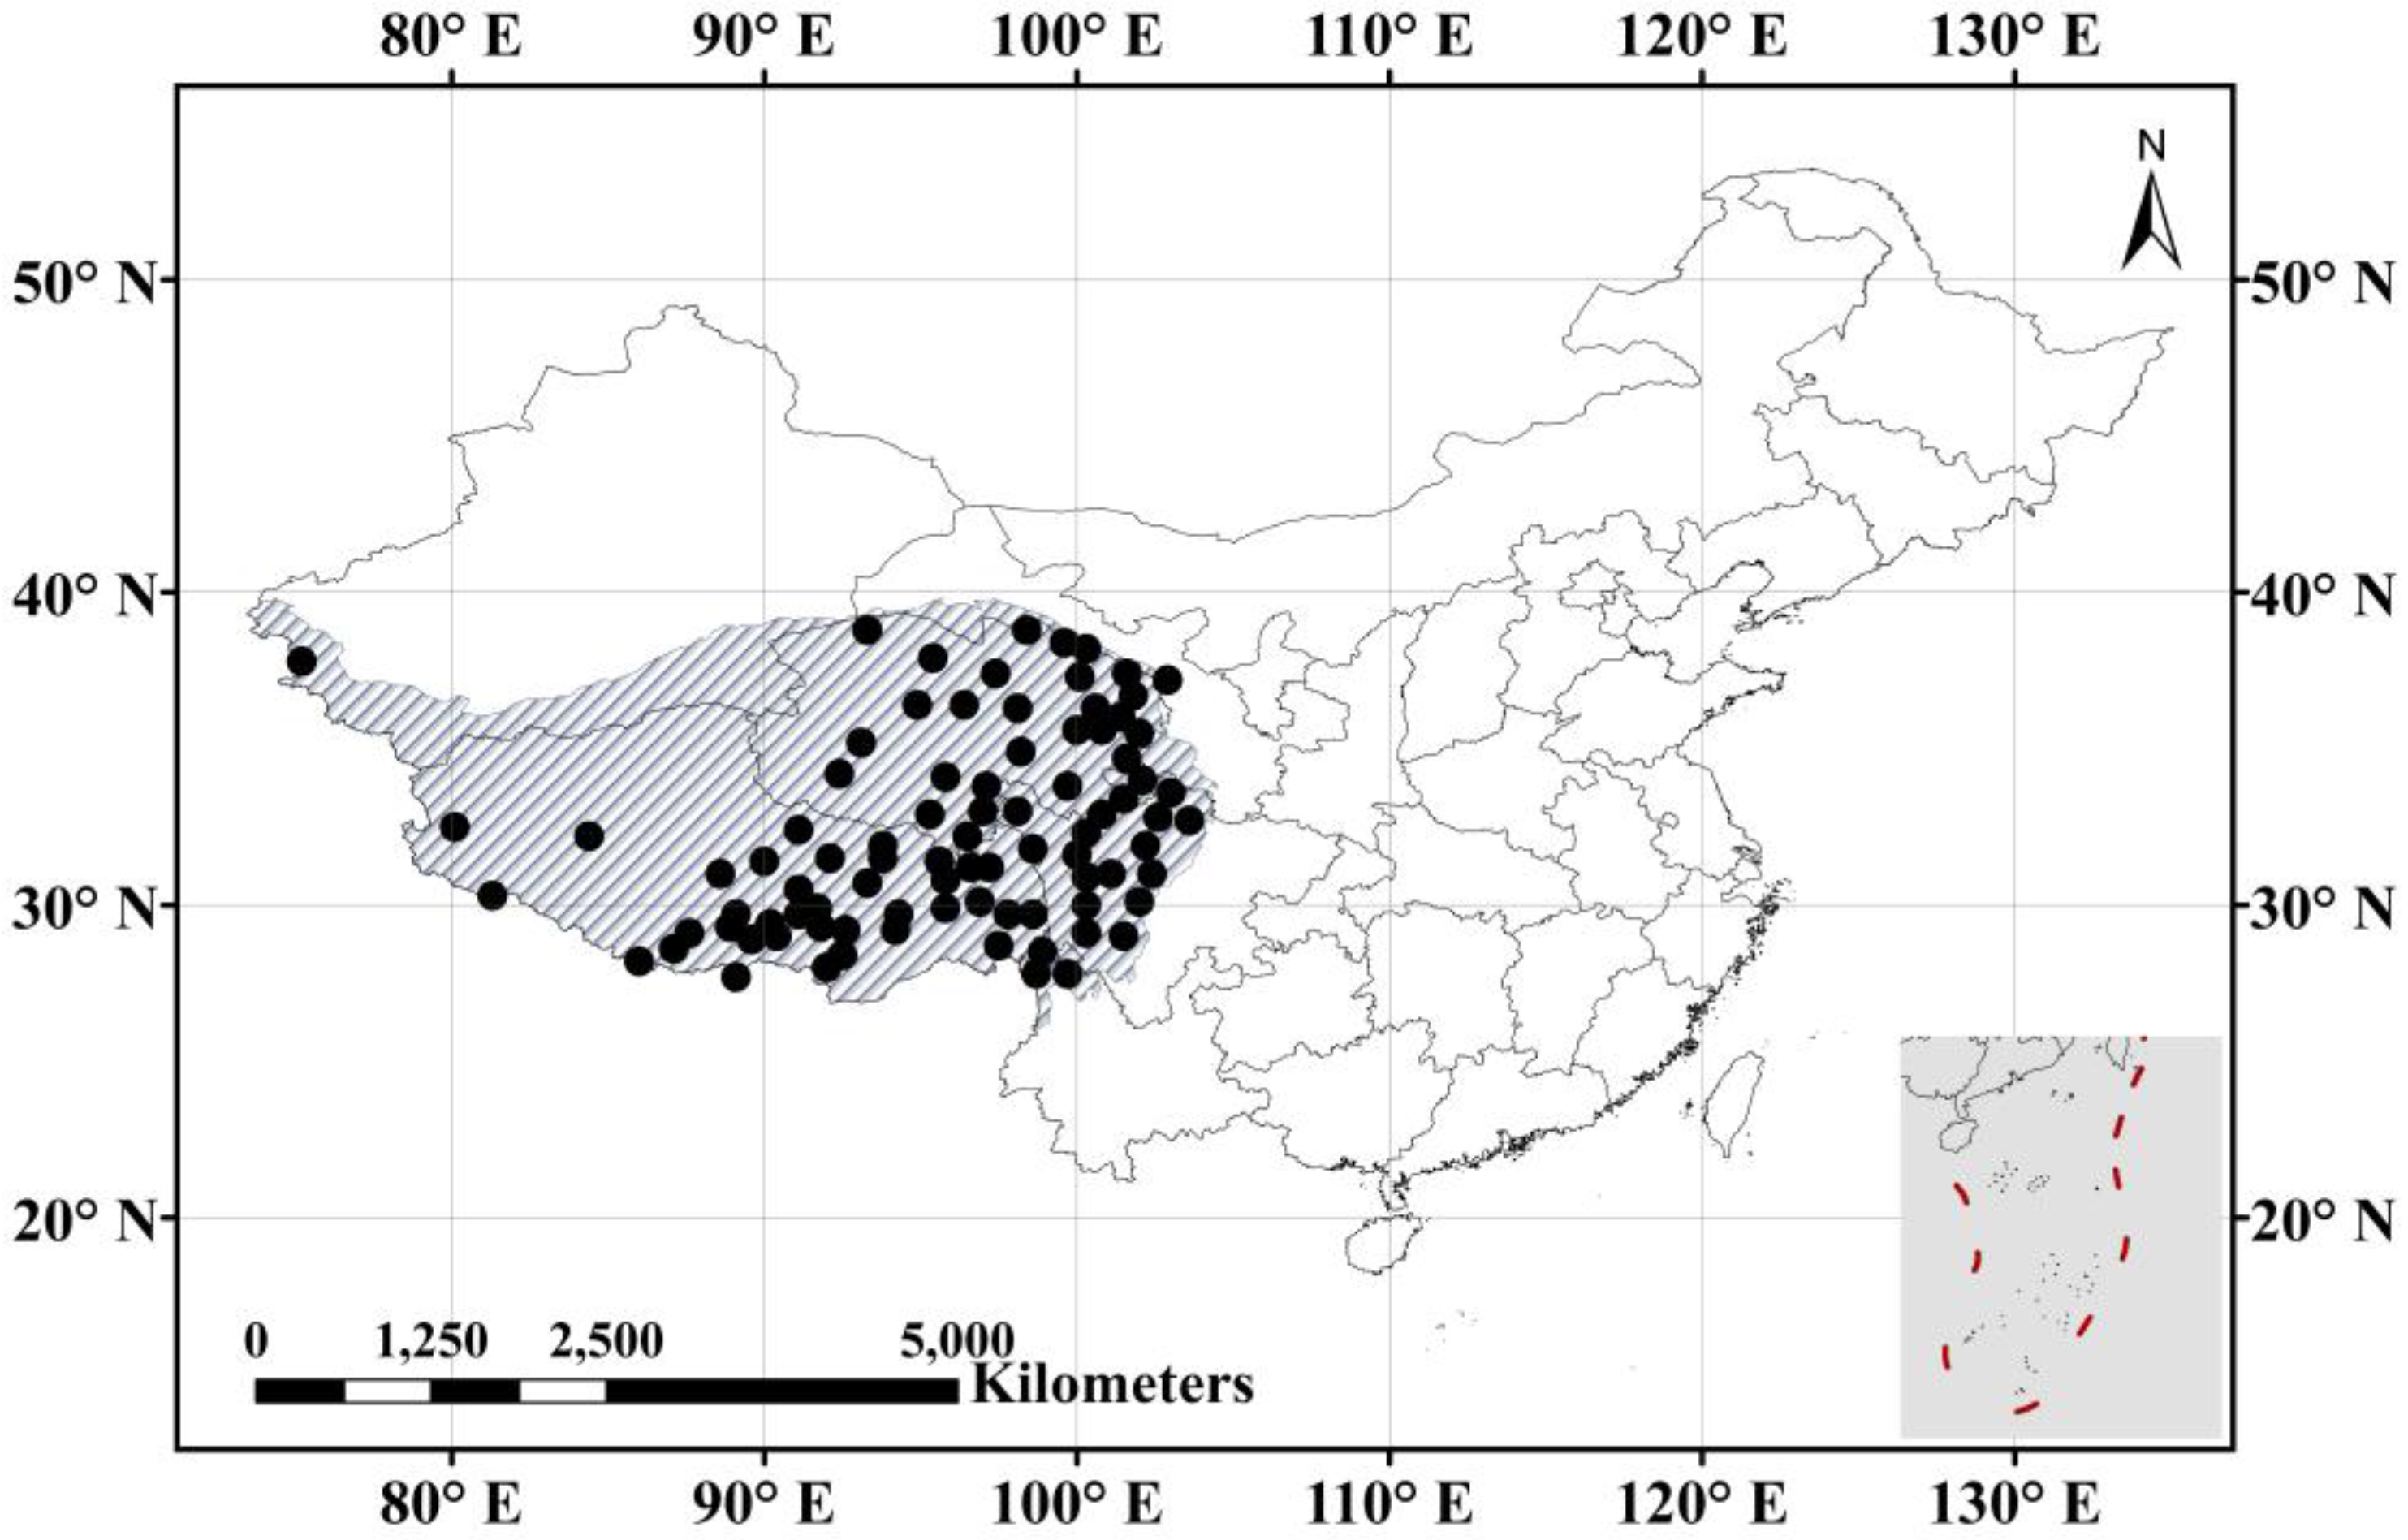
Figure 2.
The percentage of phenology data distribution on the threshold of fractional snow cover (FSC) >0 and FSC >50% based on the threshold of snow depth ≥1 cm during 2000–2010. Note: 0 value, no snow cover phenology was detected in at least one of the two data sets (i.e., in-situ data and MODIS data); in half year, both the snow starting time and snow ending time was detected in a half-year period (January to July or August to December); available, the data used in this analysis (i.e., the snow starting time was detected in the latter half of the year (August–December), and the snow ending time was detected in the first half of the year (January–July)); missing, missing data except for the above data category.
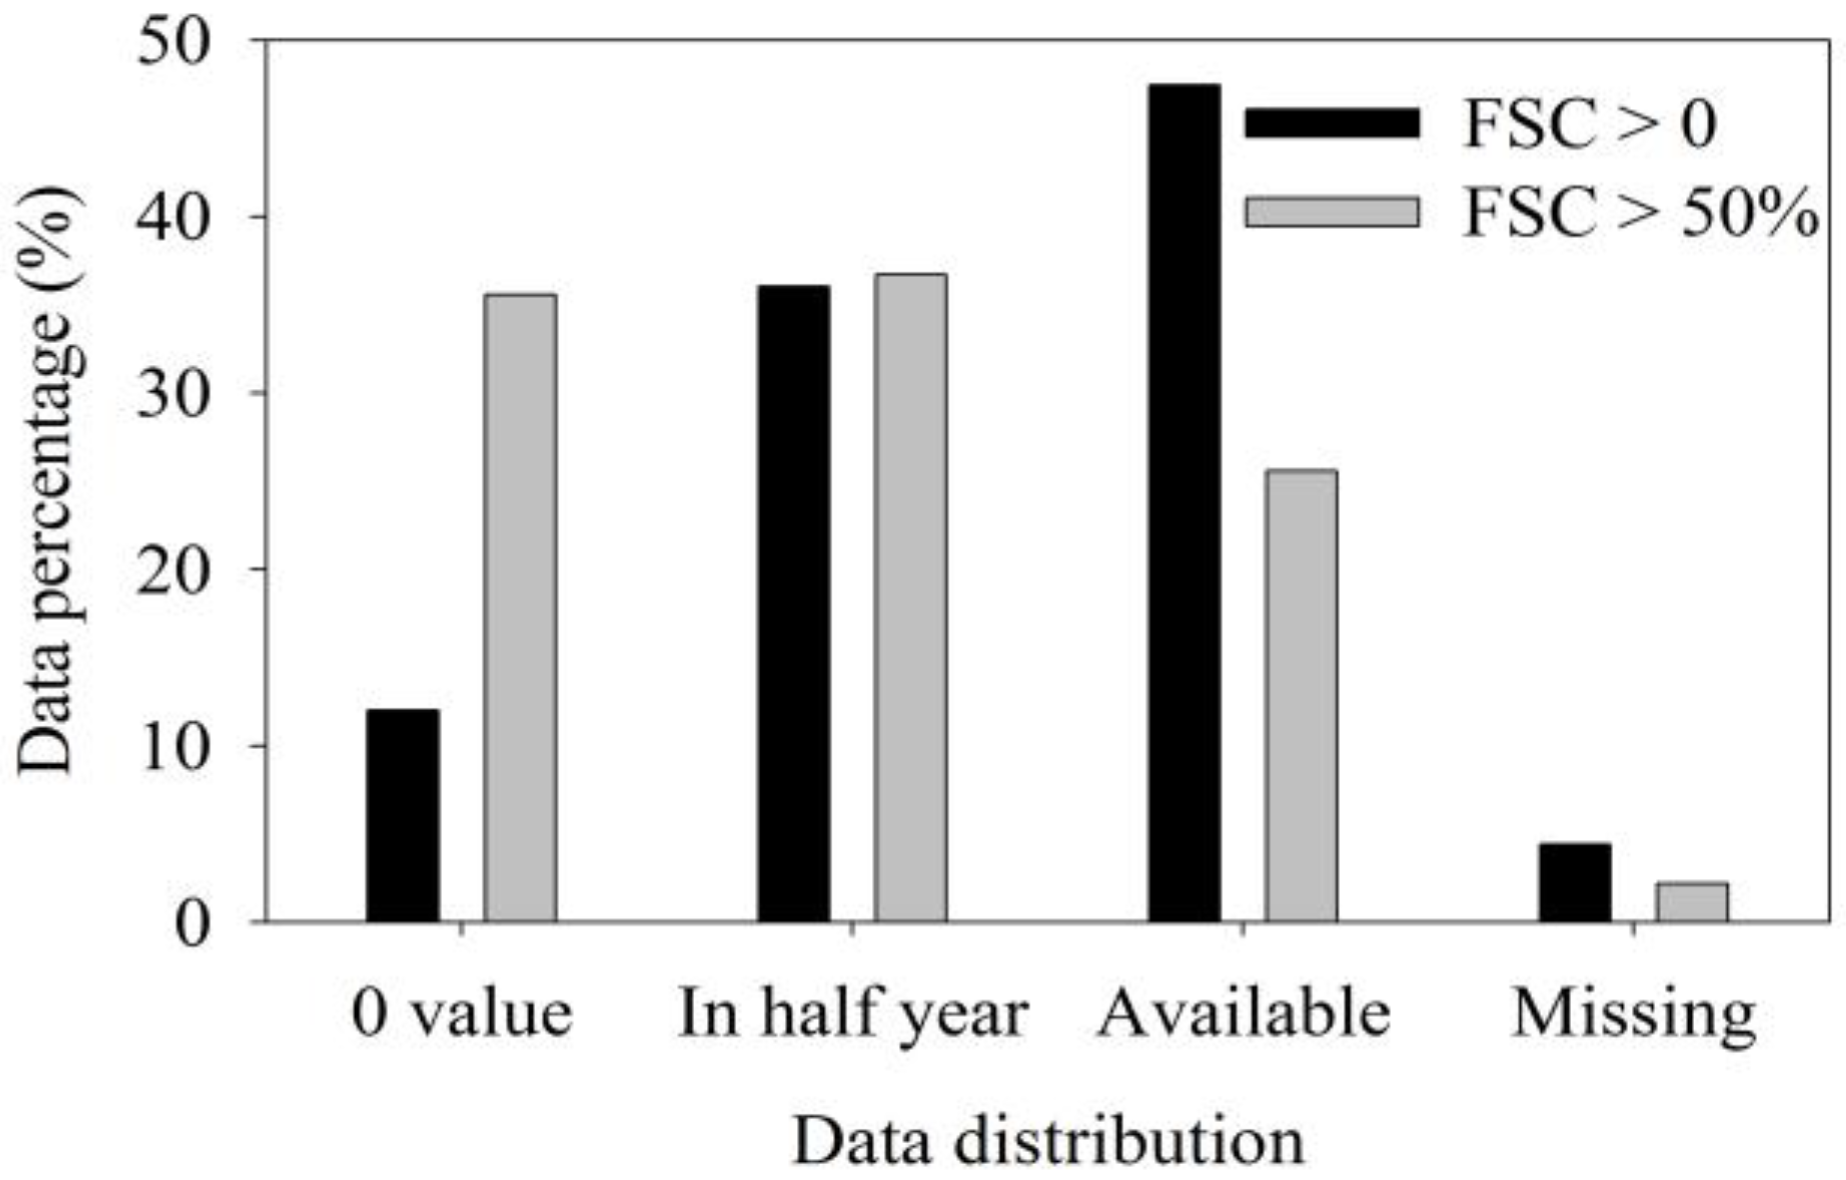
Figure 3.
Overall performance of snow classification accuracy at 87 stations from 2000 to 2011 among different elevations (E1: ≤3000 m (a), E2: 3000–4000 m (b); E3: >4000 m (c); E: all sites (d)).
Figure 3.
Overall performance of snow classification accuracy at 87 stations from 2000 to 2011 among different elevations (E1: ≤3000 m (a), E2: 3000–4000 m (b); E3: >4000 m (c); E: all sites (d)).

Figure 4.
Distribution of overall accuracy (OA) during the period of 2000–2011 in the Qinghai-Tibetan Plateau. The inset graph above shows the frequency distributions of the corresponding overall accuracy.
Figure 4.
Distribution of overall accuracy (OA) during the period of 2000–2011 in the Qinghai-Tibetan Plateau. The inset graph above shows the frequency distributions of the corresponding overall accuracy.

Figure 5.
The accuracy of MODIS snow cover products under snow cover event of ground station. Note that the accuracy of snow–snow indicates the snow detection rate.
Figure 5.
The accuracy of MODIS snow cover products under snow cover event of ground station. Note that the accuracy of snow–snow indicates the snow detection rate.
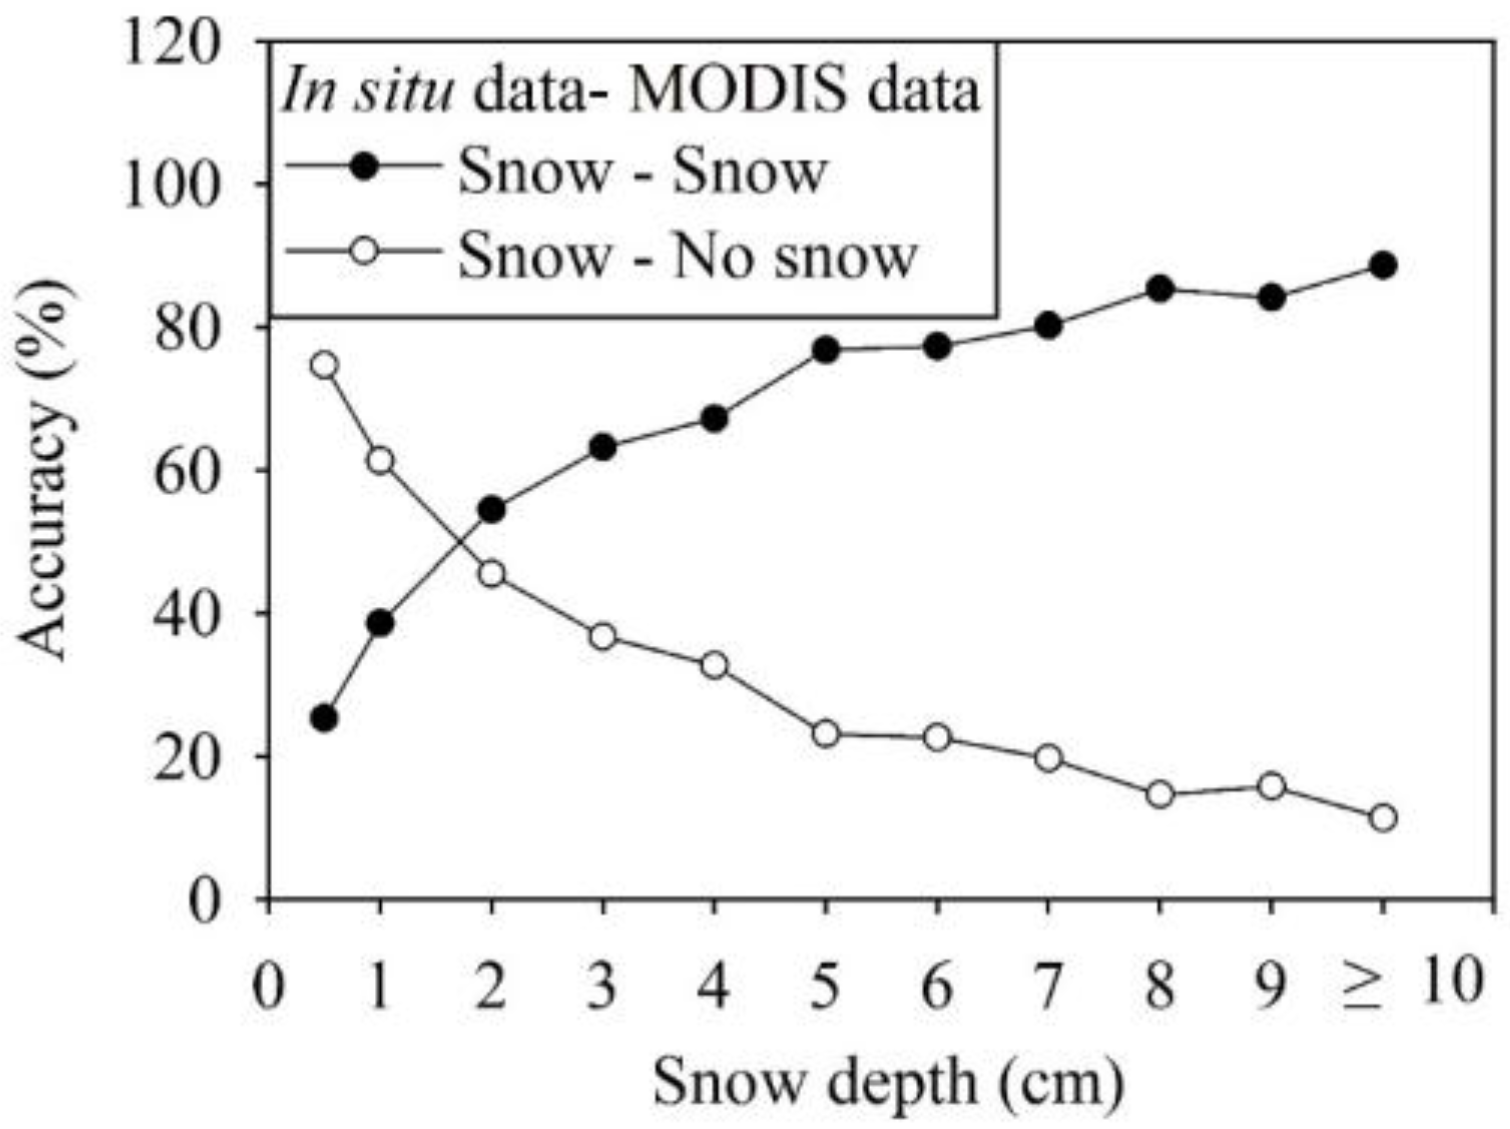
Figure 6.
Snow detection rate related to the snow depth according to month (a), and year (b) during the period of 2000–2011. Note that the accuracy indicates the snow detection rate.
Figure 6.
Snow detection rate related to the snow depth according to month (a), and year (b) during the period of 2000–2011. Note that the accuracy indicates the snow detection rate.
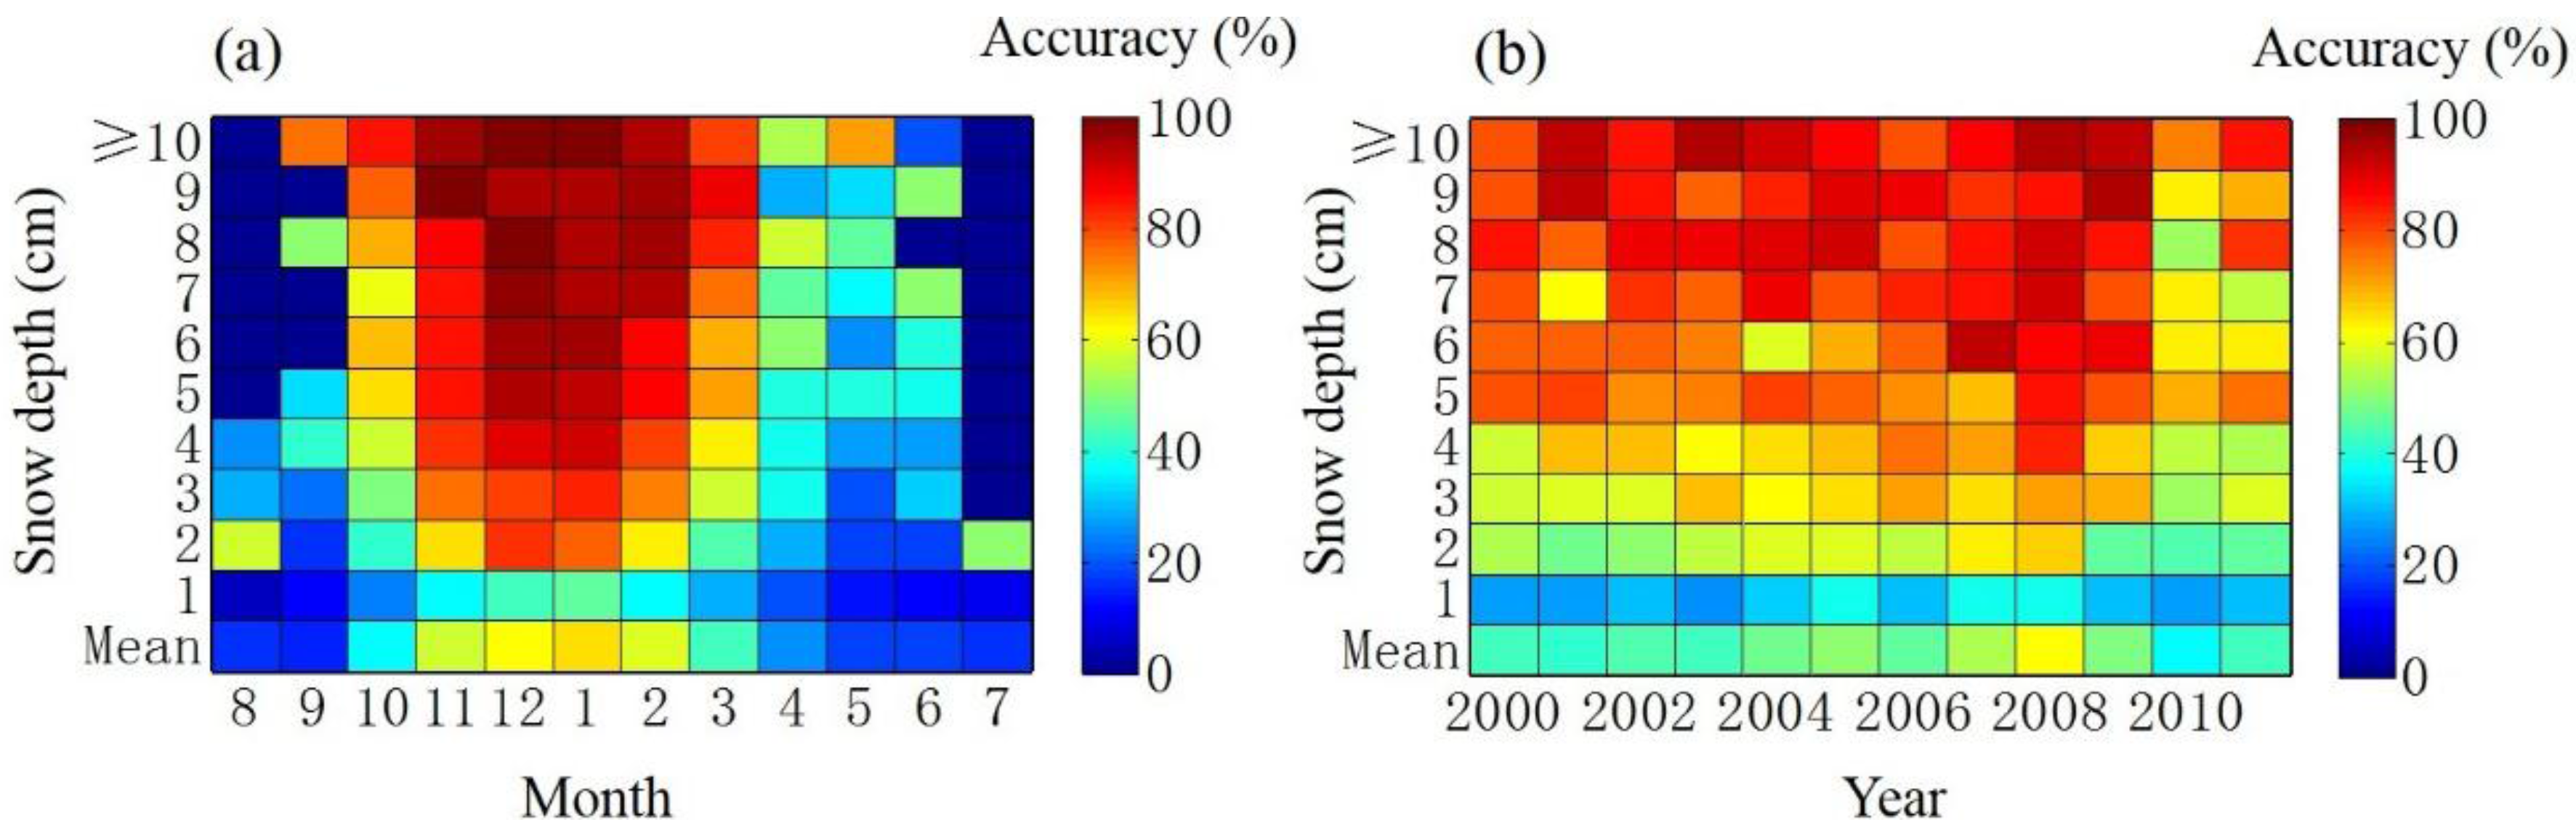
Figure 7.
The relationship between in situ derived snow-cover days and MODIS-derived snow-cover days on the threshold of FSC >0 (a) and FSC >50% (b) in the Qinghai-Tibetan Plateau during 2000–2010.
Figure 7.
The relationship between in situ derived snow-cover days and MODIS-derived snow-cover days on the threshold of FSC >0 (a) and FSC >50% (b) in the Qinghai-Tibetan Plateau during 2000–2010.
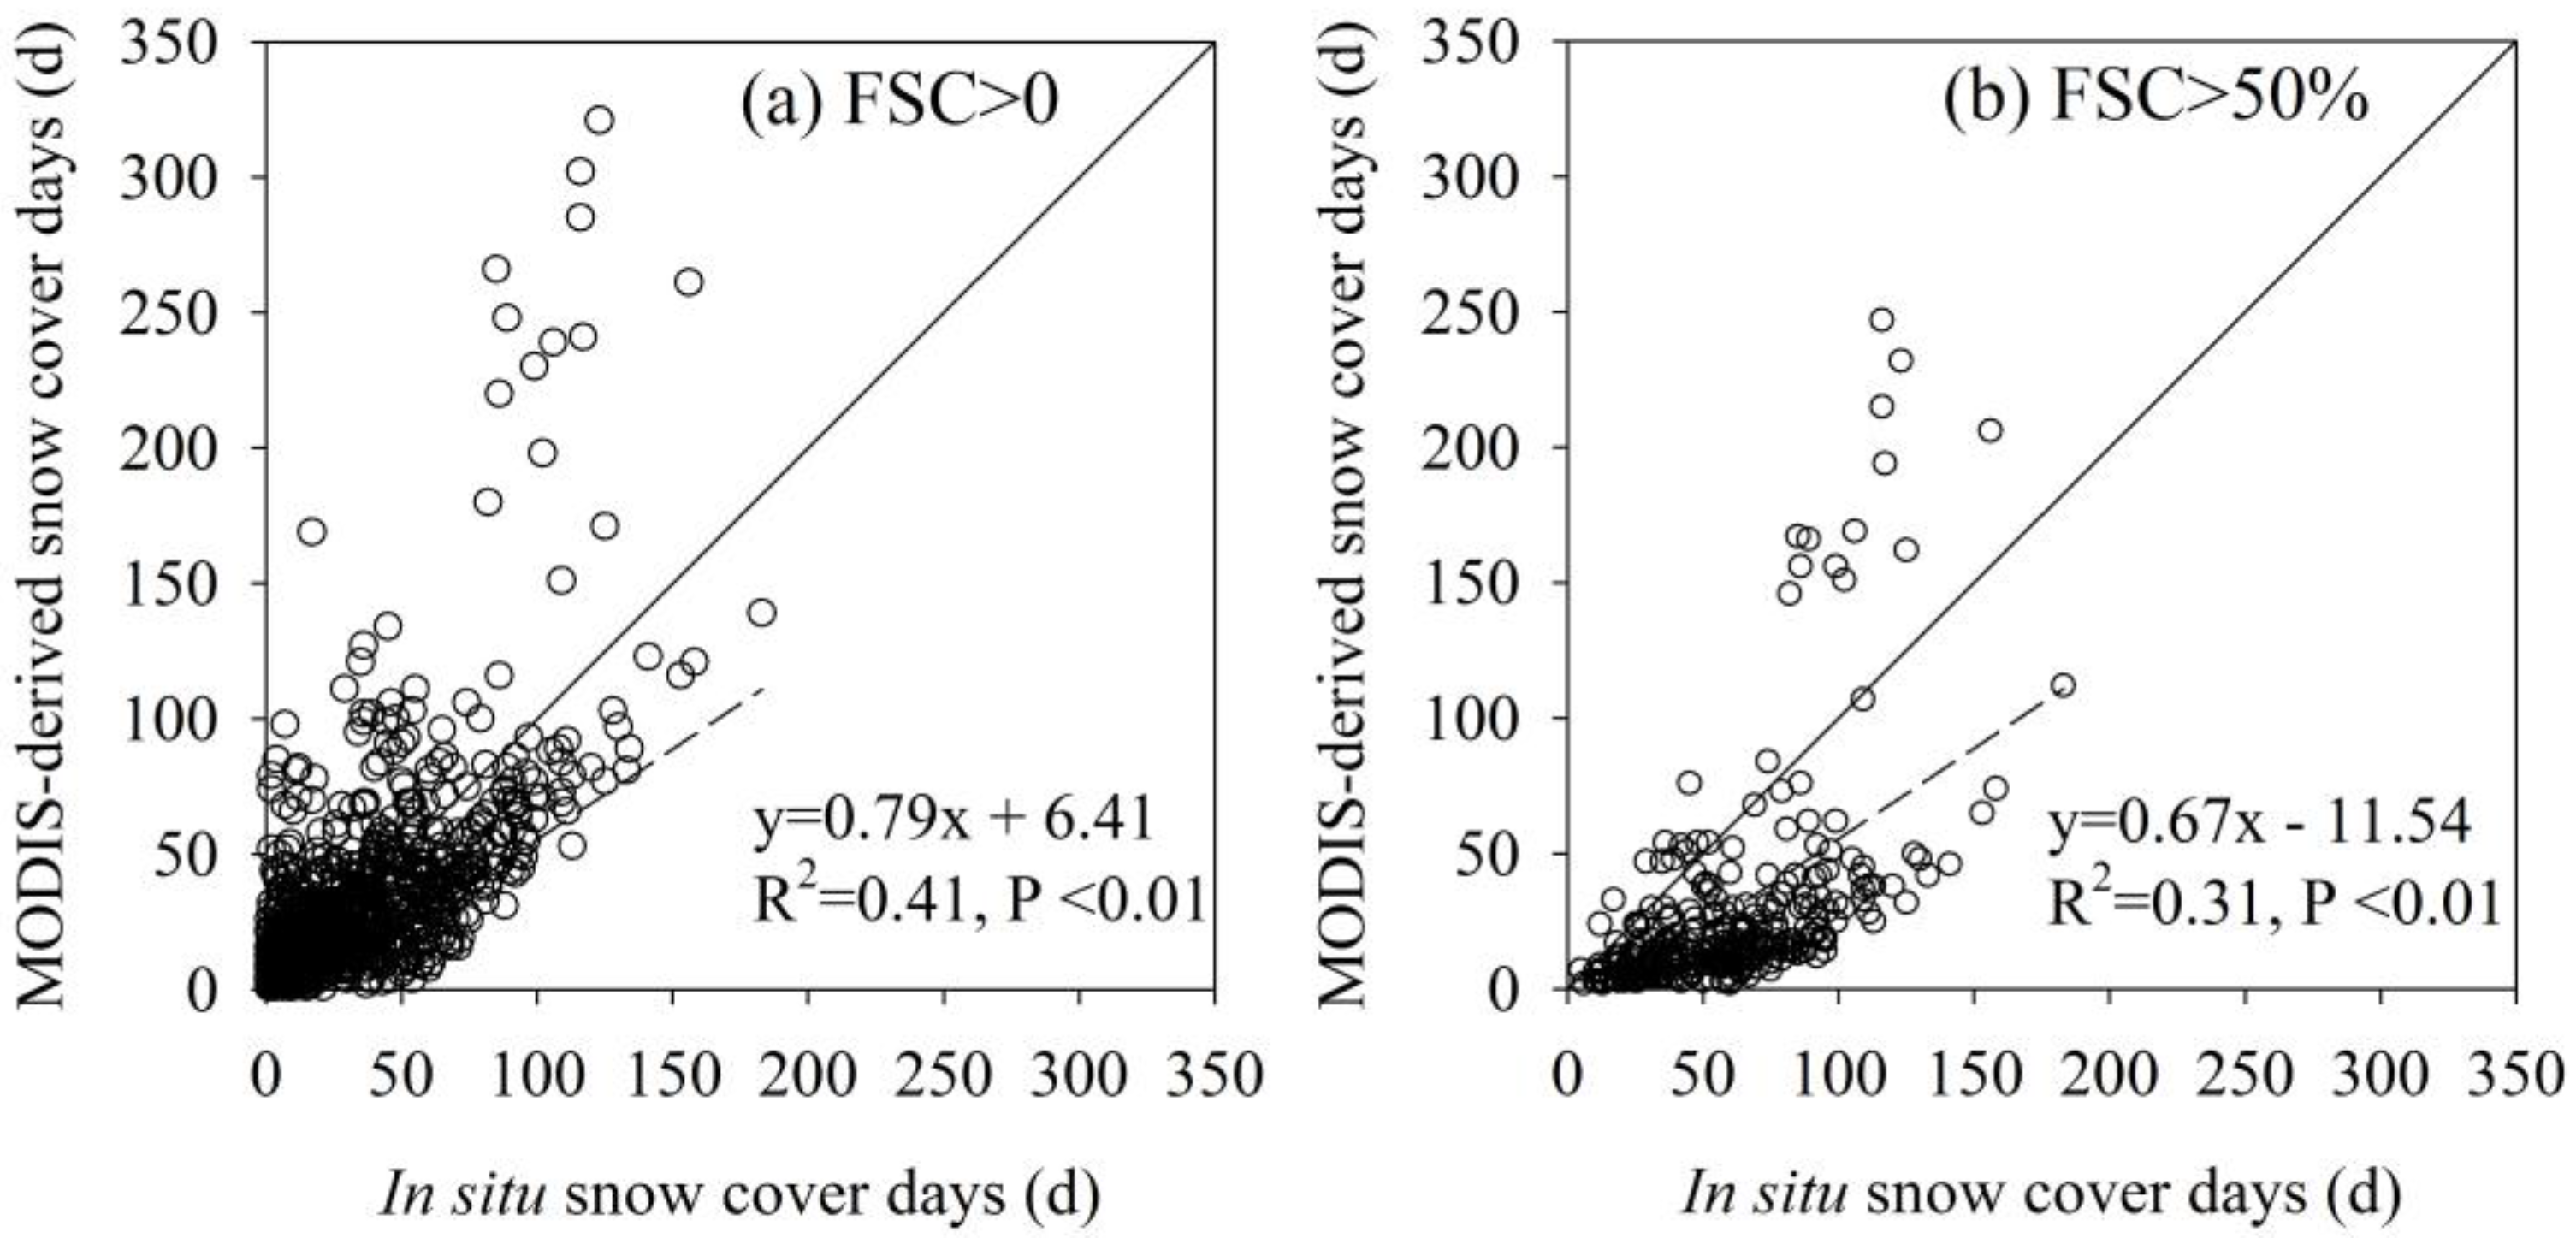
Figure 8.
The relationship between the in situ data and MODIS data in the snow starting time, the snow ending time, and the snow-cover duration on both the threshold of FSC >0 (71 sites available) and FSC >50% (40 sites available).
Figure 8.
The relationship between the in situ data and MODIS data in the snow starting time, the snow ending time, and the snow-cover duration on both the threshold of FSC >0 (71 sites available) and FSC >50% (40 sites available).
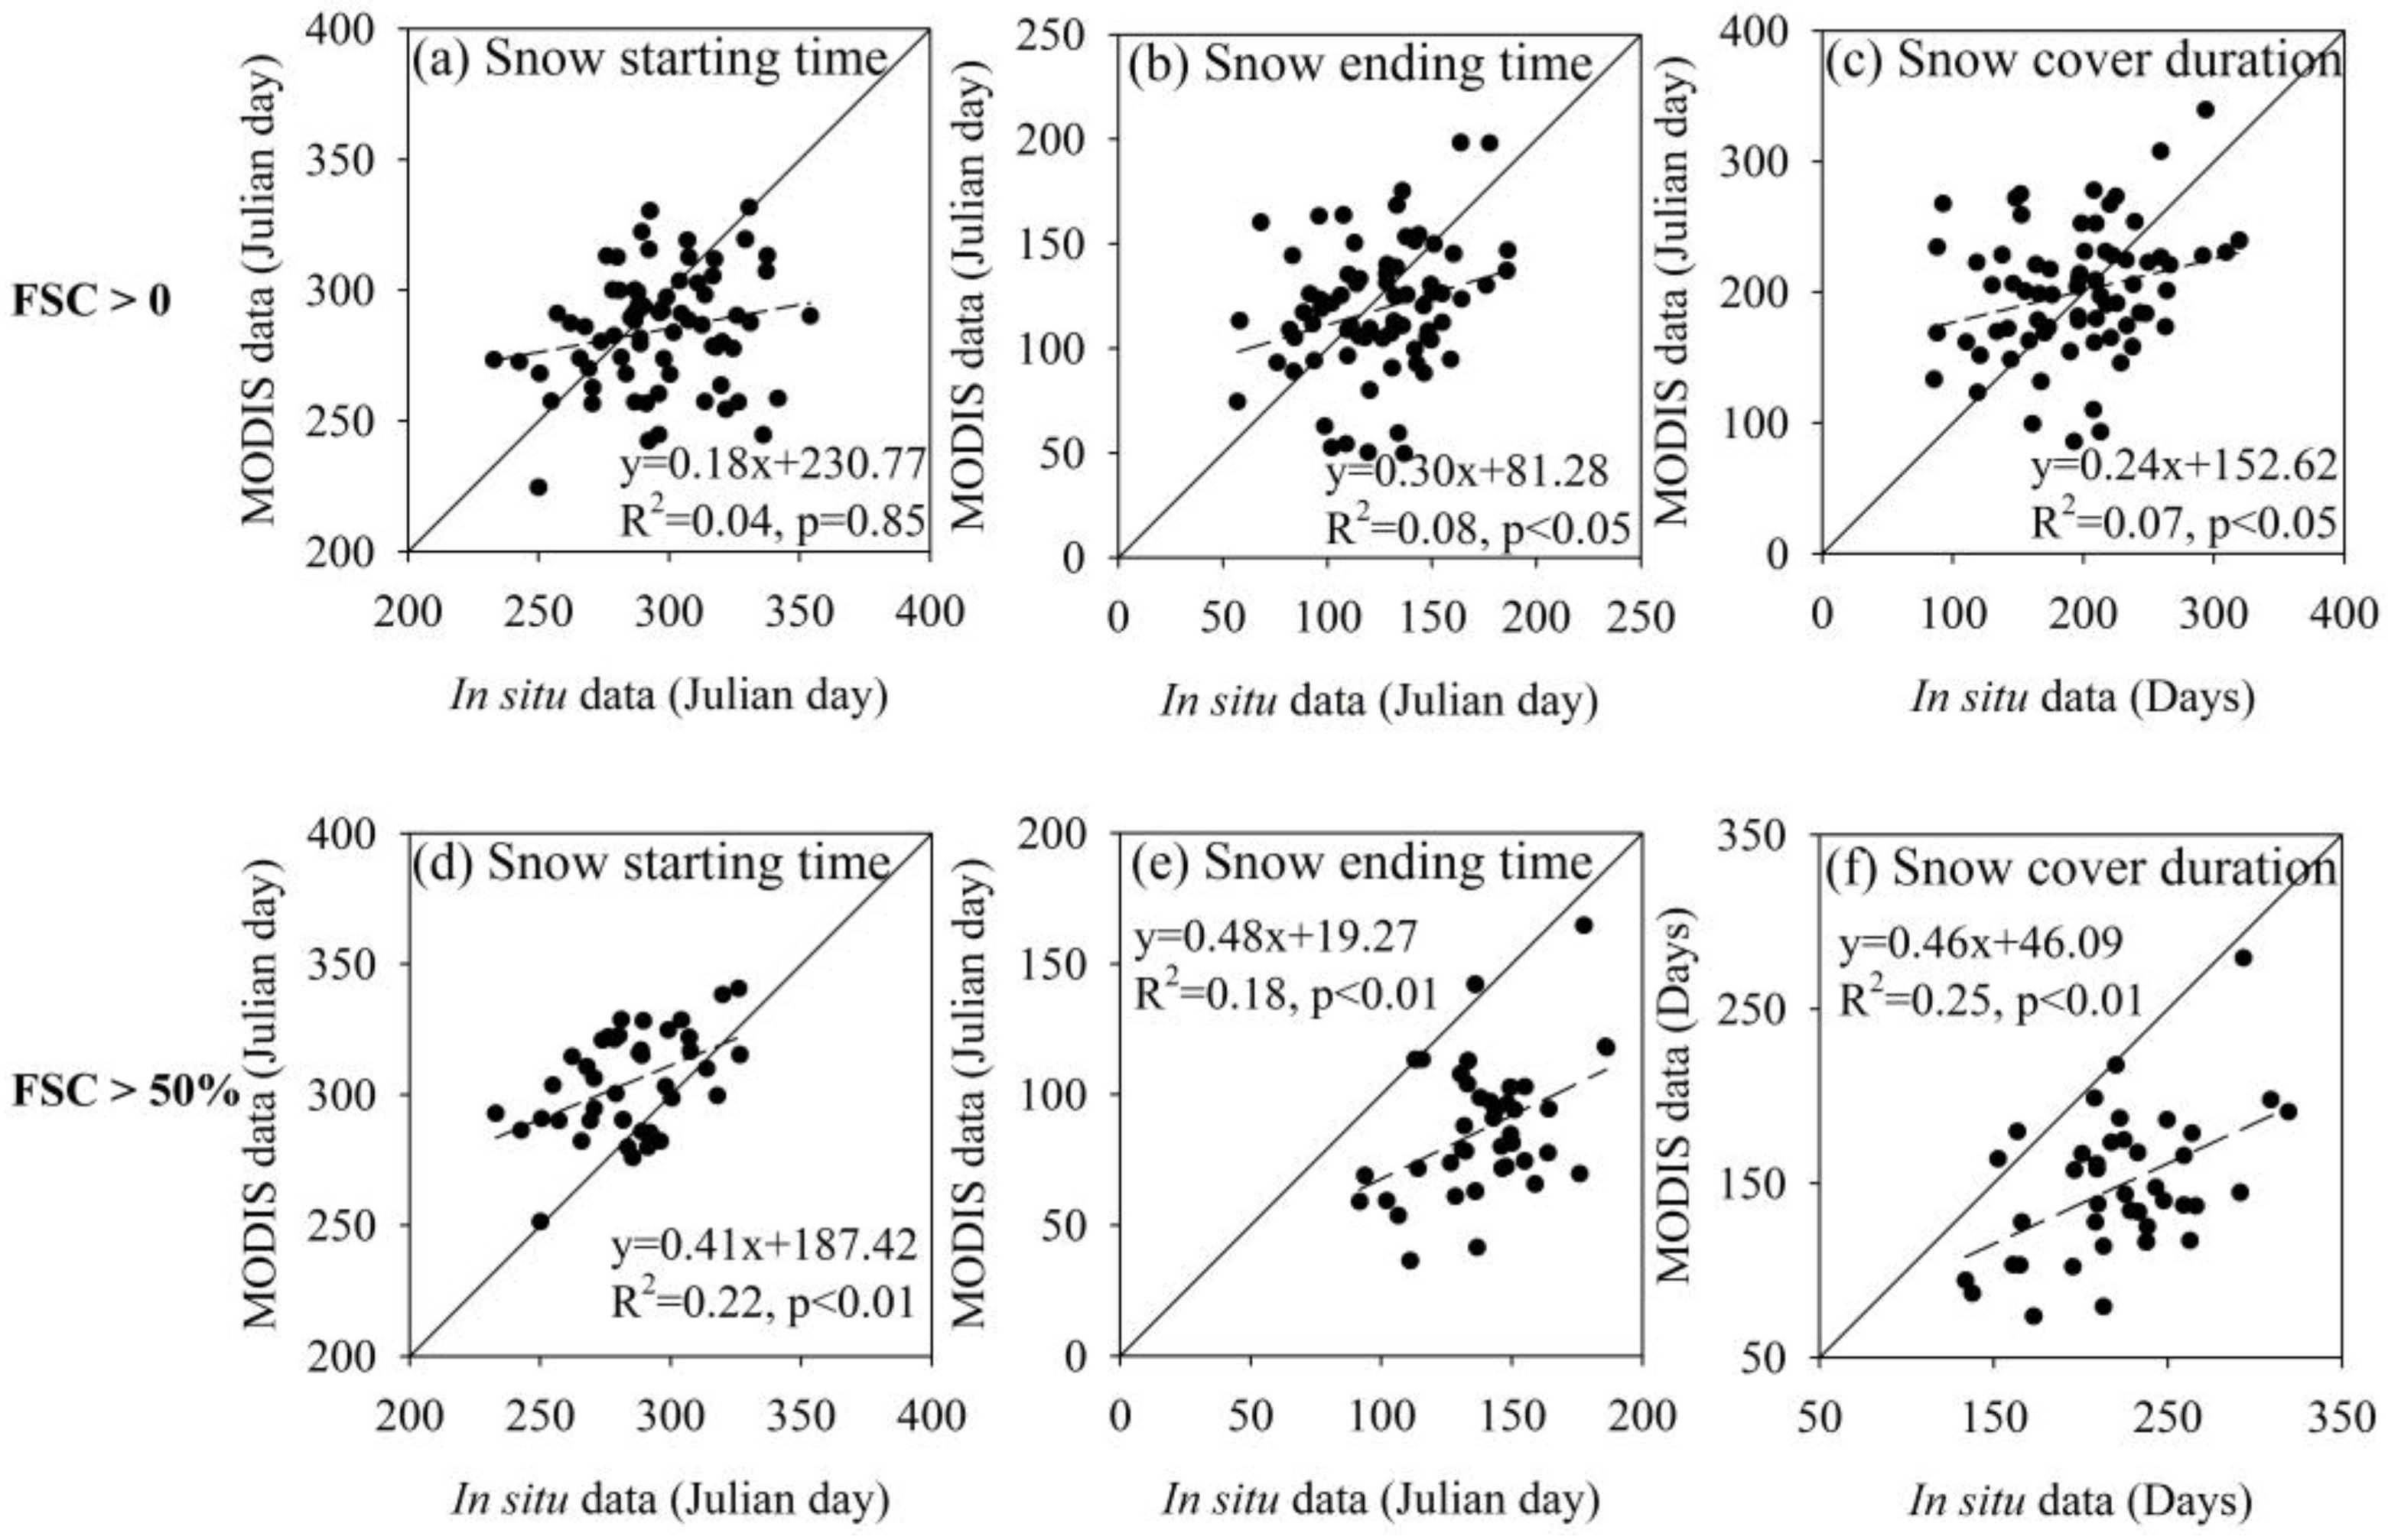
Figure 9.
Spatial patterns of difference (Sground-SMODIS) in snow starting time (a,b), snow ending time (c,d), and snow cover duration (e,f) on the threshold of FSC >0 and FSC >50%. Sground and SMODIS are the annual value of snow-cover phenological variables (i.e., snow starting time, snow ending time, and snow cover duration) for in situ observation and the MODIS data at 71 sites (FSC >0) and 40 sites (FSC >50%) from 2000 to 2010, respectively. The inset graph at the bottom left shows the frequency distributions of the corresponding spatial patterns of difference.
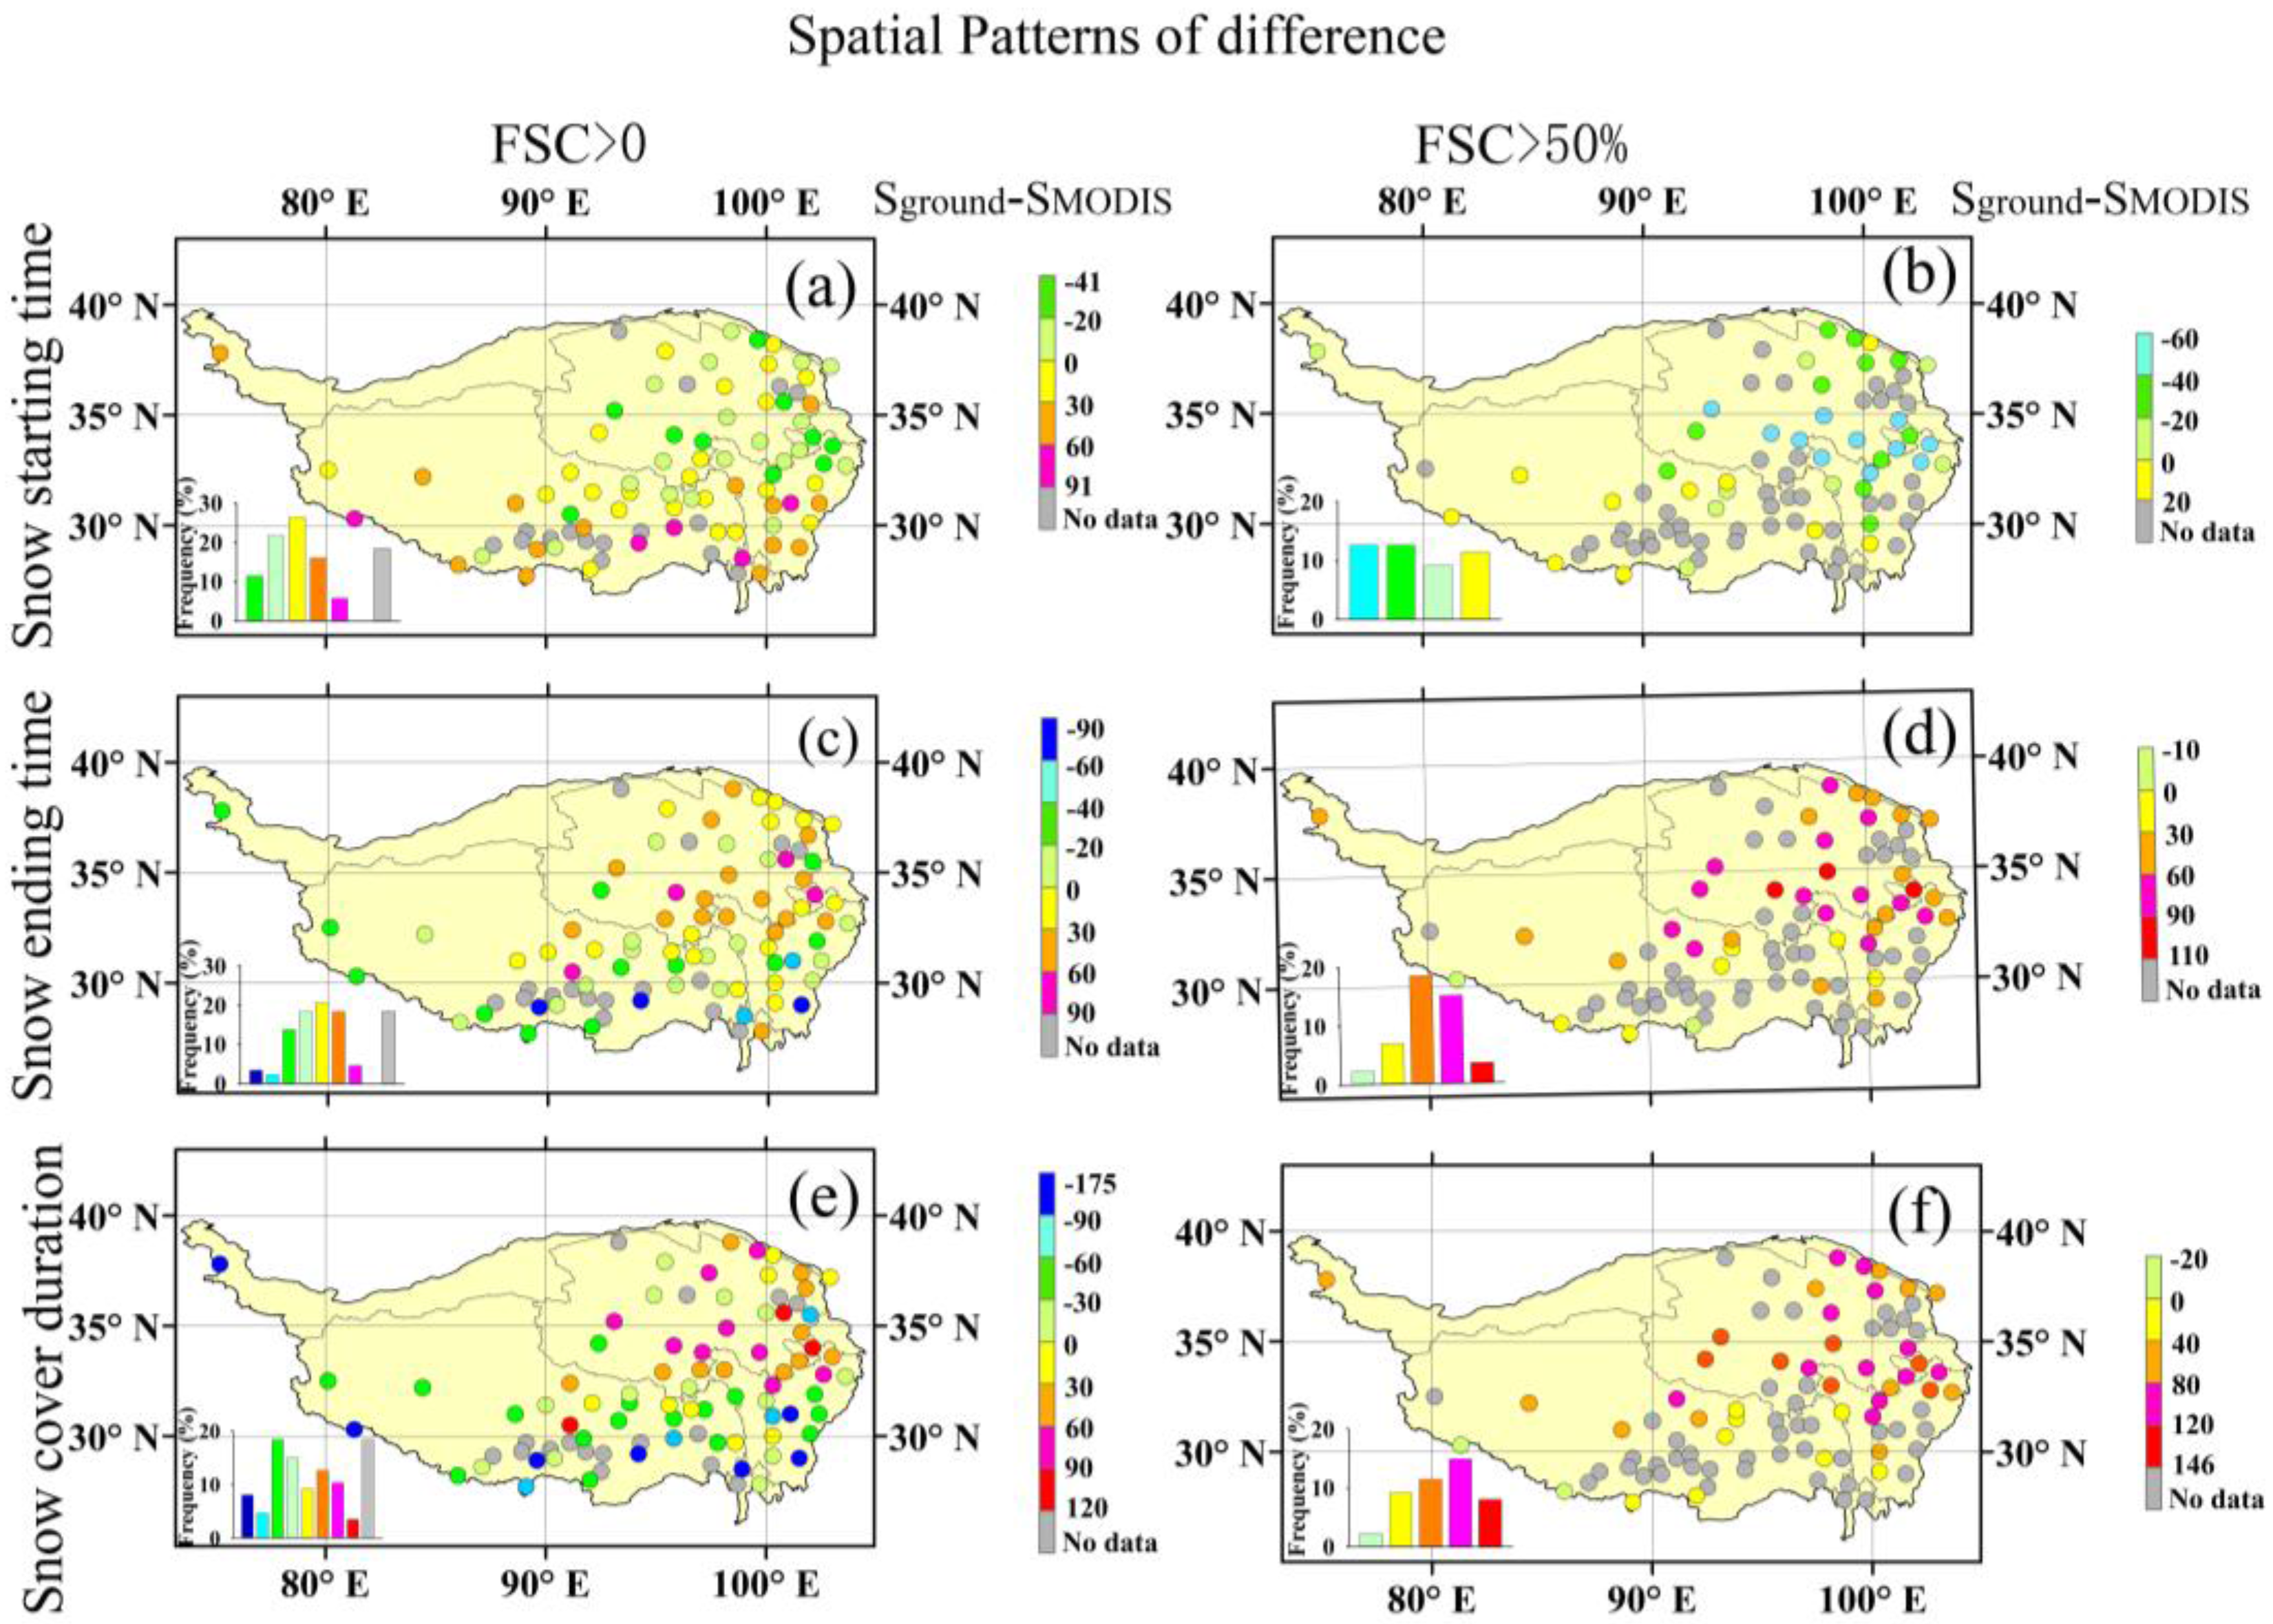
Figure 10.
Site percentage of correlation coefficients (r) between in situ and MODIS data-derived interannual variability of snow phenology (i.e., snow starting time, snow ending time, and snow cover duration) on the threshold of FSC >0 and FSC >50%. Mean and Std in the graph indicate the mean value and standard deviation of r.

Figure 11.
Sensitivity analysis to snow detection rate (a), snow starting time (b), snow ending time (c), and snow cover duration (d) related to the choice of the snow depth and FSC threshold values. Percentages (%) indicate the accuracy; days indicate the absolute difference between in situ derived and MODIS-derived snow-cover phenology (i.e., snow starting time, snow ending time, and snow cover duration).


Table 1.
Confusion matrix comparing daily cloud-free MODIS (Moderate Resolution Imaging Spectroradiometer) snow cover product against in situ observations.
Table 1.
Confusion matrix comparing daily cloud-free MODIS (Moderate Resolution Imaging Spectroradiometer) snow cover product against in situ observations.
| Ground Observation | Daily Cloud-Free MODIS Snow-Cover Product | |
|---|---|---|
| Snow | No Snow | |
| Snow (Snow >0 cm) | a | b |
| No snow (Snow = 0 cm) | c | d |
Table 2.
Long-term change trends of annual snow starting time, snow ending time, and snow-cover duration for in situ data and daily cloud-free MODIS data (FSC >0 and FSC >50%) from 2000 to 2010.
Table 2.
Long-term change trends of annual snow starting time, snow ending time, and snow-cover duration for in situ data and daily cloud-free MODIS data (FSC >0 and FSC >50%) from 2000 to 2010.
| Variable | Derived Data | Slope | Intercept | R2 | p |
|---|---|---|---|---|---|
| Snow starting time | In situ data | −0.17 | 640.34 | 0.01 | 0.78 |
| (Julian day) | MODIS data (FSC >0) | 1.31 | −2339.52 | 0.16 | 0.23 |
| MODIS data (FSC >50%) | −0.12 | 544.27 | 0.00 | 0.90 | |
| Snow ending time | In situ data | −0.87 | 1872.36 | 0.49 | <0.05 |
| (Julian day) | MODIS data (FSC >0) | 0.98 | −1840.37 | 0.16 | 0.22 |
| MODIS data (FSC >50%) | −0.46 | 1003.07 | 0.10 | 0.34 | |
| Snow cover duration | In situ data | −0.70 | 1598.01 | 0.07 | 0.42 |
| (Days) | MODIS data (FSC >0) | −0.33 | 865.16 | 0.01 | 0.79 |
| MODIS data (FSC >50%) | −0.34 | 824.80 | 0.01 | 0.75 |
© 2017 by the authors. Licensee MDPI, Basel, Switzerland. This article is an open access article distributed under the terms and conditions of the Creative Commons Attribution (CC BY) license (http://creativecommons.org/licenses/by/4.0/).
Share and Cite
MDPI and ACS Style
Xu, W.; Ma, H.; Wu, D.; Yuan, W. Assessment of the Daily Cloud-Free MODIS Snow-Cover Product for Monitoring the Snow-Cover Phenology over the Qinghai-Tibetan Plateau. Remote Sens. 2017, 9, 585. https://doi.org/10.3390/rs9060585
AMA Style
Xu W, Ma H, Wu D, Yuan W. Assessment of the Daily Cloud-Free MODIS Snow-Cover Product for Monitoring the Snow-Cover Phenology over the Qinghai-Tibetan Plateau. Remote Sensing. 2017; 9(6):585. https://doi.org/10.3390/rs9060585
Chicago/Turabian StyleXu, Wenfang, Hanqing Ma, Donghai Wu, and Wenping Yuan. 2017. "Assessment of the Daily Cloud-Free MODIS Snow-Cover Product for Monitoring the Snow-Cover Phenology over the Qinghai-Tibetan Plateau" Remote Sensing 9, no. 6: 585. https://doi.org/10.3390/rs9060585
Note that from the first issue of 2016, this journal uses article numbers instead of page numbers. See further details here.