
Retrieval of Aerosol Optical Depth Using the Empirical Orthogonal Functions (EOFs) Based on PARASOL Multi-Angle Intensity Data

 , , , and
Abstract
:
1. Introduction
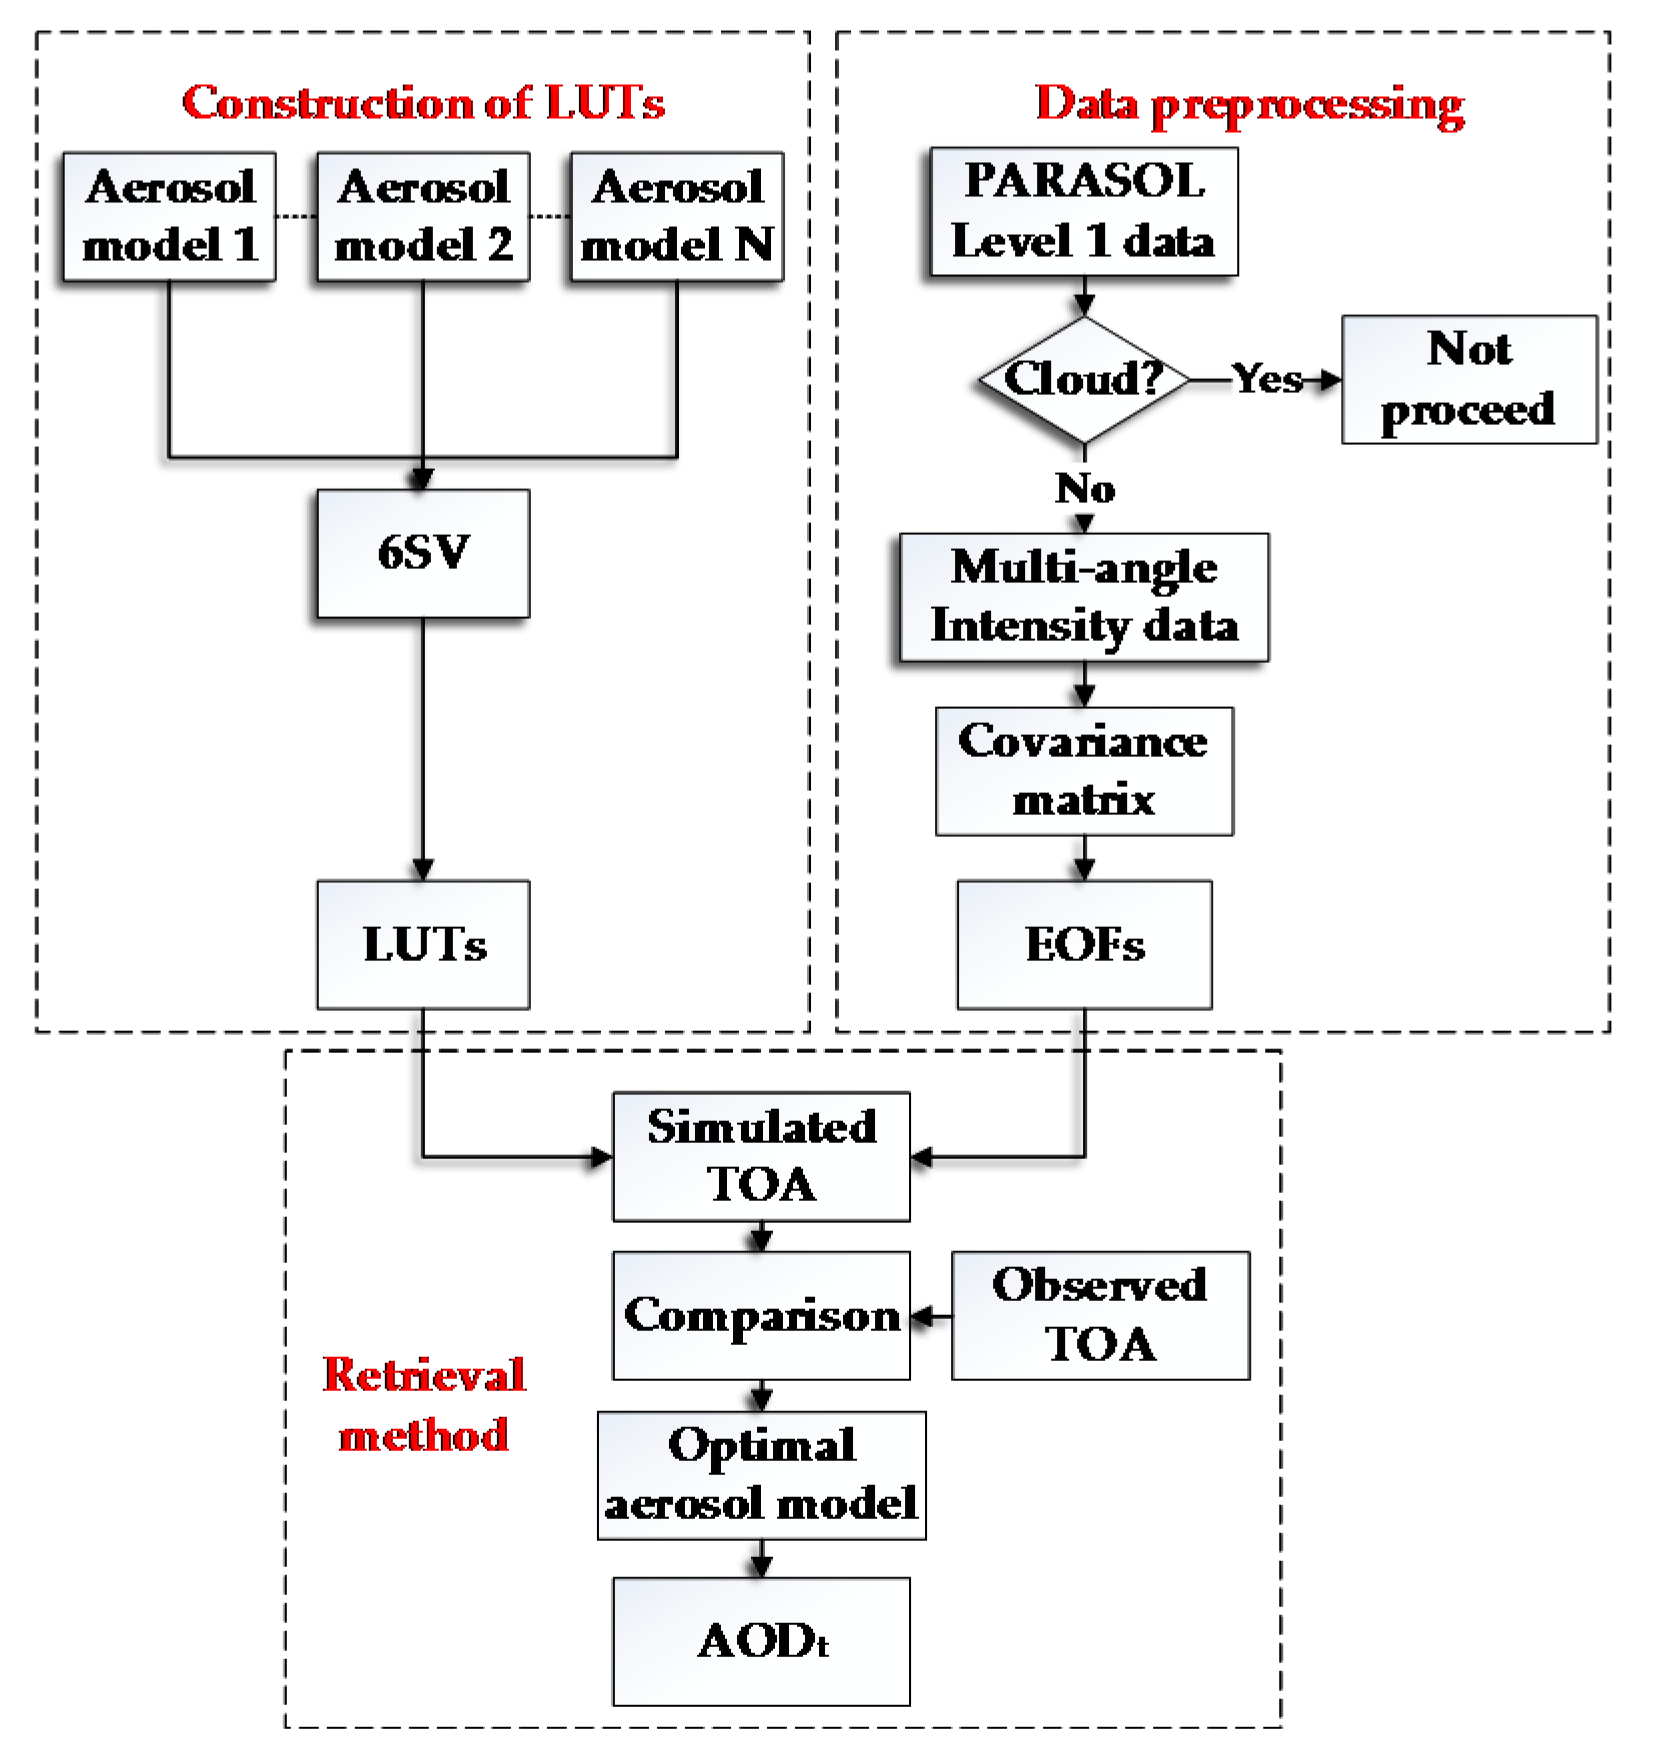
2. Methodology
2.1. A Brief Introduction to the Covariance Matrix
2.2. The Estimation of Surface Intensity Contribution
2.3. Retrieval of AOD
3. Results and Validation
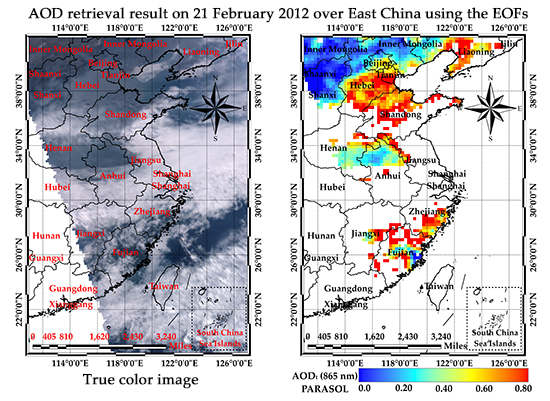
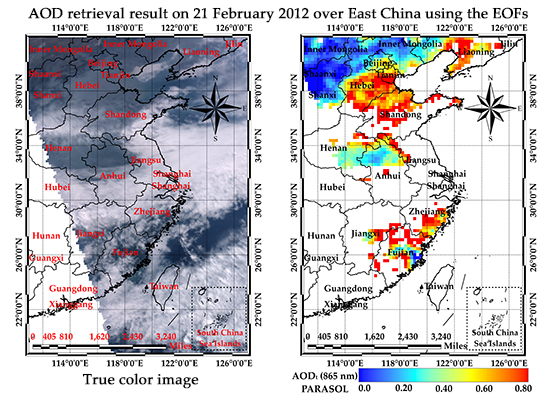
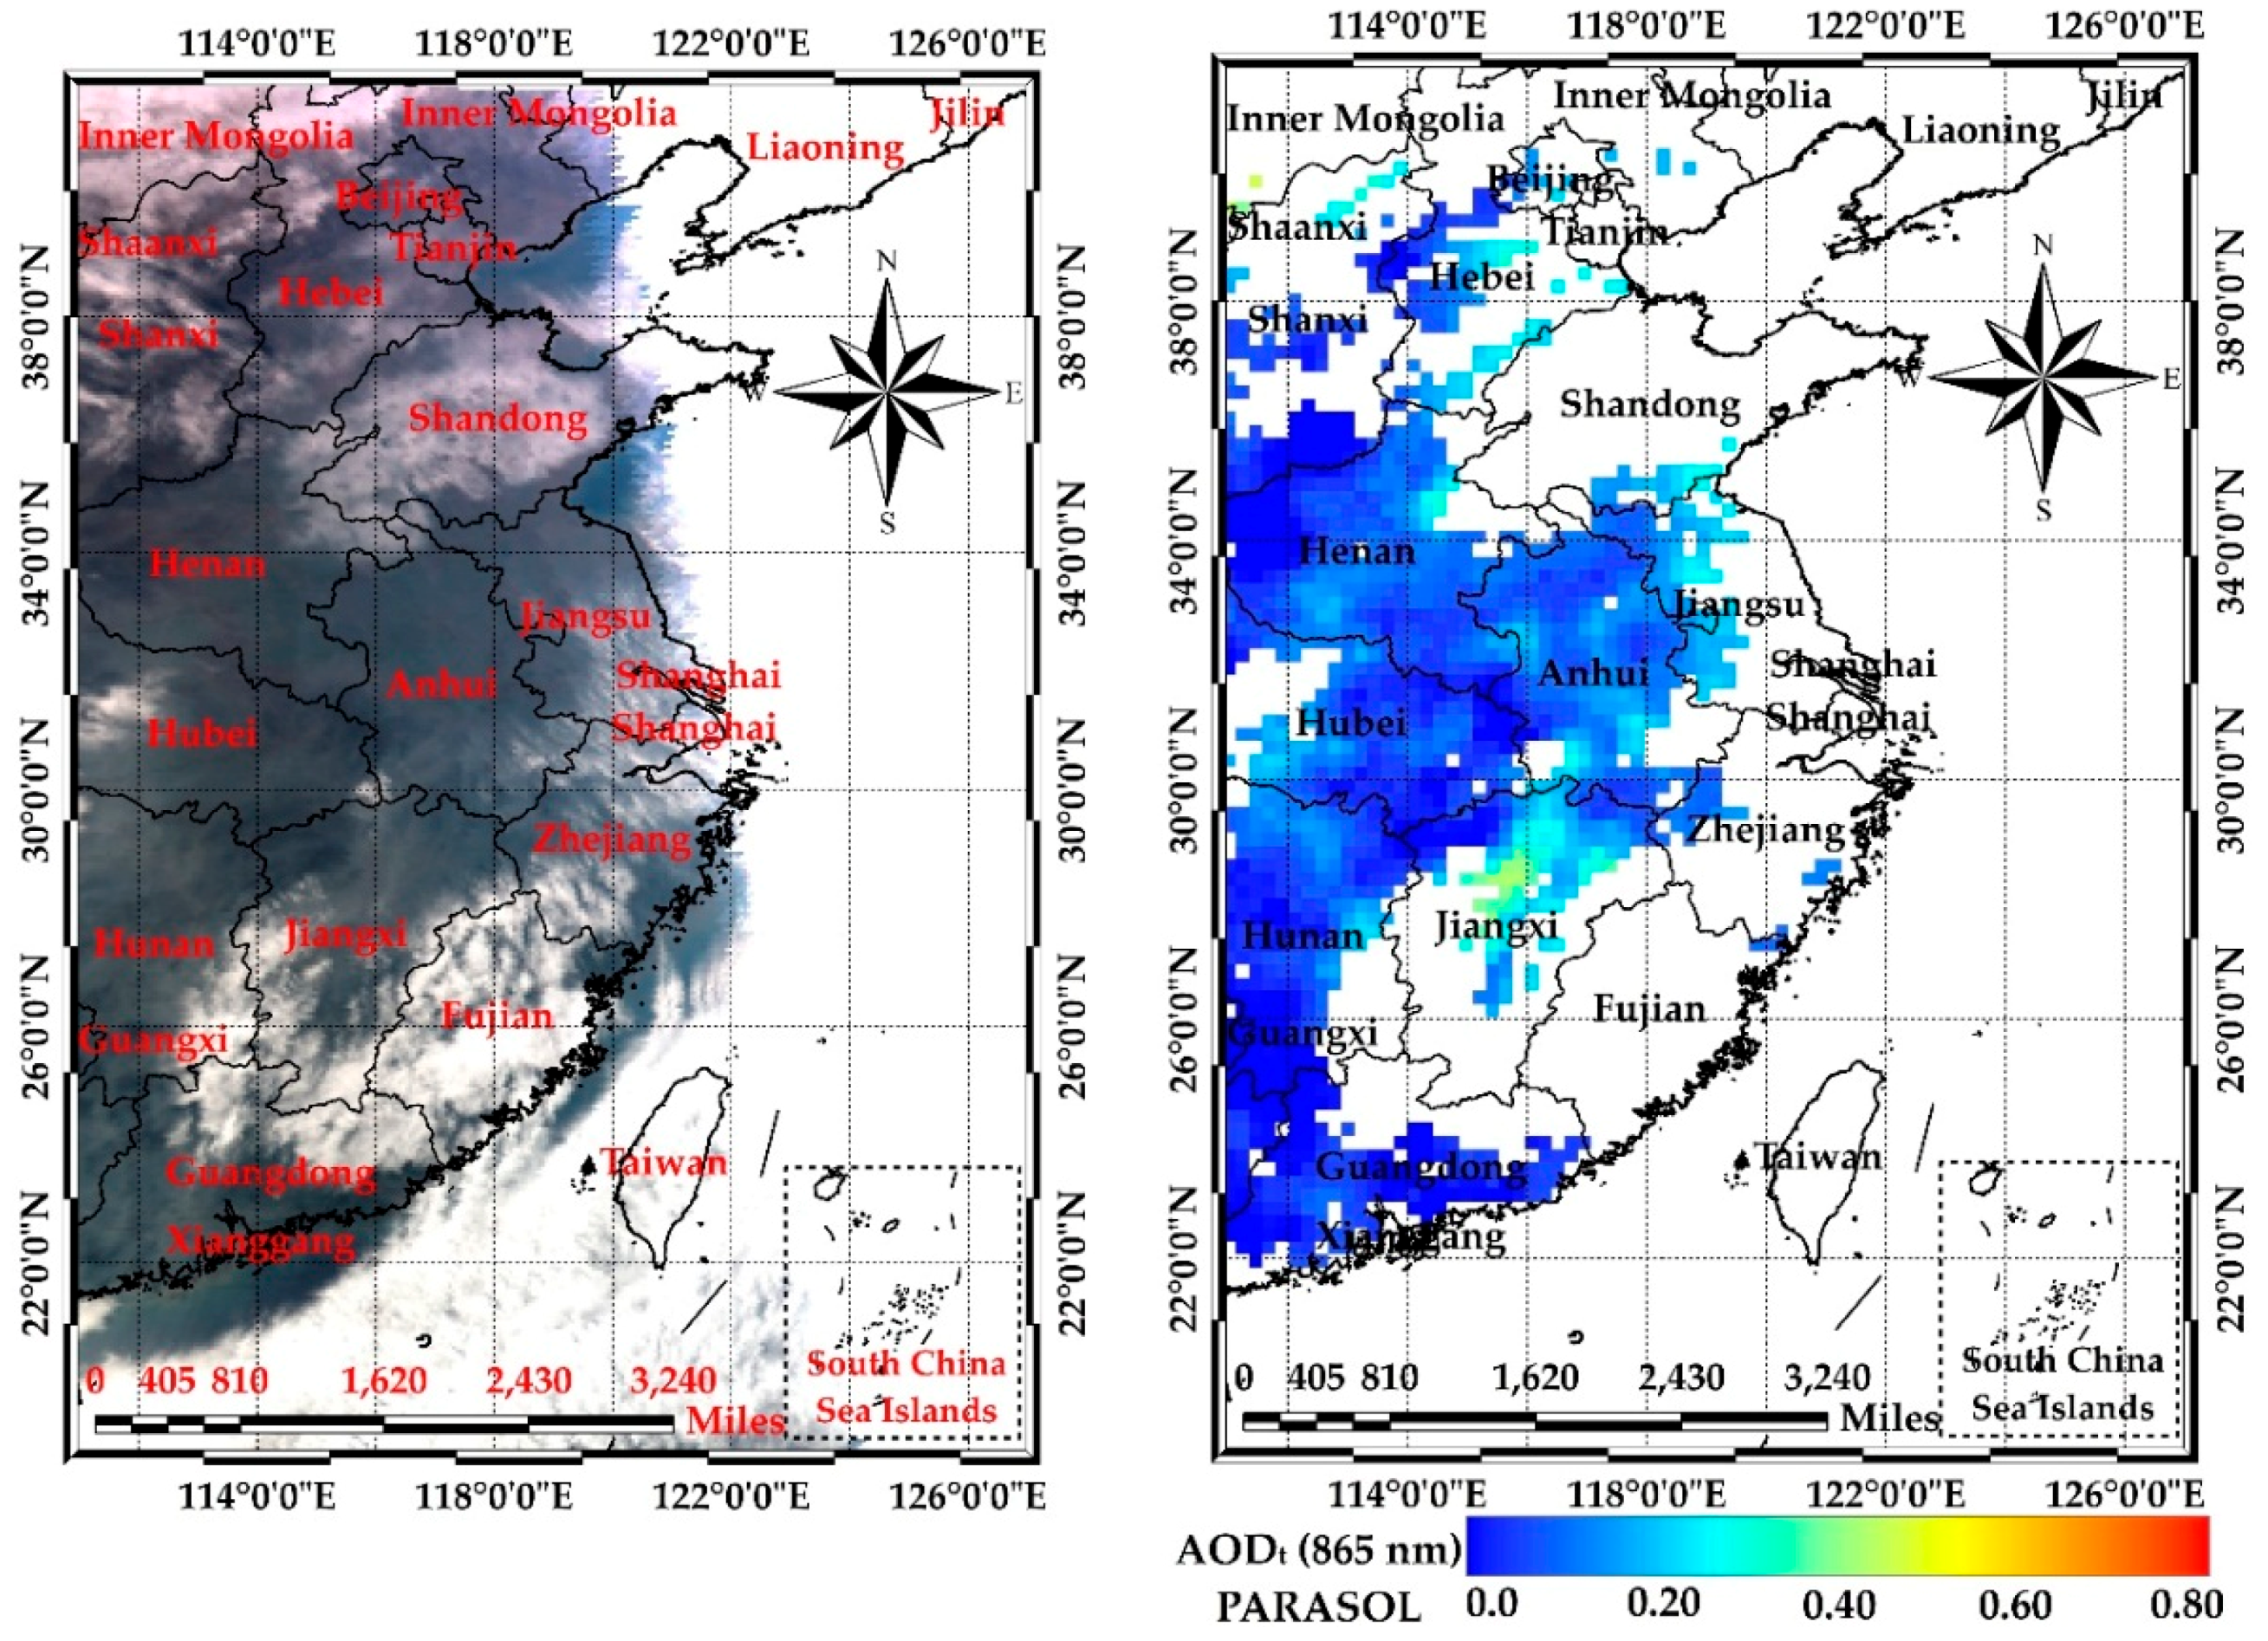
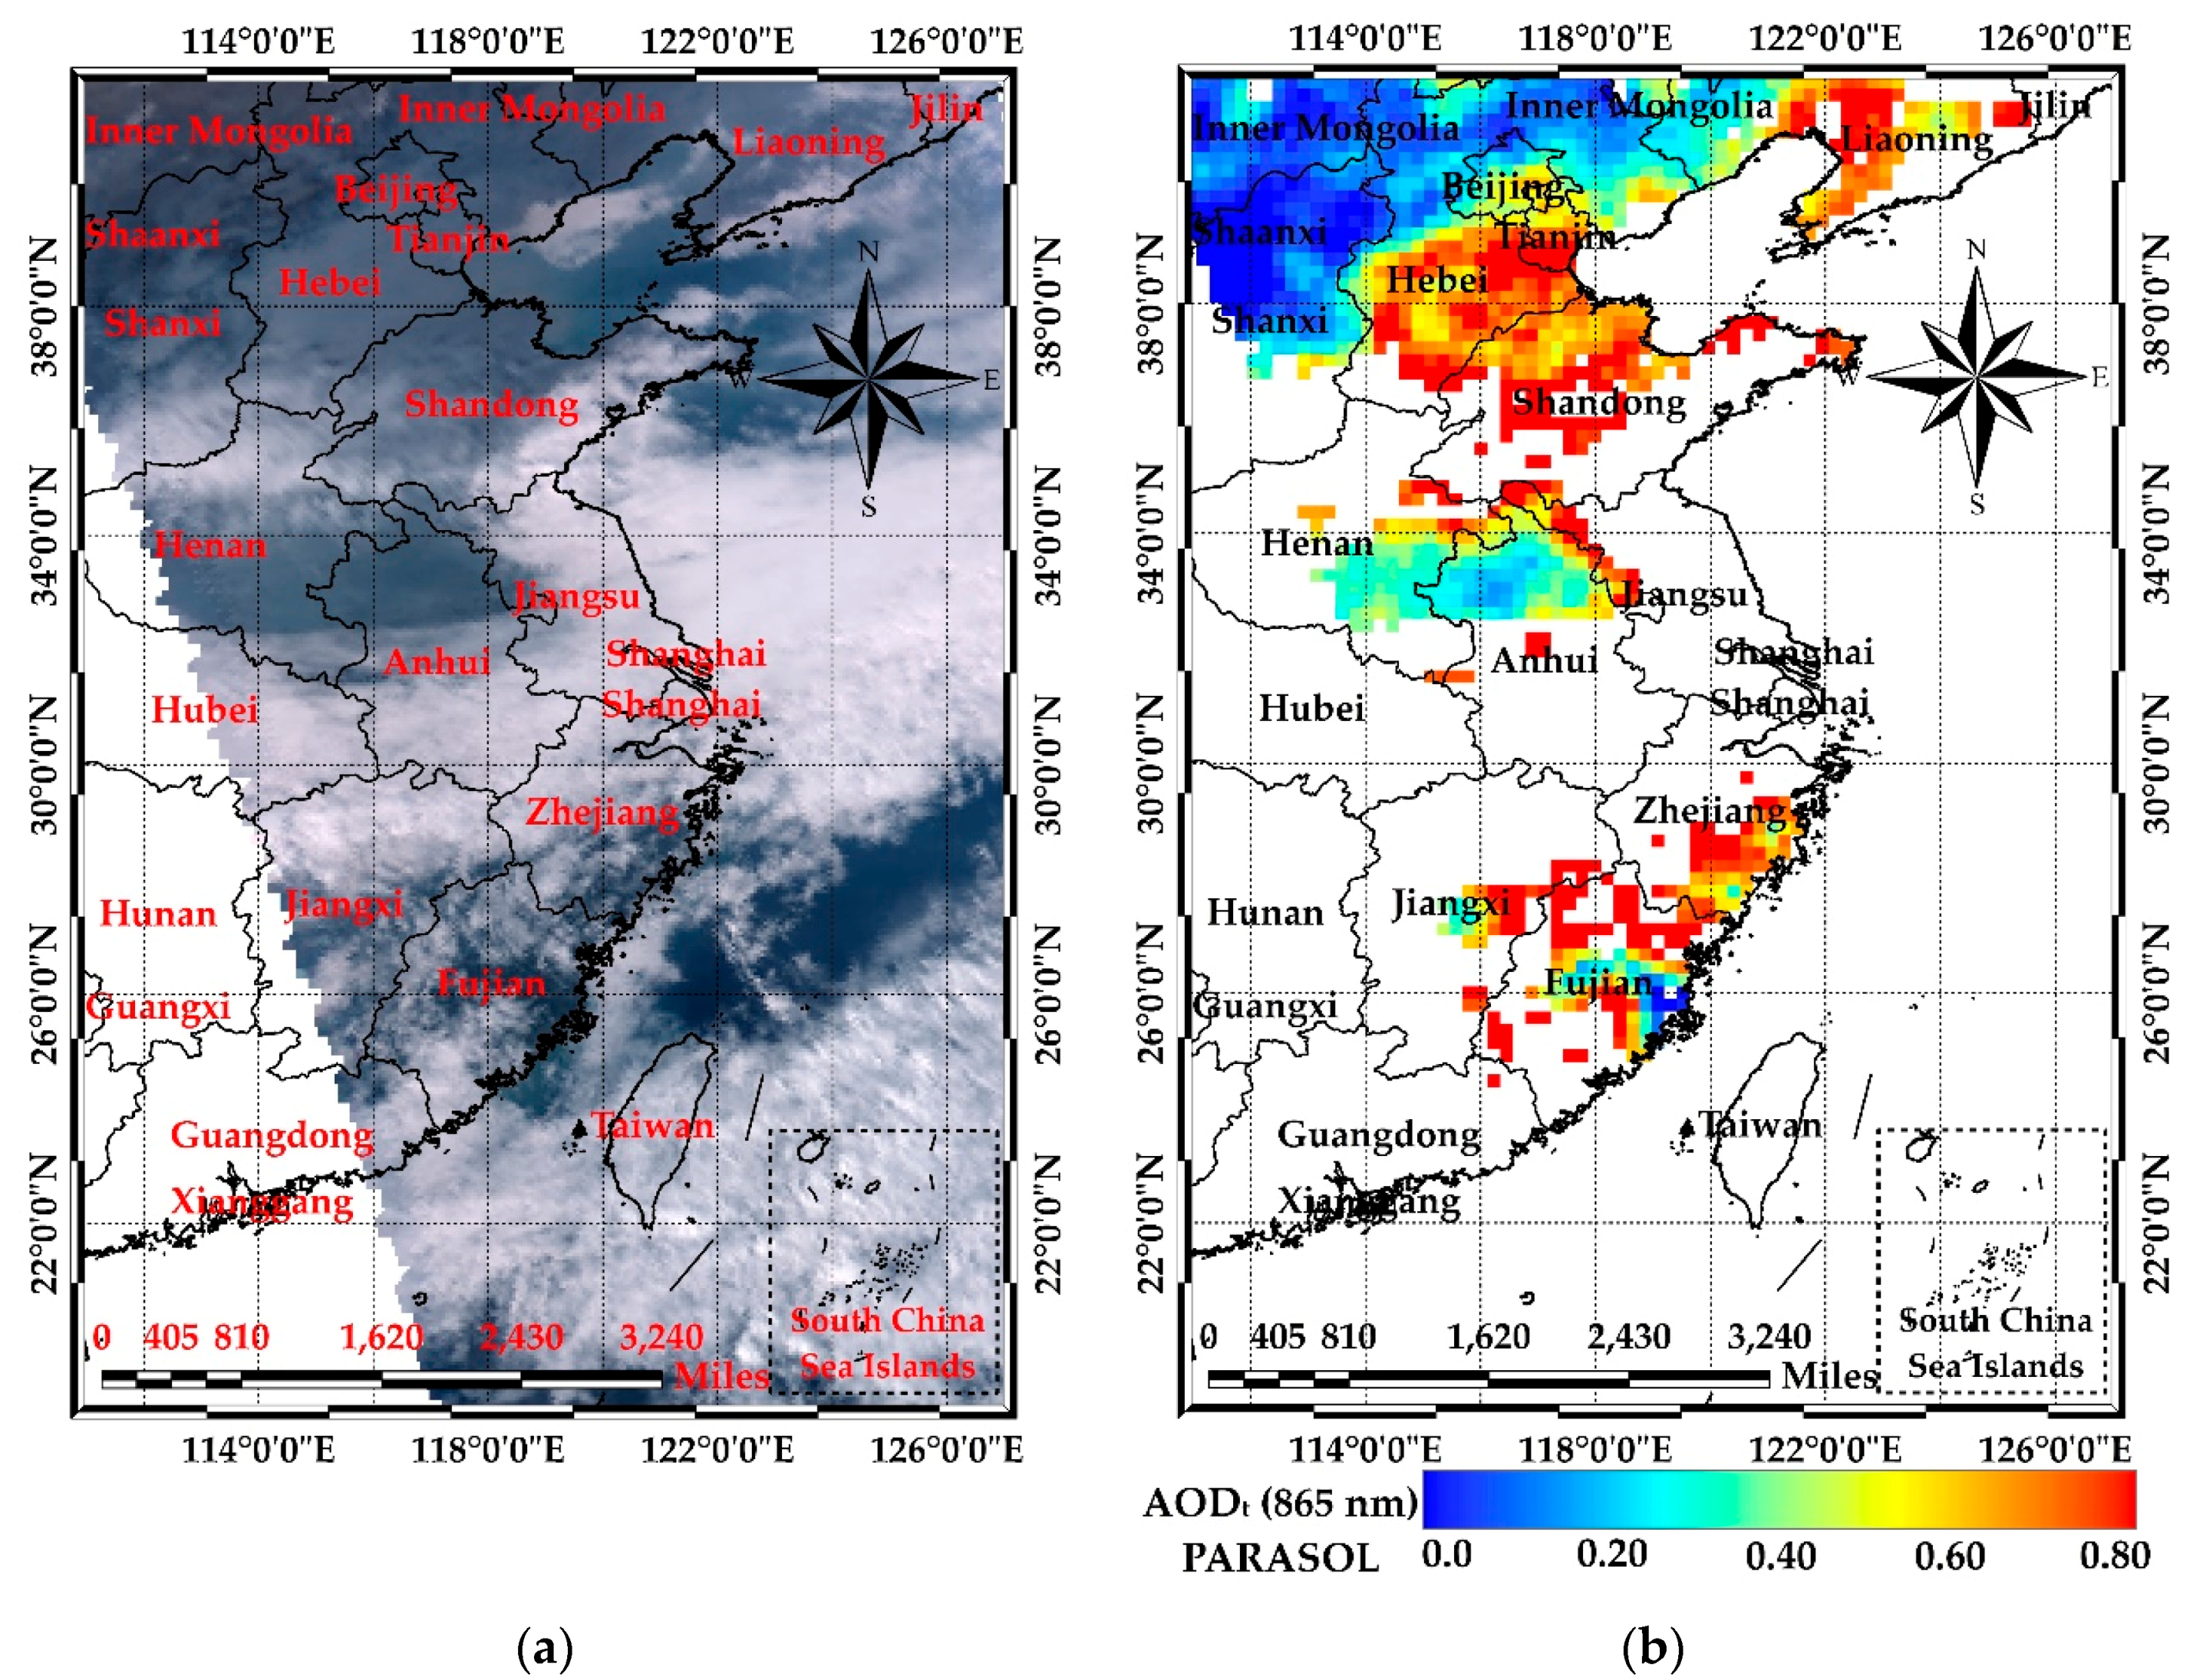
3.1. Case Study over East China
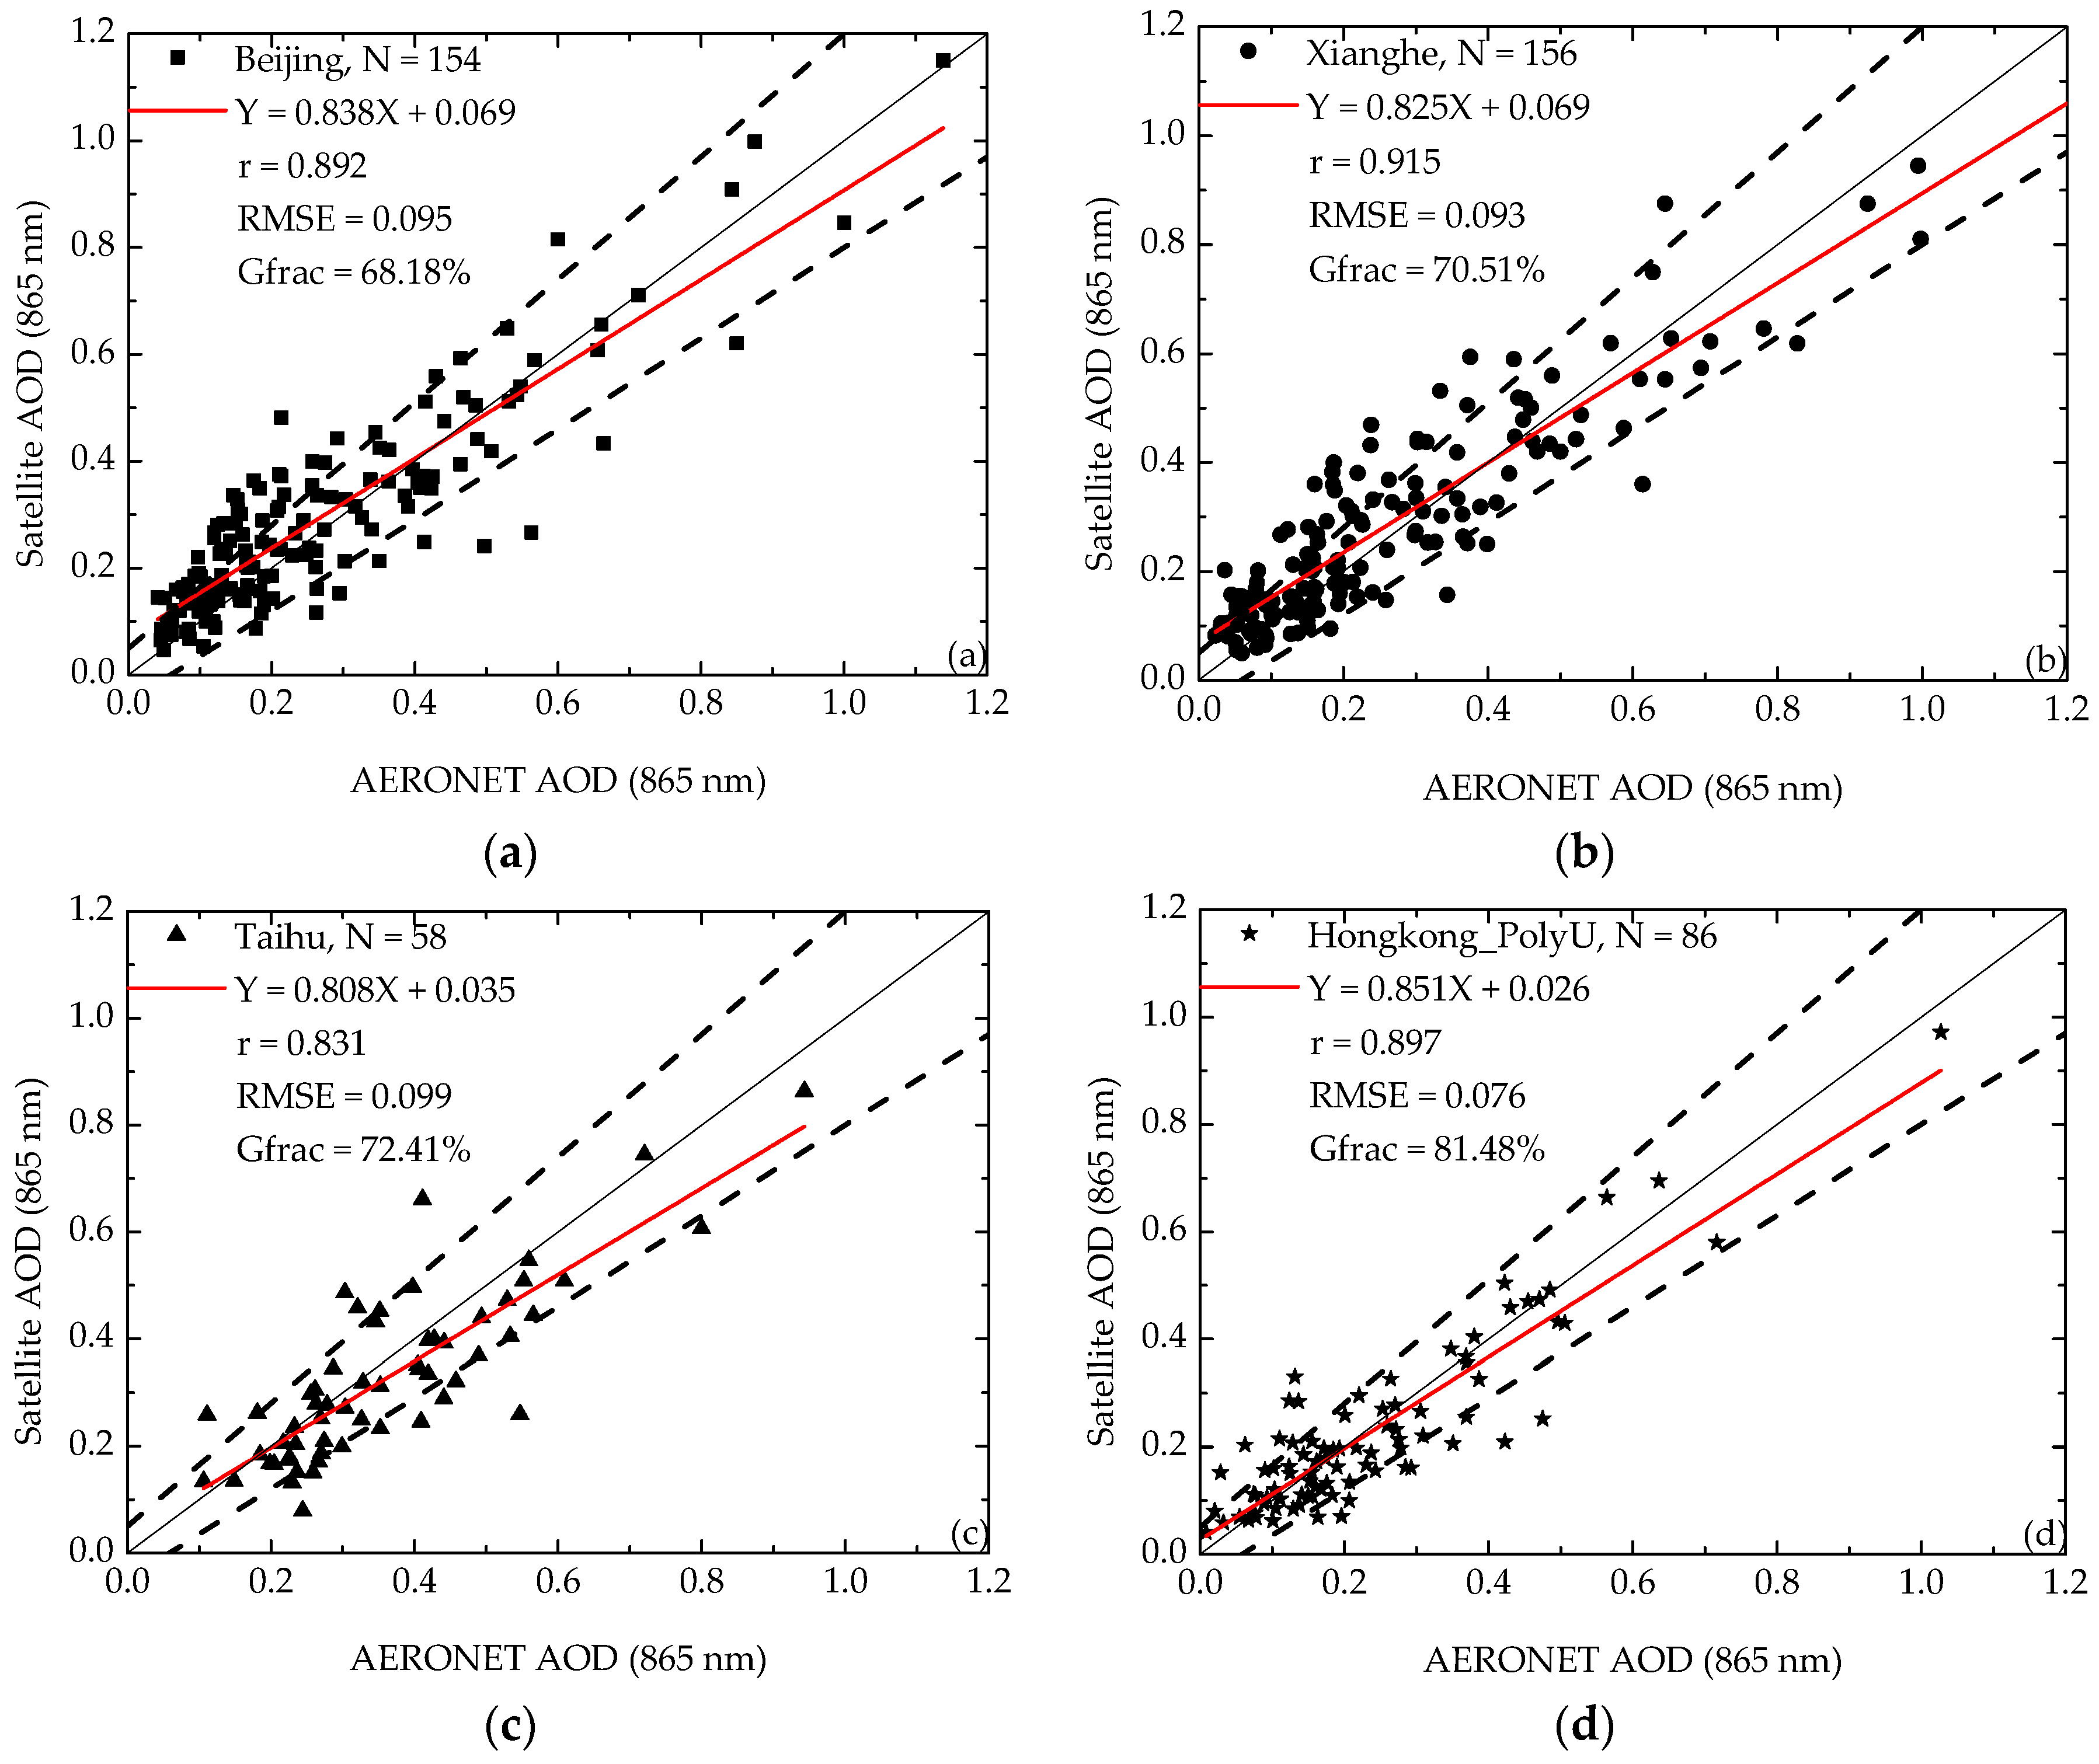
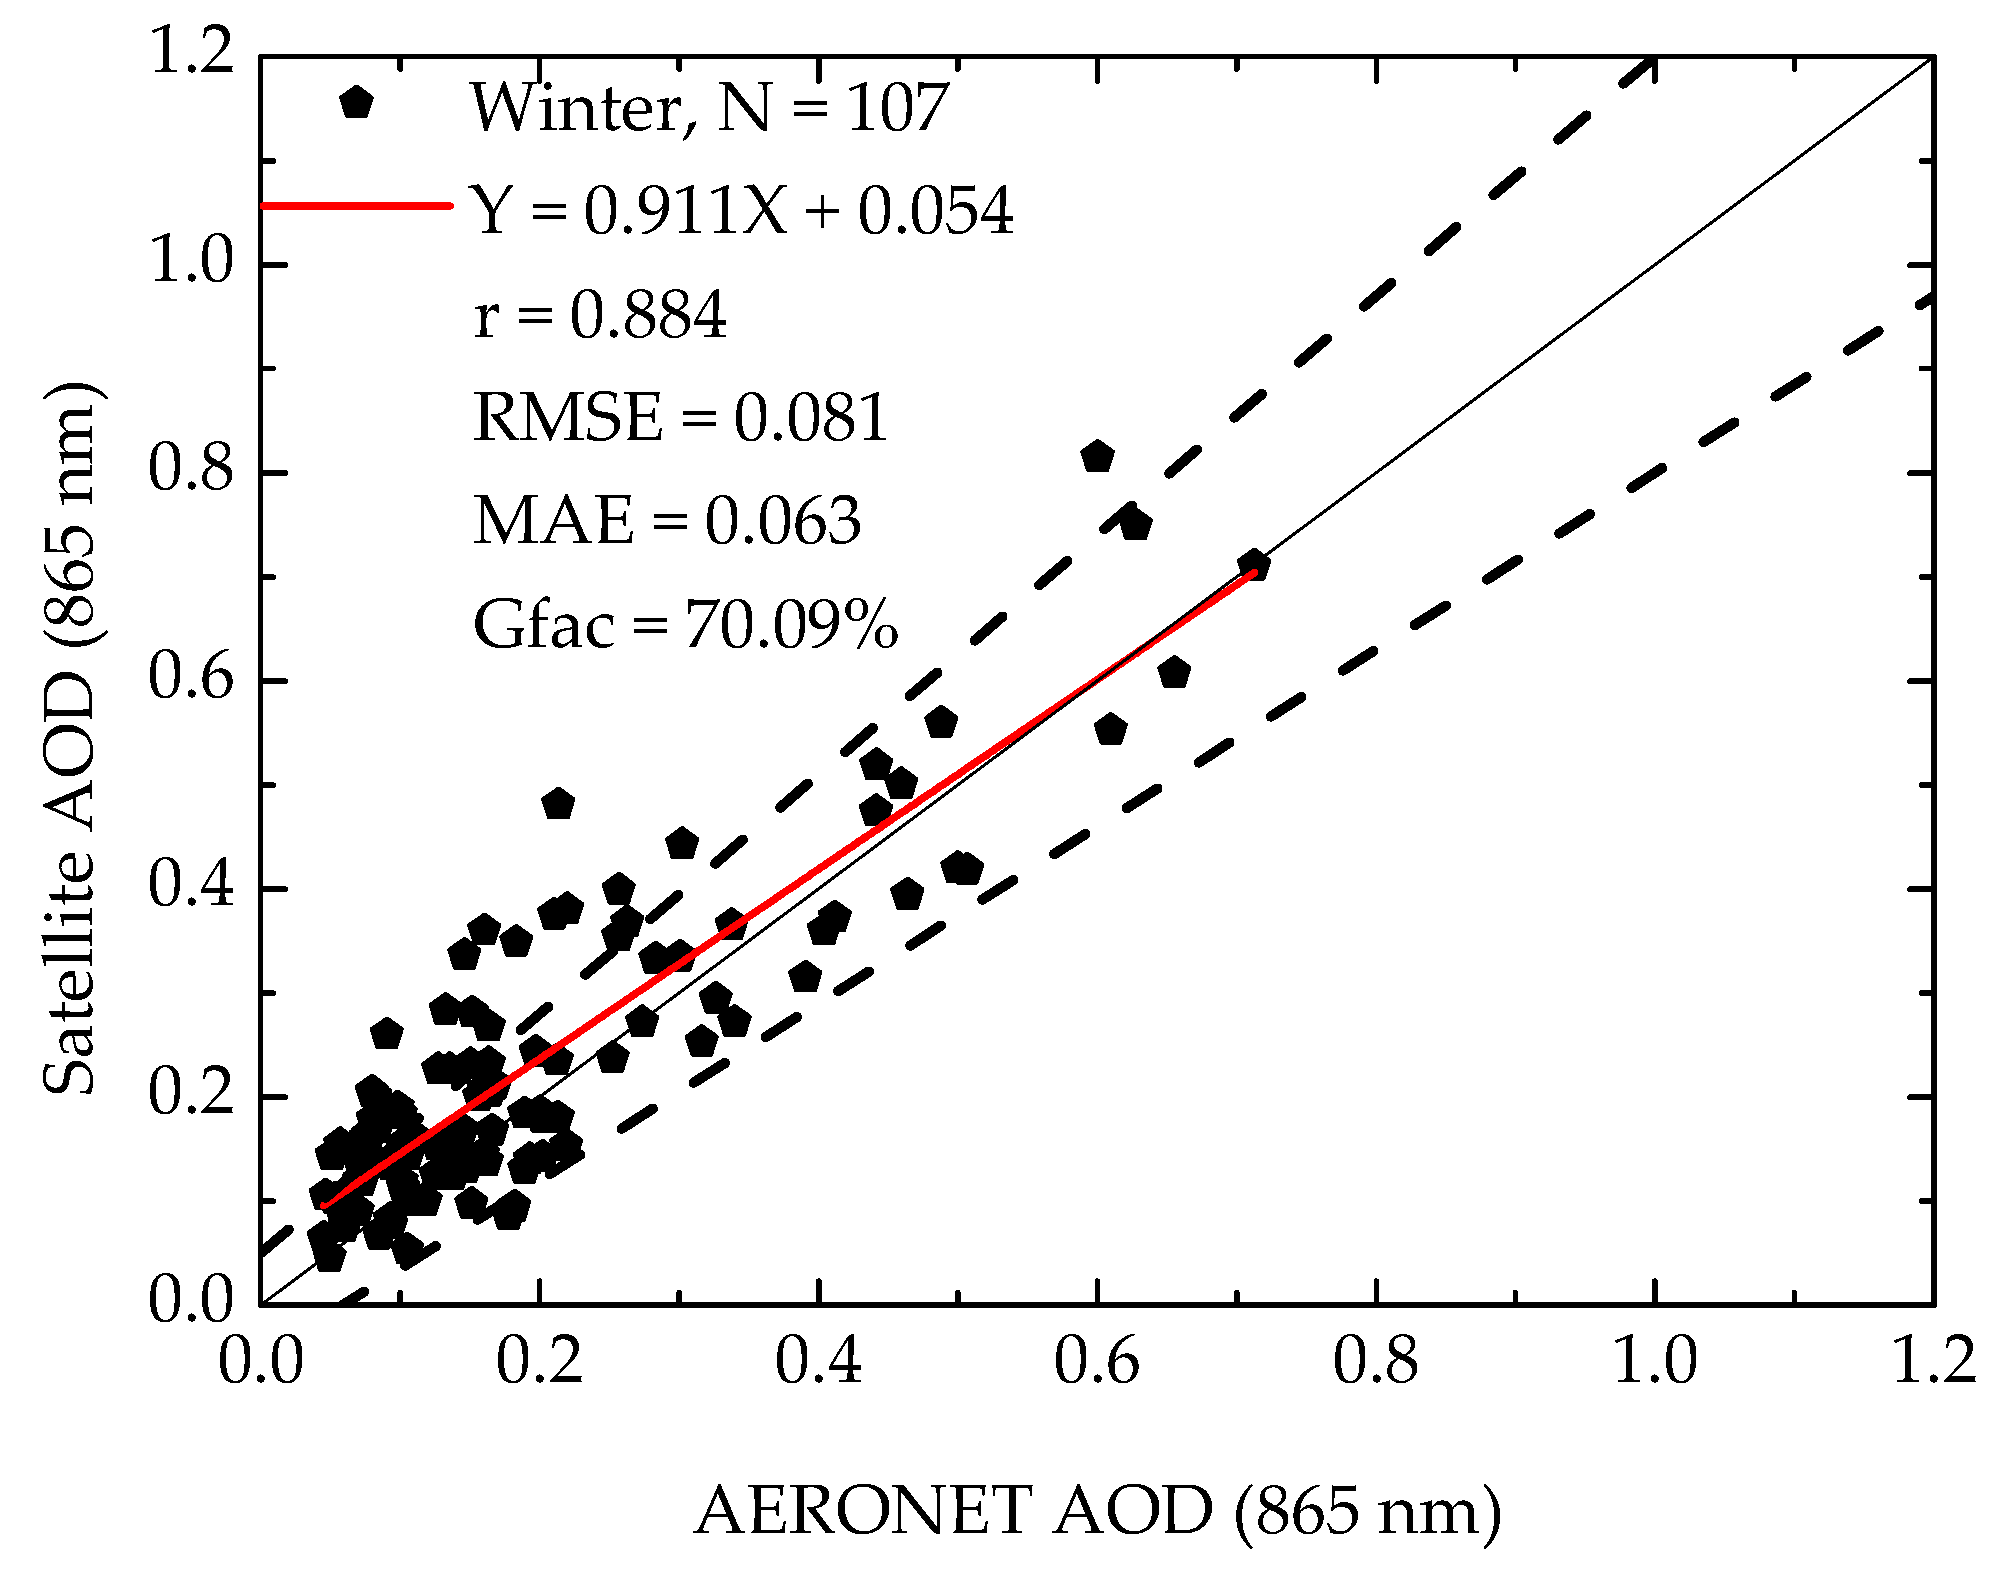
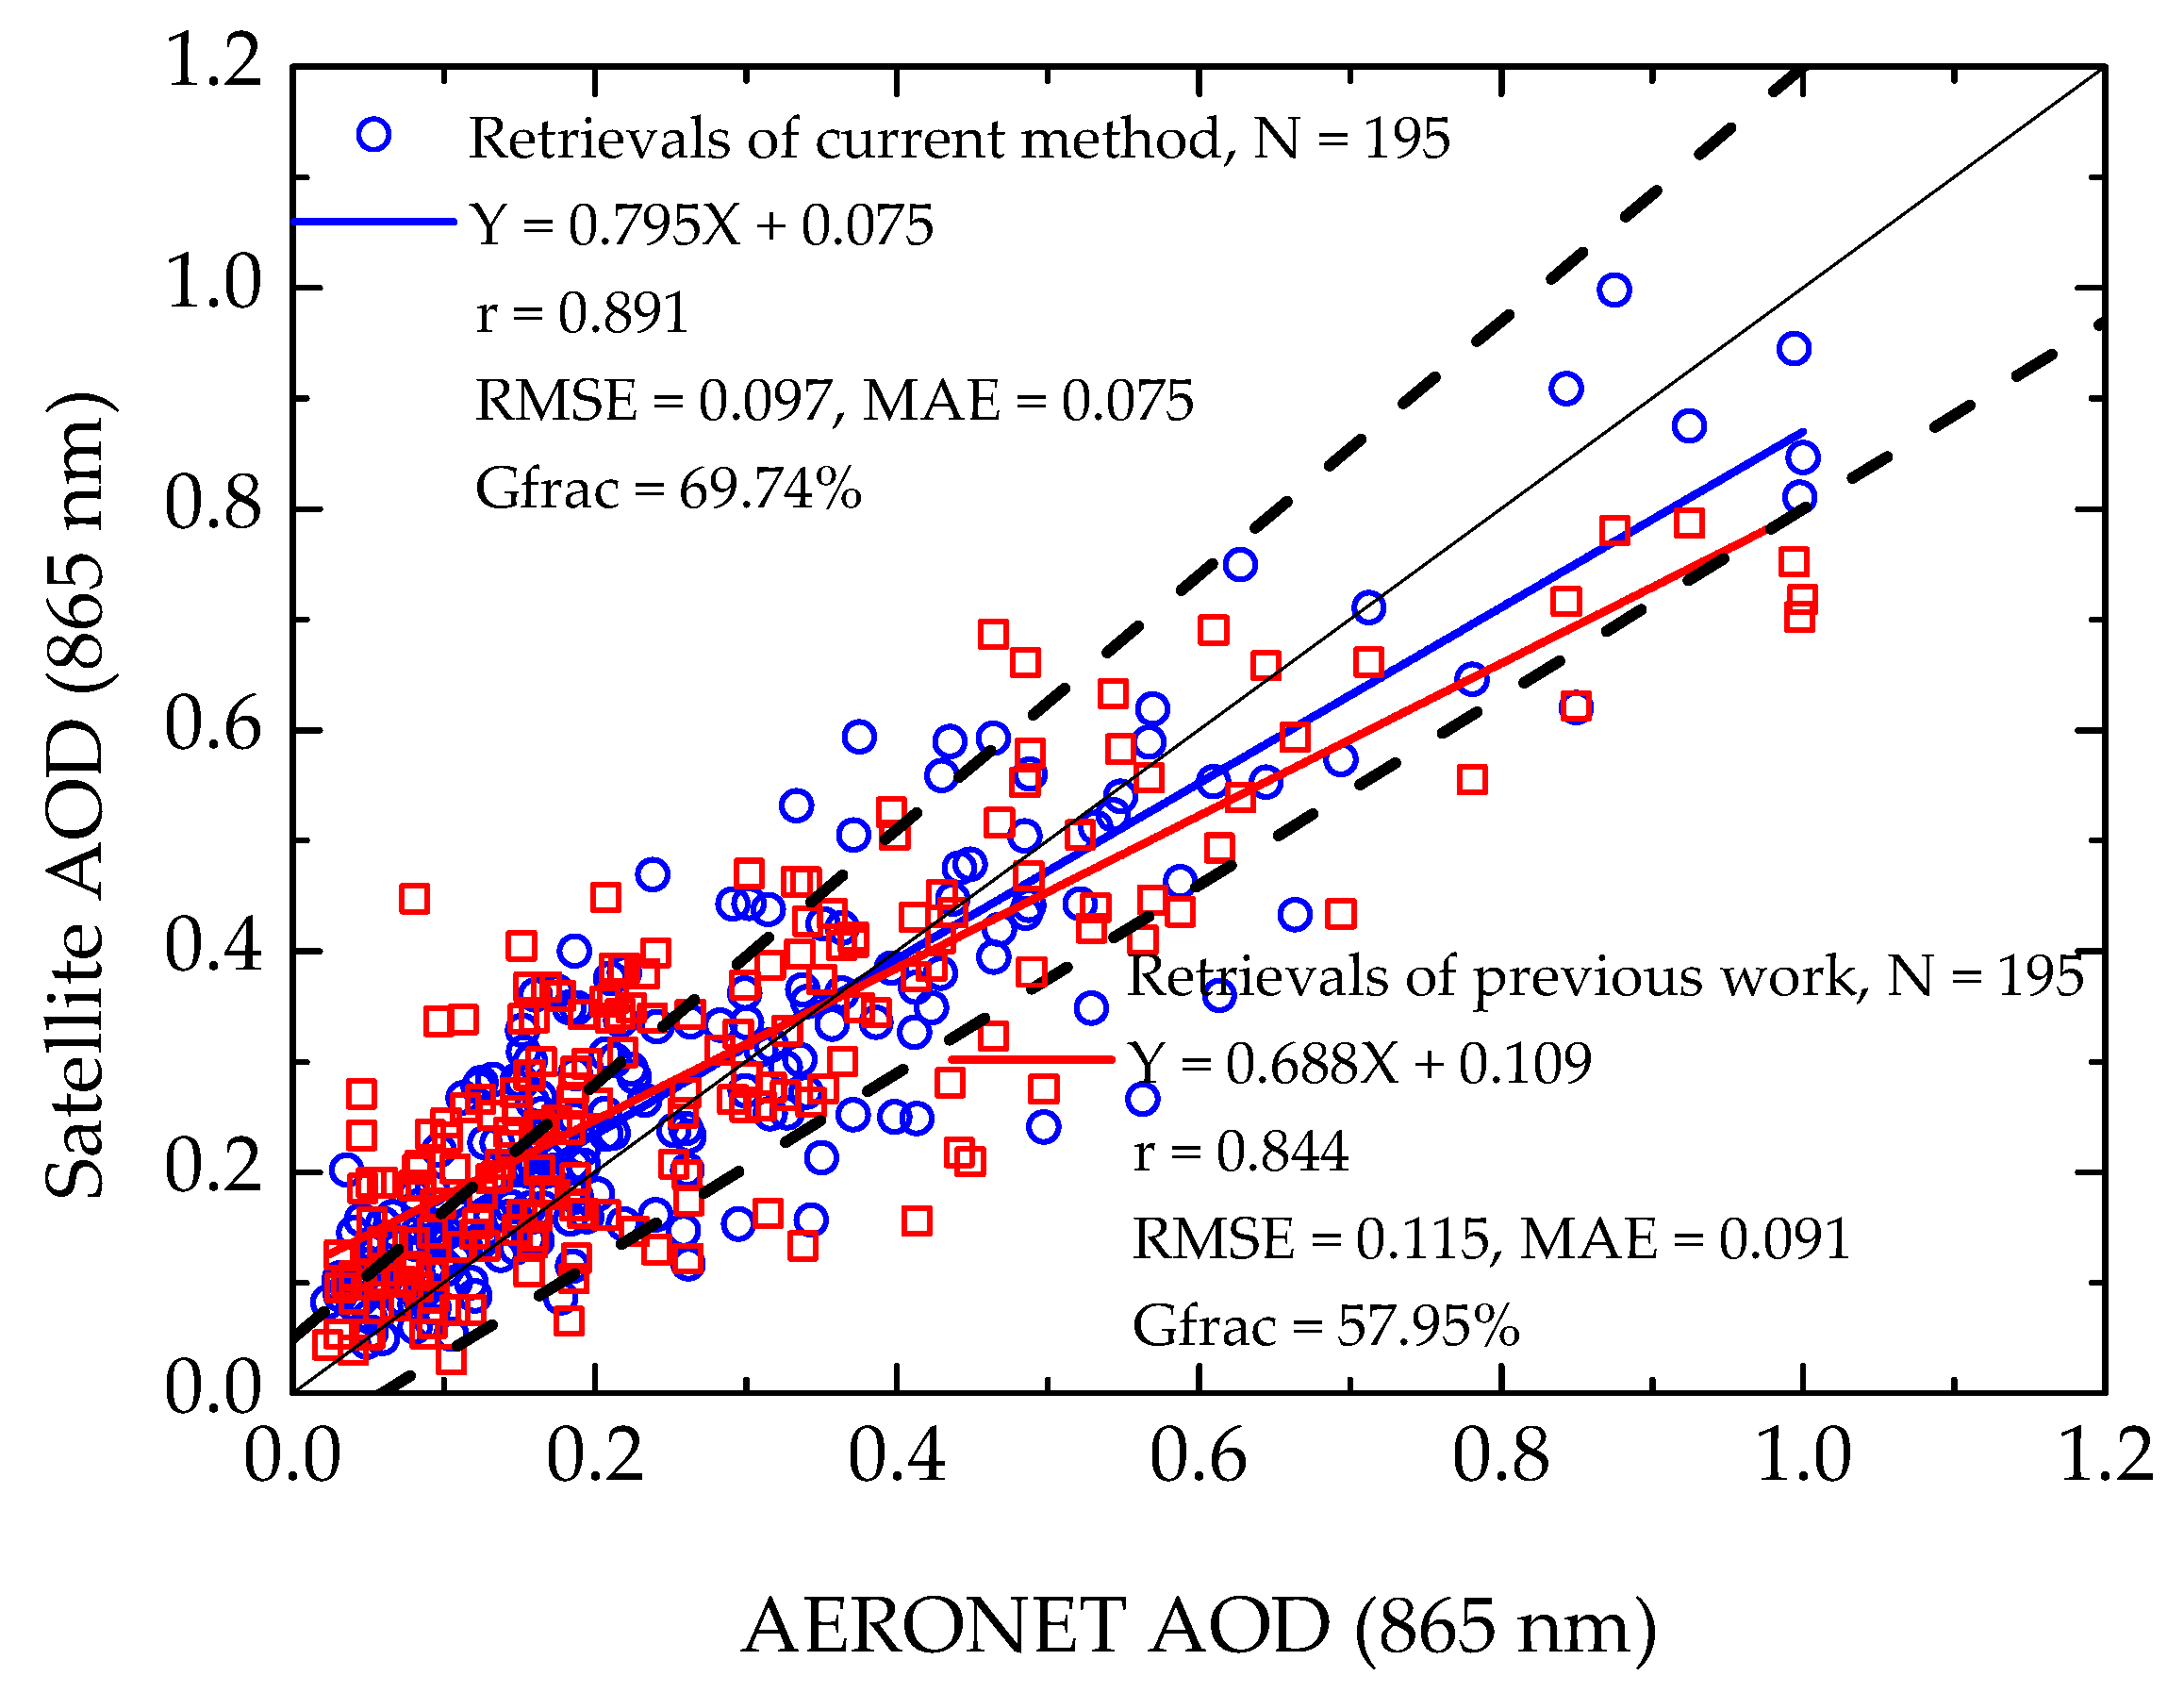
3.2. Validation Against AERONET
4. Discussion
4.1. EOFs for Surface Contribution Estimation
4.2. The Potential of EOFs in Polarized Measurements
4.3. The Potential of EOFs in Other Remote Sensing Dimensions
4.4. The Limitation of EOFs in Aerosol Retrieval
5. Conclusions
Acknowledgments
Author Contributions
Conflicts of Interest
Appendix A

| Class | Parameters | ||||||
|---|---|---|---|---|---|---|---|
| mr | mi | C | |||||
| 1 | 1.483 | 0.0078 | 0.1089 | 0.535 | 0.9801 | 0.568 | 0.05 |
| 2 | 1.5465 | 0.0130 | 0.1202 | 0.6135 | 0.9724 | 0.6022 | 0.13 |
| 3 | 1.485 | 0.0088 | 0.0939 | 0.531 | 0.9826 | 0.583 | 0.20 |
| 4 | 1.537 | 0.0023 | 0.0659 | 0.619 | 0.9618 | 0.531 | 0.43 |
| 5 | 1.5393 | 0.0129 | 0.0845 | 0.6157 | 0.8287 | 0.6126 | 0.53 |
| 6 | 1.528 | 0.0148 | 0.0839 | 0.5406 | 0.7476 | 0.6281 | 0.60 |
| 7 | 1.468 | 0.0102 | 0.0896 | 0.504 | 0.9269 | 0.618 | 0.76 |
| 8 | 1.482 | 0.009 | 0.0902 | 0.474 | 0.6229 | 0.656 | 0.82 |
| 9 | 1.4853 | 0.0095 | 0.095 | 0.5246 | 0.7958 | 0.6451 | 0.90 |
| 10 | 1.5465 | 0.013 | 0.1202 | 0.6135 | 0.9724 | 0.6022 | 0.99 |
References
- Nicolas, B.; Olivier, B.; Jim, H.; Shekar, R.M. Global estimate of aerosol direct radiative forcing from satellite measurements. Nature 2006, 438, 1138–1141. [Google Scholar]
- Liu, Y.; Franklin, M.; Kahn, R.; Koutrakis, P. Using aerosol optical thickness to predict ground-level PM2.5 concentrations in the St. Louis area: A comparison between misr and modis. Remote Sens. Environ. 2007, 107, 33–44. [Google Scholar] [CrossRef]
- Schwartz, C.S.; Liu, Z.; Lin, H.C.; Mckeen, S.A. Simultaneous three-dimensional variational assimilation of surface fine particulate matter and modis aerosol optical depth. J. Geophys. Res. 2012, 117, 110–117. [Google Scholar] [CrossRef]
- Puttaswamy, S.J.; Hai, M.N.; Braverman, A.; Hu, X.; Liu, Y. Statistical data fusion of multi-sensor aod over the continental united states. Geocarto Int. 2013, 29, 48–64. [Google Scholar] [CrossRef]
- Schwartz, C.S.; Liu, Z.; Lin, H.C.; Cetola, J.D. Assimilating aerosol observations with a “hybrid” variational-ensemble data assimilation system. J. Geophys. Res. Atmos. 2014, 119, 4043–4069. [Google Scholar] [CrossRef]
- Zhang, Y.; Li, Z. Remote sensing of atmospheric fine particulate matter (PM2.5) mass concentration near the ground from satellite observation. Remote Sens. Environ. 2015, 160, 252–262. [Google Scholar] [CrossRef]
- Li, Z.; Zhang, Y.; Shao, J.; Li, B.; Hong, J.; Liu, D.; Li, D.; Wei, P.; Li, W.; Li, L.; et al. Remote sensing of atmospheric particulate mass of dry PM2.5 near the ground: Method validation using ground-based measurements. Remote Sens. Environ. 2016, 173, 59–68. [Google Scholar] [CrossRef]
- Zhang, Y.; Li, Z.; Qie, L.; Zhang, Y.; Liu, Z.; Chen, X.; Hou, W.; Li, K.; Li, D.; Xu, H. Retrieval of aerosol fine-mode fraction from intensity and polarization measurements by parasol over east asia. Remote Sens. 2016, 8, 417. [Google Scholar] [CrossRef]
- Von Hoyningen-Huene, W. Retrieval of aerosol optical thickness over land surfaces from top-of-atmosphere radiance. J. Geophys. Res. 2003, 108, D9. [Google Scholar] [CrossRef]
- Kaufman, Y.J.; Wald, A.E.; Remer, L.A.; Gao, B.C. The modis 2.1-μm channel-correlation with visible reflectance for use in remote sensing of aerosol. IEEE Trans. Geosci. Remote Sens. 1997, 35, 1286–1298. [Google Scholar] [CrossRef]
- Levy, R.C.; Remer, L.A.; Mattoo, S.; Vermote, E.F.; Kaufman, Y.J. The second-generation operational algorithm: Retrieval of aerosol properties over land from inversion of modis spectral reflectance. J. Geophys. Res. 2007, 112, D13211. [Google Scholar] [CrossRef]
- Martonchik, J.V. Determination of aerosol optical depth and land surface directional reflectances using multiangle imagery. J. Geophys. Res. Atmos. 1997, 102, 17015–17022. [Google Scholar] [CrossRef]
- Martonchik, J.V.; Diner, D.J.; Kahn, R.A.; Ackerman, T.P.; Verstraete, M.M.; Pinty, B.; Gordon, H.R. Techniques for the retrieval of aerosol properties over land and ocean using multi-angle imaging. IEEE Trans. Geosci. Remote Sens. 1998, 36, 1212–1227. [Google Scholar] [CrossRef]
- Diner, D.J.; Martonchik, J.V.; Kahn, R.A.; Pinty, B.; Gobron, N.; Nelson, D.L.; Holben, B.N. Using angular and spectral shape similarity constraints to improve misr aerosol and surface retrievals over land. Remote Sens. Environ. 2005, 94, 155–171. [Google Scholar] [CrossRef]
- Vermote, E.F.; Tanré, D.; Deuzé, J.L.; Herman, M.; Morcette, J.J. Second simulation of the satellite signal in the solar spectrum, 6s: An overview. IEEE Trans. Geosci. Remote Sens. 1997, 35, 675–686. [Google Scholar] [CrossRef]
- Kotchenova, S.Y.; Vermote, E.F.; Raffaella, M.; Klemm, F.J. Validation of a vector version of the 6s radiative transfer code for atmospheric correction of satellite data. Part I: Path radiance. Appl. Opt. 2006, 45, 6762–6774. [Google Scholar] [CrossRef] [PubMed]
- Kotchenova, S.Y.; Vermote, E.F. Validation of a vector version of the 6s radiative transfer code for atmospheric correction of satellite data. Part II: Homogeneous lambertian and anisotropic surfaces. Appl. Opt. 2007, 46, 6762–6774. [Google Scholar] [CrossRef]
- Preisendorfer, R.W.; Mobley, C.D. Principal component analysis in meteorology and oceanography. Dev. Atmos. Sci. 1988, 17, 55–72. [Google Scholar]
- Deuzé, J.L.; Bréon, F.M.; Devaux, C.; Goloub, P.; Herman, M.; Lafrance, B.; Maignan, F.; Marchand, A.; Nadal, F.; Perry, G.; et al. Remote sensing of aerosols over land surfaces from polder-adeos-1 polarized measurements. J. Geophys. Res. 2001, 106, 4913. [Google Scholar] [CrossRef]
- Chu, D.A.; Kaufman, Y.J.; Ichoku, C.; Remer, L.A.; Tanré, D.; Holben, B.N. Validation of modis aerosol optical depth retrieval over land. Geophys. Res. Lett. 2002, 29, 8007. [Google Scholar] [CrossRef]
- Levy, R.C.; Remer, L.A.; Kleidman, R.G.; Mattoo, S. Global evaluation of the collection 5 modis dark-target aerosol products over land. Atmos. Chem. Phys. 2010, 10, 10399–10420. [Google Scholar] [CrossRef]
- Hsu, N.C.; Tsay, S.C.; King, M.D.; Herman, J.R. Aerosol properties over bright-reflecting source regions. IEEE Trans. Geosci. Remote Sens. 2004, 42, 557–569. [Google Scholar] [CrossRef]
- Nadal, F.; Breon, F.M. Parameterization of surface polarized reflectance derived from polder spaceborne measurements. IEEE Trans. Geosci. Remote Sens. 1999, 37, 1709–1718. [Google Scholar] [CrossRef]
- Maignan, F.; Bréon, F.-M.; Fédèle, E.; Bouvier, M. Polarized reflectances of natural surfaces: Spaceborne measurements and analytical modeling. Remote Sens. Environ. 2009, 113, 2642–2650. [Google Scholar] [CrossRef]
- Xie, D.; Cheng, T.; Wu, Y.; Fu, H.; Zhong, R.; Yu, J. Polarized reflectances of urban areas: Analysis and models. Remote Sens. Environ. 2017, 193, 29–37. [Google Scholar] [CrossRef]
- Lee, K.H.; Kim, Y.J. Satellite remote sensing of asian aerosols: A case study of clean, polluted, and asian dust storm days. Atmos. Meas. Tech. 2010, 3, 1771–1784. [Google Scholar] [CrossRef]
- Li, S.; Chen, L.; Tao, J.; Han, D.; Wang, Z.; Su, L.; Fan, M.; Yu, C. Retrieval of aerosol optical depth over bright targets in the urban areas of north china during winter. Sci. China Earth Sci. 2012, 55, 1545–1553. [Google Scholar] [CrossRef]


| AERONET Sites | AERONET AOD Mean | Retrieved AOD Mean | MAE |
|---|---|---|---|
| Beijing | 0.260 | 0.287 | 0.073 |
| Xianghe | 0.264 | 0.288 | 0.074 |
| Taihu | 0.361 | 0.328 | 0.079 |
| Hongkong_PolyU | 0.234 | 0.226 | 0.058 |
© 2017 by the authors. Licensee MDPI, Basel, Switzerland. This article is an open access article distributed under the terms and conditions of the Creative Commons Attribution (CC BY) license (http://creativecommons.org/licenses/by/4.0/).
Share and Cite
Zhang, Y.; Li, Z.; Qie, L.; Hou, W.; Liu, Z.; Zhang, Y.; Xie, Y.; Chen, X.; Xu, H. Retrieval of Aerosol Optical Depth Using the Empirical Orthogonal Functions (EOFs) Based on PARASOL Multi-Angle Intensity Data. Remote Sens. 2017, 9, 578. https://doi.org/10.3390/rs9060578
Zhang Y, Li Z, Qie L, Hou W, Liu Z, Zhang Y, Xie Y, Chen X, Xu H. Retrieval of Aerosol Optical Depth Using the Empirical Orthogonal Functions (EOFs) Based on PARASOL Multi-Angle Intensity Data. Remote Sensing. 2017; 9(6):578. https://doi.org/10.3390/rs9060578
Chicago/Turabian StyleZhang, Yang, Zhengqiang Li, Lili Qie, Weizhen Hou, Zhihong Liu, Ying Zhang, Yisong Xie, Xingfeng Chen, and Hua Xu. 2017. "Retrieval of Aerosol Optical Depth Using the Empirical Orthogonal Functions (EOFs) Based on PARASOL Multi-Angle Intensity Data" Remote Sensing 9, no. 6: 578. https://doi.org/10.3390/rs9060578