Article

A Hybrid Approach for Three-Dimensional Building Reconstruction in Indianapolis from LiDAR Data

1
Center for Urban and Environmental Change, Indiana State University, Terre Haute, IN 47802-1902, USA
2
College of Tourism, Fujian Normal University, Fujian 350000, China
*
Author to whom correspondence should be addressed.
Remote Sens. 2017, 9(4), 310; https://doi.org/10.3390/rs9040310
Submission received: 24 December 2016 / Revised: 14 March 2017 / Accepted: 20 March 2017 / Published: 26 March 2017
(This article belongs to the Special Issue Societal and Economic Benefits of Earth Observation Technologies)

Abstract

:
3D building models with prototypical roofs are more valuable in many applications than 2D building footprints. This research proposes a hybrid approach, combining the data- and model-driven approaches for generating LoD2-level building models by using medium resolution (0.91 m) LiDAR nDSM, the 2D building footprint and the high resolution orthophoto for the City of Indianapolis, USA. The main objective is to develop a GIS-based procedure for automatic reconstruction of complex building roof structures in a large area with high accuracy, but without requiring high-density point data clouds and computationally-intensive algorithms. A multi-stage strategy, which combined step-edge detection, roof model selection and ridge detection techniques, was adopted to extract key features and to obtain prior knowledge for 3D building reconstruction. The entire roof can be reconstructed successfully by assembling basic models after their shapes were reconstructed. This research finally created a 3D city model at the Level of Detail 2 (LoD2) according to the CityGML standard for the downtown area of Indianapolis (included 519 buildings).The reconstruction achieved 90.6% completeness and 96% correctness for seven tested buildings whose roofs were mixed by different shapes of structures. Moreover, 86.3% of completeness and 90.9% of correctness were achieved for 38 commercial buildings with complex roof structures in the downtown area, which indicated that the proposed method had the ability for large-area building reconstruction. The major contribution of this paper lies in designing an efficient method to reconstruct complex buildings, such as those with irregular footprints and roof structures with flat, shed and tiled sub-structures mixed together. It overcomes the limitation that building reconstruction using coarse resolution LiDAR nDSM cannot be based on precise horizontal ridge locations, by adopting a novel ridge detection method.

Graphical Abstract

1. Introduction

3D building models with prototypical roofs are more valuable in applications of Geography Information Systems (GIS), urban planning and environmental modeling compared to the widely-existing 2D building footprints. They are extremely useful in solar radiation calculations, noise emission simulation [1] and urban structure analysis since they contain more physical and morphological information for an individual building [2]. According to Kolbe et al. [3], the multi-scale 3D building model reconstruction can be categorized into five levels of detail: LoD0-1 presents a building model containing the 2.5D Digital Terrain Model (DTM) and building block models without roof structures; LoD2 presents building models including roof structures; LoD3–4 presents a building model including detailed architecture and interior models [4]. Most of the cities in developed countries have LoD1 building data, which extrude 2D building footprints according to their height values. However, the box-shaped LoD1 model does not have the roof structures, but LoD2 has greater detail of roof planar shapes and also has the ability to represent commonly-seen tiled roofs, such as hipped roofs and gabled roofs. LoD4 and LoD3 currently can only be reconstructed manually or semi-automatically and often for small areas only [1]. For a large area, LoD2 is sufficient since it can provide the basic physical parameters for each building.
The availability of laser scanning techniques, such as Light Detection and Ranging (LiDAR), makes the acquisition of height information of ground features more accurate and easier. In the past two decades, numerous methods for building modeling from LiDAR [1,5,6,7,8], high resolution aerial imagery [9,10,11,12] and multiple data sources [2,13,14,15] have been developed. Henn [1] used the supervise classification method to classify and reconstruct a 3D building with prototypical roofs (LoD2) from LiDAR point cloud data in Cologne, Germany. Haala et al. [6] presented the 3D urban models based on the LiDAR Digital Surface Model (DSM). Alharthy and Bethel [7] used a moving surface method to extract building roof information from airborne laser scanning altimetry data on Purdue University Campus, Indiana. Ghaffarian and Ghaffarian [10] introduced simple color space transformation and a novel masking approach to detect buildings from high resolution Google Earth Imagery. Manno-Kovacs and Sziranyi [11] proposed an aerial building detection method to delineate building outlines from multiple data sources, including aerial and high resolution optical satellite images. Sumer and Turker [12] provided an adaptive fuzzy-genetic algorithm to detect buildings from 1-m resolution pan-sharpened IKONOS imagery. Haala and Brenner [14] combined LiDAR DSM and 2D building footprints to build an urban surface model. Awrangjeb et al. [15] presented an automatic building detection technique using LiDAR point clouds and multispectral imagery. LiDAR data and aerial imagery provide valuable geometry and spectral information of buildings, respectively. Research using multiple data sources can achieve higher building modeling quality than using LiDAR data or high resolution aerial imagery separately, because more information can be extracted.
The general procedure of building modeling includes two steps: the detection of building boundaries and the reconstruction of building models [13,15,16,17,18,19]. The building detection studies [10,11,12,15,17,18,19] separated building roofs from other features by using a series of hypotheses, which are based on the spatial, spectral and texture characteristics of buildings. Rottensteiner et al. [17] used the Dempster–Shafer method, which is based on a data fusion theory to detect buildings in densely built-up urban areas. Yang et al. [18] implemented a marked point process method to extract building outlines from high resolution LiDAR point clouds. Dubois et al. [19] detected building outlines and retrieved their geometry parameters in high resolution Interferometric Synthetic Aperture Radar (InSAR) phase images. Previous studies have developed the methods for detecting building boundaries well from various data sources, but the automatic reconstruction of accurate roof structures at the LoD2 level of detail remains challenging. Although using the high resolution LiDAR point clouds or InSAR data can improve the accuracy of 3D building reconstruction, it requires a large amount of data. In particular, the reconstruction of mixed and complicated roof structures within large-scale areas is computationally intensive and lacking in effective approaches.
Existing studies of the reconstruction of 3D city models from LiDAR-derived nDSM or high-density point cloud data with or without additional data sources included three major categories of strategies: data-driven (bottom-up) [5,7,8,20,21,22,23,24,25,26,27,28,29,30,31,32], model-driven (top-down) [1,2,6,9,13,14,16,33,34,35,36,37,38,39,40] and hybrid approaches [41,42,43,44,45,46].
For the data-driven strategies, buildings are considered as the aggregation of roof planes represented by the blocks of point clouds or the digital surface model, which are segmented into different parts by utilizing such algorithms as region growing [7,20,21], random sample consensus (RANSAC) [22,23], clustering [24], ridge or edge based [5,25] or a combination of two or several of them [26,27,28,29,30,31,32].Khoshelham et al. [20] presented a split-and-merge algorithm, which split image regions whose associated height points do not fall in a single plane and merging coplanar neighboring regions. Rottensteiner and Briese [21] proposed a method that grouped the decomposed building regions to create polyhedral building models from LiDAR DSM. The neighborhood relations of the planar segments considered for the grouping were derived from a Voronoi diagram of the segment labeled image. Ameri and Fritsch [22] introduced a RANSAC-based method, which used boundary representation of building hypothesis obtained from high resolution imagery to reconstruct 3D building. Shan and Sampath [24] used the density-based clustering algorithm to segment the coplanar roof segments based on LiDAR point clouds. Their method calculated the density at each data point and used a connectivity criterion to categorize all connected points that have similar density [24]. Zhu et al. [5] developed a building reconstruction pipeline based on sparse LiDAR point clouds (0.8 points/m2), which was obtained from an open source database to segment the planes in complex flat roofs based on the position of step edges. Wang and Shan [25] proposed an edge-based segmentation method to extract building roof planes from LiDAR point clouds based on an advanced similarity measure, which was generated by discrete computation geometry and machine learning. Dorninger and Pfeifer [26] proposed a comprehensive approach to automatically determine 3D city models from LiDAR data by using a reliable 3D segmentation technique combining region growing and hierarchical clustering algorithms together. A similar approach was done by Jochem et al. [28], which combined region growing and the clustering-based Approximate Nearest Neighbor library (ANN) algorithm together for larger area building reconstruction. Awrangjeb et al. [29] and Awrangjeb et al. [32] used the combination of the region growing and edge-based algorithms for automatic 3D roof extraction through the integration of LiDAR and multispectral orthoimagery. They proposed a similar methodology to extract building roofs in a subsequent study [30], but based solely on raw LiDAR data.
The model-driven approach develops parametric building models, which are stored in a predefined library to reconstruct the given blocks of point clouds or DSM. At the end of the last century, some researchers have started to use this approach to reconstruct basic 3D buildings with rectangular boundaries in the 2D plane, for example, Haala and Brener [6,14,33,34] and Vosselman et al. [35,36]. Many researchers followed their works in recent years and developed advanced methodologiesto reconstruct more complicate roofs in relatively larger areas [1,2,37,38,39,40]. The automated generation of 3D city models can be achieved by using 2D building footprints and LiDAR data [2,6,14,33,34,36,37,38], since the 2D building footprints are widely available at a national level for European countries and other developed countries [1]. Vosselman et al., 2001 [36], proposed a 3D building reconstruction method using LiDAR data, 2D building footprints and the Hough transform segmentation algorithm. Lafarge et al. [38] presented a method that reconstructs buildings from a Digital Surface Model (DSM) and 2D building footprints. The 3D blocks were placed on the 2Dsupports using a Gibbs model, which controls both the block assemblage and the fitting to data. A Bayesian decision found the optimal configuration of 3D blocks using a Markov Chain Monte Carlo (MCMC) sampler associated with original proposition kernels. A similar approach for point cloud data has been proposed by Huang et al. [39].
The data-driven approach has the advantage of detecting basic elements, such as boundaries, ridges and step edges, but the reconstruction quality is limited by the algorithm used for roof planes’ segmentation. For example, the region growing algorithm is subject to seed selection, and it tends to fail to segment roof regions in areas where the roof segment is not smooth or its size is not large enough to contain enough LiDAR points [7]. The RANSAC algorithm often leads to unneeded false plans, while Tarsha-Kurdi et al. [23] state that the clustering algorithm needs to define the number of classes and the cluster center subjectively [24]. The ridge- or edge-based algorithms are too sensitive to ridges or steep edge detection quality [25]. Although many researchers [26,27,28,29,30,31,32] attempted to combine multiple algorithms to improve the data-driven approach after they recognized the shortages of each algorithm, they still cannot avoid the common limitation for data-driven approaches that the modeling results are usually affected by the disturbing objects, such as chimneys, dormers and windows [31]. In some cases, building roofs are occluded by large surrounding trees [32]. Therefore, they can neither construct a complete roof plane, nor construct irregular planes, and it usually requires a manual mono-plotting procedure to remove incorrect boundaries [27]. For instance, 15% of the buildings in the final results of [26] were still lacking completeness. Although the approach in Awrangjeb et al. [29] has a higher degree of automatic processing, the small planes and planes with low heights still could not be detected properly in the final result. Zhu [5] identified and adjusted most of the step edges on the roof planes, but still, only 74.6% of the building patches were correctly detected, and errors were caused by noisy segments from vegetation and under-segmentation caused by the limitation of the sparse LiDAR point clouds used, which is 0.8 points per square meter (pts/m2). The model-driven methods have several advantages. First, in roof primitives, the constraints of member facets are pre-defined and ensure regularized or completed reconstructions [2]. Then, primitives are combined as if they were the organization of a bunch of facets [37]. However, a common limitation of the model-driven approach is that there are limited types of models stored in the predefined library. Moreover, the predefined models made the assumptions of ideal roofs, such as that flat roofs always have equal height and convex roofs are symmetric, and significant structures of the roofs are often neglected. Therefore, its applicability for reconstructing accurate building models in a larger area is doubted.
Many researchers tried to utilize the hybrid approach [41,42,43,44,45,46], which integrates data-driven and model-driven approaches, as they think it might produce higher quality (more complete and detailed) building models. The principle is to use data-driven approaches to detect the features, such as ridges and edges, as prior knowledge for a subsequent model-driven approach. Arefi et al. [41] reconstructed building roofs based on the directions of each extracted ridge line fitted using the RANSAC algorithm from detected local maxima pixels, which followed their previous work [40]. The reconstruction result was found to be too sensitive to the location and accuracy of the extracted ridge lines. Wang et al. [42] proposed an approach to reconstruct compound buildings with symmetric roofs using a semantic decomposition algorithm, which decomposes the compound roofs into different semantic primitives based on an attribute graph. However, their methods were limited to the buildings having rectangular footprints and symmetric roof structures. Moreover, the reconstruction did not include buildings with step edges and substructures on the roofs, which are commonly seen in urban commercial areas. Kwak and Habib [43] introduced a Recursive Minimum Bounding Rectangle (RMBR) algorithm to reconstruct accurate right-angled-corner building models from LiDAR data. Although this approach can minimize the amount of processing in each step via transforming the irregular building shape into a rectangular one, it can only model the types of buildings that can be decomposed into rectangles without losing too many original shapes. In addition, no tiled roofs were reconstructed in this study. Tian et al., 2010 [44], presented a method for the reconstruction of building models from video image sequences. The accuracy of reconstruction was limited by the video quality. As the author stated, the video camera cannot catch all of the building surfaces and frames at one time, which would lead to missing that information. Fan et al. [45] presented a building reconstruction method using a hierarchical ridge-based decomposition algorithm to obtained ridge position, as well as the angle and size of roof planes for subsequent model-driven reconstruction, based on high-density (6–9 pts/m2) LiDAR point cloud data. They achieved a 95.4% completeness for the reconstruction of seven buildings, but as they stated in the conclusion, the limitation of their method is that it has strict requirements for the density of LiDAR point clouds. Otherwise, it may fail. Xu et al. [46] proposed another approach, which is based on high-density LiDAR point clouds. They applied a RANSAC and ridge detection combined segmentation algorithm to LiDAR point clouds covering two test sites, which have a 4-pts/m2 and 15-pts/m2 density, respectively. Their function improved the segmentation accuracy and the topology correctness.
According to the existing studies mentioned above, it can be concluded that the hybrid approach can produce higher reconstruction quality than using data-driven and model-driven approaches separately, as it is more flexible than the model-driven approach and can produce much more complete results than the data-driven approach. However, even more complete planes can be generated by the hybrid approaches’ accuracy of plane boundaries, which still can be limited by the precision of algorithms used in data-driven approaches, which detect the edges and ridges. Some studies [42,45,46] rely on the high resolution LiDAR point cloud data to achieve a high 3D building reconstruction quality. Using the high-density LiDAR point clouds can produce high segmentation accuracy, but it requires very large storage memory in computers and large amounts of time to process when reconstructing buildings within large areas. Point cloud-based segmentation algorithms need to be performed in the computer’s main memory by creating a suitable spatial indexing method of the point dataset [28]. This can lead to the consequence that the segmentation of large LiDAR point datasets is difficult to execute within a common GIS environment because the main memory of common computer hardware would likely be exceeded [28]. The sparse LiDAR point clouds or downscaled moderate resolution LiDAR normalized DSM (nDSM), on the other hand, requires much smaller space for storage while maintaining acceptable precision compared to high resolution point clouds, which need less memory and time for processing to reconstruct 3D buildings in large areas. Moreover, many GIS raster-based algorithms can directly be applied to nDSM data, which is also convenient. However, the previous model-driven [2,34,37,39] and hybrid [41] approaches, which utilized the LiDAR nDSM, only focused on rectangular or symmetric tiled roof reconstruction. The irregular or more complicated roofs, which mixed tiled, flat and shed structures, were not well presented. In addition, many small planes were not reconstructed properly, and the accuracies of ridge positions were not assessed. The major reason for those limitations in the existing studies is that there is an absence of robust methods to reconstruct 3D buildings based on medium spatial resolution nDSM.
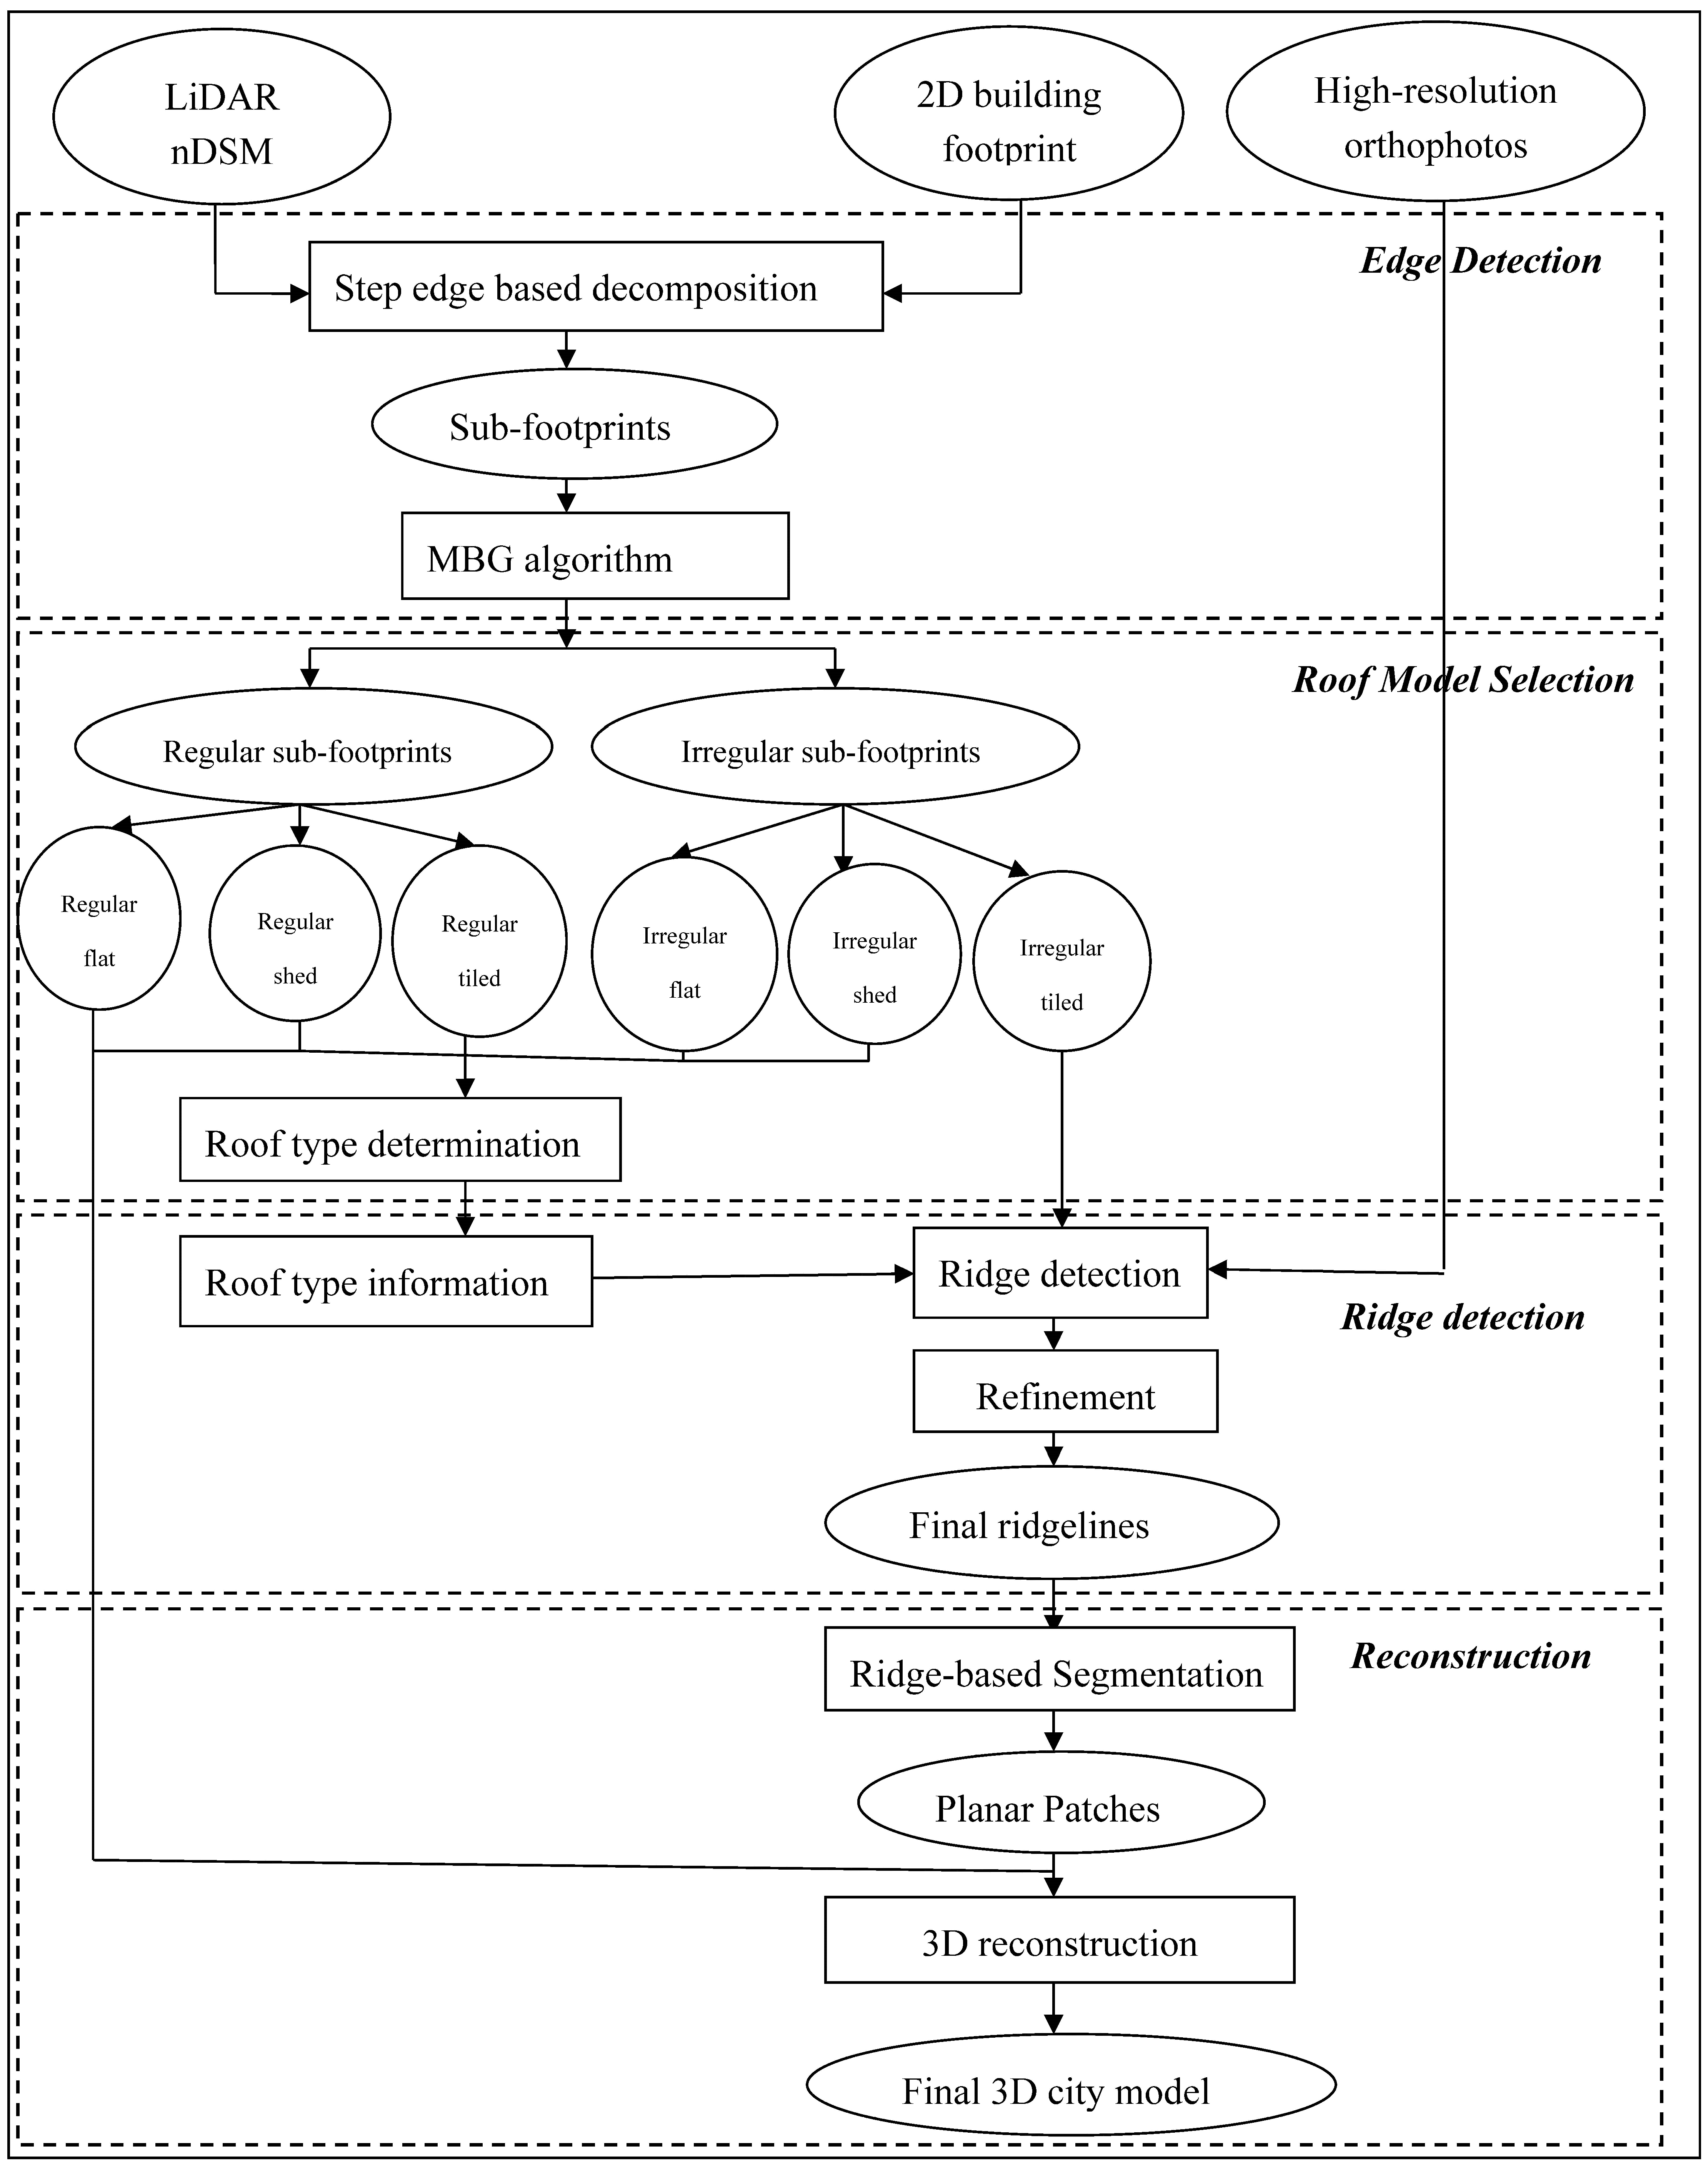
It can be concluded from the above studies that the limitation remains for current studies of 3D building reconstruction, even if the hybrid approaches were used. The greatest challenge is how to overcome the limitations of the efficiency of data processing and the robustness of the methodology to achieve higher accuracy when reconstructing complicated building roofs in large areas. In this paper, we propose a hybrid approach, combining the data- and model-driven approaches for generating LoD2-level building models by using downscaled LiDAR nDSM data. The main objective is to develop a GIS-based workflow for automatically reconstructing complicated building roof structures in large areas with high accuracy, but without requiring high-density point clouds and computationally-intensive algorithms. The proposed approach is expected to provide a product that is easy to operate in a GIS database environment, which allows additional attributes, such as materials, height, area, slope, aspect and time-dependent shadowing status, to be assigned in the attached attribute fields for further applications: urban morphology studies, urban building energy studies, environmental modeling studies and roof solar potential analysis.

2. Methodology

Figure 1 presents the workflow for our multiple-stage approach. The process starts with the extraction of step edge lines on the building roof using LiDAR nDSM. Segmentation was performed to split building footprints into sub-footprints according to the edge position. Different algorithms were used to refine the boundaries of regular and irregular-shaped sub-footprints. LiDAR data within each regular-shaped sub-footprint were analyzed to determine the type of roof on the corresponding building part. In the subsequent step, ridge pixels were detected from LiDAR data and high-resolution orthophotos using a set of rules for the tilted roofs. The roof type information was used as complementary knowledge to determine the final ridge position. The sub-footprints were then split into different planar patches according to lines converted from the ridge pixels. 3D roof models for each planar patch were reconstructed and fitted to the data with the knowledge of all of the physical parameters calculated from the input data. The final model for the whole building was defined by assembling all individual models built within each planar patch and employing some post-processing refinements using a data-driven approach. In the final stage, all of the parametric models are merged to form a final 3D city model atLoD2 of the entire city.

2.1. Study Area and Data

Three data sources were used in this study: LiDAR data, building footprint polygons and high-resolution orthophotos. The study area covers the Central Business District (CBD) of the city of Indianapolis (Figure 2). It is characterized by commercial buildings and residential houses with different roof shapes. LiDAR data DSM and Digital Elevation Models (DEM) from 2009 were both rasterized from the last return LiDAR point clouds. They have the same spatial resolution of 0.91 m. The LiDAR nDSM, which represents absolute height information of objects above the ground surface, was calculated as follows:
nDSM = DSM − DEM
Building footprint data, which was provided by the city government of Indianapolis, were acquired in the year 2013. They were used to mask out the non-building features, such as tall trees in the LiDAR nDSM. There are 519 building footprints in the study area in total. Buildings having zero or negative height values were removed due to the fact that building footprints were created after the LiDAR data were obtained. Some new buildings were constructed after the acquisition of the LiDAR data. High-resolution orthophotos from the year of 2013 with a spatial resolution of 6 inches (0.15 m) was downloaded for ridge detection and validation.

2.2. Step-Edge-Based Segmentation

2.2.1. Step-Edge Detection

The step edge is a roof edge connecting its neighboring patches that abruptly changes in height [5] (Figure 3). The process starts with the extraction of step edge lines on the building roof using LiDAR nDSM and 2D building footprints in order to ensure that the model-driven approach can insert the 3D quadratic model into the right position when reconstructing complicated roofs. Direct use of those box-shaped models to represent buildings with complex and irregular shapes may cause the loss of roof information and lead to inaccurate reconstruction. Some previous research [34,36,37] decomposed the irregular building footprints by its extended outlines, but this approach is only suitable for the rectangular footprints. If the building outline is very detailed and consists of many short line sections, footprints will be over decomposed into too many small cells (Figure 4). This will not only make it difficult to reconstruct a well-shaped roof, but also will increase the computation time due to data redundancy problems. Moreover, this approach might not be effective to decompose building footprints according to the real step edges on the roof. As shown in Figure 3, the decomposition algorithm only splits the polygons into the cells at the intersection of two non-parallel outlines, but it cannot detect step edges on the roofs.
A Canny edge detector was first used to find out the possible step edges on roofs. Figure 5 represents the result of applying the Canny edge detector to the LiDAR nDSM for a selected building. According to each step line, segmentation was performed to split the building footprints into sub-footprints.

2.2.2. Step-Edge Refinement

The initial outlines of the sub-footprints are zigzag-shaped due to the raster nature of nDSM (Figure 5e). In order to obtain a better outline quality, the outlines need to be refined and simplified. An area threshold (30 m2) was used to merge the smaller sub-footprints with their adjacent larger sub-footprints. If there were multiple adjacent sub-footprints, the one sharing the longest boundary would be chosen. The edge-based segmentation created two types of sub-footprints, one with irregular shapes and the other either similar to a circle or a rectangle (Figure 5e). If a sub-footprint is regular in shape, the similarity between its shape and its minimum bounding geometry should be higher than the irregularly-shaped ones. Several criteria were proposed to evaluate the degree of regularity for the shape of each sub-footprint. In the first step, Minimum Bounding Geometry (MBG), which was adopted in Arefi et al. [41] and Kwak and Habib [43], was created for each sub-footprint. It includes both the Minimum Bounding Rectangle (MBR) and Minimum Bounding Circle (MBC). The area of each sub-footprint was compared to the area of its MBR and MBC using the flowing equation:
Area ratio = area of segment/area of its minimum bounding rectangle (circle)
If the area ratio of a sub-footprint is close to 1, it should indicate that its shape has higher similarity to its MBR/MBC, and its MBR/MBC can be used for building reconstruction to refine its shape. The thresholds were set as 0.92 for MBRs and 0.85 for MBCs. If two MBGs fulfilled the threshold at the same time, the MBG with the higher area ratio was chosen. Since the MBGs are slightly larger than the original sub-footprint in size, they were rescaled according to their area ratio. For irregular-shaped sub-footprints, the “bend simplify” algorithm was used to simplify their zigzag boundaries into straight lines, since it often produces results that are more faithful to the original and more aesthetically pleasing [47]. It applies shape recognition techniques that detect bends, analyze their characteristics and eliminate insignificant ones [47]. In the final step, all of the overlapping areas produced by the refinement were removed to ensure that the boundaries between adjacent sub-footprints are topographically correct. Figure 5g shows the detected step edges overlapping on the high-resolution orthoimagery.

2.3. Roof Model Selection

After edge-based segmentation, three types of sub-footprints were created: irregular-shaped, rectangle-shaped and circle-shaped. In the following step, for each sub-footprint, a roof model selection procedure will be performed to analyze 3D roof primitives stored in the predefined library (Figure 6) as the best fit. The library contained 3D models for several types of commonly-seen roofs, and they were applied after the roof types of the input data were determined. Most of the commonly-seen building roofs can be divided into three categories: flat roofs, shed roofs and tiled roofs. A flat roof is a subtype of a roof with a single roof plane, and all corners have the same or very similar height. Shed roofs also have one roof plane, but the height values for different corners are not the same. A tiled roof, on the other hand, includes ridges that divide the roof into multiple planes.
Reconstructing the rectangular-shaped or circular-shaped roof is easier because usually only one roof primitive is enough. The irregular-shaped sub-footprints might require further segmentation, which involves the ridge-based [40,41,43] or outline-based [34,36,37] decomposition algorithm to split them into regular shapes and make it easier for modeling. However, this decomposition is only necessary for the irregular tiled roofs, which include ridge lines. If the flat roof and shed roofs can be identified first, it will minimize the volume of data that needs to be processed in the next step. The percentage of pixels with slope values lower than 10 degrees in each cell was calculated. The cells with at least 27% of pixels having a slope value lower than 10 degrees would be recognized as flat roofs. The reason that a slope threshold of 10 degree was used instead of 0 degrees is to allow the slight height deviations caused by very small objects on the roofs, such as air conditions, antennas, fans or pipelines. Due to the limitation of the spatial resolutions of LiDAR nDSM, those small objects cannot be identified in the step-edge detection step. Reference data were collected to evaluate the accuracy for flat roof identification. Table 1 shows that 96% of classification accuracy was achieved.
The procedure continued by determining roof types for the sub-footprints identified as non-flat roofs, which included the shed roofs and tiled roofs. To determine the most suitable model, the height, slope and the orientation values of all pixels within a sub-footprint were evaluated. The orientation values were recorded from calculated aspect values, which is the orientation of the slope, as Table 2 presents. Pixels near boundaries of the footprints could be located on the vertical walls, which cannot reflect the actual aspect value of its adjacent roof plane. Therefore, a buffer zone was created for the building footprint boundaries with the width of 1 m on both sides to filter out the pixels that might be located on the vertical walls. Sub-footprints that have more than 80% of their pixels facing in one orientation were classified as shed roofs, and the rest were all classified as tiled roofs.
Further roof determination was done for the rectangular-shaped tiled roofs’ sub-footprints based on the orientation values. There were six most commonly-seen types of tiled roofs observed in the study area: gable roof, cross-gable roof, intersecting roof, hipped roof, half-hipped roof and pyramidal roof. A Gable roof can be defined as a roof that has two upwards sloping sides that meet each other at the ridge, which is also the top of the roof (Figure 7a). In the case of cross gable roofs, there is one more gable at either side of the upward plane (Figure 7b). The intersecting roofs, on the other hand, have gables on both sides of the original upward planes (Figure 7f). A hipped roof is a type of roof where all sides slope upwards to the ridge, but usually with a much gentler slope compared to that of the gable roof (Figure 7c). Half-hipped roofs and pyramidal roofs are both special cases of the hipped roof. Half-hipped roofs only have a single hip on one side (Figure 7d). Pyramidal roofs can be seen as hipped roofs with a ridge length of zero (Figure 7e).
In each sub-footprint, the adjacent pixels that had the same orientation values were merged together to form a new plane, and the plane grew until no pixels could be added. Figure 8 presents the planes generated after this process. However, pixels located on dormers, edges and ridges on the roof might introduce noise to the orientation value. Therefore, segments containing less than or equal to 5 pixels would not be considered as the complete roof plane and were merged into their adjacent larger planes with the topological relationship of “within,” or in other cases, there is only one adjacent larger planes. Segments have two or more adjacent planes that will be merged to the one with the longest common borders. The final roof type determination was based on the number of planar patches and their topological relationship. Table 3 presents the tentative rules for roof type determination. However, there was still a small number of sub-footprints that cannot be determined by these rules, and they were grouped with the irregular sub-footprints. Sub-footprints identified as the irregular tiled roofs in the former step were considered to contain multiple types of roofs, and the reconstruction for them will be discussed in the following section. The circle-shaped flat and non-flat roofs were considered as cylinder and cone roofs in this study, respectively.

2.4. Ridge-Based Decomposition

2.4.1. Ridge Detection

Since we already detected the step-edges in the previous step, the next step is to focus on the detection of ridge position on the tiled roof. The procedure to extract ridge lines corresponding to the tiled roofs included extracting candidate ridge pixels from LiDAR nDSM and edges from high-resolution orthophotos. According to the existing literature [40,41,48], LiDAR data are often used for ridge detection. Ridges can be seen as the local maxima in the height data, since they are usually the tallest part on the roof. However, sole LiDAR data for ridge detection cannot produce the highest geometric accuracy for the ridge position due to the limitation on the accuracy of LiDAR data.
Therefore, in this study, we used high resolution orthophotos as an additional data source to enhance the ridge detection accuracy. A watershed analysis algorithm, which was designed by Jenson and Domingue [49], was applied to extract the ridge pixels on the LiDAR nDSM. This algorithm starts with determining the flow direction of every pixel on the DSM, based on a rule that water will always flow into the steepest downward direction. For each pixel, eight possible directions to its eight adjacent pixels were compared to determine in which direction there is a maximum drop, and it can be identified as the steepest downward direction. In the next step, the accumulation flow-runs into each pixel can be calculated. Pixels with zero accumulation flow values are the local highs, which can be identified as the candidate ridge pixels (Figure 9c). However, this algorithm cannot detect the ridge pixels located at the concave portion of the roof. Therefore, a stream order algorithm developed by Strahler [50] was used to detect these ridge pixels. This method assigns orders to all of the links produced by flow direction by considering their number of tributaries. It assigns an order of 1 to the links that are not the tributaries of other links, which are referred to as first order links. Ridge pixels detected in the former step were identified as the first order links since they are the regional maxima, and the flow directions of their adjacent pixels were going in opposite directions. This stream order increases when links of the same order intersect. For example, the intersection of two first order links will create a second order link. Therefore, the ridge pixels located at the concave roof portions can be detected as high order links. They can be seen as the intersection of two of their adjacent pixels, which have the flow directions going towards each other (Figure 9d). The candidate ridge pixels detected by two algorithms were added together, as presented in Figure 9e. The Canny edge detector was executed to detect the line features from a grey-scale orthophoto (Figure 9b), which has been co-registered with LiDAR data and building footprints beforehand. Building footprints were overlaid with all of the detected lines to filter out the non-building lines, and a buffer of building boundaries was created to filter out the lines detected as building edges. However, the remaining lines still included the boundary of shadow and dormers. In order to further filter out those features, ridge pixels detected by LiDAR nDSM were overlaid with edges detected by the orthophotos, which included the potential ridge pixels (Figure 9f).The length and sinuosity of each line segment are calculated to create rules to filter out the short lines and bend lines; lines shorter than 3 m and having a sinuosity index less than 0.7 were removed (Figure 9g).

2.4.2. Ridge Refinement

The next step is to fit all of the disconnected line segments into intersecting straight lines to split the footprints into multiple planar patches using several criteria. For line segments in each footprint, an initial list containing the longest line segment was created. Line segments with similar orientations (the difference is less than five degree) and close distance (the distance between two nearest endpoints is shorter than a predefined threshold) were added into the list, and the process stopped after no lines within the footprints could be added. The X and Y coordinates for all endpoints of line segments within the list were calculated. A straight line was fitted by connecting the two endpoints with the longest distance, and all of the line segments were removed from the footprint. The process started again to find the longest lines in the remaining line segments and iterated until no line segments were left in the footprints. Figure 9h presents the line segments fitted after this process.
Major ridge lines were defined in the subsequent process. Pixels located in the major ridge lines have several characteristics: they are higher than the average height of the whole building; their neighboring pixels have a larger standard deviation of aspect values; and their slope values are lower than the neighboring pixels. Based on those characteristics, several rules had been created for major ridge line identification, as Table 4 shows. All ridge lines were overlaid with LiDAR nDSM, and the mean values of the height, aspect index and slope of the pixels overlaid with each ridge line were calculated. Ridge lines fulfilling all of the conditions listed in Table 4 were selected as the major ridge lines. For example, the green thicker lines in Figure 9i were the major ridge lines identified within the demonstration building. If the distance of a major ridge line to the endpoint of the other ridge line is shorter than a predefined threshold, both ridge lines were extended until they intersected with each other. The minor ridge lines (blue lines in Figure 9i) were also extended to connect the roof edges with the major ridgelines. If the intersection of the minor ridge lines with building edges and major ridge lines does not coincide with the corner and the intersection of the two major ridges lines, they will be shifted to the nearest corner or major ridge intersection. Figure 9j presents the final ridge lines generated by the proposed method in the demonstration building. Using these ridge lines, building footprints for all of the tiled roofs can be split into multiple planar two major ridges lines, they will be shifted to the nearest corner or major ridge intersection. Figure 9j presents the final ridge lines generated by the proposed method in the demonstration building patches (Figure 9k).
For most of the rectangular roofs, the roof type determined in the previous step was used as a reference to refine the detected ridge lines. Table 5 lists the numbers for major and minor ridge lines that are contained for each roof type. If the detected ridge lines cannot match with the reference ridge number listed in Table 5, modifications needed to be made. The most commonly-seen mistake is missing one or two minor ridges. This was due to the reason that a few ridge lines could not be detected by the Canny edge detector. In this case, additional ridgelines were added according to the types of roof, which were assigned in the previous steps. Major ridges in gabled, cross-gabled and intersecting roofs were extended automatically to intersect with one or two edges of building footprints, which were perpendicular to the ridge line; endpoints in the major ridges in hipped roofs were connected with the two corners on each side of the building footprints.

2.5. Roof Model Reconstruction

The 3D buildings were reconstructed by applying the prototypical roofs to represent the given building footprints or sub-footprints according to the parameters retrieved from LiDAR data and high resolution orthophotos. The reconstruction of flat roofs, despite their footprints being regular-shaped or irregular-shaped, was easier than other types of roofs, as it required one parameter, that is the mean height of all of the LiDAR nDSM pixels contained in the footprints. The original 2D building footprint Shapefiles were extruded to 3D building using the mean height value. To reconstruct the shed roofs, height values for all of the vertices in the boundaries of their footprints were obtained from the LiDAR nDSM.
Two different methods were used to reconstruct the tiled roofs. For pyramid roofs and tiled roofs with a circle-shaped footprint, gutter height and top height were used for reconstruction because they did not contain any ridge lines. In this study, tiled roofs with circular-shaped footprint were all reconstructed as cone-shaped roofs. Gutter height and top height were estimated using a method proposed by Lafarge et al. [38]. Masks were defined separately to include the pixels chosen for gutter height and top height estimation (Figure 10). A parameter N was used to define the number of selected pixels, and the mean of their values, which were ranked using an increasing order between 0.25N and 0.75N, was computed for gutter height and top height in different masked areas.
The reconstruction of other types of tiled roofs needs the major ridge height and eave height parameters. Since the footprints of those tiled roofs were split into planar patches according to the ridges, reconstruction will be based on each planar patch instead of the entire footprint. One or two ridge lines were used as the edges of planar patch to reconstruct the 3D model. The eave height was calculated using the same method in the previous steps. The major ridge height was calculated as the mean value of LiDAR nDSM pixels that intersected with the ridge line. The whole building model was defined by assembling all of the individual models with the same “building ID” numbers together.

3. Results

3.1. Visualization of Reconstructed 3D LoD2 City Model

The proposed hybrid approach for the LoD2 3D city model reconstruction from the LiDAR data was tested in the CBD of the city of Indianapolis, USA. A total of 519 buildings, including tall commercial buildings and residential buildings with different roof shapes, were reconstructed (Figure 11a). Figure 11b illustrates the vector polygons representing 3D building models overlaid with the high-resolution orthophotos in the downtown area. It is clear that much more detailed information for buildings can be presented compared to the LoD1 model, which has no roof structures.
A total of seven representative buildings were selected to evaluate the robustness of the proposed method, as Figure 12 shows, and all of these buildings have the irregular-tiled roof structures. Some roofs are composed of tiled, flat and shed-shaped structures. Results in Figure 12b proved that the proposed method can generate accurate building models as the 2D red wireframes projected from the 3D models at the correct positions and matched well with the corresponding ridges or step edges on the high resolution orthophoto. The 3D model for each roof plane was reconstructed by extruding the outlines of the plane according to parameters calculated from LiDAR, which has been mentioned in the Methodology section. The 3D visualization of the reconstructed LoD2 models for seven representative buildings are shown in Figure 12, with different colors representing individual planes. Figure 13 shows the 3D model reconstructed for commercial buildings with complicated roofs in Downtown Indianapolis, USA. As Figure 13a indicated, step edges with dramatic height changes on roofs can be identified, and substructures located in the same building footprint, but with different height values, can be successfully identified. The 3D city model can be stored in the GIS database format with attributes stored in the attached fields for future GIS applications.

3.2. Accuracy Assessment

Two evaluation metrics were used to evaluate the quality of reconstruction based on the high resolution orthophotos: the object-level evaluation metrics provided in [51] and the metrics used in [46] were used to assess the quality of the roof ridges detected for tiled roofs.
For the object-level evaluation, the parameters of completeness, correctness and quality were used. According to [52], completeness and correctness can be calculated as follows:
Completeness   =   T P T P + F N
Correctness   =   T P T P + F P
where TP (True Positive) is the number of objects detected as building planes, and they were also building planes located in the same location in reference data. FP (False Positive), which is also called the error of commission, is the number of roof planes not contained in the reference data, but were produced in the segmentation. FN (False Negative), also called the error of omission, is the number of roof planes in the reference data that were not successfully detected. The quality metric provided in [51], which is much stricter than completeness and correctness, was also used and can be calculated as follows:
Quality   =   T P T P + F N + F P
In this study, if undersegmentation error occurs as one reconstructed roof plane corresponds to multiple reference roof planes, only the largest reference plane was taken as TP, and all others were taken as FNs; if oversegmentation error occurs as multiple reconstructed roof planes correspond to one reference roof plane, only the largest reconstructed plane was taken as TP, and all others were taken as TPs.
Table 6 presents the result of the accuracy assessment for the 3D reconstruction of seven representative buildings in Figure 12 and all buildings included in Figure 13 as a test site. The overall reconstruction quality for seven representative buildings is 87.4%, with 146 out of 167 planes being correctly reconstructed, and for five buildings, we achieved 100% of the correctness measure, which proved the robustness of the proposed method. It is worth noting that many rectangular-shaped pyramid roofs can be successfully detected and reconstructed even though they are mixed with other types of roofs in the same footprint. The refinement based on predefined roof types for rectangular-shaped roofs ensures that all of the ridges needed for reconstruction can be included. However, only 69.5% of the completeness measure was achieved for the third building in Figure 12(3a–3c), because the edge lines between two pairs of planes on the west side of the roof cannot be detected during the edge-detection process. Although in the high-resolution orthophoto, there are clear boundaries between those two pairs of planes, in LiDAR data, no dramatic height change can be found. In the fifth building in Figure 12, the glass plane has a convex curved surface in the middle, which leads to the oversegmentation problem in the reconstructed planes. This was due to the fact that the LiDAR nDSM on this plane contains much noise, which caused the algorithm to detect some false edges. For commercial buildings in Figure 13, a segmentation qualify of 79.4% was reached, with 120 of 151 roof planes successfully reconstructed. Although only a few tiled structures were presented, they were mixed with flat and shed structures that have different heights, making the reconstruction difficult. The undersegmentation problem was caused by the spatial resolution of LiDAR nDSM (0.91 m), which cannot represent avery small roof plane. On the other hand, objects like dormers, air conditions or pipelines on the roof can also cause the false planes to be detected by the high resolution orthophotos. A ridge-based metrics, which was utilized in [46,52], was also used to assess the ridge detection accuracy for seven representative irregular-shaped tiled roof buildings. This metric is based on the roof topology graph (RTG), which mainly considers the existing ridges between planes [52], and a detected ridge can only be taken as TP when two corresponding reference planes and the reference ridge all exist [52]. Table 7 indicates that the proposed method is reliable for ridge detection in the irregular-tiled roofs, as 93.3% detection quality was achieved.

4. Discussion

This section discusses a comparison between the proposed approach and previously published work based on the precision of reconstruction results and the applicability of the methodology. First of all, compared with other existing hybrid approaches discussed above [41,42,43,44,45], the proposed hybrid approach can reconstruct very complicated buildings, such as those having irregular footprints and roof structures with flat, shed and tiled sub-structures mixed together (Building 4–7 in Figure 12). Roof structures with a round-shaped footprint can also be identified by the MBC threshold after edge-based segmentation, which is also not considered in those existing hybrid approaches. This is due to the advantages of our multi-stage strategy, which combined multiple methods together and successfully extracted key features, such as step-edges and ridges, at the same time as developing the accurate LoD2 model. The other strength of the proposed approach is it developed a more reliable ridge detection method by combining the ridge detected in LiDAR nDSM and high-resolution orthophoto together, as well as using pre-defined roof types as a reference to regulate and refine the detection.
Our approach has a higher degree of applicability and acceptable reconstruction accuracy compared to the studies that use the high-resolution LiDAR point cloud data. For example, Fan et al. [45] achieved a 95.4% completeness for the reconstruction of seven buildings by utilizing high density LiDAR point clouds (6–9 pts/m2). However, as they stated in the conclusion, the limitation of their method is that it has a strict requirement for the density of LiDAR point clouds; otherwise, it may fail. The moderate resolution (0.91 m) LiDAR nDSM, high resolution orthophotos and 2D building footprints used in our study are easier to obtain and require less memory to process compared to the high-density LiDAR point clouds when reconstructing buildings in larger areas. Our approach also does not require computationally-intensive algorithms, and our GIS-based outputs are readily used for future applications in the GIS environment. Compared to previous studies using LiDAR nDSM to reconstruct 3D building roofs [38,39,40,41], our approach shows the obvious advantage of robustness.
It has also been found out that appropriate use of multiple data sources worked better than using a single data source. In this research, high resolution orthophotos and building footprints were used as ancillary data sources, which enhanced the reconstruction result. The building footprints defined the boundaries of a building, and they were used to filter out the non-building features. The orthophotos were helpful in ridge detection. The overlay of ridge-pixel extraction results from the orthophotos and LiDAR data enhanced the result.

5. Conclusions

We proposed a hybrid approach, which is capable of reconstructing complicated building roof structures in large areas with high accuracy, but without requiring high-density point clouds and computationally-intensive algorithms. A GIS-based 3D city model at theLoD2 level of detail, which contains 519 buildings in Downtown Indianapolis, IN, USA, had been established and is ready to be used for future applications. According to the accuracy assessment, the reconstruction achieved 90.6% completeness and 96% correctness for seven testing buildings whose roofs are mixed by different shapes of structures, proving the robustness of the proposed method. Moreover, 86.3% of completeness and 90.9% of correctness were achieved for 38 commercial buildings in the downtown area, which indicated that the proposed method has the ability for large area building reconstruction.
The major contribution of this paper is that it designed an efficient method to reconstruct complicated buildings, such as those that have irregular footprints and roof structures with flat, shed and tiled sub-structures mixed together based on data that are free to the public and easier to obtain. It overcomes the limitation that building reconstruction using the downscaled LiDAR nDSM cannot be based on the precise horizontal ridge locations by adopting a novel ridge detection method, which combines the advantages from multiple detectors and obtains the prior knowledge from roof type determination. This concept of using the roof type determination, which is a model-driven-based technique, as prior knowledge to refine the data-driven segmentation result also is barely mentioned in the previous literature works. The ridge detection achieved 93.3%detection quality for seven tested complicated buildings. This research also proved that reconstructing 3D buildings based on downscaled LiDAR nDSM (0.91 m) can produce better results than previous studies that assemble predefined symmetry tiled roof models to form a complex structure using a good compilation of techniques. It is also worth mentioning that our workflow avoided many calculation redundancies, as the multi-stage strategy grouped the building segments into different categories at each step. It was only conducted for the corresponding algorithm for particular categories when needed, which reduced a large amount of computations compared to the point-wise or pixel-wise computation algorithms in the previous research.
Overall, this study proposed an alternative way to reconstruct 3D building models, which is suitable for large area reconstruction and for areas that do not have high resolution LiDAR point cloud data. Limitations remain in the following aspects. First of all, tall trees shading over 50% of the roof face can cause noisy aspect values for the pixels within that building footprint, which would lead to error during roof type determination. Future studies can use high resolution imagery, such as IKONOS data, to create the NDVI layer and set up the thresholds to identify these buildings before data processing. Moreover, the proposed method may fail to detect the boundaries between two planes, which is neither the step edge nor ridge. For example, the small roof structure attached to the left edge of the building in Figure 12(2b) cannot be detected and causes the undersegmentation error.

Acknowledgments

We acknowledge Jim Stout, the former Program Manager of Indianapolis Mapping and Geographic Infrastructure System for providing Terrestrial LiDAR data. Comments and suggestions from three anonymous reviewers improved the manuscript.

Author Contributions

Yuanfan Zheng and Qihao Weng designed the research. Yuanfan Zheng performed the data processing, and Qihao Weng supervised the research. Yuanfan Zheng wrote the first draft of manuscript, and Qihao Weng revised and edited the manuscript. Yaoxing Zheng provided some literature references and helped the submission of the manuscript.

Conflicts of Interest

The authors declare no conflict of interest.

References

  1. Henn, A.; Groger, G.; Stroh, V.; Plumer, L. Model driven reconstruction of roofs from sparse LiDAR point clouds. ISPRS J. Photogramm. Remote Sens. 2012, 76, 17–29. [Google Scholar] [CrossRef]
  2. Zheng, Y.; Weng, Q. Model-driven reconstruction of 3-D buildings using LiDAR data. IEEE Geosci. Remote Sens. Lett. 2015, 12, 1541–1545. [Google Scholar] [CrossRef]
  3. Kolbe, T.H.; Groeger, G.; Pluemer, L. Citygml interoperable access to 3D city models. In Proceedings of the International Symposium on Geo-information for Disaster Management, Delft, The Netherlands, 21–23 March 2005. [Google Scholar]
  4. Arefi, H.; Engels, J.; Hahn, M.; Mayer, H. Levels of Detail in 3D building Reconstruction from LiDAR data. Int. Arch. Photogramm. Remote Sens. Spat. Inf. Sci. 2008, 37, 485–490. [Google Scholar]
  5. Zhu, L.; Lehtomaki, M.; Hyyppa, J.; Puttonen, E.; Krooks, A.; Hyyppa, H. Automated 3D reconstruction from open geospatial data sources: Airborne laser scanning and a 2D topographic database. Remote Sens. 2015, 7, 6710–6740. [Google Scholar] [CrossRef]
  6. Haala, N.; Brenner, C.; Anders, K.H. 3D urban GIS from laser altimeter and 2D map data. Int. Arch. Photogramm. Remote Sens. Spat. Inf. Sci. 1998, 32, 339–346. [Google Scholar]
  7. Alharthy, A.; Bethel, J. Detailed building reconstruction from airborne laser data using a moving surface method. In Proceedings of the XXth Workshop of ISPRS. Geo-Imagery Bridging Continents, Istanbul, Turkey, 12–23 July 2004. [Google Scholar]
  8. Sampath, A.; Shan, J. Segmentation and reconstruction of polyhedral building roofs from aerial point clouds. IEEE Trans. Geosci. Remote Sens. 2010, 48, 1554–1567. [Google Scholar] [CrossRef]
  9. Cord, M.; Declercq, D. Baysian model identification: Application to building reconstruction in aerial imagery. In Proceedings of the Image Processing, International Conference on Image Processing (ICP’99), Kobe, Japan, 24–28 October 1999. [Google Scholar]
  10. Ghaffarian, S.; Ghaffarian, S. Automatic building detection based on purposive FastICA (PFICA) algorithm using monocular high resolution Google Earth images. ISPRS J. Photogramm. Remote Sens. 2014, 97, 152–159. [Google Scholar] [CrossRef]
  11. Manno-Kovacs, A.; Sziranyi, T. Orientation-selective building detection in aerial images. ISPRS J. Photogramm. Remote Sens. 2015, 108, 94–112. [Google Scholar] [CrossRef]
  12. Sumer, E.; Turker, M. An adaptive fuzzy-genetic algorithm approach for building detection using high-resolution satellite images. Comput. Environ. Urban Syst. 2013, 39, 48–62. [Google Scholar] [CrossRef]
  13. Tao, T.A. Parametric reconstruction for complex building from LiDAR and vector maps using a divide-and-conquer strategy. Int. Arch. Photogramm. Remote Sens. Spat. Inf. Sci. 2008, XXXVII, 133–138. [Google Scholar]
  14. Haala, N.; Brenner, C. Interpretation of urban surface models using 2D building information. Comput. Vis. Image Underst. 1998, 72, 204–214. [Google Scholar] [CrossRef]
  15. Awrangjeb, M.; Ravanbakhsh, M.; Fraser, C. Automatic detection of residential buildings using LiDAR data and multispectral imagery. ISPRS J. Photogramm. Remote Sens. 2010, 65, 457–467. [Google Scholar] [CrossRef]
  16. Baillard, C.; Maiter, H. 3-D reconstruction of urban scenes from aerial stereo imagery: A focusing strategy. Comput. Vis. Image Underst. 1999, 76, 244–258. [Google Scholar] [CrossRef]
  17. Rottensteiner, F.; Trinder, J.; Clode, S.; Kubik, K. Using the Dempster-Shafer method for the fusion of LIDAR data and multispectral images for building detection. Inf. Fusion 2005, 6, 283–300. [Google Scholar] [CrossRef]
  18. Yang, B.; Xu, W.; Dong, Z. Automated building outlines extraction from airborne laser scanning point clouds. IEEE Geosci. Remote Sens. Lett. 2013. [Google Scholar] [CrossRef]
  19. Dubois, C.; Thiele, A.; Hinz, S. Building detection and building parameter retrieval in InSAR phase images. ISPRS J. Photogramm. Remote Sens. 2016, 114, 228–241. [Google Scholar] [CrossRef]
  20. Khoshelham, K.; Li, Z.; King, B. A split-and-merge technique for automated reconstruction of roof planes. Photogramm. Eng. Remote Sens. 2005, 71, 855–862. [Google Scholar] [CrossRef]
  21. Rottensteiner, F.; Briese, C. Automatic generation of building models from LIDAR data and the integration of aerial images. In Proceedings of the ISPRS WG III/3 Workshop on 3-DReconstructionfrom Airborne Laser scanner and InSAR Data, Dresden, Germany, 8–10 October 2003. [Google Scholar]
  22. Ameri, B.; Fritsch, D. Automatic 3D Building Reconstruction Using Plane-Roof Structures; ASPRS: Washington, DC, USA, 2000. [Google Scholar]
  23. Tarsha-Kurdi, F.; Landes, T.; Grussenmeyer, P.; Koehl, M. Model-driven and data-driven approaches using LiDAR data: Analysis and comparison. Int. Arch. Photogramm. Remote Sens. Spat. Inf. Sci. 2007, 36, 87–92. [Google Scholar]
  24. Shan, J.; Sampath, A. Building Extraction from LiDAR Point Clouds Based on Clustering Techniques; Shan, J., Toth, C., Eds.; Topographic Laser Ranging and Scanning: Principles and Processing; CRC Press: Boca Raton, FL, USA, 2008. [Google Scholar]
  25. Wang, J.; Shan, J. Segmentation of LiDAR point clouds for building extraction. In Proceedings of the American Society for Photogrammetry and Remote Sensing (ASPRS) Annual Conference, Baltimore, MD, USA, 9–13 March 2009. [Google Scholar]
  26. Dorninger, P.; Pfeifer, N. A comprehensive automatic 3D approach for building extraction, reconstruction, and regularization from airborne laser scanning point clouds. Sensors 2008, 8, 7323–7343. [Google Scholar] [CrossRef] [PubMed]
  27. Habib, A.F.; Zhai, R.; Changjae, K. Generation of complex polyhedral building models by integrating stereo-aerial imagery and LiDAR data. Photogramm. Eng. Remote Sens. 2010, 76, 609–623. [Google Scholar] [CrossRef]
  28. Jochem, A.; Höfle, B.; Wichmann, V.; Rutzinger, M.; Zipf, A. Area-wide roof plane segmentation in airborne LiDAR point clouds. Comput. Environ. Urban Syst. 2012, 36, 54–64. [Google Scholar] [CrossRef]
  29. Awrangjeb, M.; Zhang, C.; Fraser, C. Automatic extraction of building roofs using LiDAR data and multispectral imagery. ISPRS J. Photogramm. Remote Sens. 2013, 83, 1–18. [Google Scholar] [CrossRef]
  30. Awrangjeb, M.; Fraser, C. Automatic segmentation of raw LiDAR data for extraction of building roofs. Remote Sens. 2014, 6, 3716–3751. [Google Scholar] [CrossRef]
  31. Schuffert, S. An automatic data driven approach to derive photovoltaic-suitable roof surfaces from ALS data. JURSE 2013. [Google Scholar] [CrossRef]
  32. Awrangjeb, M.; Zhang, C.; Fraser, C. Automatic extraction of building roofs through effective integration of LiDAR and multispectral imagery. In Proceedings of the ISPRS Annals of the Photogrammetry, Remote Sensing and Spatial Information Science, Melbourne, Australia, 25 August–1 September 2012. [Google Scholar]
  33. Haala, N.; Brenner, C. Virtual city model from laser altimeter and 2D map data. Photogramm. Eng. Remote Sens. 1999, 65, 787–795. [Google Scholar]
  34. Haala, N.; Becker, S.; Kada, M. Cell Decomposition for the Generation of Building Models at Multiple Scales; IAPRS: Dresden, Germany, 2006. [Google Scholar]
  35. Vosselman, G. Building reconstruction using planar faces in very high-density height data. Int. Arch. Photogramm. Remote Sens. Spat. Inf. Sci. 1999, 32, 87–94. [Google Scholar]
  36. Vosselman, G.; Dijkman, S. 3D building model reconstruction from point clouds and ground plans. Int. Arch. Photogramm. Remote Sens. Spat. Inf. Sci. 2001, 34, 37–44. [Google Scholar]
  37. Kada, M.; McKinley, L. 3D building reconstruction from LiDAR based on a cell decomposition approach. Int. Arch. Photogramm. Remote Sens. Spat. Inf. Sci. 2009, 38, 47–52. [Google Scholar]
  38. Lafarge, F.; Descombes, X.; Zerubia, J.; Deseilligny, M. Structural approach for building reconstruction from a single DSM. IEEE Trans. Pattern Anal. Mach. Intell. 2007, 6, 135–147. [Google Scholar] [CrossRef] [PubMed]
  39. Huang, H.; Brenner, C.; Sester, M. A generative statistical approach to automatic 3D building roof reconstruction from laser scanning data. ISPRS J. Photogramm. Remote Sens. 2013, 79, 29–43. [Google Scholar] [CrossRef]
  40. Arefi, H.; Hahn, M.; Reinartz, P. Ridge Based Decompositon of Complex Buildings for 3D Model Generation from High Resolution Digital Surface Models. In Proceedings of the ISPRS Istanbul Workshop 2010 Modeling of Optical airborne and spaceborne Sensors, Istanbul, Turkey, 11–13 October 2010. [Google Scholar]
  41. Arefi, H.; Reinartz, P. Building Reconstruction Using DSM and Orthorectified Images. Remote Sens. 2013, 5, 1681–1703. [Google Scholar] [CrossRef]
  42. Wang, H.; Zhang, W.; Chen, Y.; Chen, M.; Yan, K. Semantic decomposition and reconstruction of compound buildings with symmetric roofs from LiDAR data and aerial imagery. Remote Sens. 2015, 7, 13945–13974. [Google Scholar] [CrossRef]
  43. Kwak, E.; Habib, A. Automatic representation and reconstruction of DBM from LiDAR data using Recursive Minimum Bounding Rectangle. ISPRS J. Photogramm. Remote Sens. 2014, 93, 171–191. [Google Scholar] [CrossRef]
  44. Tian, Y.; Gerke, M.; Vosselman, G.; Zhu, Q. Knowledge-based building reconstruction from terrestrial video sequences. ISPRS J. Photogramm. Remote Sens. 2010, 65, 395–408. [Google Scholar] [CrossRef]
  45. Fan, H.; Yao, W.; Fu, Q. Segmentation of Sloped Roofs from Airborne LiDAR point Clouds Using Ridge-based Hierarchical Decomposition. Remote Sens. 2014, 6, 3284–3301. [Google Scholar] [CrossRef]
  46. Xu, B.; Jiang, W.; Shan, J.; Zhang, J.; Li, L. Investigation on the weighted RANSAC approaches for building roof plane segmentation from LiDAR point clouds. Remote Sens. 2016. [Google Scholar] [CrossRef]
  47. Wang, Z. Manual versus Automated Line Generalization. Proceedings of GIS/LIS ’96, Denver, CO, USA, 4–6 November 1996. [Google Scholar]
  48. Brenner, C. Building reconstruction from images and laser scanning. Int. J. Appl. Earth Obs. Geoinform. 2005, 6, 187–198. [Google Scholar] [CrossRef]
  49. Jenson, S.K.; Domingue, J.O. Extracting topographic structure from digital elevation data for Geographic Information System analysis. Photogramm. Eng. Remote Sens. 1988, 54, 1593–1600. [Google Scholar]
  50. Strahler, A.N. Quantitative analysis of watershed geomorphology. Earth Space Sci. News 1957, 38, 831–1022. [Google Scholar] [CrossRef]
  51. Awrangjeb, M.; Fraser, C.S. An automatic and threshold-free performance evaluation system for building extraction techniques from airborne Lidar data. IEEE J. Sel. Top. Appl. Earth Obs. Remote Sens. 2014, 7, 4184–4198. [Google Scholar] [CrossRef]
  52. Heipke, C.; Mayer, H.; Wiedemann, C.; Jamet, O. Evaluation of Automatic Road Extraction. Int. Arch. Photogramm. Remote Sens. 1997, 32, 47–56. [Google Scholar]
Figure 1. Workflow of 3D building reconstruction.
Remotesensing 09 00310 g001
Figure 2. Location of Indianapolis, IN, USA, and the detail of its Central Business District (CBD).
Remotesensing 09 00310 g002
Figure 3. From left to right: step edge represented by red lines, building with the step edge in the high resolution orthophoto, decomposition without step edge detection and decomposition with step edge detection.
Remotesensing 09 00310 g003
Figure 4. An example of oversegmentation.
Remotesensing 09 00310 g004
Figure 5. Step edge detection and refinement. (a) LiDAR nDSM; (b) building footprint; (c) high resolution orthophoto; (d) edge detection from LiDAR nDSM; (e) initial edge-based roof segmentation result; (f) segmentation result after refinement; (g) final edge detection result back projected onto the corresponding high resolution orthophoto.
Remotesensing 09 00310 g005
Figure 6. Predefined 3D building library, from left to right: shed roof, flat roof, cross gable roof, pyramid roof, hipped roof, gable roof, intersecting roof, half-hipped roof, cone roof and cylinder roof.
Remotesensing 09 00310 g006
Figure 7. Candidate roof models for non-flat basic building cells: gable (a); cross-gable (b); hipped (c); half-hipped (d); pyramid (e); intersecting (f).
Remotesensing 09 00310 g007
Figure 8. Roof planes growing by merged pixels with the same orientation values together, overlaid with building sub-footprints (black lines).
Remotesensing 09 00310 g008
Figure 9. Ridge detection from LiDAR nDSM and high-resolution orthophotos. (a) High resolution orthophotos; (b) edge detection from high resolution orthophotos using the Canny edge detector; (c) ridge pixel identification using a watershed analysis algorithm from LiDAR nDSM; (d) ridge pixel identification using a stream order algorithm; (e) a combination of the ridge pixels detected using the watershed analysis algorithm and stream order algorithm; (f) remaining edge lines after a buffer filter and intersecting with potential ridge pixels detected from LiDAR nDSM; (g) remaining edge lines (blue line) after length and sinuosity thresholding; (h) straight line fitting for the remaining edge lines; (i) major ridge line identification (green line); (j) extended ridge lines after refinement; and (k) 2D planar patches created by ridge-based segmentation.
Remotesensing 09 00310 g009
Figure 10. Mask of the gutter roof height estimation (a) and mask of the top height estimation (b). L1 = 0.8 × X, L2 = 0.5 × X.
Remotesensing 09 00310 g010
Figure 11. (a) 3D city model in LoD2 for the City of Indianapolis, USA; (b) 3D building models overlaid with the high-resolution orthophotos.
Remotesensing 09 00310 g011
Figure 12. Experimental results of the proposed method for the seven selected buildings (1–7), from left to right: (a) high resolution orthophoto, (b) roof models (red wireframes) overlay with the orthophoto and (c) 3D visualization of the reconstructed LoD2 models.
Remotesensing 09 00310 g012aRemotesensing 09 00310 g012b
Figure 13. Experimental results of the proposed method for a test site in Downtown Indianapolis; (a) roof models (red wireframes) overlaid with the orthophoto and (b) 3D visualization of the reconstructed models.
Remotesensing 09 00310 g013
Table 1. Classification result of flat and non-flat roofs with the classification accuracy of 96%.
FlatNon-FlatTotal
Flat23513248
Non-flat22599611
Total257612869
Table 2. Recorded orientation values from calculated aspect values.
Aspect (Degree)OrientationRecoded Orientation Value
−1Up (Flat)0
0–22.5 or 337.5–360North1
22.5–67.5Northeast2
67.5–112.5East3
112.5–157.5Southeast4
157.5–202.5South5
202.5–247.5Southwest6
247.5–292.5West7
292.5–337.5Northwest8
Table 3. Rules for roof type determination for rectangular sub-footprints identified as tiled roofs.
Roof TypeRules
Gable roofhas two planes, and each plane contains more than 40% of the total pixels, two planes facing the opposite direction (difference of aspect value larger than 160 degree)
Half hipped roofhas three planes, and each plane contains more than 30% of the total pixels, two planes facing the opposite direction (difference of aspect value larger than 160 degree)
Pyramid roof/hipped roofhas four planes facing different directions, each plane contains more than 20% of the total pixels
Cross-gable roofs a connection part in T-shaped buildings, has five planes
Intersecting roofs has more than six planes, each plane contains more than 10% of the total pixels
Table 4. Rules for ridge pixel extraction from LiDAR nDSM.
RulesParametersThresholdNote
1HeightHeight value higher than other 80% of pixels within the same building cells
2AspectAspect index > 0.50Aspect index: difference between aspect value and aspect values filtered by a median filter
3SlopeSlope < 0.25
Table 5. List of the numbers of major/minor ridges lines supposed to be contained in each type of roof.
Number of Major Ridge LinesNumber of Minor Ridge Lines
Gable roof10
Half-hipped roof12
Hipped roof14
Pyramid roof04
Cross gable roof08
Intersecting roof13
Table 6. Accuracy assessment for 3D reconstruction of selected buildings.
BuildingTP PlanesFP PlanesFN PlanesCompleteness %Correctness %Quality %
1130192.810092.8
224019610096
3160769.510069.5
45011008383
5656395.591.587.8
6100283.310083.3
71300100100100
Total14661590.69687.4
Table 7. Accuracy assessment for ridge detection for seven representative buildings.
BuildingTP RidgesFP RidgesFN RidgesCompleteness %Correctness %Quality %
11601100100100
2142193.387.582.3
316048010080
4400100100100
54000100100100
6100100100100
7800100100100
Total992595.19893.3

