
Validation Analysis of SMAP and AMSR2 Soil Moisture Products over the United States Using Ground-Based Measurements


Abstract
:
1. Introduction
2. Datasets
2.1. Passive Microwave Soil Moisture Products
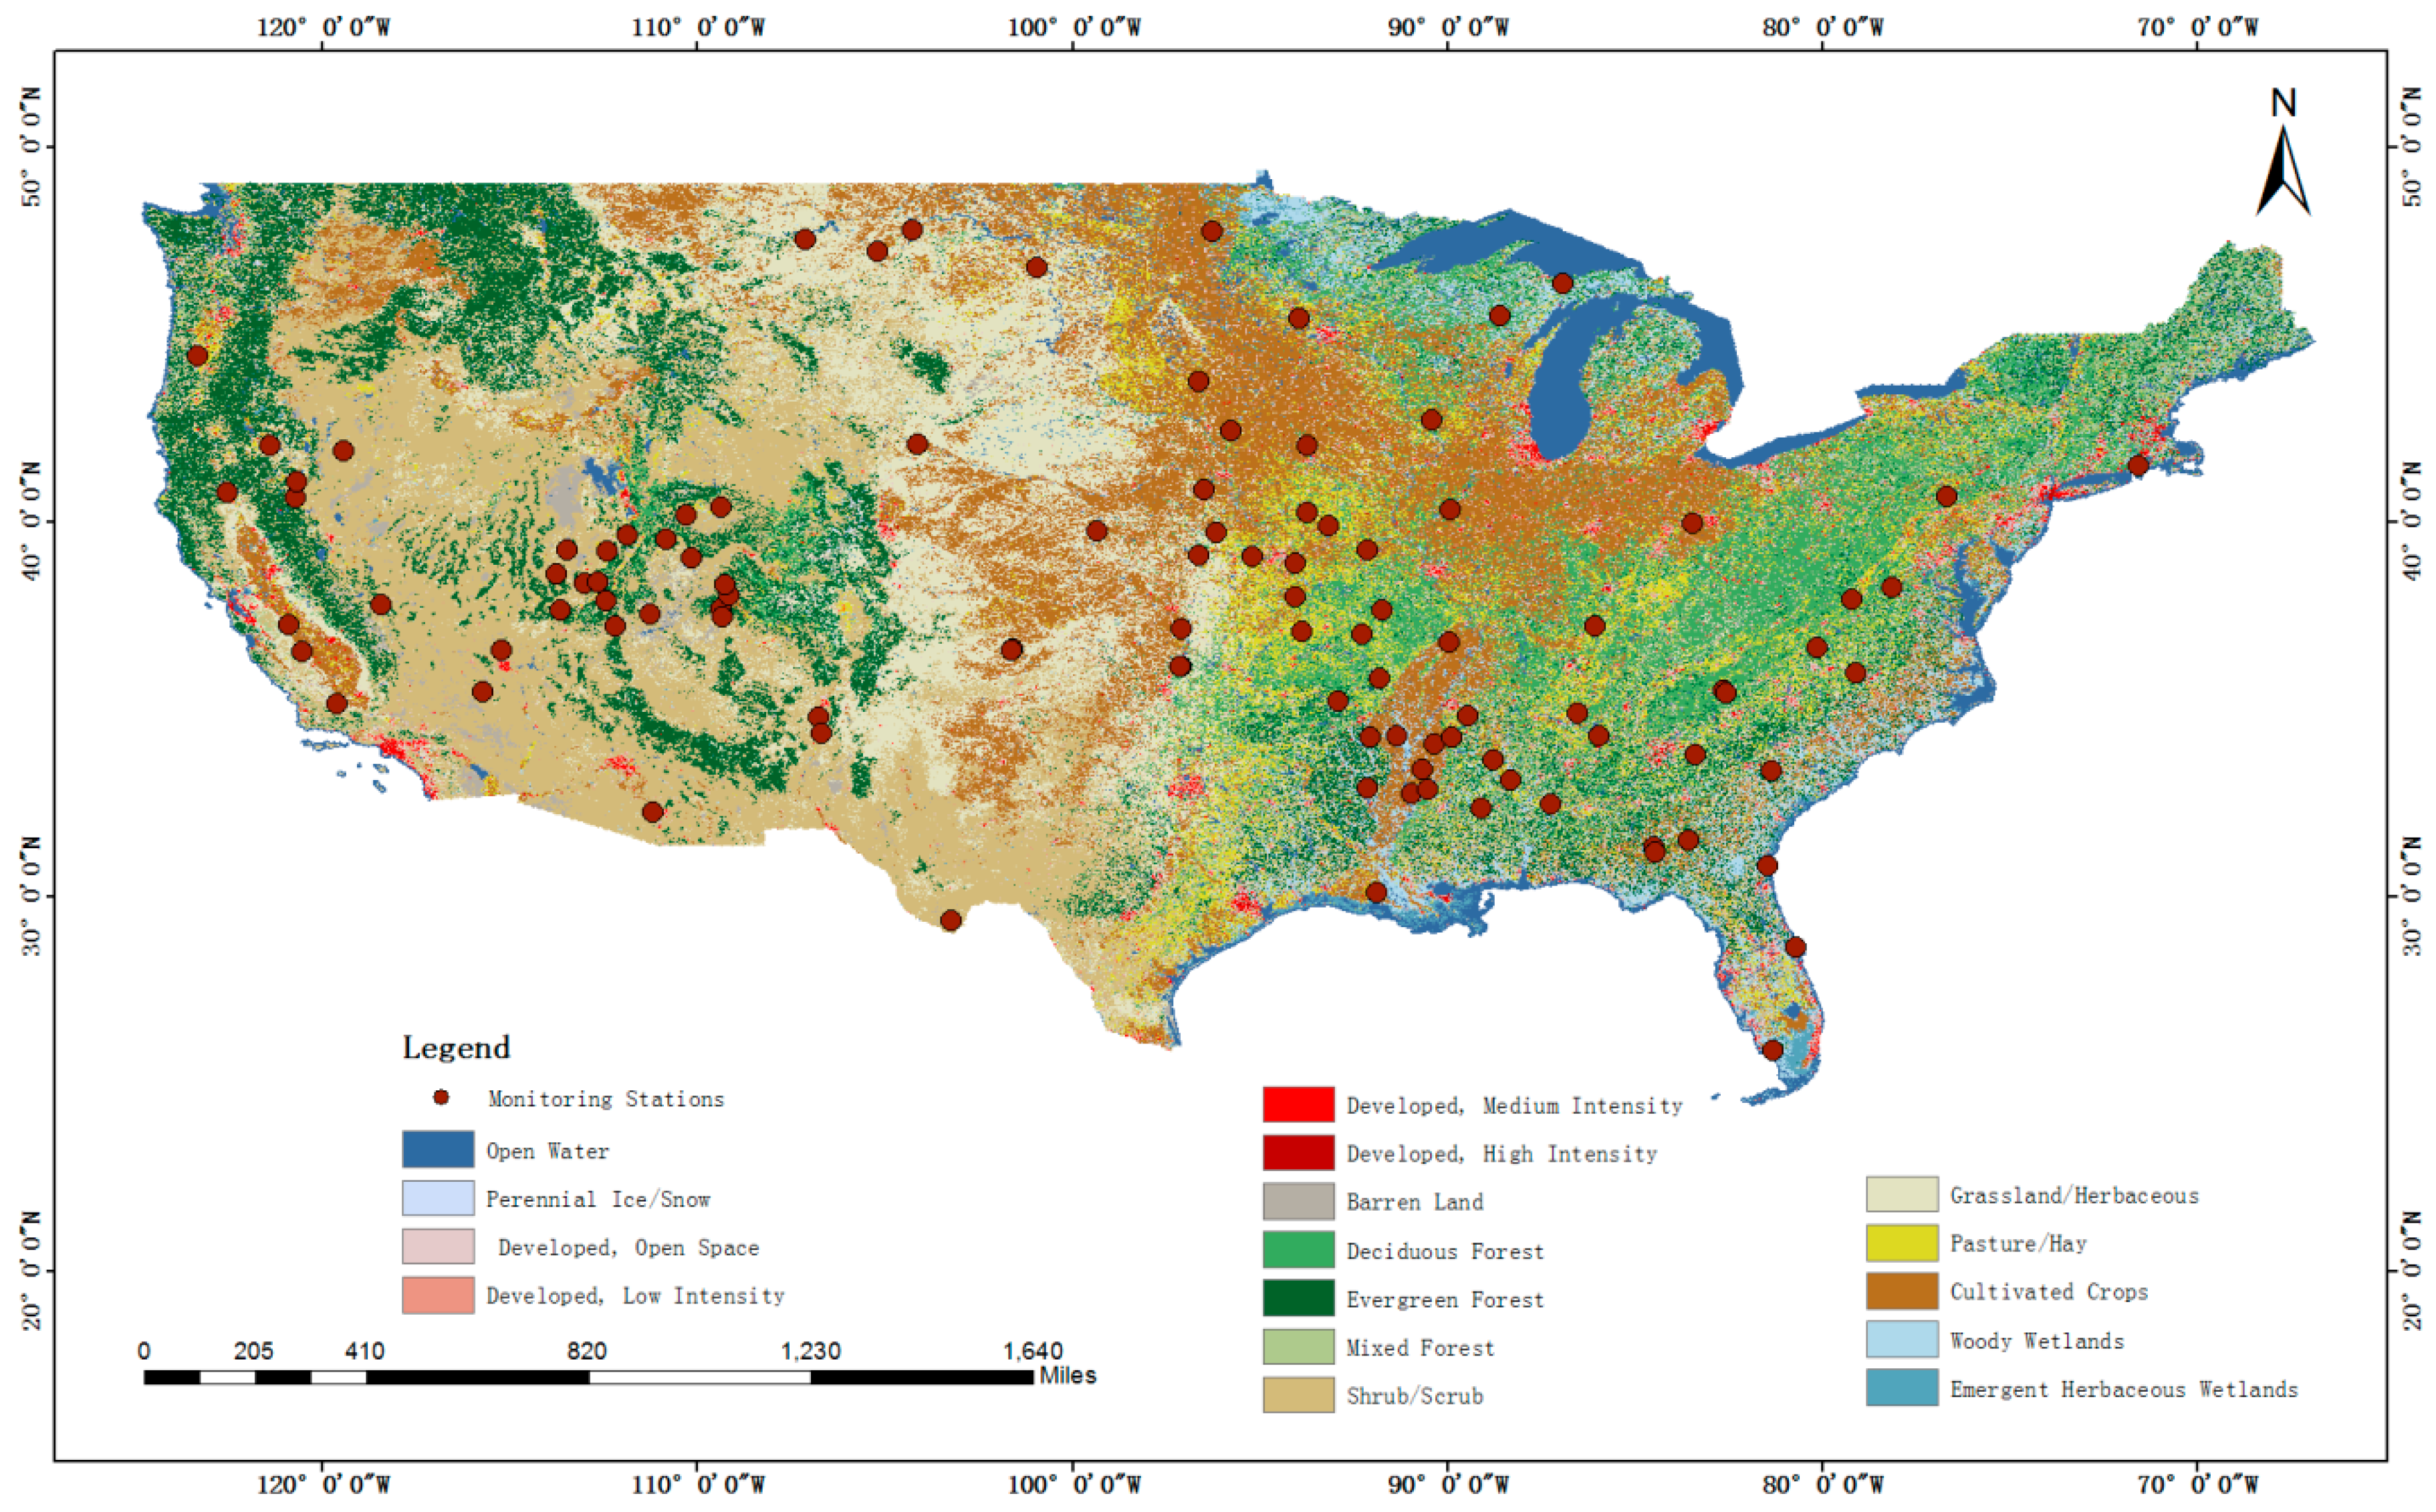
2.2. In Situ Soil Moisture Data
2.3. Land Cover Data
2.4. Ancillary Data
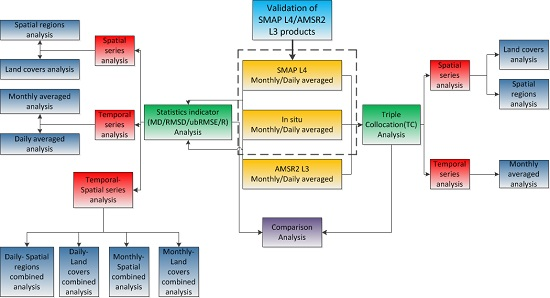
3. Methods
3.1. Four Statistics
3.2. The Triple Collocation Error Model
4. Results
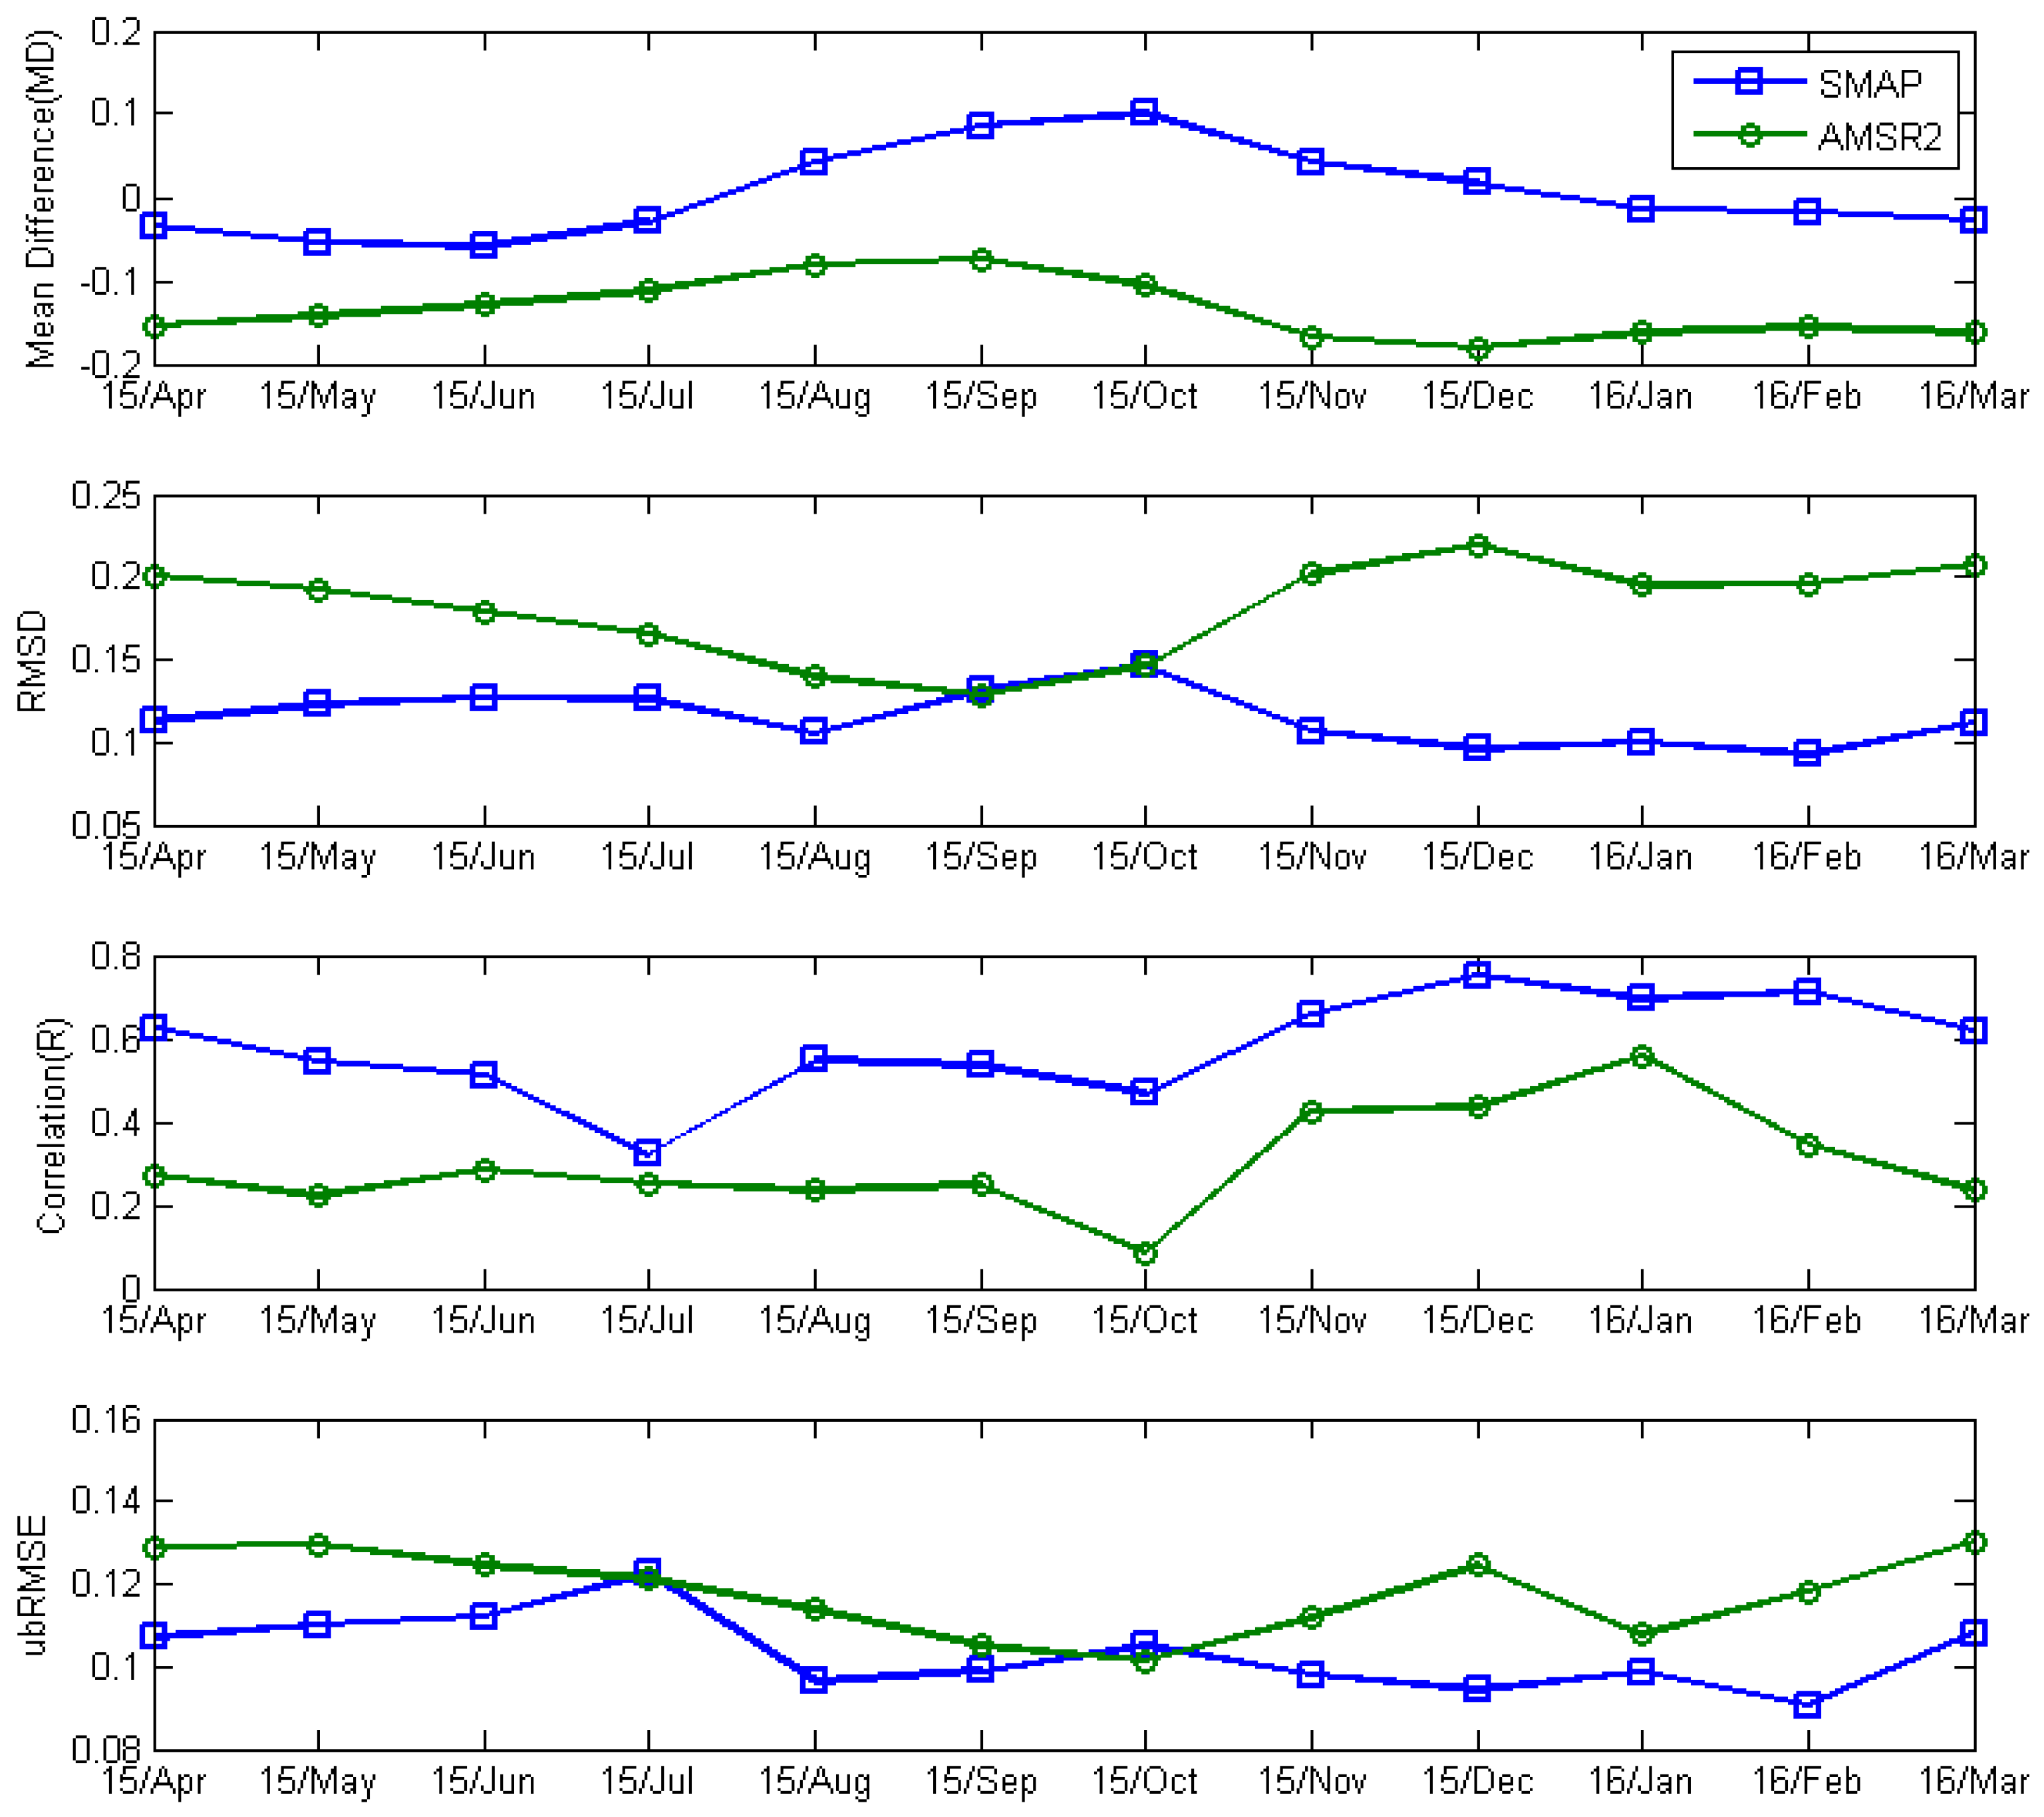
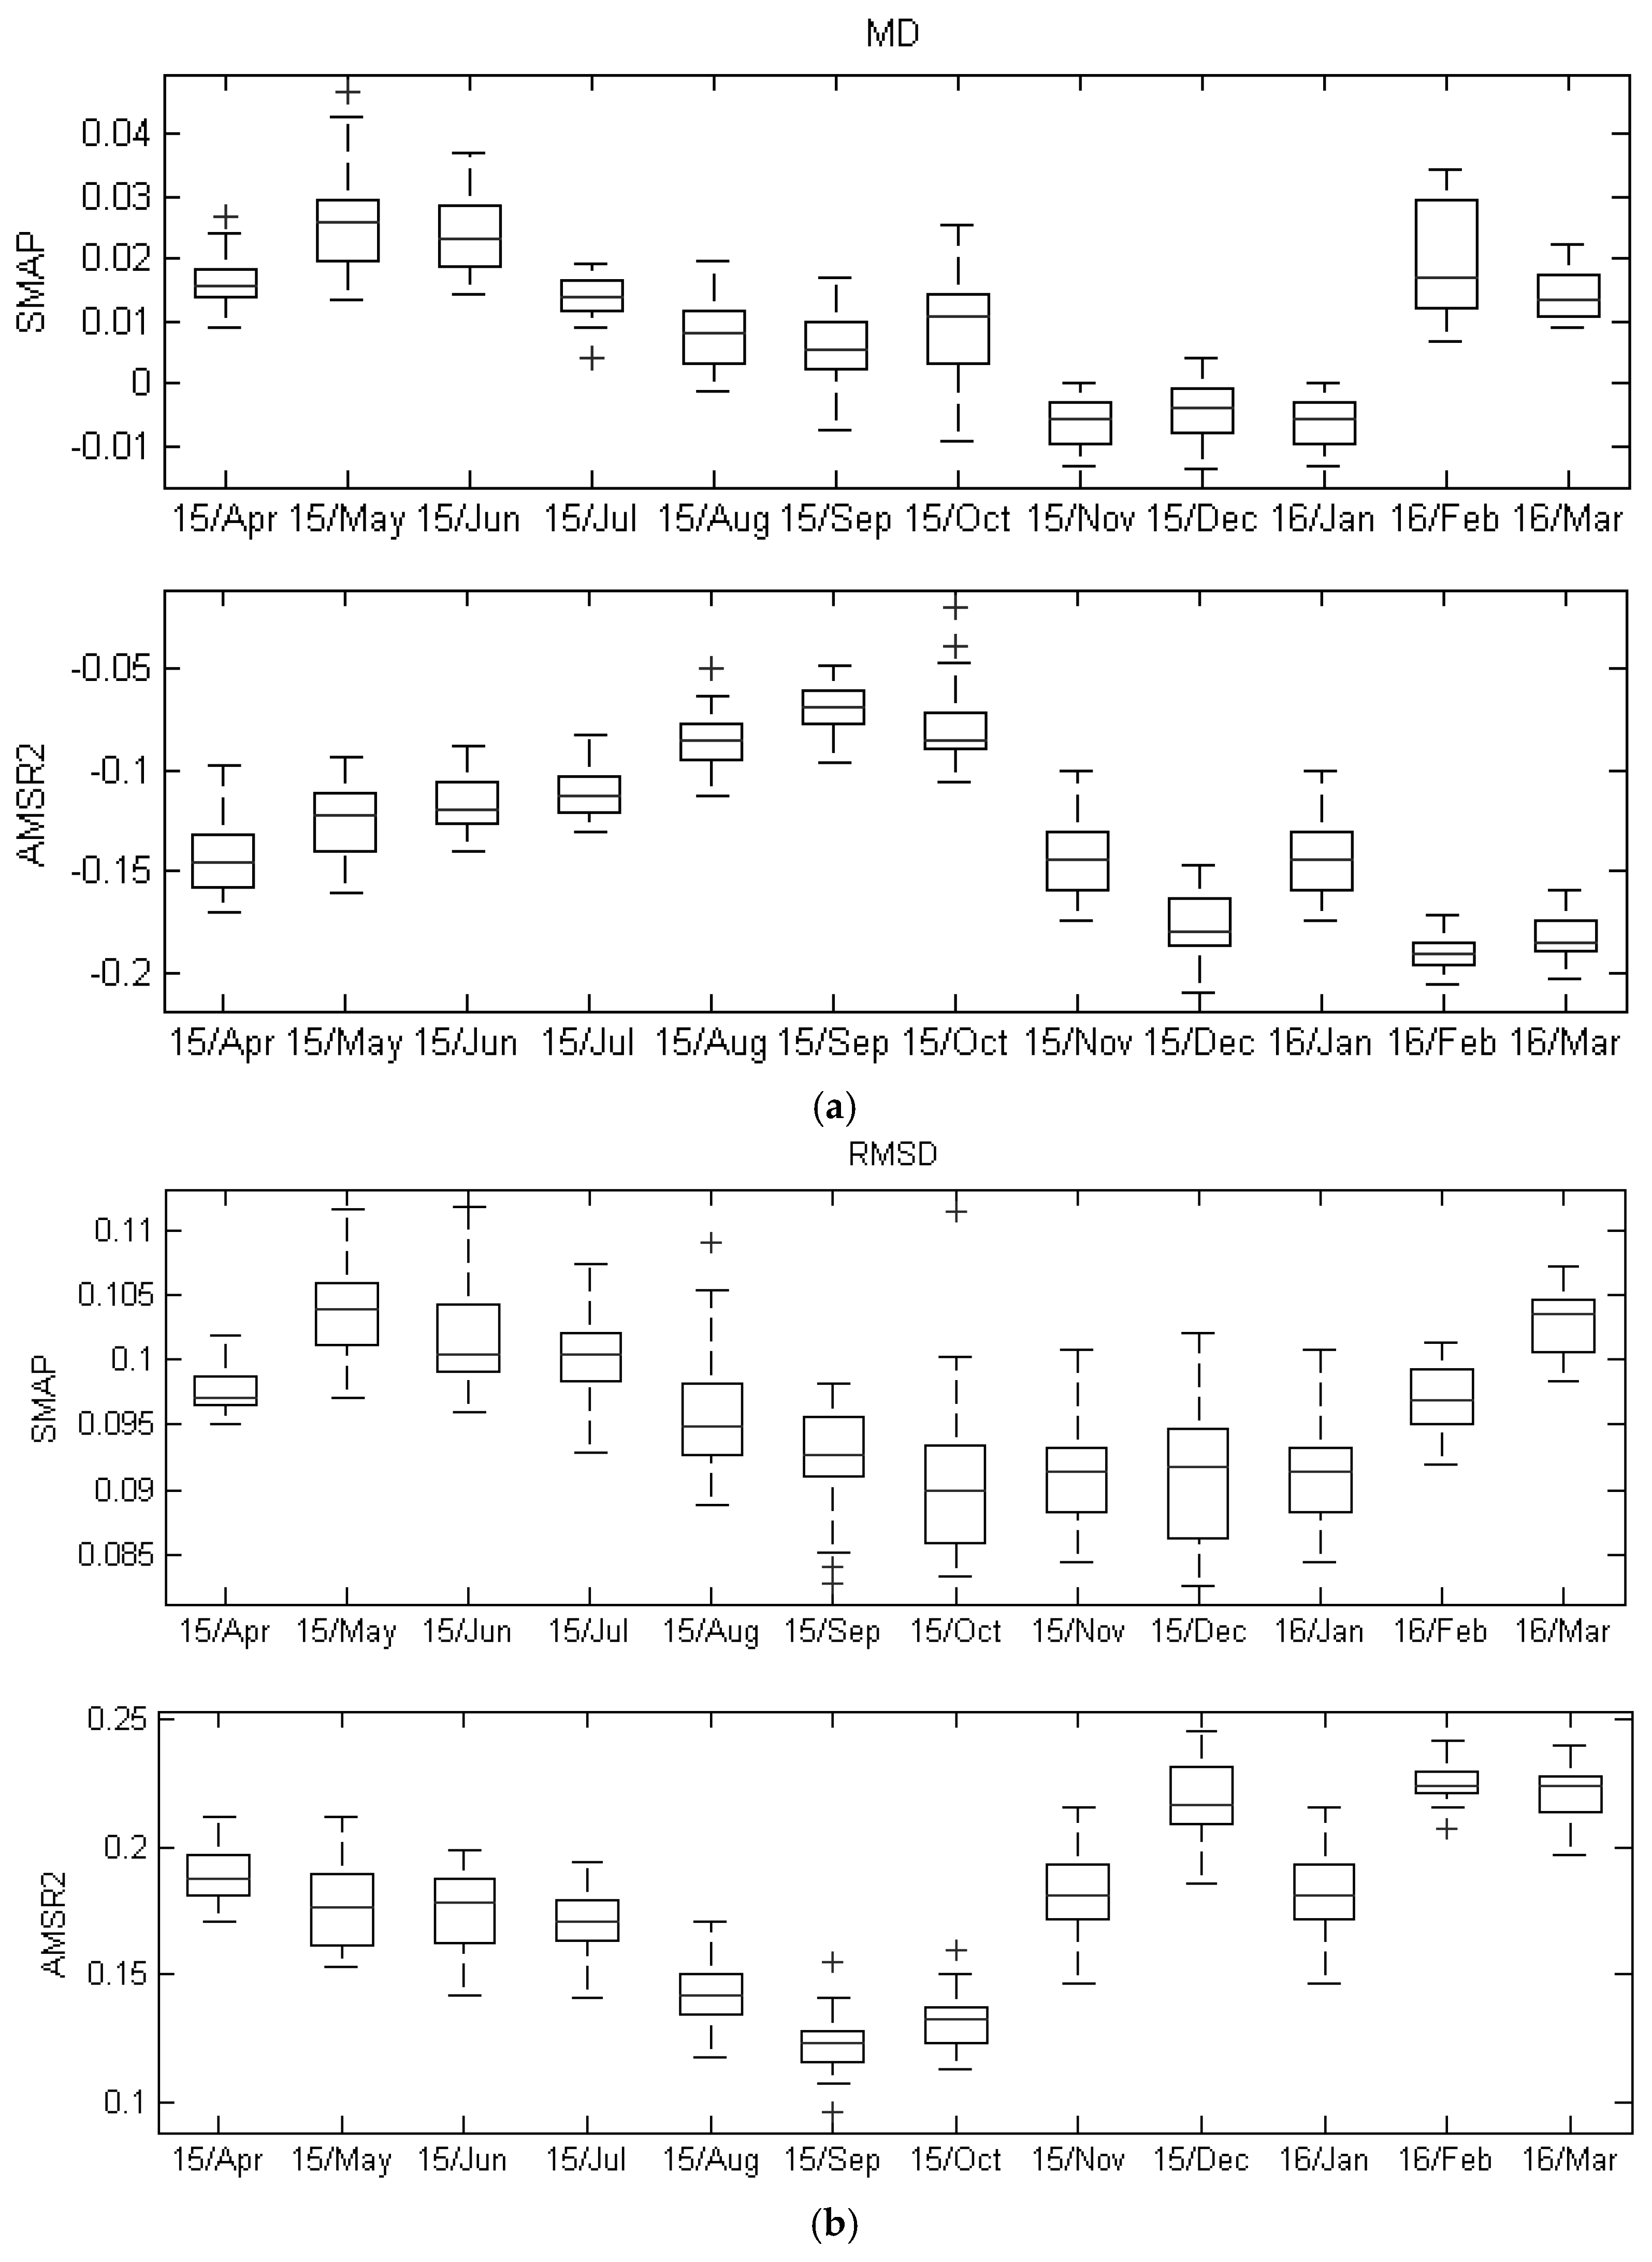
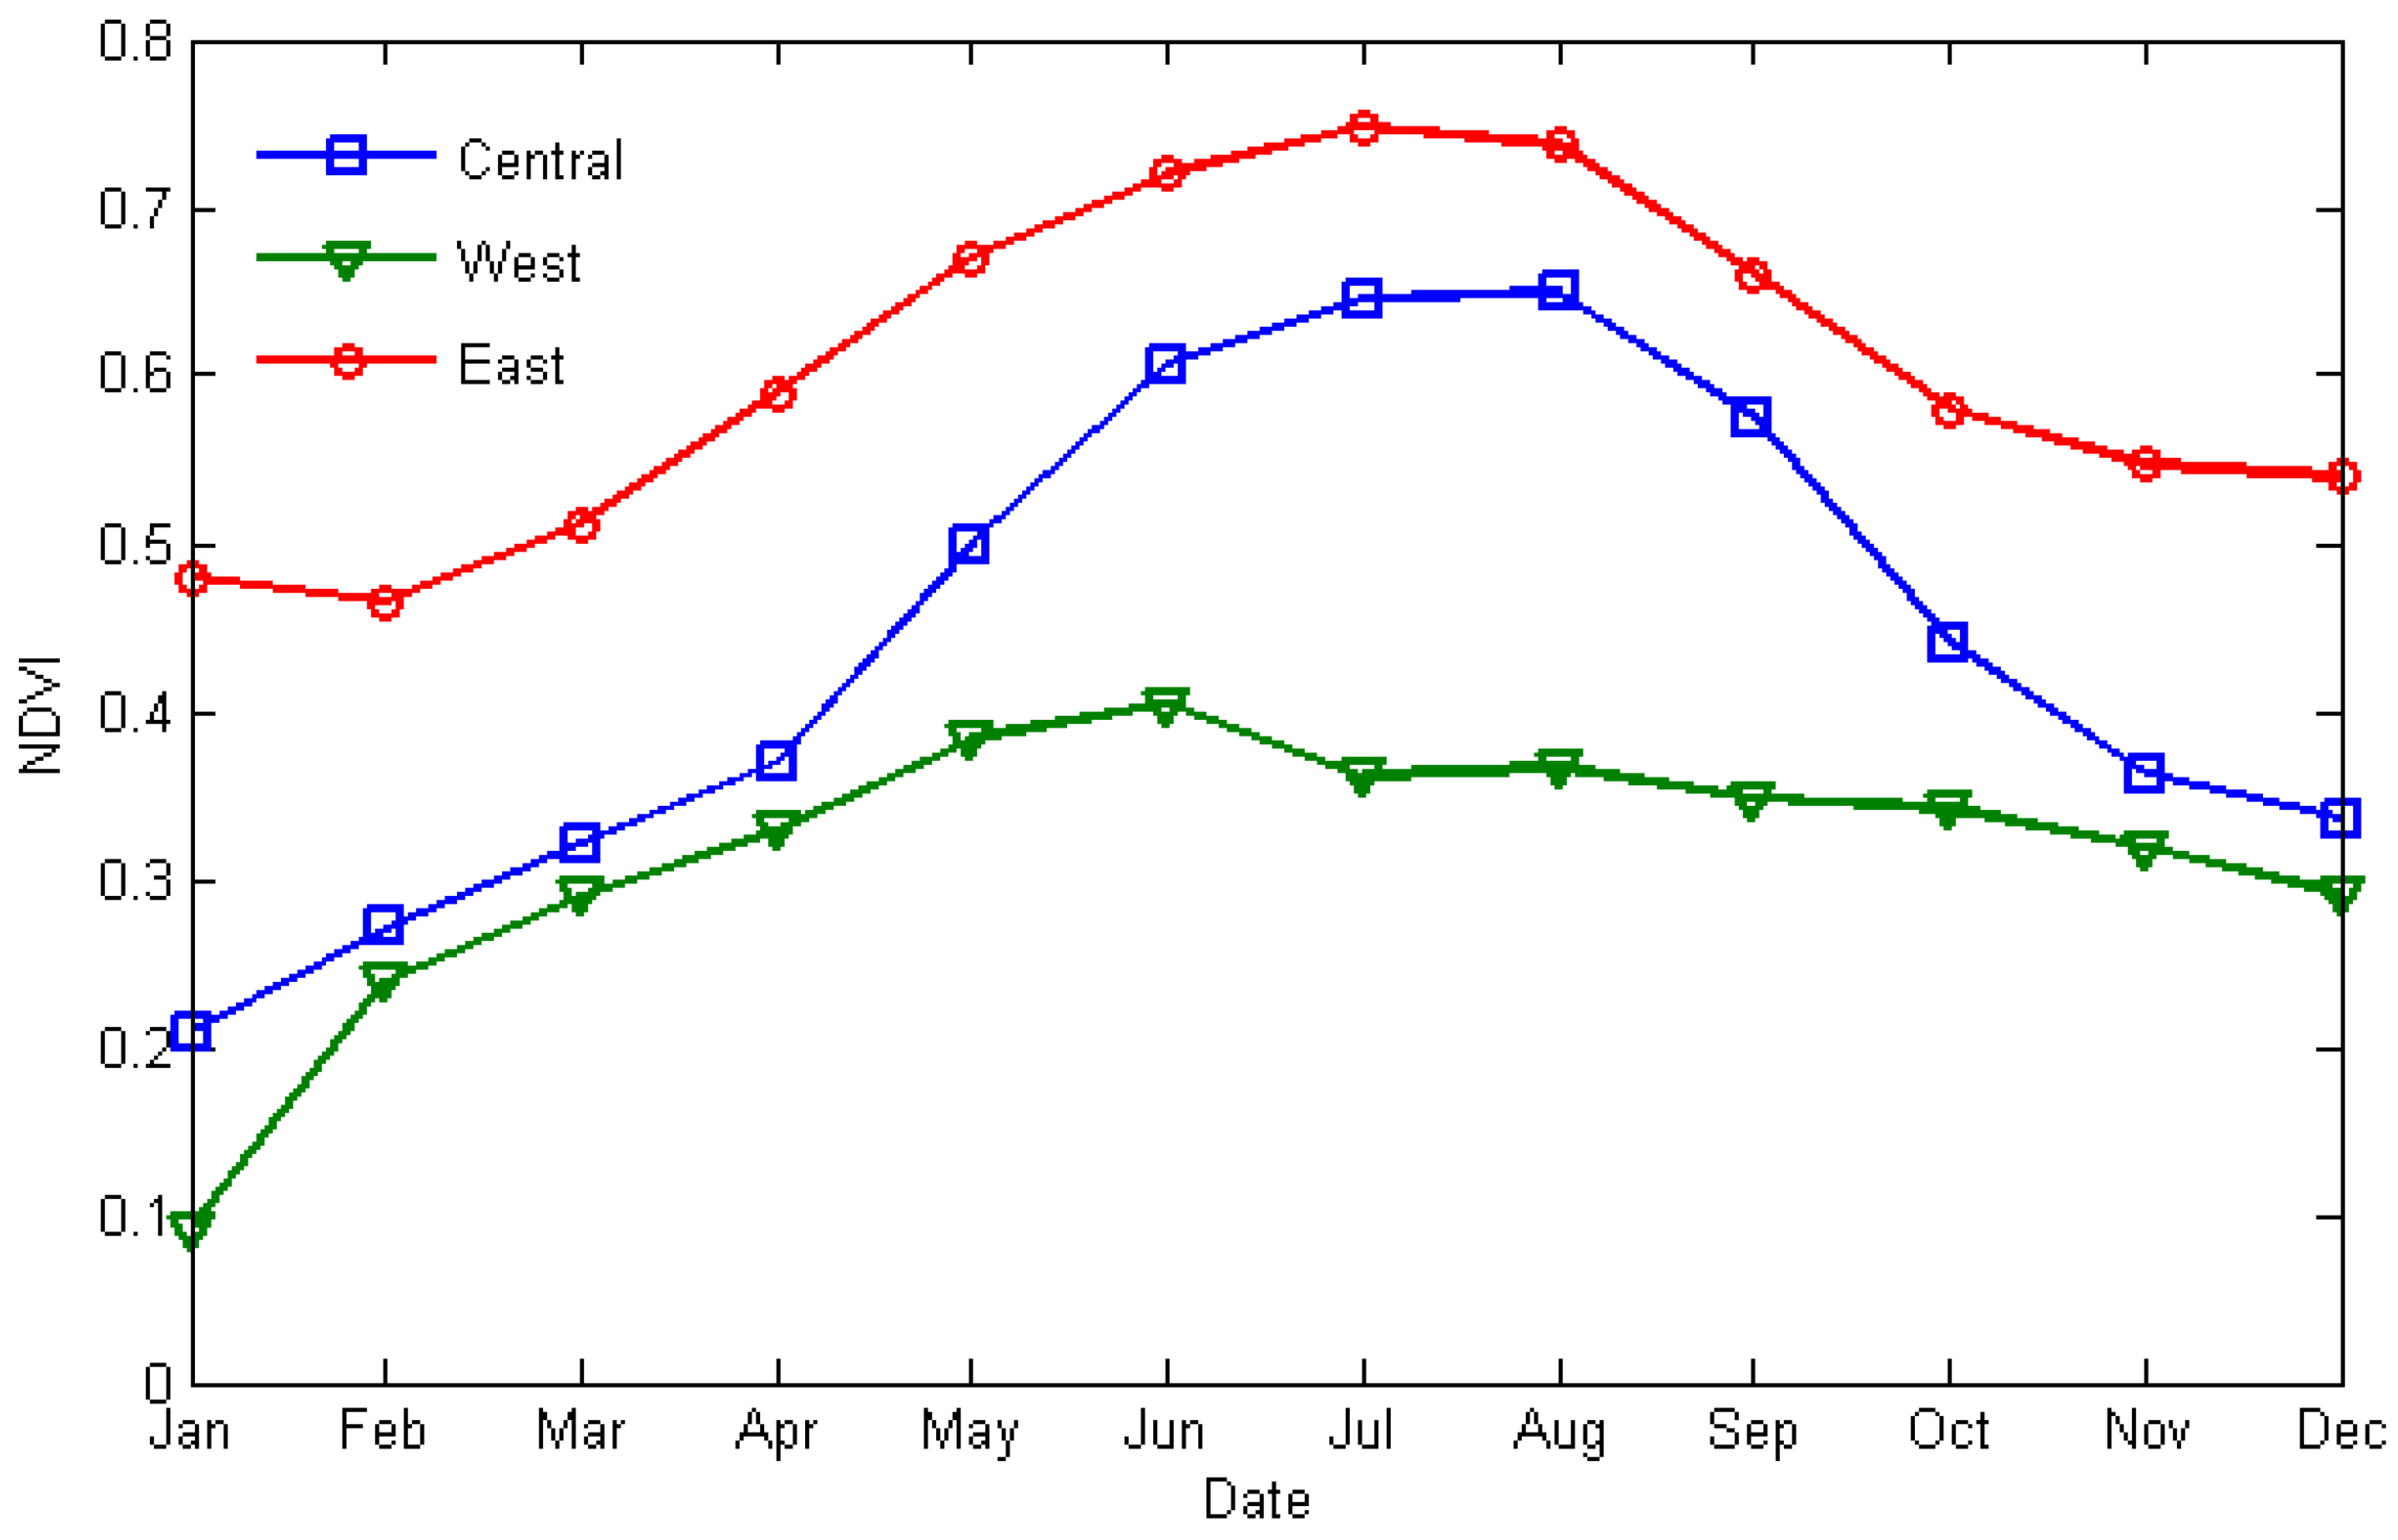
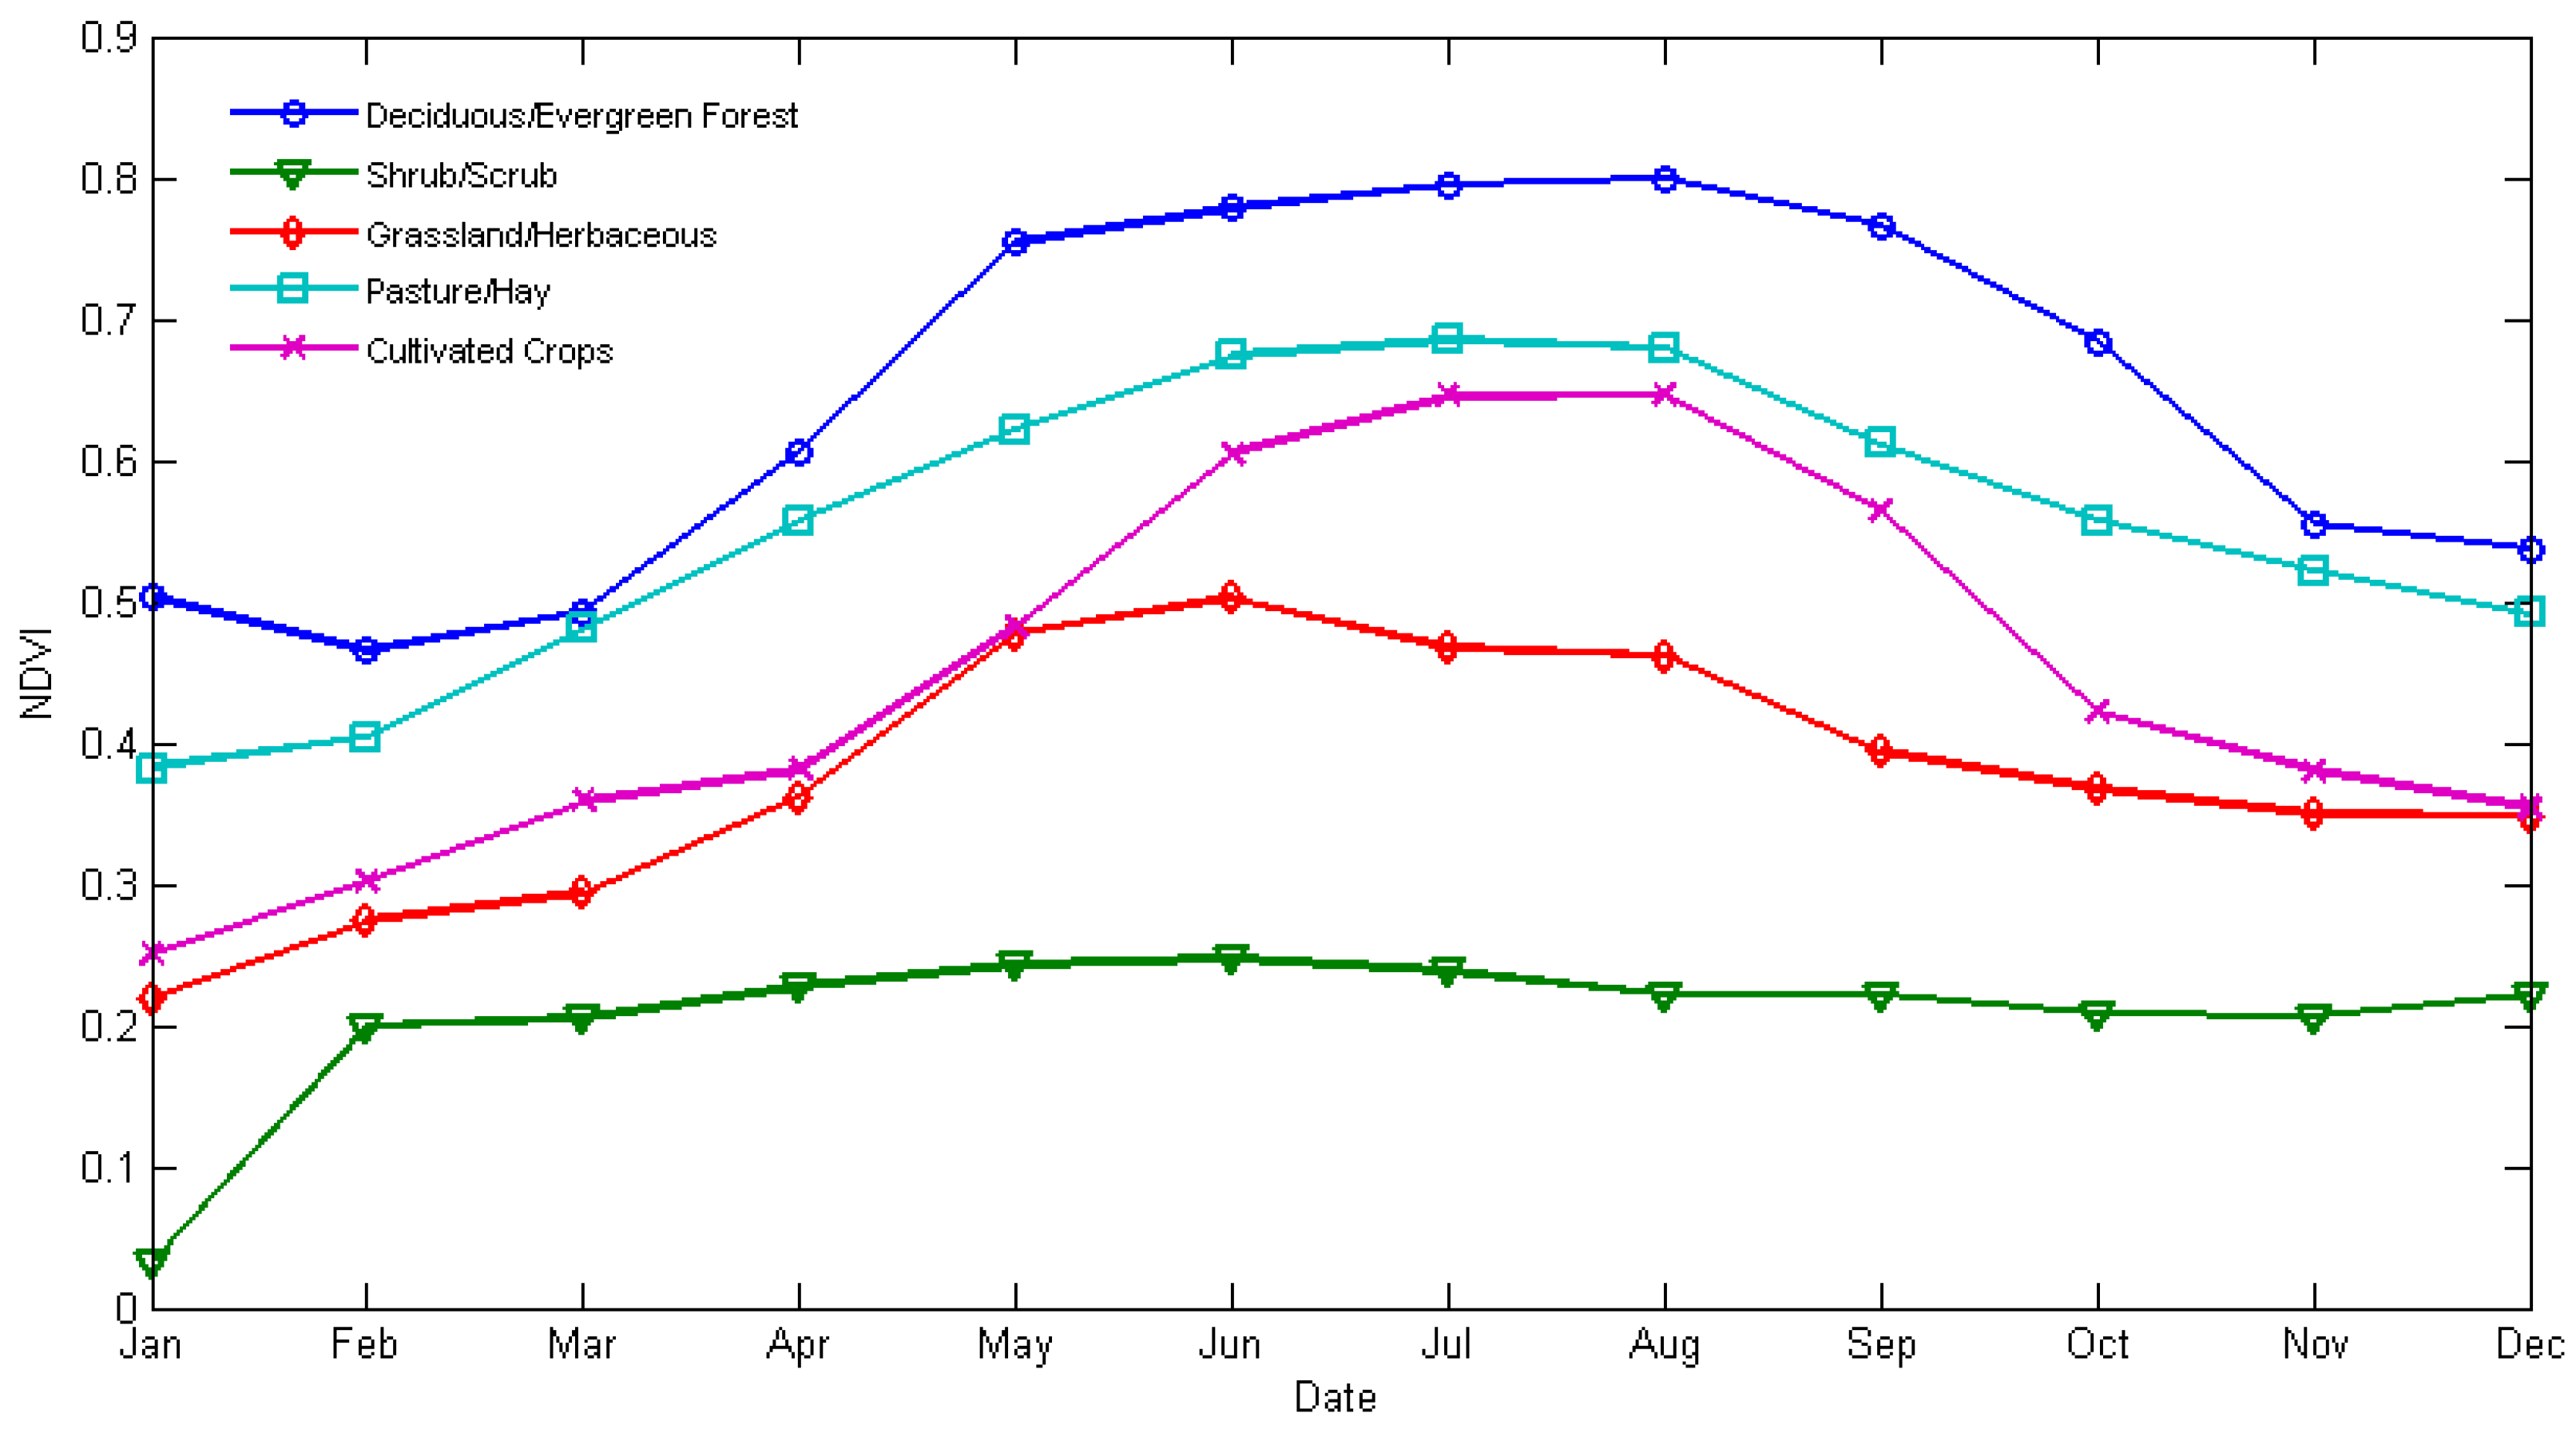
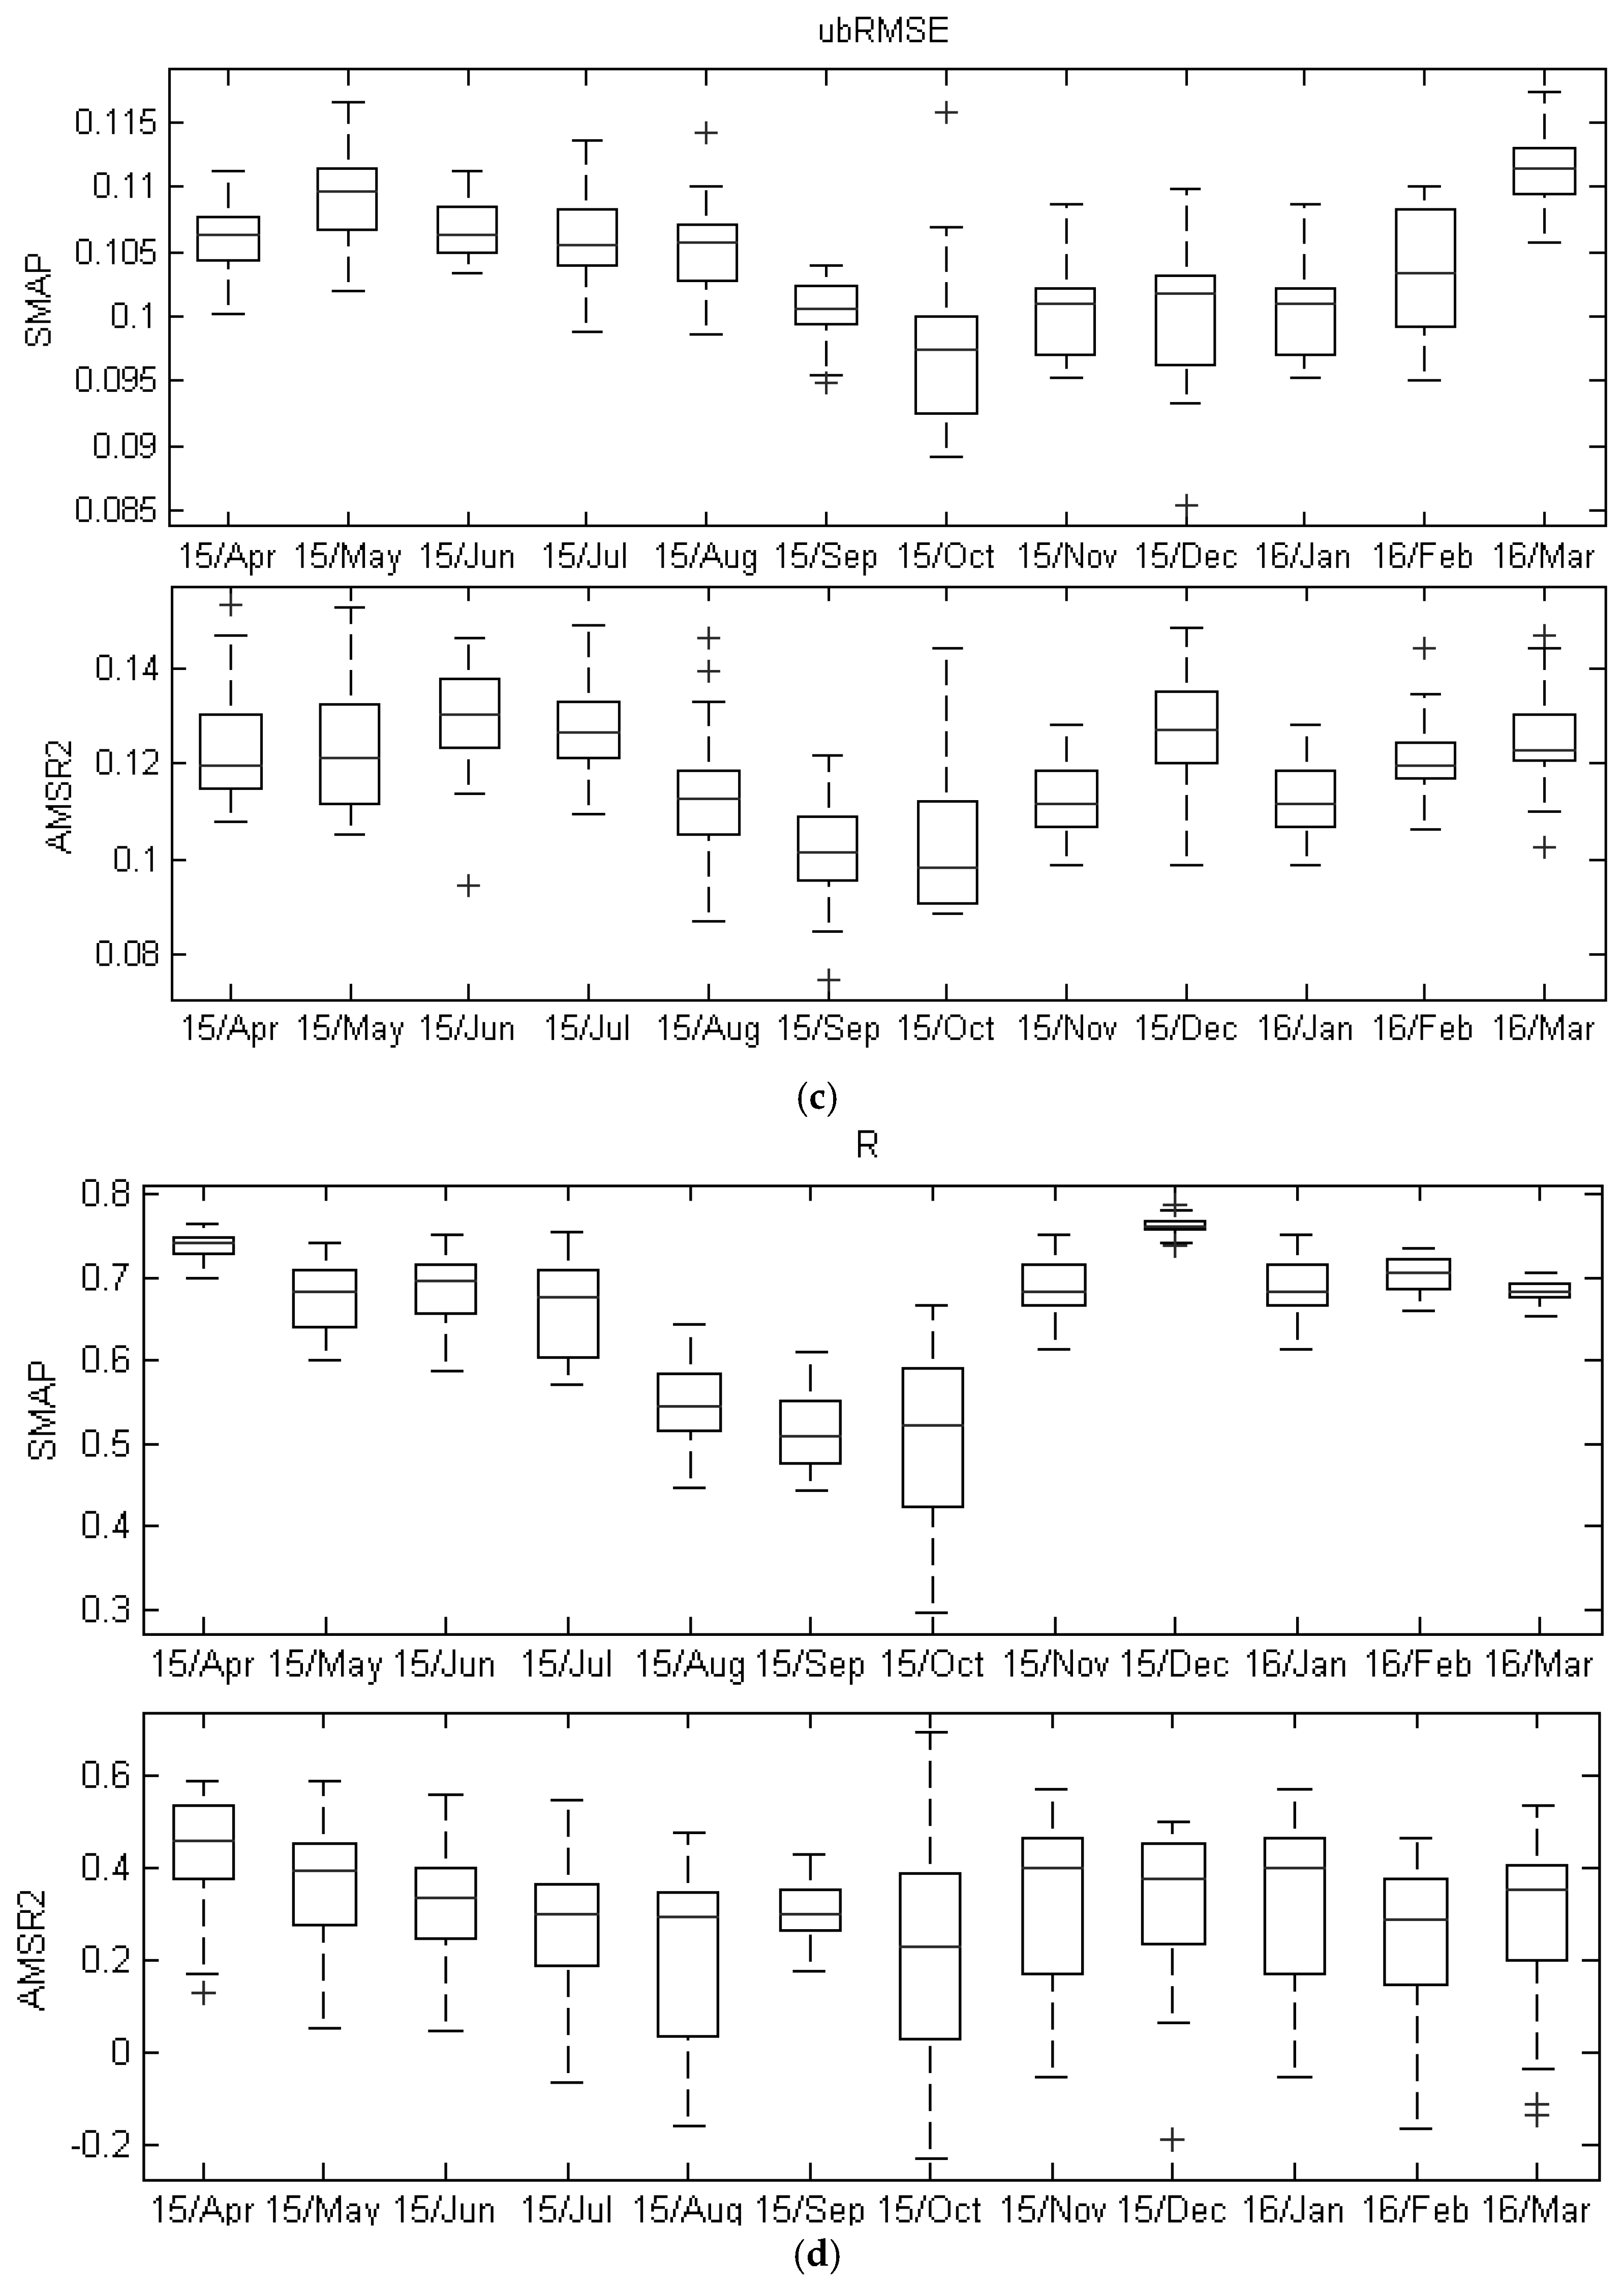
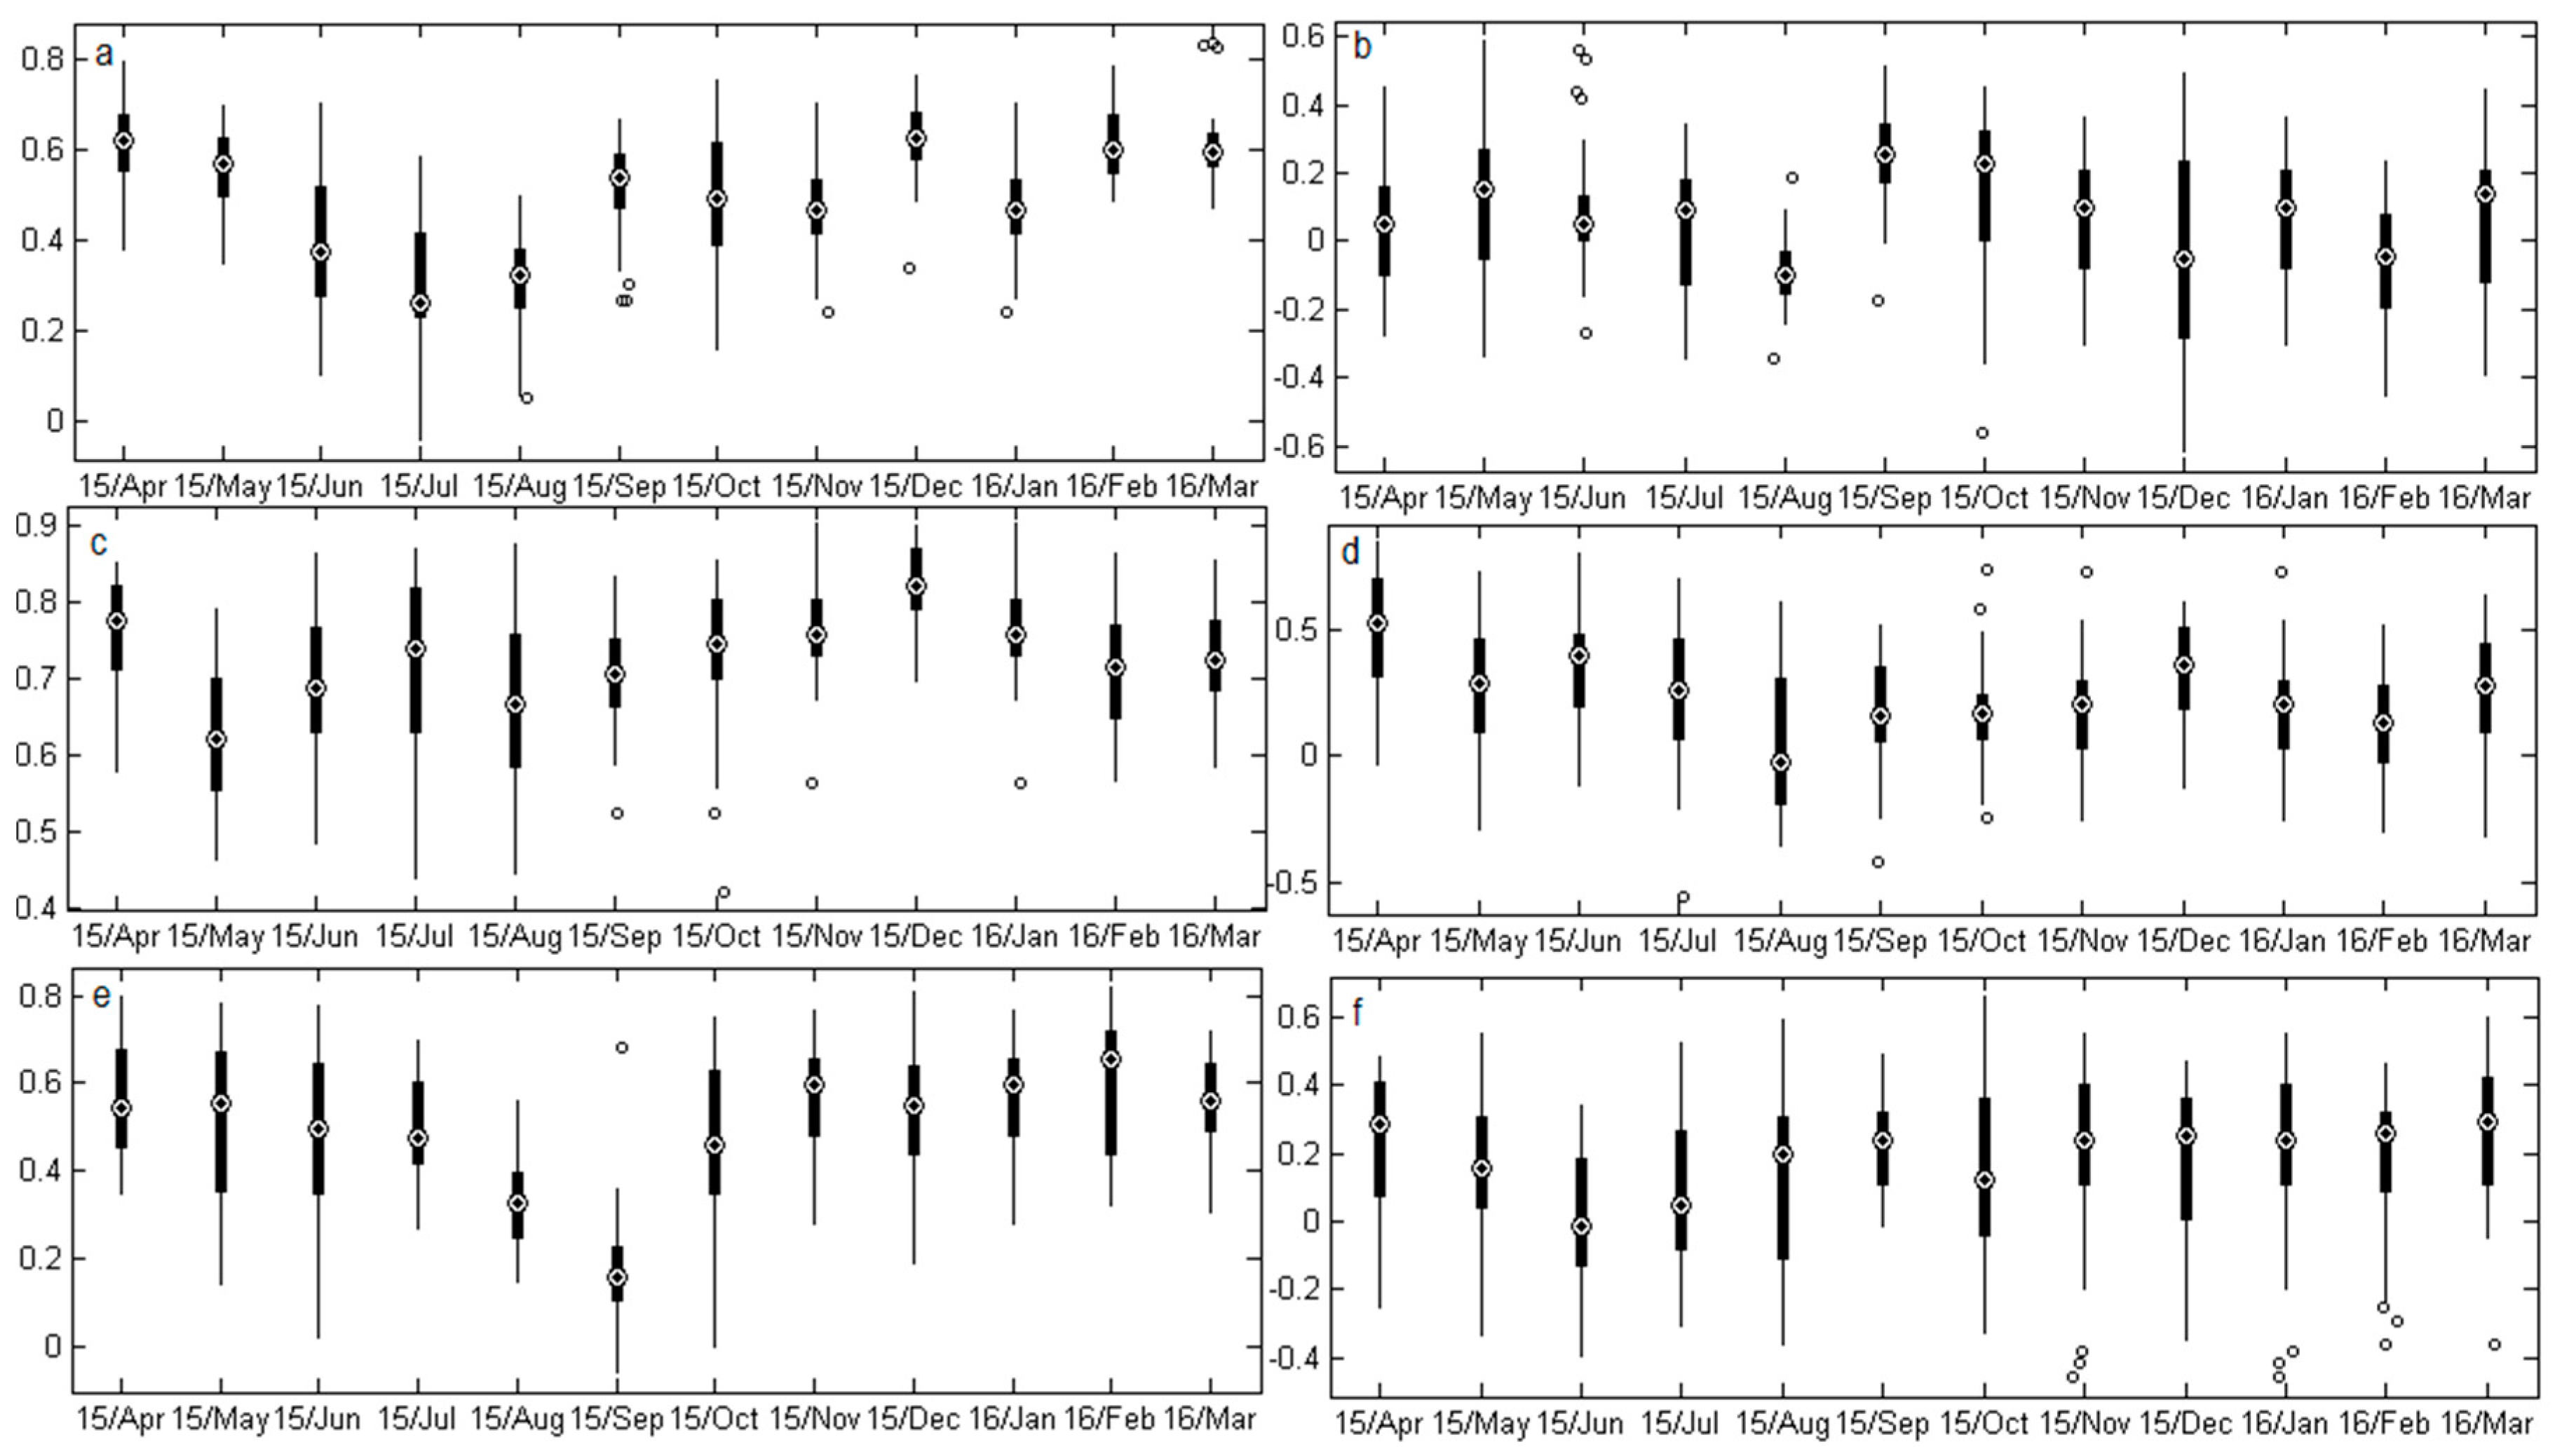
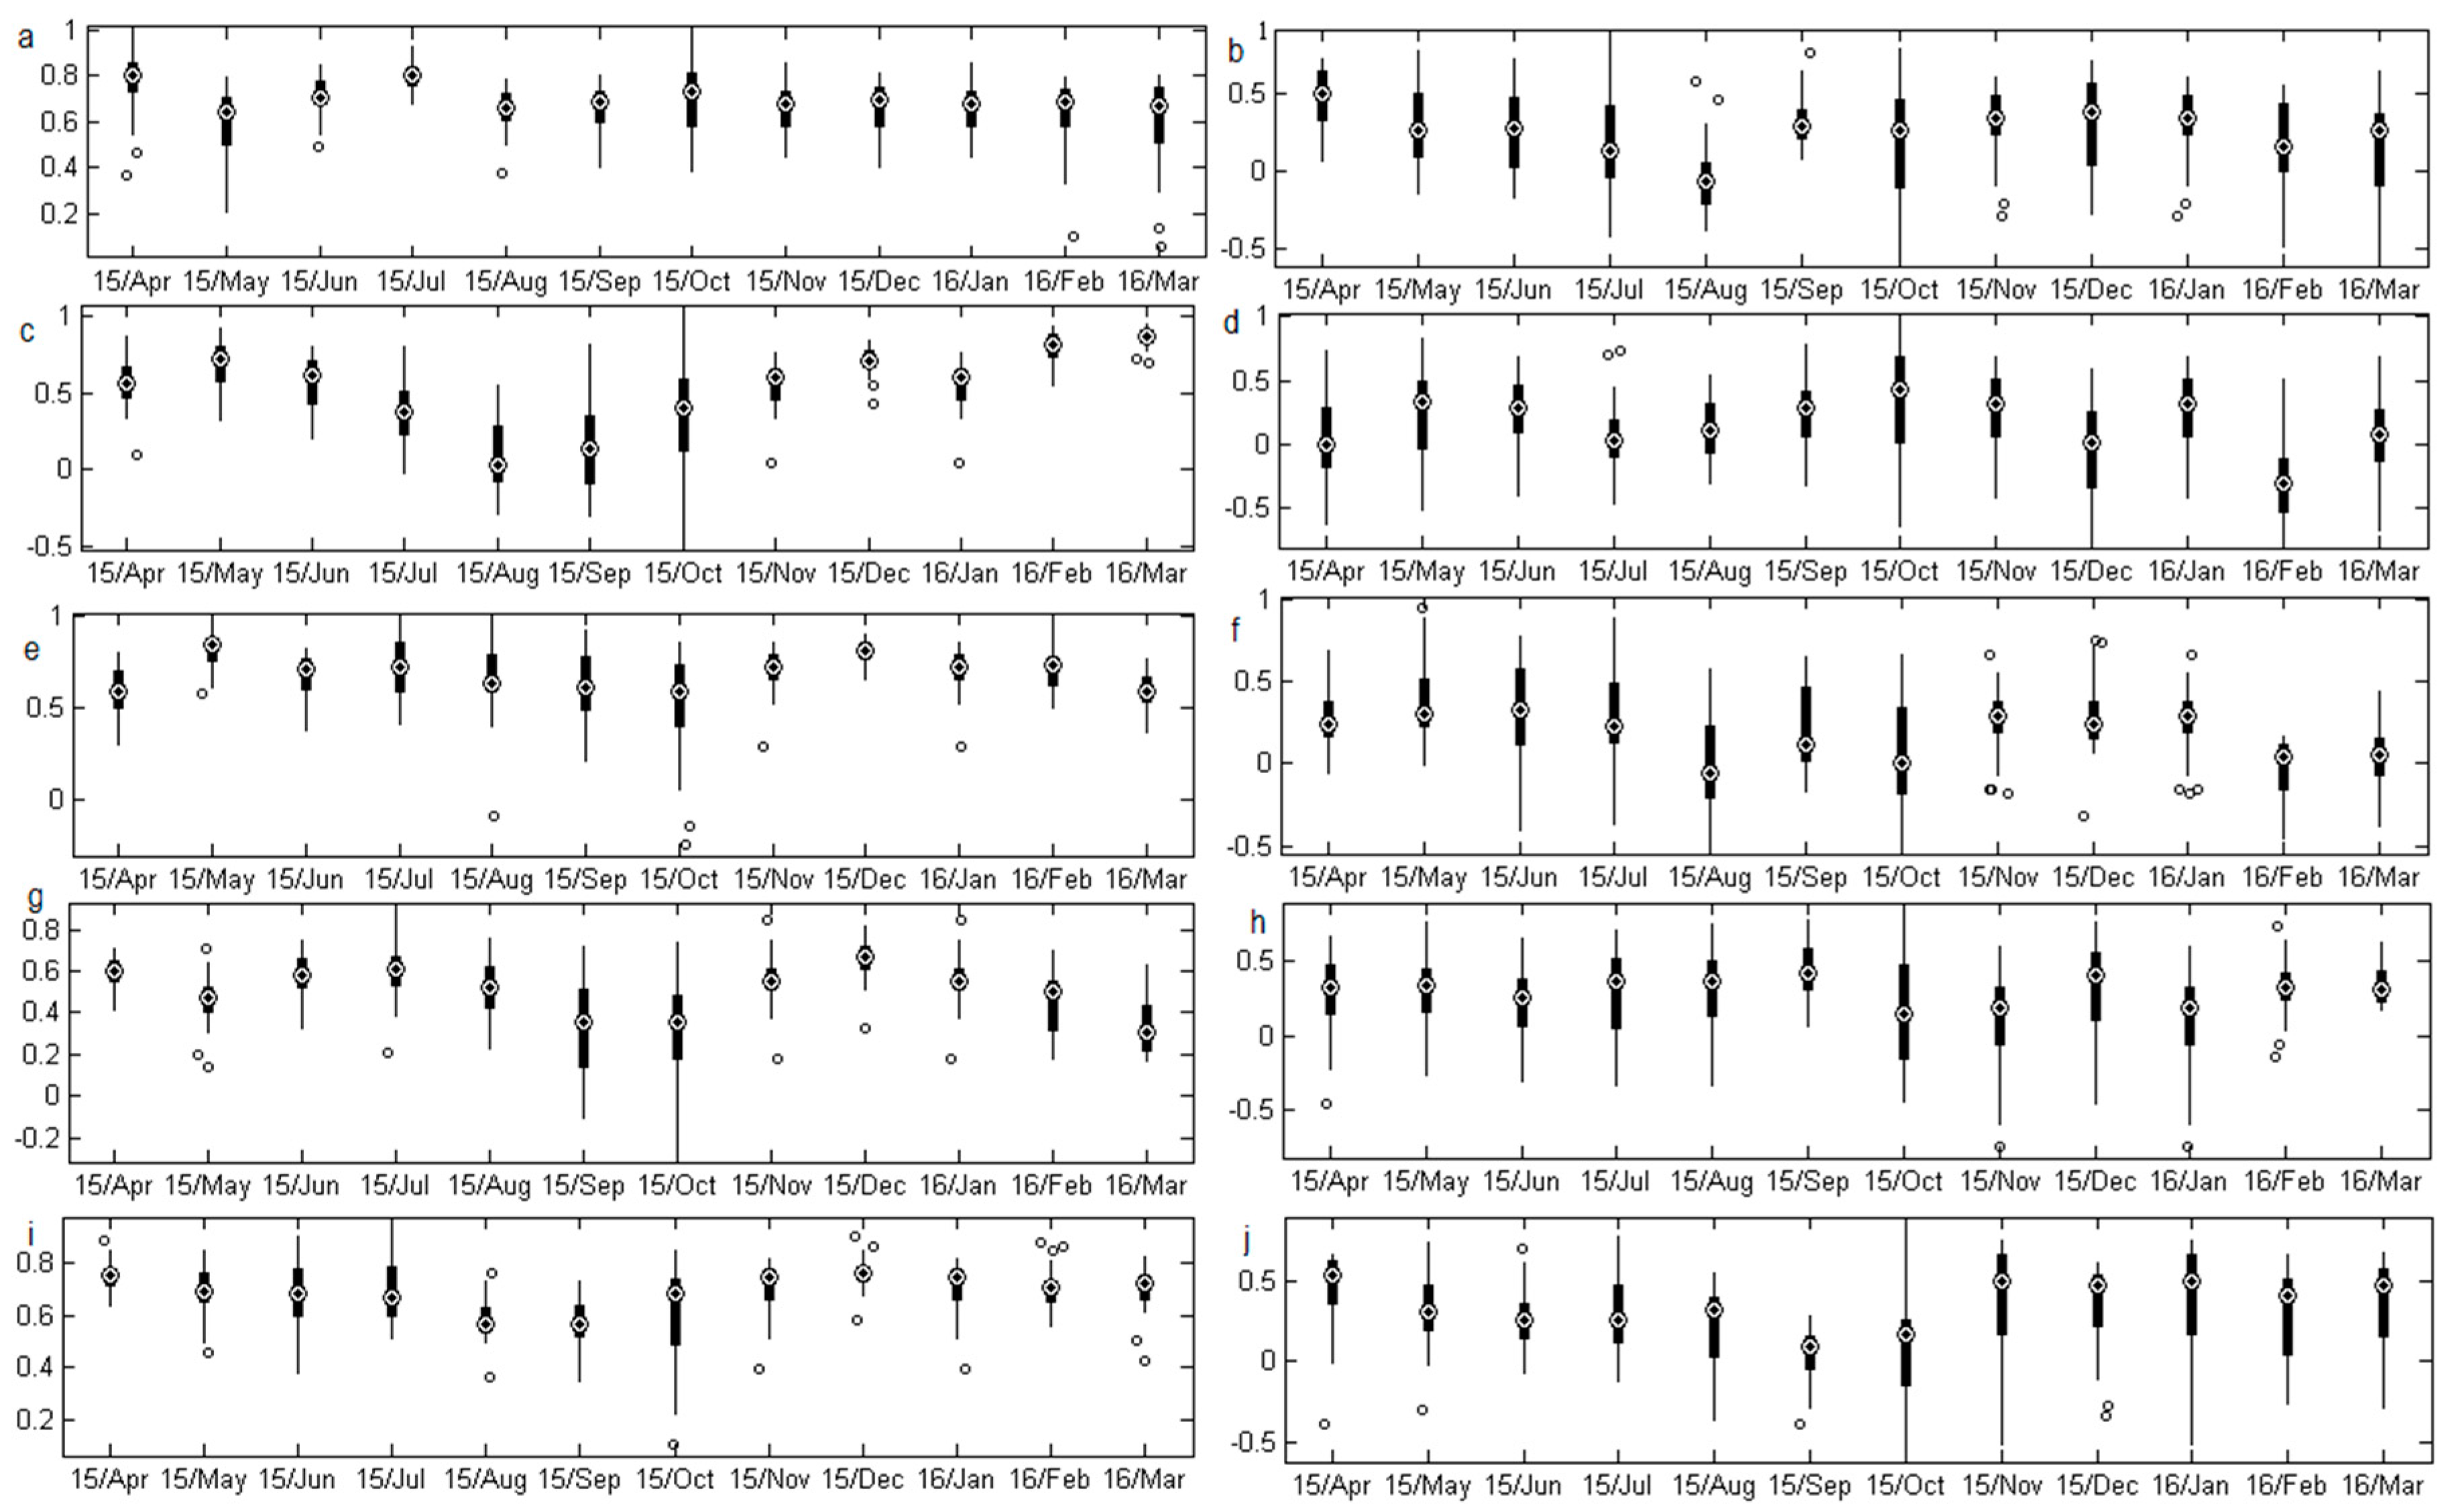
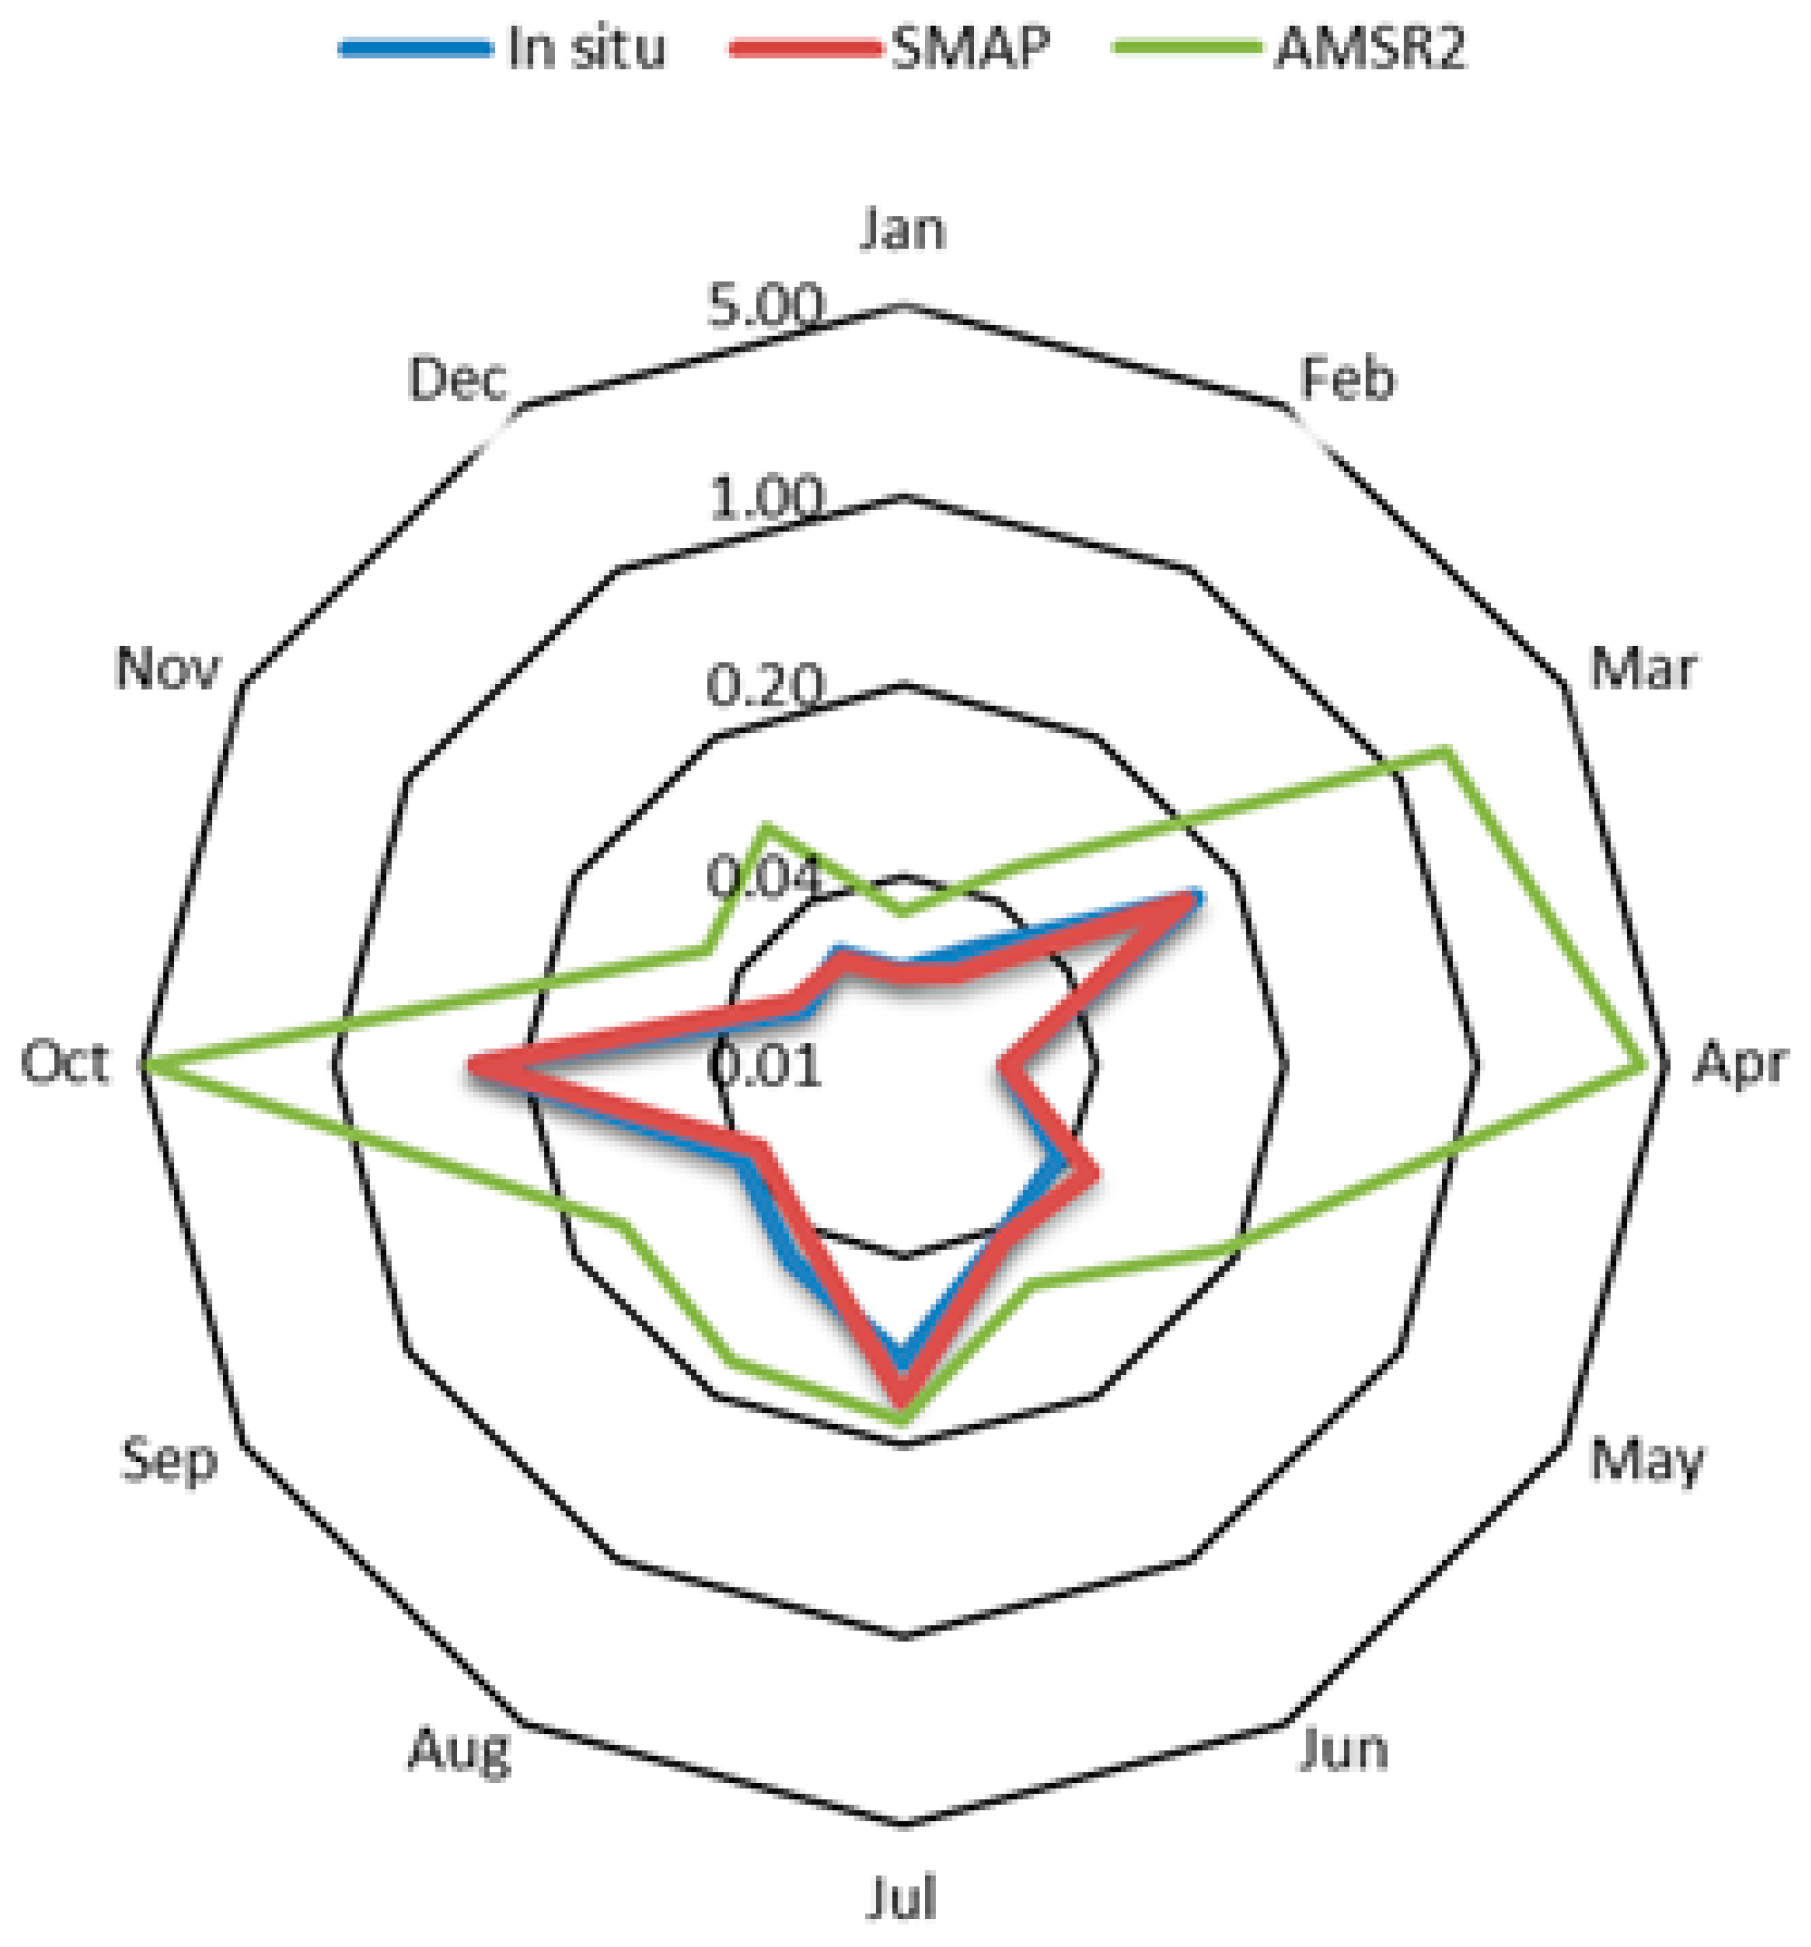
4.1. Temporal Analysis
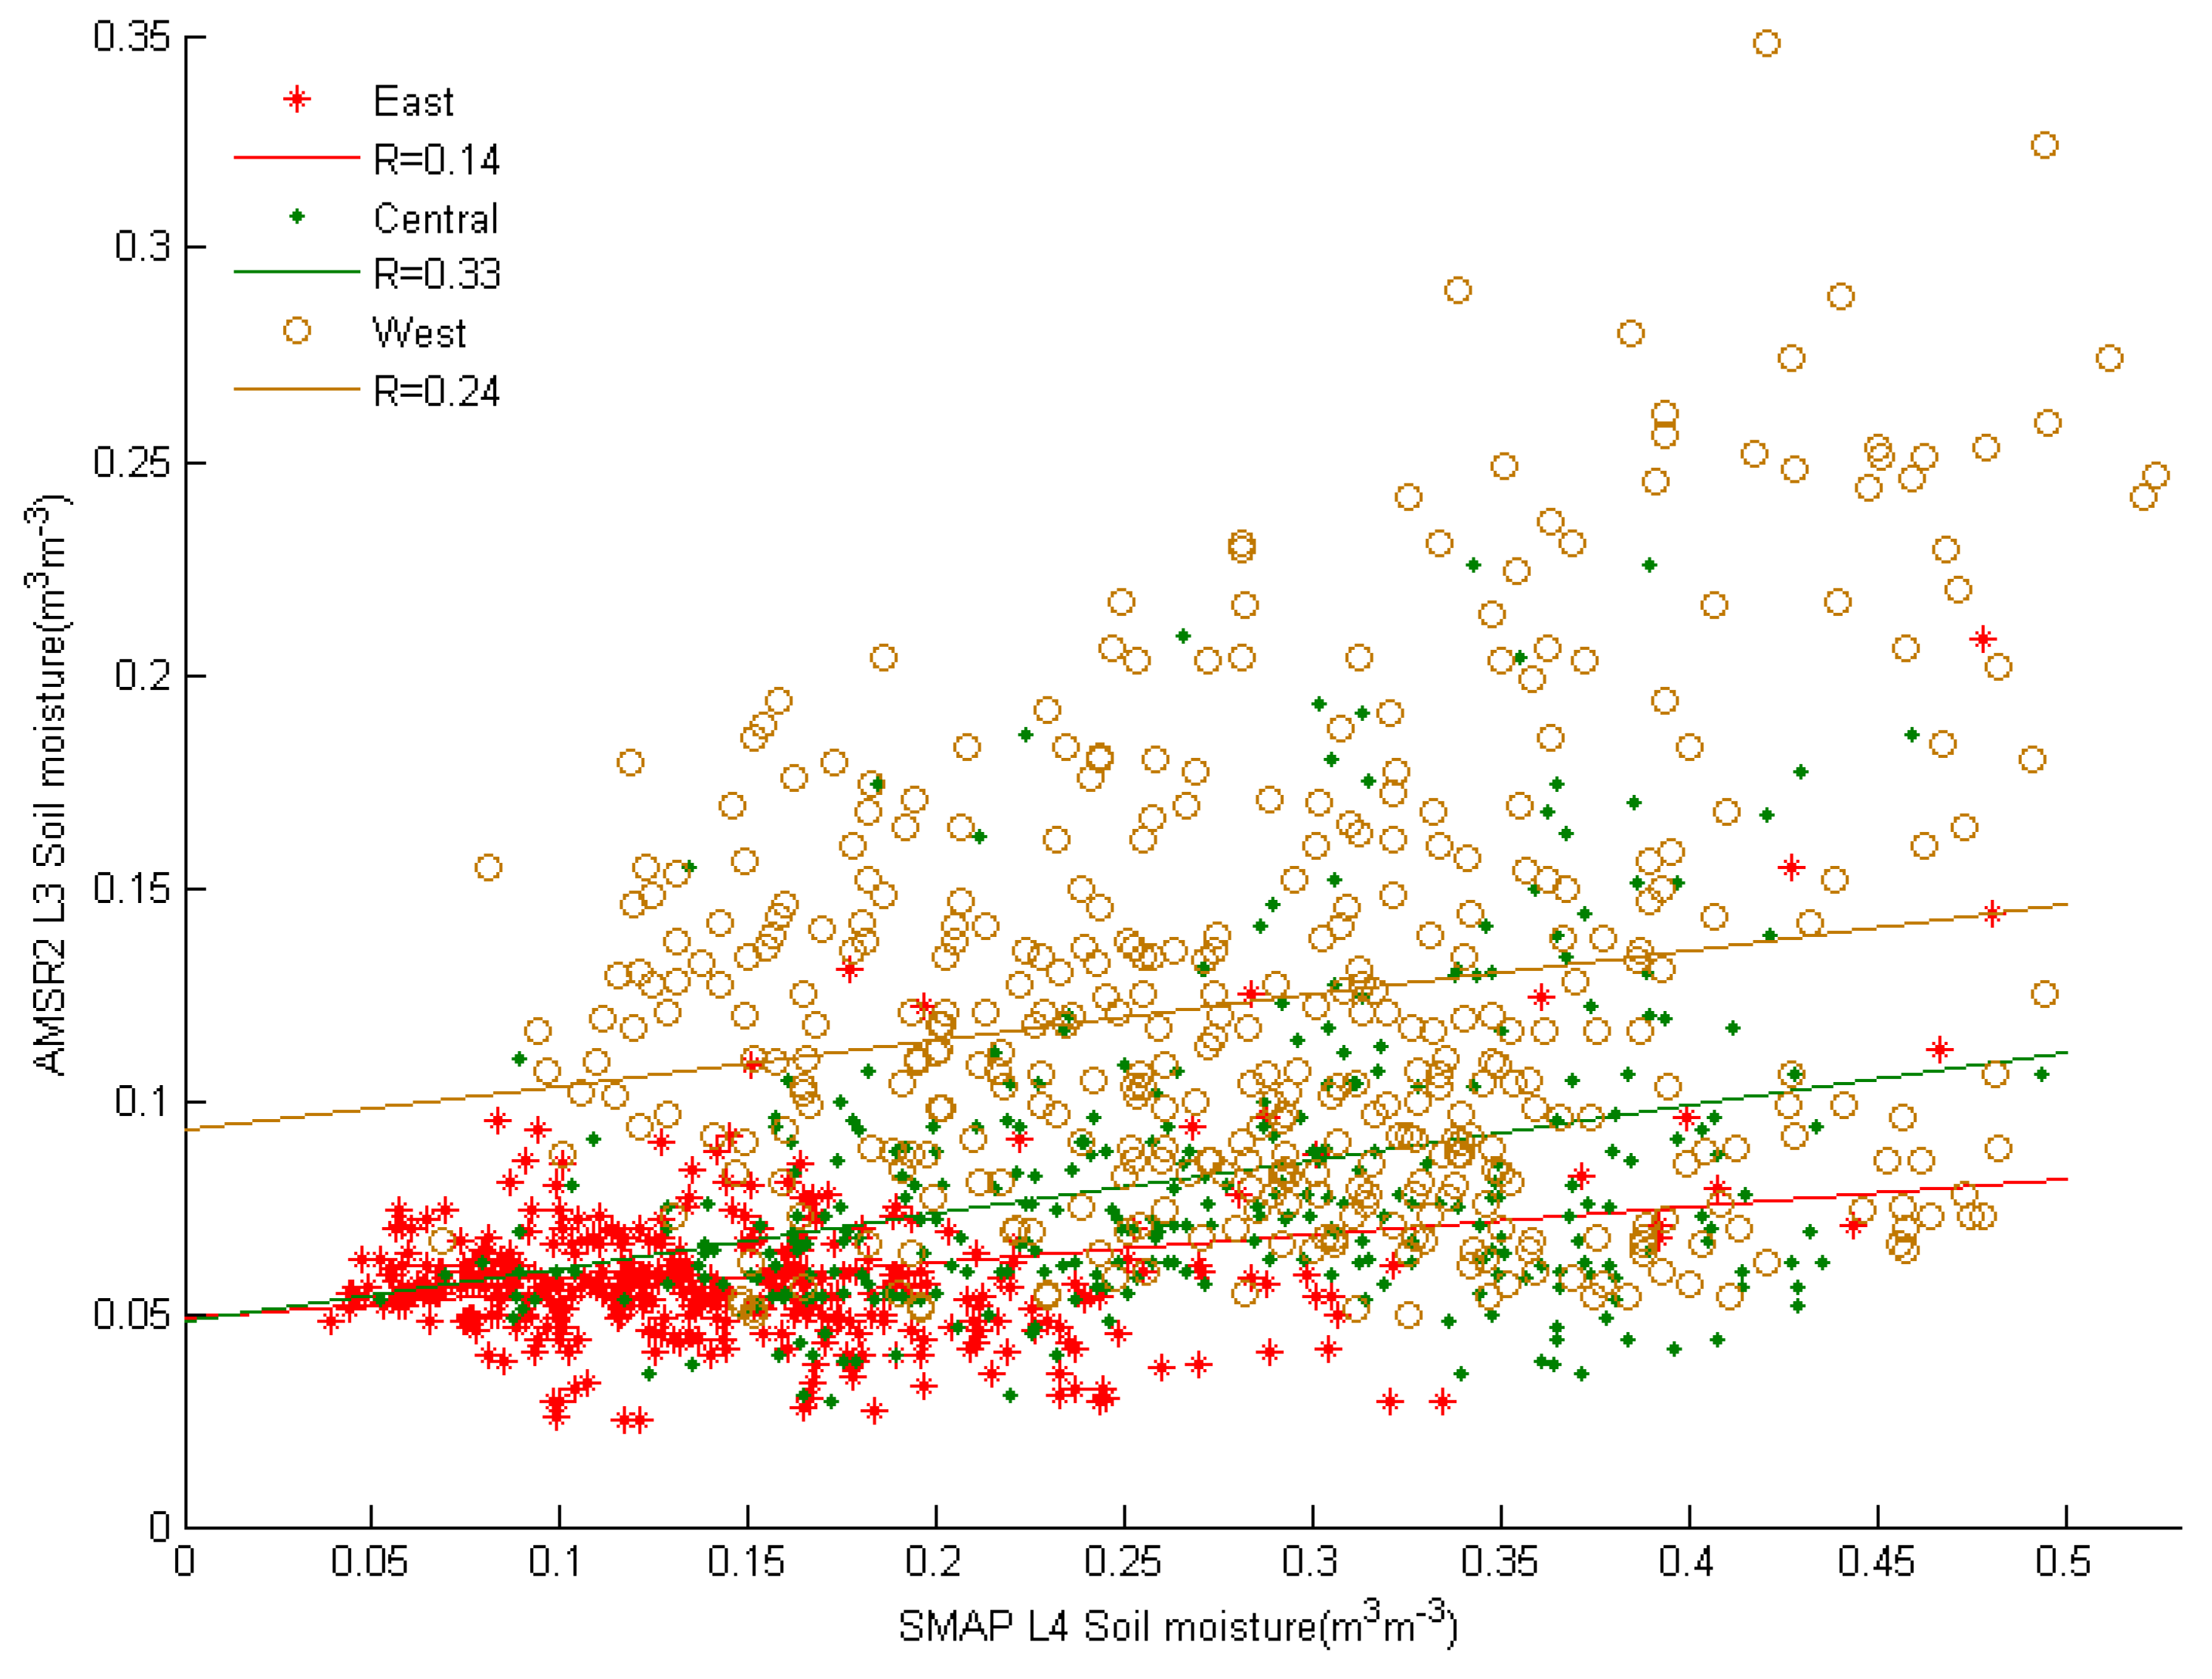
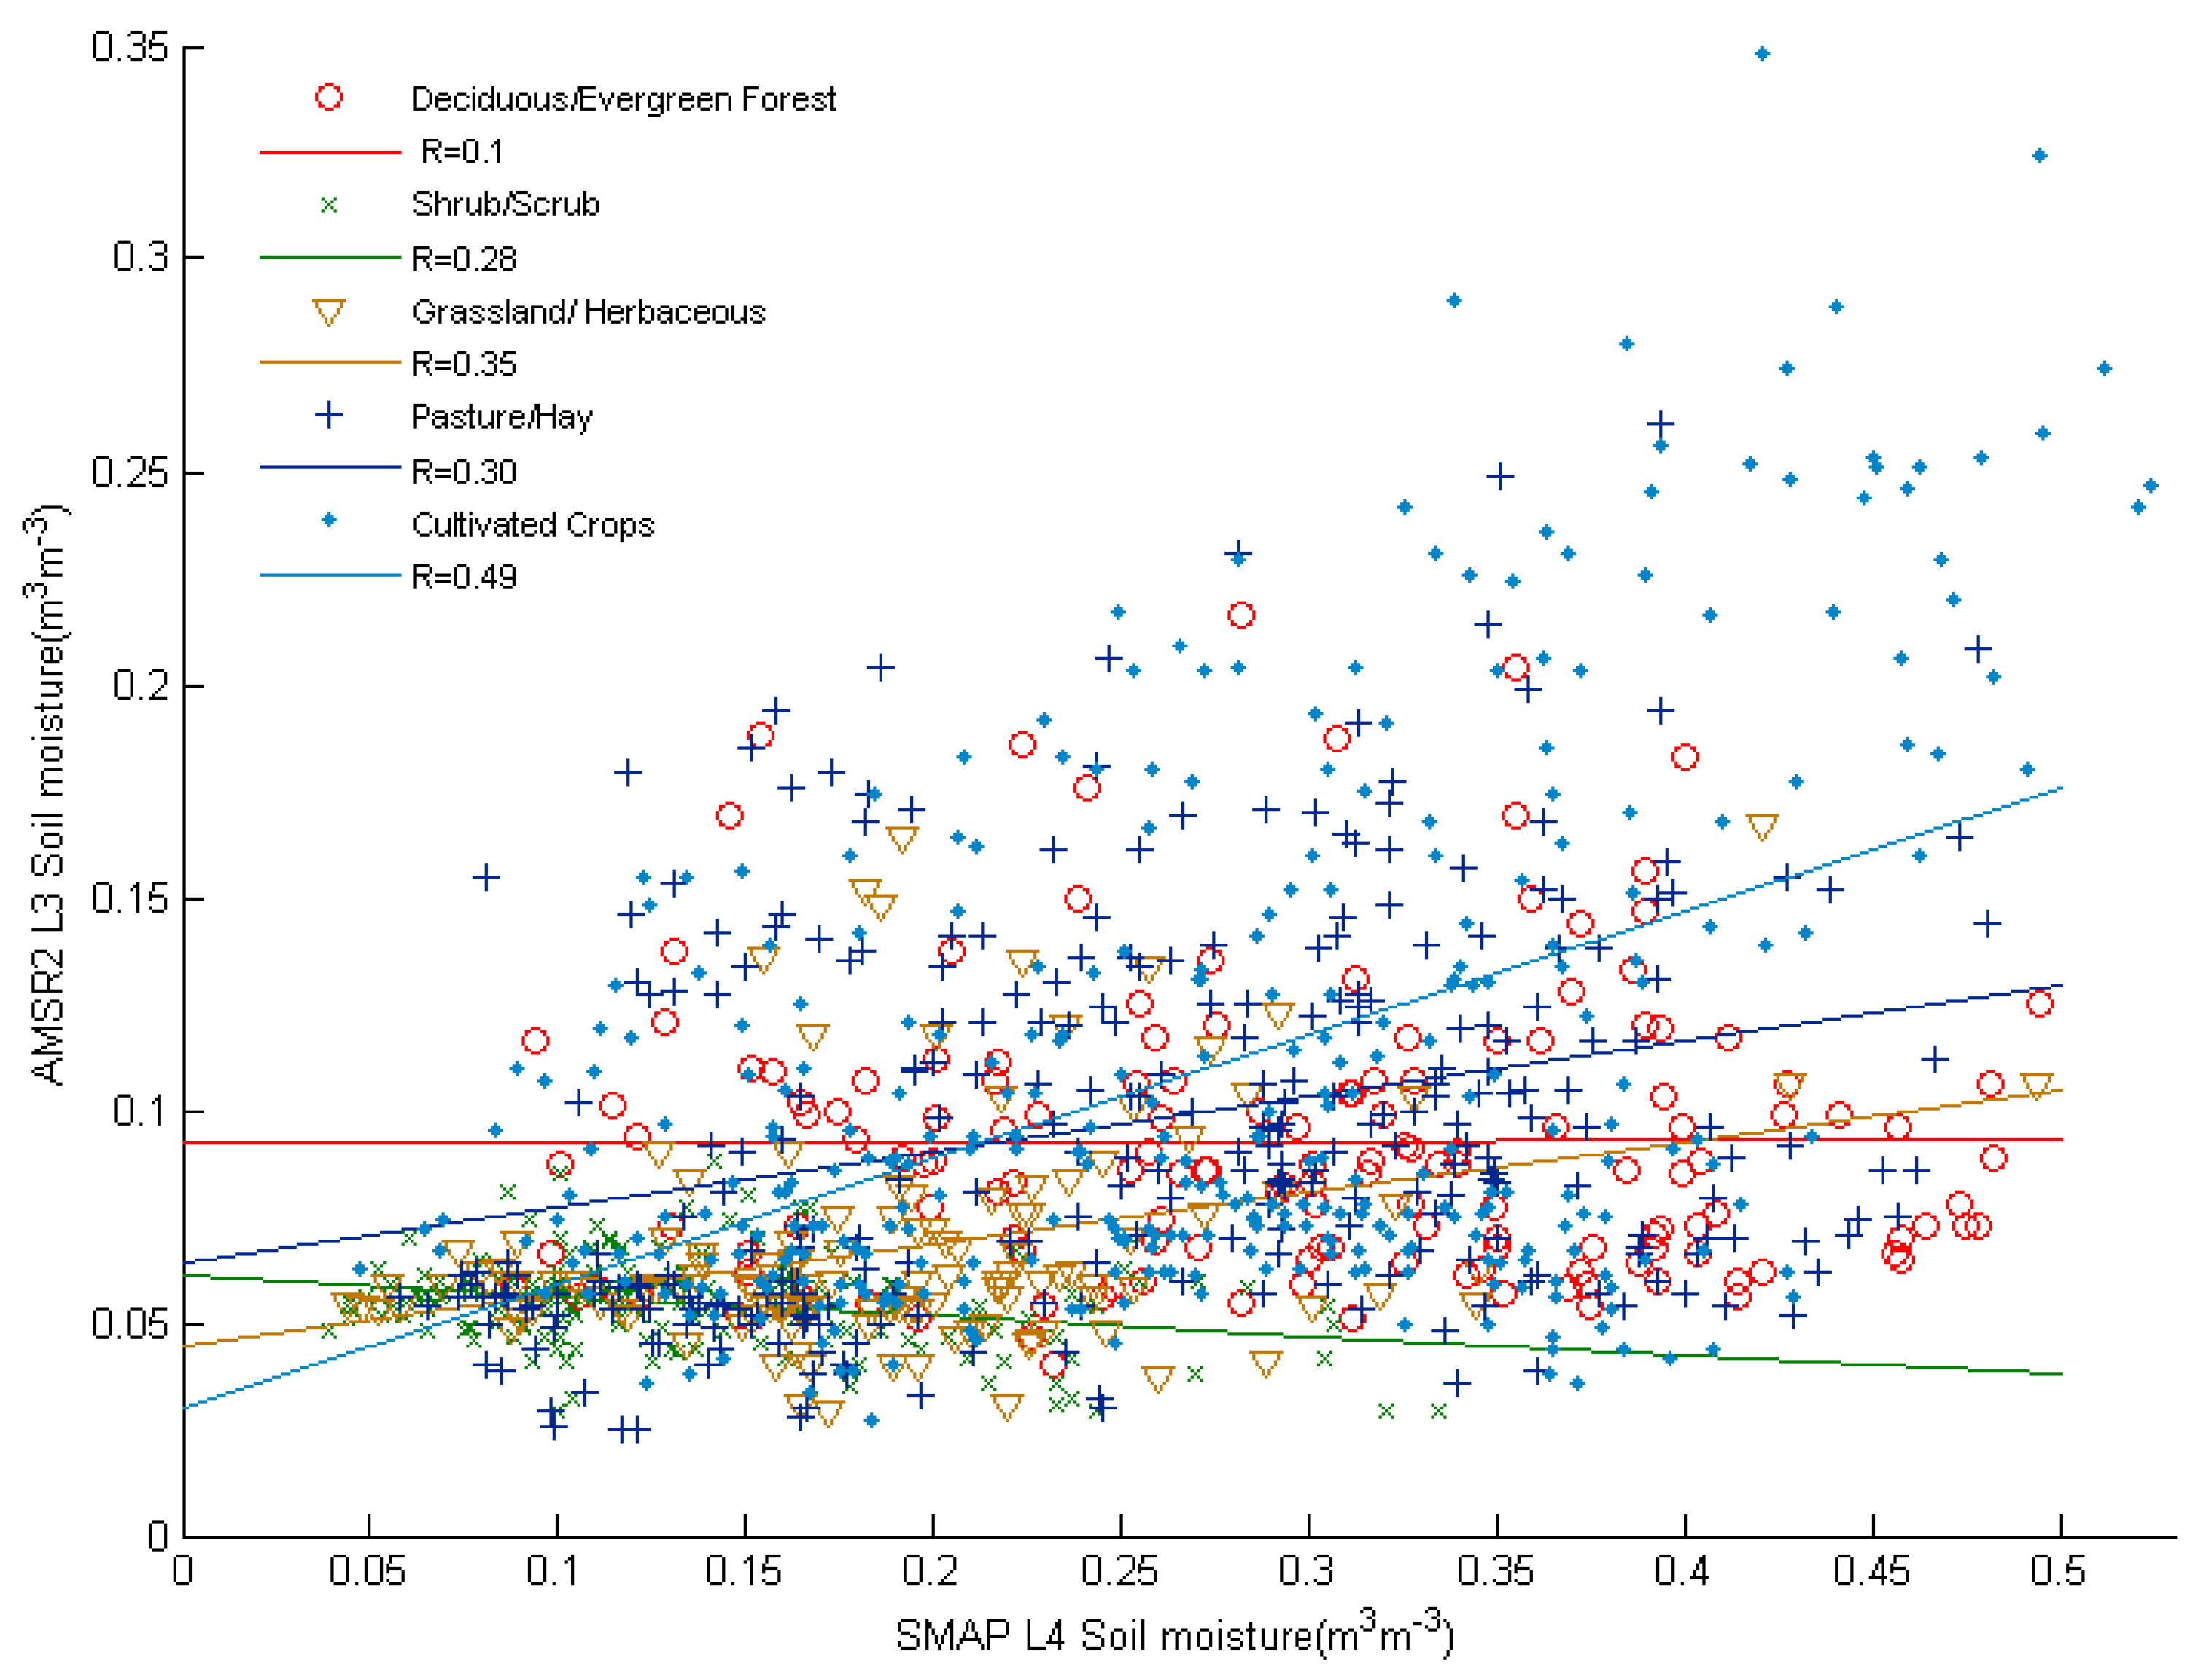
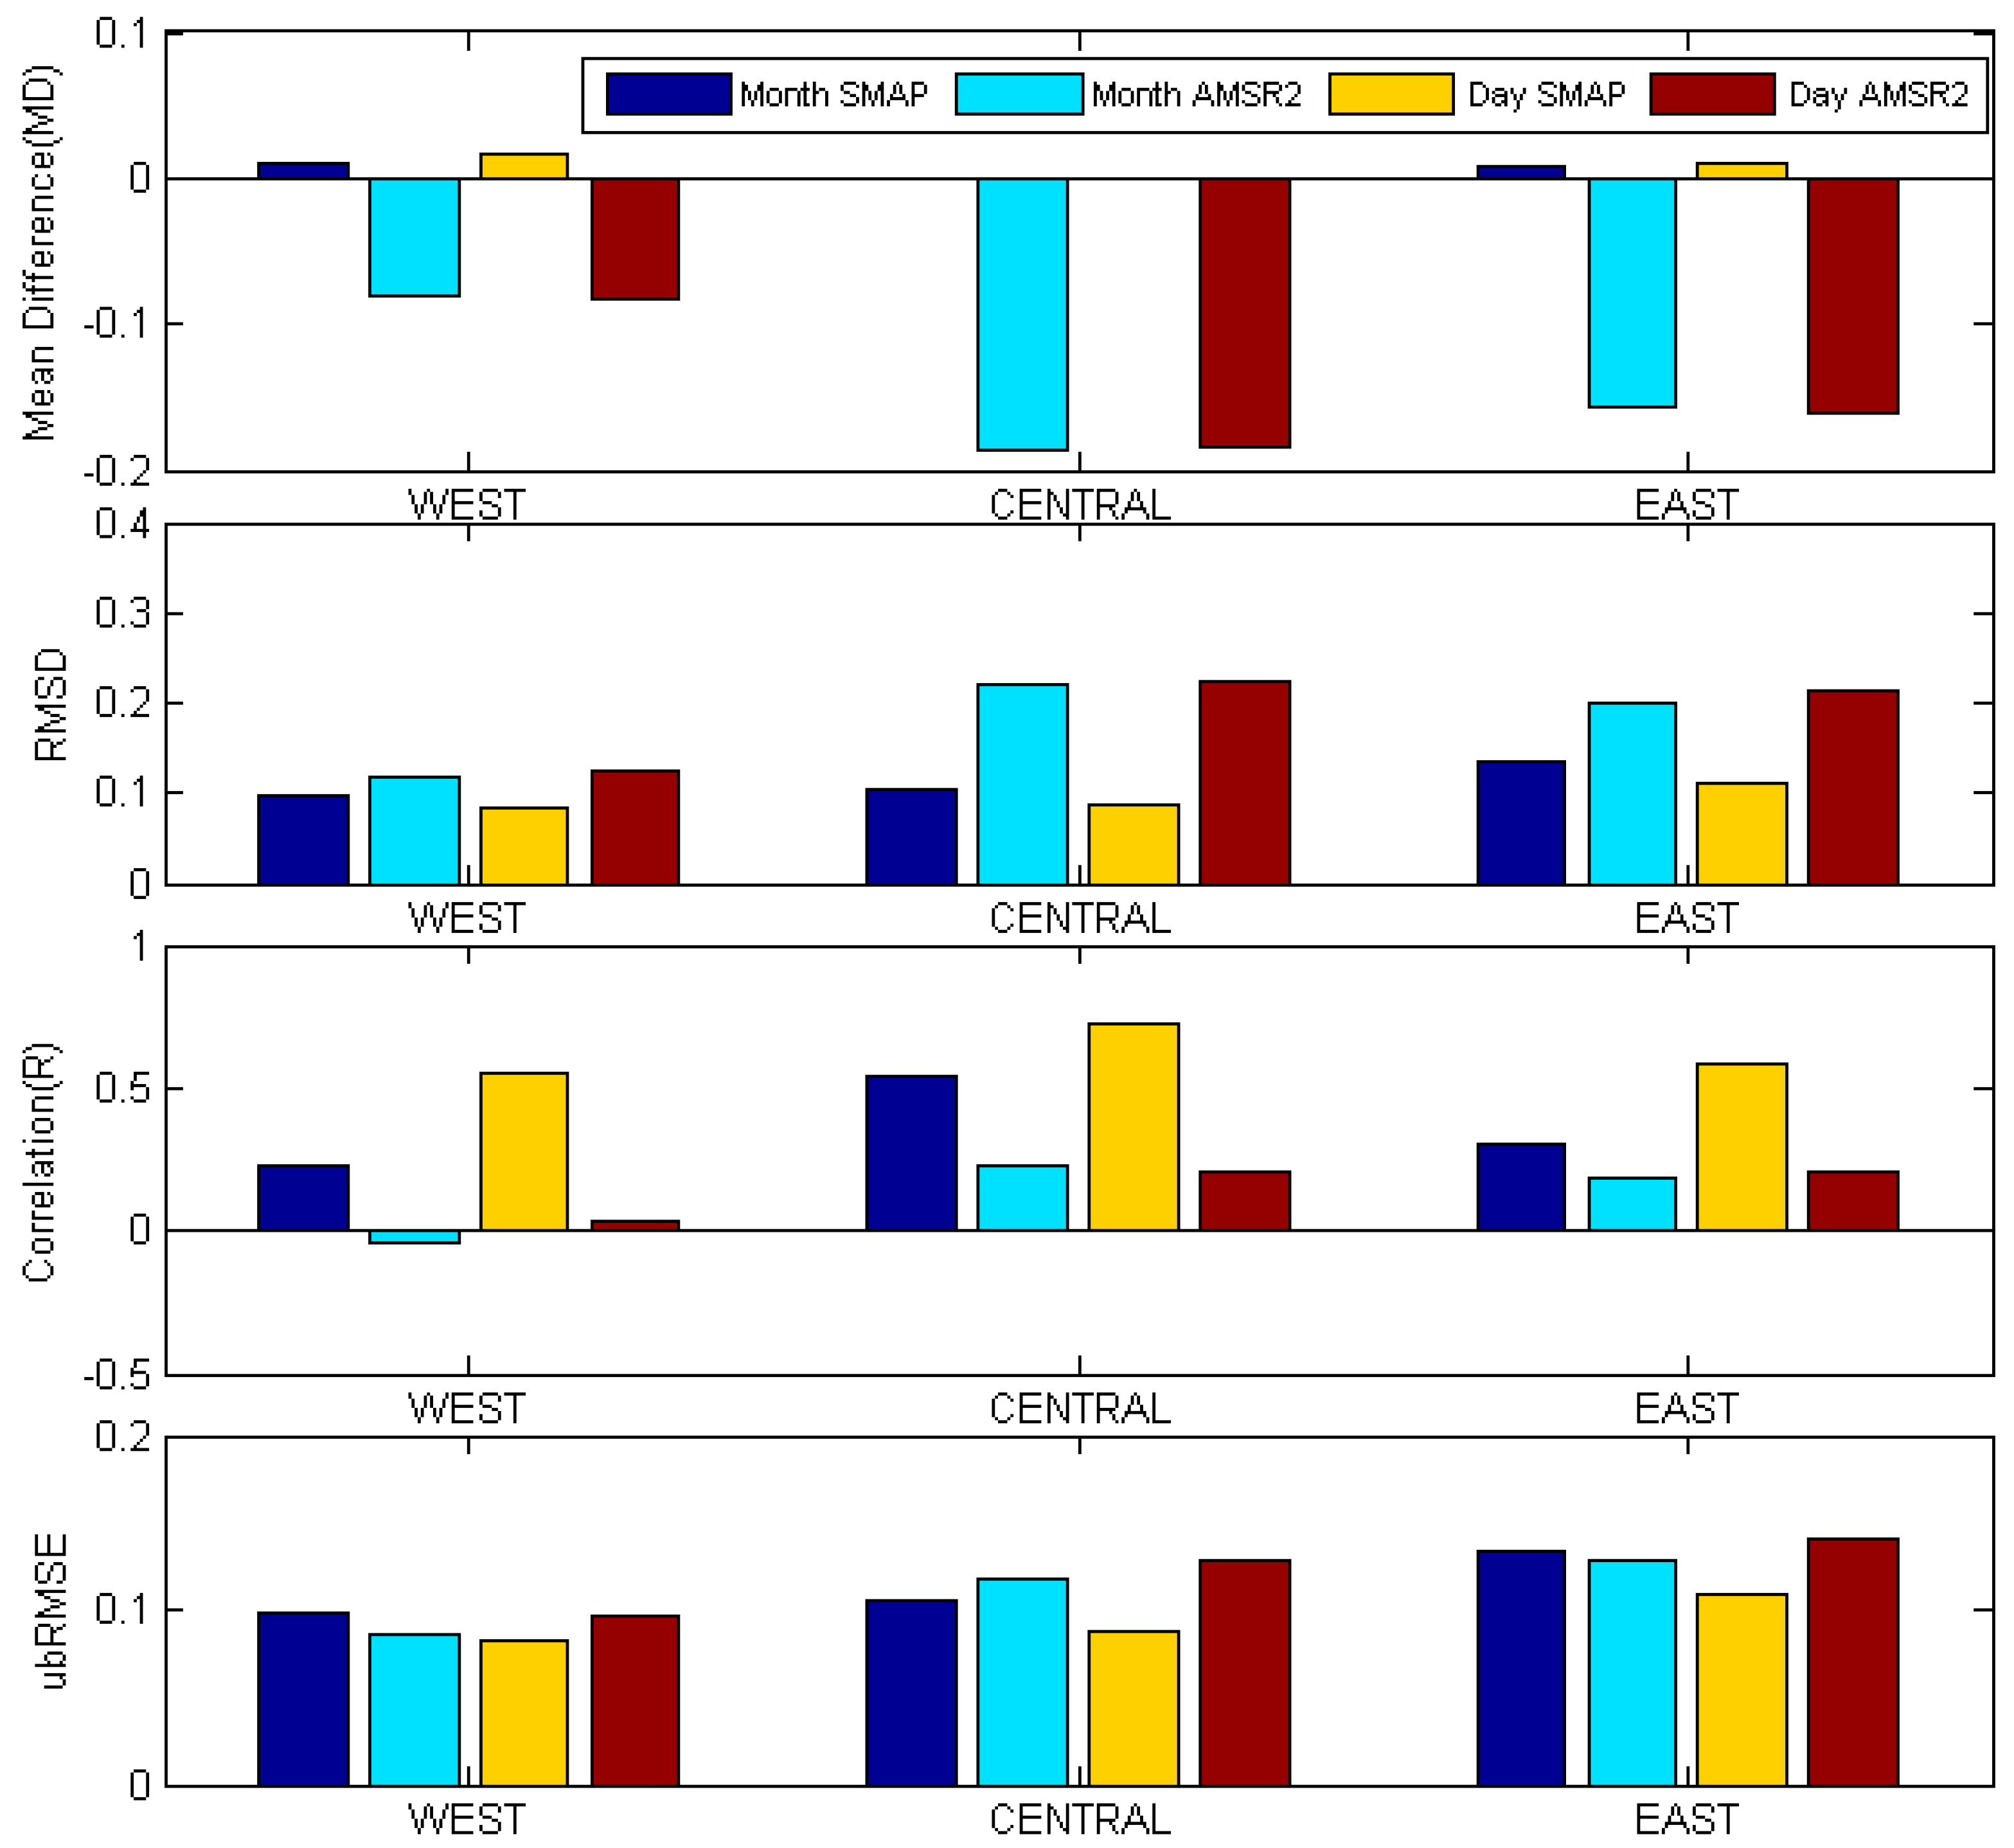
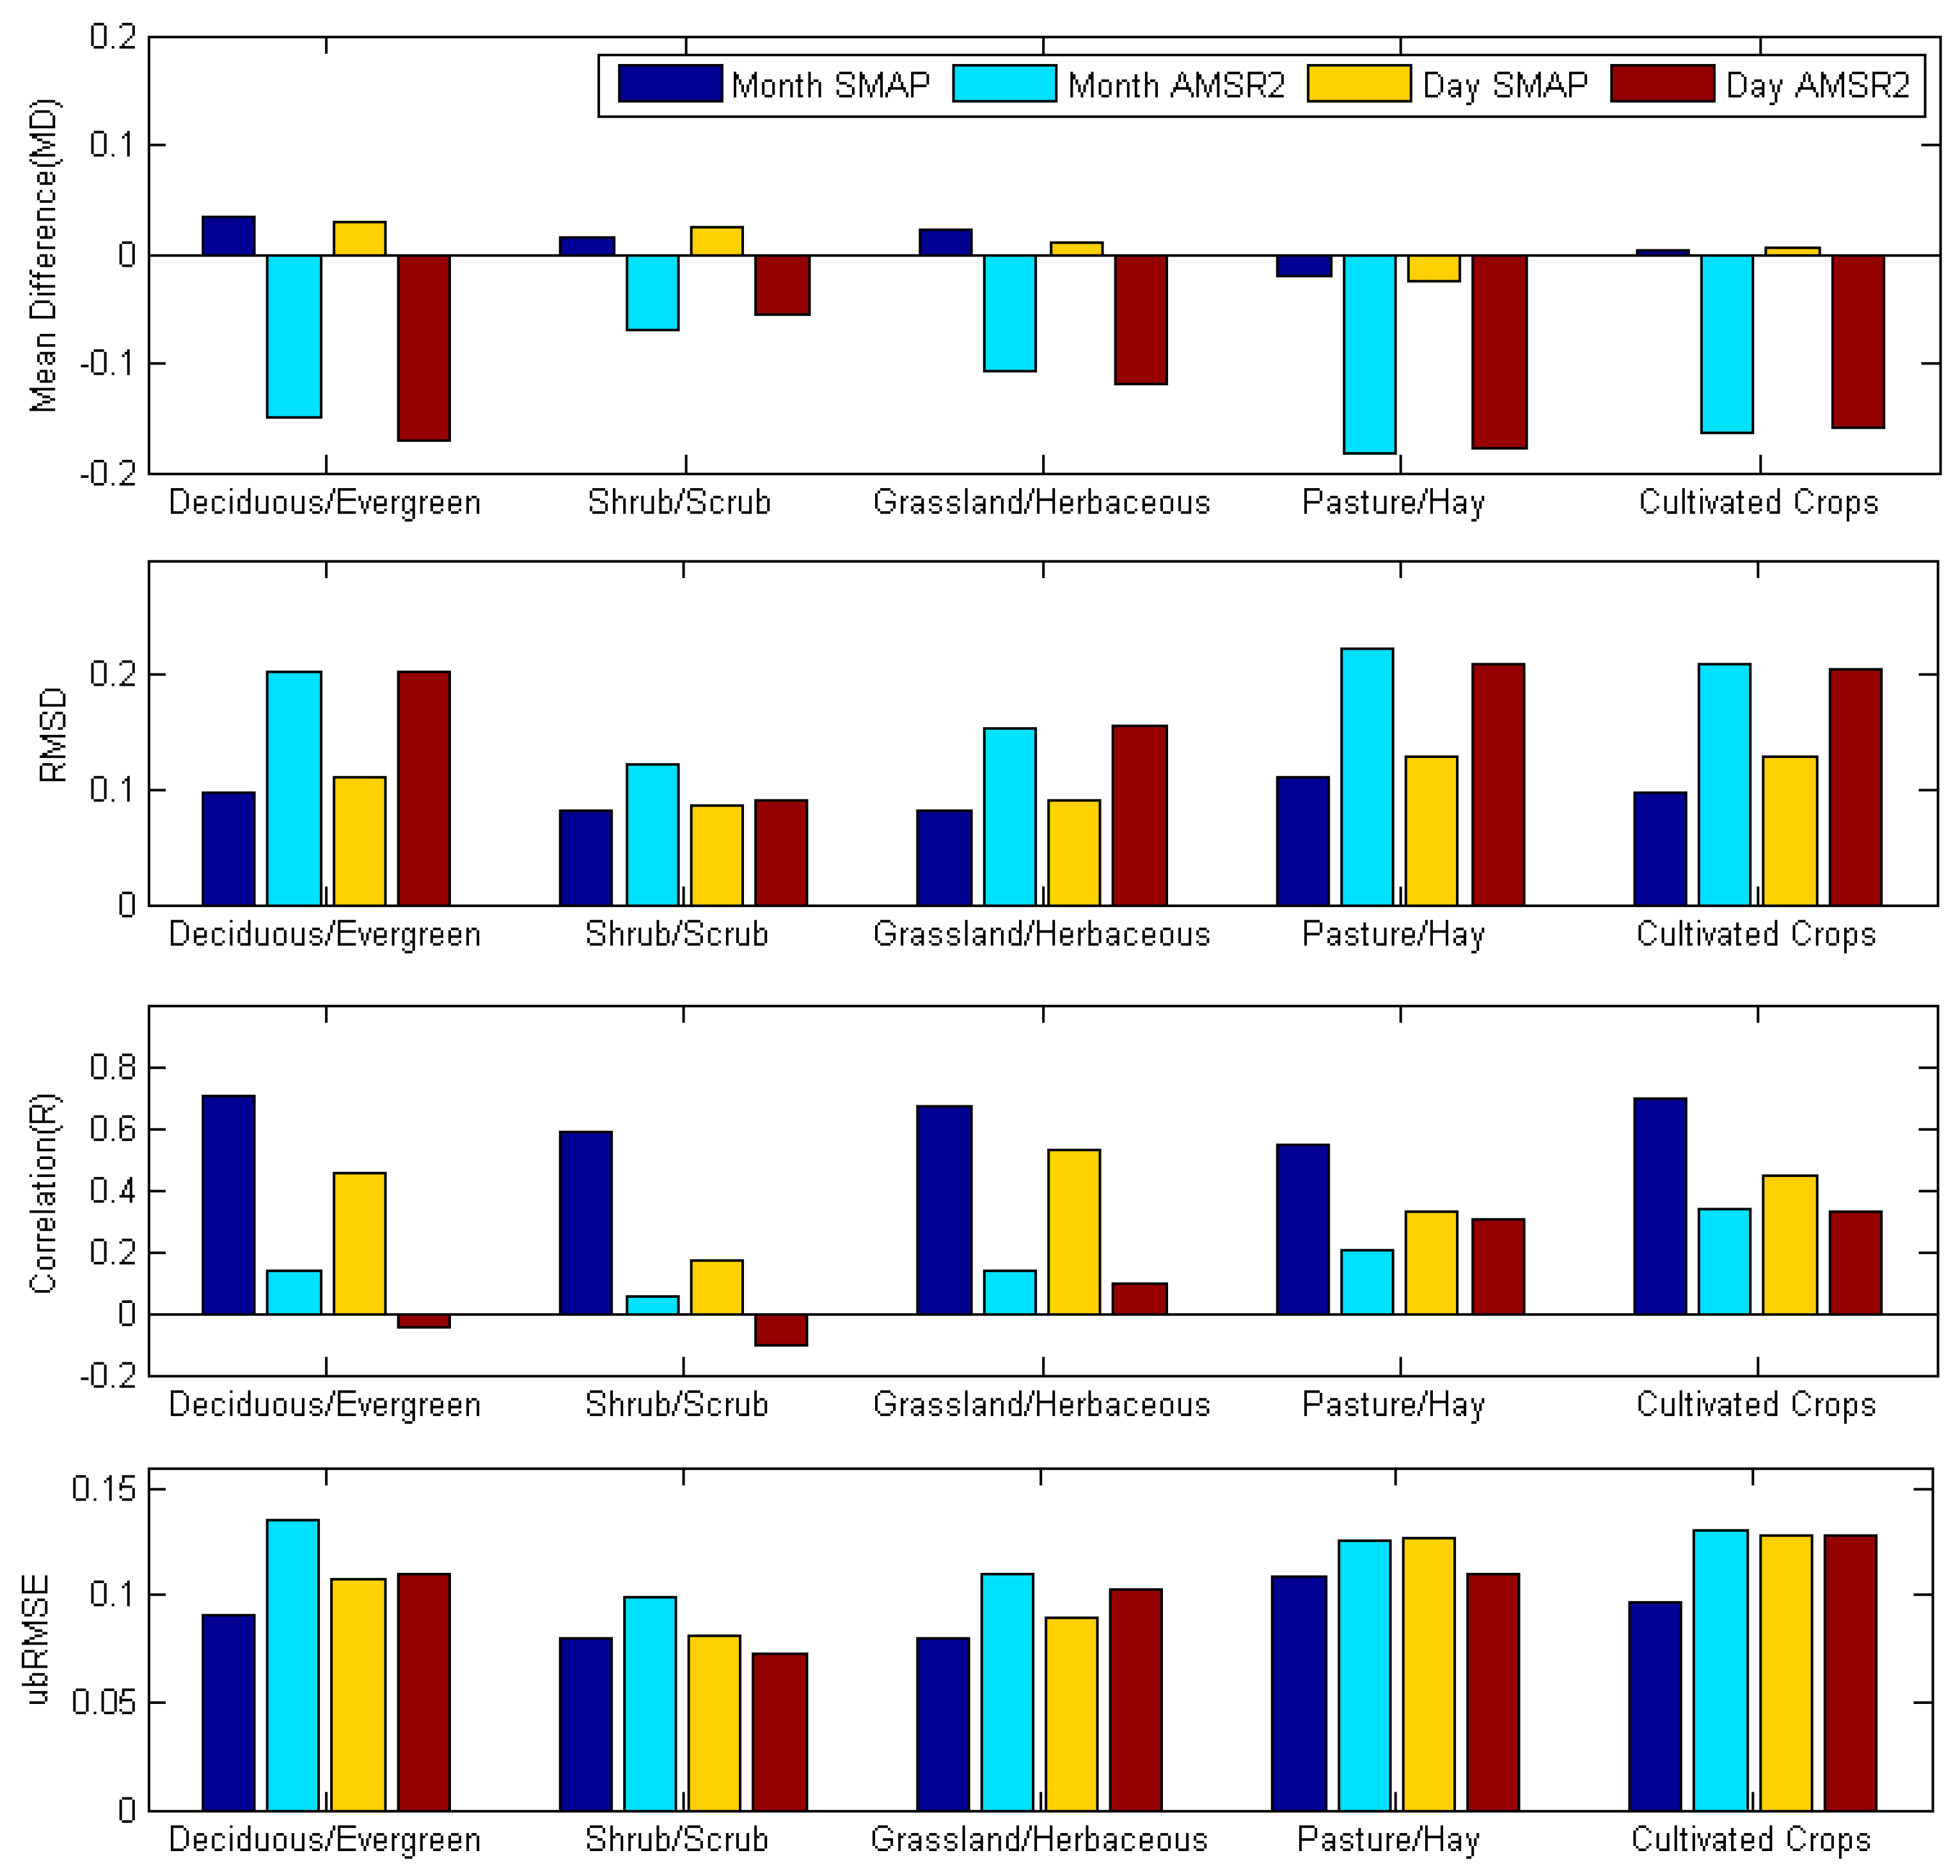
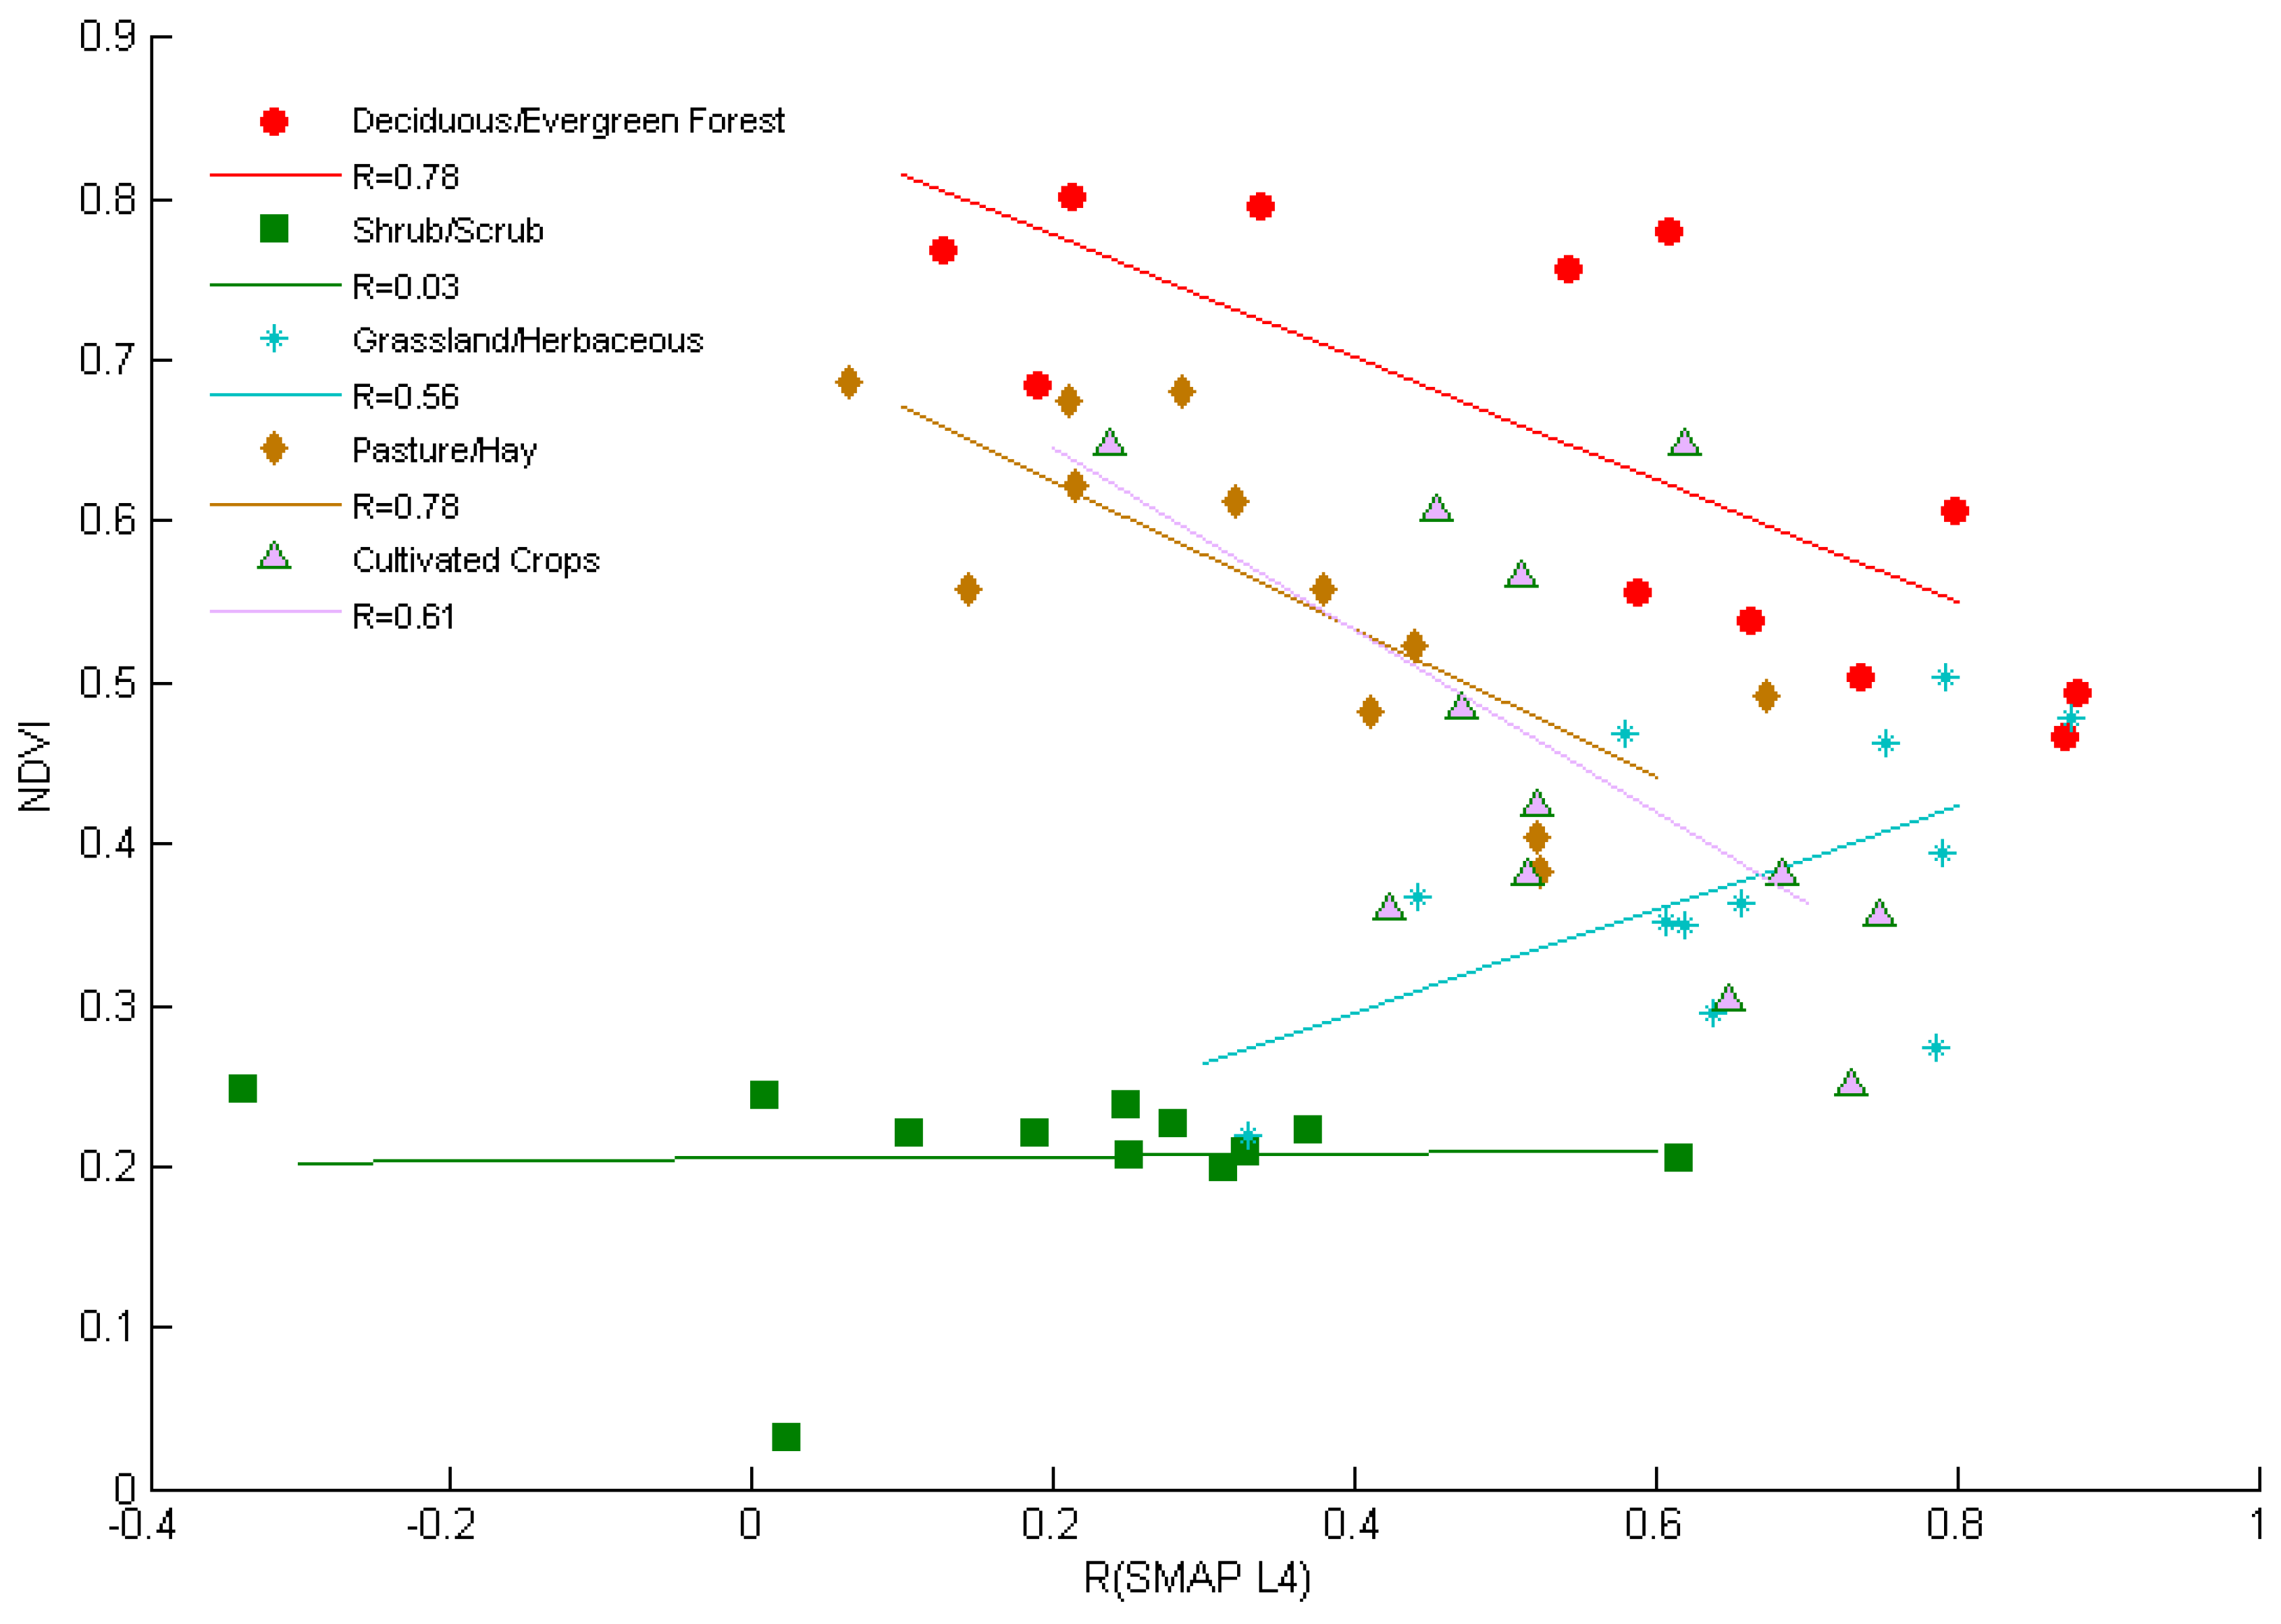
4.2. Spatial Analysis
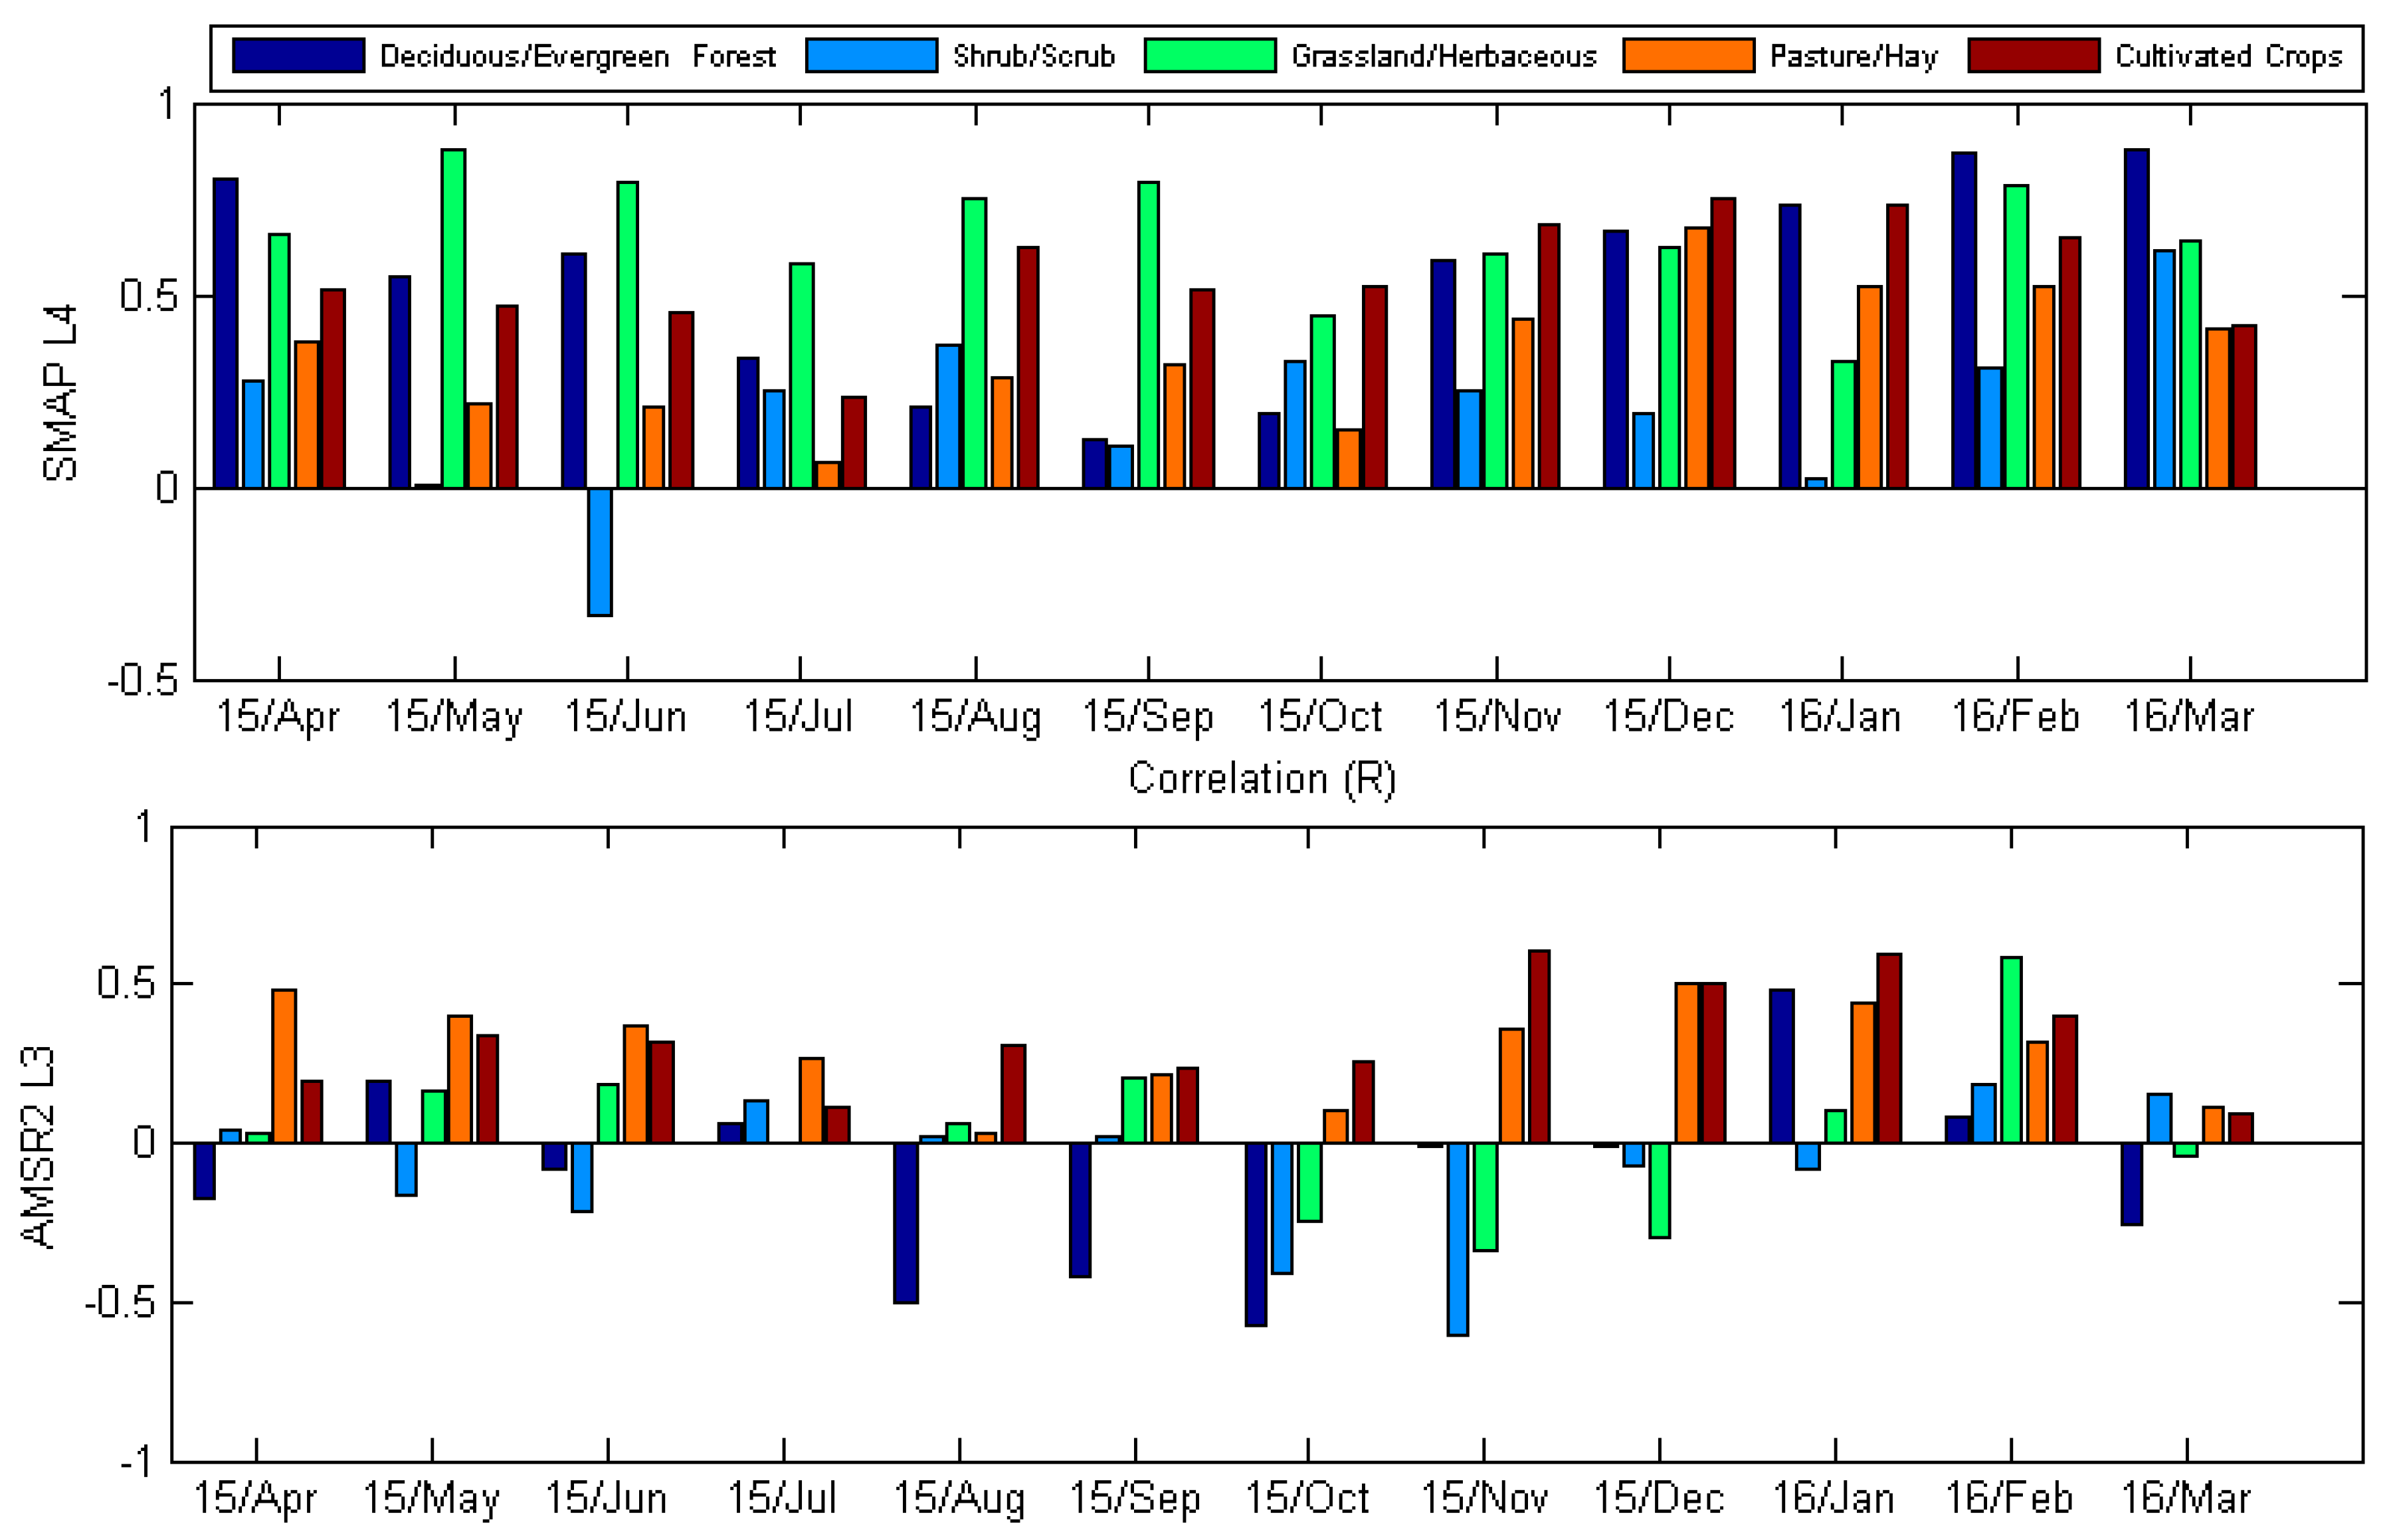
4.3. Temporal- Spatial Analysis
4.4. TC Analysis
5. Discussion
6. Conclusions
Acknowledgments
Author Contributions
Conflicts of Interest
References
- Kang, C.S.; Kanniah, K.D.; Kerr, Y.H.; Cracknell, A.P. Analysis of in-situ soil moisture data and validation of SMOS soil moisture products at selected agricultural sites over a tropical region. Int. J. Remote Sens. 2016, 37, 3636–3654. [Google Scholar] [CrossRef]
- Kerr, Y.H.; Waldteufel, P.; Richaume, P.; Wigneron, J.P.; Ferrazzoli, P.; Mahmoodi, A.; Al Bitar, A.; Cabot, F.; Gruhier, C.; Juglea, S.E.; et al. The SMOS soil moisture retrieval algorithm. IEEE Trans. Geosci. Remote Sens. 2012, 50, 1384–1403. [Google Scholar] [CrossRef]
- Entekhabi, D.; Njoku, E.G.; O’Neill, P.E.; Kellogg, K.H.; Crow, W.T.; Edelstein, W.N.; Entin, J.K.; Goodman, S.D.; Jackson, T.J.; Johnson, J.; et al. The Soil Moisture Active Passive (SMAP) mission. Proc. IEEE 2010, 98, 704–716. [Google Scholar] [CrossRef]
- Imaoka, K.; Kachi, M.; Kasahara, M.; Ito, N.; Nakagawa, K.; Oki, T. Instrument performance and calibration of AMSR-E and AMSR2. Int. Arch. Photogramm. Remote Sens. Spat. Inf. Sci. 2010, 38, 13–16. [Google Scholar]
- Kawanishi, T.; Sezai, T.; Ito, Y.; Imaoka, K.; Takeshima, T.; Ishido, Y.; Shibata, A.; Miura, M.; Inahata, H.; Spencer, R.W. The advanced microwave scanning radiometer for the earth observing system (AMSR-E), NASDA’S contribution to the EOS for global energy and water cycle studies. IEEE Trans. Geosci. Remote Sens. 2003, 41, 184–194. [Google Scholar] [CrossRef]
- Njoku, E.G.; Jackson, T.J.; Lakshmi, V.; Chan, T.K.; Nghiem, S.V. Soil moisture retrieval from AMSR-E. IEEE Trans. Geosci. Remote Sens. 2003, 41, 215–229. [Google Scholar] [CrossRef]
- Lu, H.; Koike, T.; Fujii, H.; Ohta, T.; Tamagawa, K. Development of a physically-based soil moisture retrieval algorithm for spaceborne passive microwave radiometers and its application to AMSR-E. J. Remote Sens. Soc. Jpn. 2009, 29, 253–262. [Google Scholar]
- Brocca, L.; Tarpanelli, A.; Moramarco, T.; Melone, F.; Ratto, S.M.; Cauduro, M.; Ferraris, S.; Berni, N.; Ponziani, F.; Wagner, W.; et al. Soil moisture estimation in alpine catchments through modeling and satellite observations. Vadose Zone J. 2013. [Google Scholar] [CrossRef]
- Dorigo, W.A.; Scipal, K.; Parinussa, R.M.; Liu, Y.Y.; Wagner, W.; de Jeu, R.A.M.; Naeimi, V. Error characterisation of global active and passive microwave soil moisture datasets. Hydrol. Earth Syst. Sci. 2010, 14, 2605–2616. [Google Scholar] [CrossRef]
- Owe, M.; de Jeu, R.; Van de Griend, A. Estimating Long Term Surface Soil Moisture from Satellite Microwave Observations in Illinois, USA; IAHS Publication: Wallingford, UK, 2001. [Google Scholar]
- Parinussa, R.; Meesters, A.; Liu, Y.; Dorigo, W.; Wagner, W.; De Jeu, R. An analytical solution to estimate the error structure of a global soil moisture data set. IEEE Geosci. Remote Sens. Lett. 2011, 8, 779–783. [Google Scholar] [CrossRef]
- Albergel, C.; de Rosnay, P.; Gruhier, C.; Munoz-Sabater, J.; Hasenauer, S.; Isaksen, L.; Kerr, Y.; Wagner, W. Evaluation of remotely sensed and modelled soil moisture products using global ground-based in situ observations. Remote Sens. Environ. 2012, 118, 215–226. [Google Scholar] [CrossRef]
- Brocca, L.; Hasenauer, S.; Lacava, T.; Melone, F.; Moramarco, T.; Wagner, W.; Dorigo, W.; Matgen, P.; Martinez-Fernandez, J.; Llorens, P.; et al. Soil moisture estimation through ascat and AMSR-E sensors: An intercomparison and validation study across Europe. Remote Sens. Environ. 2011, 115, 3390–3408. [Google Scholar] [CrossRef]
- Parinussa, R.M.; Holmes, T.R.H.; Wanders, N.; Dorigo, W.A.; de Jeu, R.A.M. A preliminary study toward consistent soil moisture from AMSR2. J. Hydrometeorol. 2015, 16, 932–947. [Google Scholar] [CrossRef]
- Wu, Q.S.; Liu, H.X.; Wang, L.; Deng, C.B. Evaluation of AMSR2 soil moisture products over the contiguous united states using in situ data from the international soil moisture network. Int. J. Appl. Earth Obs. Geoinf. 2016, 45, 187–199. [Google Scholar] [CrossRef]
- Albergel, C.; Calvet, J.C.; de Rosnay, P.; Balsamo, G.; Wagner, W.; Hasenauer, S.; Naeimi, V.; Martin, E.; Bazile, E.; Bouyssel, F.; et al. Cross-evaluation of modelled and remotely sensed surface soil moisture with in situ data in Southwestern France. Hydrol. Earth Syst. Sci. 2010, 14, 2177–2191. [Google Scholar] [CrossRef]
- An, R.; Zhang, L.; Wang, Z.; Quaye-Ballard, J.A.; You, J.; Shen, X.; Gao, W.; Huang, L.; Zhao, Y.; Ke, Z. Validation of the esa cci soil moisture product in China. Int. J. Appl. Earth Obs. Geoinf. 2016, 48, 28–36. [Google Scholar] [CrossRef]
- Crow, W.T.; Berg, A.A.; Cosh, M.H.; Loew, A.; Mohanty, B.P.; Panciera, R.; de Rosnay, P.; Ryu, D.; Walker, J.P. Upscaling sparse ground-based soil moisture observations for the validation of coarse-resolution satellite soil moisture products. Rev. Geophys. 2012. [Google Scholar] [CrossRef]
- Draper, C.S.; Walker, J.P.; Steinle, P.J.; de Jeu, R.A.M.; Holmes, T.R.H. An evaluation of AMSR-E derived soil moisture over Australia. Remote Sens. Environ. 2009, 113, 703–710. [Google Scholar] [CrossRef]
- Dorigo, W.A.; Gruber, A.; De Jeu, R.A.M.; Wagner, W.; Stacke, T.; Loew, A.; Albergel, C.; Brocca, L.; Chung, D.; Parinussa, R.M.; et al. Evaluation of the ESA CCI soil moisture product using ground-based observations. Remote Sens. Environ. 2015, 162, 380–395. [Google Scholar] [CrossRef]
- Leroux, D.J.; Kerr, Y.H.; Al Bitar, A.; Bindlish, R.; Jackson, T.J.; Berthelot, B.; Portet, G. Comparison between SMOS, VUA, ASCAT, and ECMWF soil moisture products over four watersheds in US. IEEE Trans. Geosci. Remote Sens. 2014, 52, 1562–1571. [Google Scholar] [CrossRef]
- Al-Yaari, A.; Wigneron, J.P.; Ducharne, A.; Kerr, Y.; de Rosnay, P.; de Jeu, R.; Govind, A.; Al Bitar, A.; Albergel, C.; Muñoz-Sabater, J.; et al. Global-scale evaluation of two satellite-based passive microwave soil moisture datasets (SMOS and AMSR-E) with respect to land data assimilation system estimates. Remote Sens. Environ. 2014, 149, 181–195. [Google Scholar] [CrossRef]
- Champagne, C.; Rowlandson, T.; Berg, A.; Burns, T.; L’Heureux, J.; Tetlock, E.; Adams, J.R.; McNairn, H.; Toth, B.; Itenfisu, D. Satellite surface soil moisture from SMOS and aquarius: Assessment for applications in agricultural landscapes. Int. J. Appl. Earth Obs. Geoinf. 2016, 45, 143–154. [Google Scholar] [CrossRef]
- Kim, S.; Liu, Y.Y.; Johnson, F.M.; Parinussa, R.M.; Sharma, A. A global comparison of alternate AMSR2 soil moisture products: Why do they differ? Remote Sens. Environ. 2015, 161, 43–62. [Google Scholar] [CrossRef]
- Zeng, J.; Li, Z.; Chen, Q.; Bi, H.; Qiu, J.; Zou, P. Evaluation of remotely sensed and reanalysis soil moisture products over the Tibetan Plateau using in-situ observations. Remote Sens. Environ. 2015, 163, 91–110. [Google Scholar] [CrossRef]
- Das, N.N.; Entekhabi, D.; Dunbar, R.S.; Njoku, E.G.; Yueh, S.H. Uncertainty estimates in the SMAP combined active-passive downscaled brightness temperature. IEEE Trans. Geosci. Remote Sens. 2016, 54, 640–650. [Google Scholar] [CrossRef]
- Leroux, D.J.; Das, N.N.; Entekhabi, D.; Colliander, A.; Njoku, E.; Jackson, T.J.; Yueh, S. Active-passive soil moisture retrievals during the SMAP Validation Experiment 2012. IEEE Geosci. Remote Sens. Lett. 2016, 13, 475–479. [Google Scholar] [CrossRef]
- Yee, M.S.; Walker, J.P.; Monerris, A.; Rudiger, C.; Jackson, T.J. On the identification of representative in situ soil moisture monitoring stations for the validation of SMAP soil moisture products in Australia. J. Hydrol. 2016, 537, 367–381. [Google Scholar] [CrossRef]
- Zeng, J.Y.; Chen, K.S.; Bi, H.Y.; Chen, Q. A preliminary evaluation of the SMAP radiometer soil moisture product over united states and europe using ground-based measurements. IEEE Trans. Geosci. Remote Sens. 2016, 54, 4929–4940. [Google Scholar] [CrossRef]
- Chen, F.; Crow, W.T.; Colliander, A.; Cosh, M.H.; Jackson, T.J.; Bindlish, R.; Reichle, R.H.; Chan, S.K.; Bosch, D.D.; Starks, P.J. Application of triple collocation in ground-based validation of Soil Moisture Active/Passive (SMAP) level 2 data products. IEEE J. Sel. Top. Appl. Earth Obs. Remote Sens. 2016, 99, 1–14. [Google Scholar] [CrossRef]
- Al-Yaari, A.; Wigneron, J.P.; Kerr, Y.; de Jeu, R.; Rodriguez-Fernandez, N.; van der Schalie, R.; Al Bitar, A.; Mialon, A.; Richaume, P.; Dolman, A.; et al. Testing regression equations to derive long-term global soil moisture datasets from passive microwave observations. Remote Sens. Environ. 2016, 180, 453–464. [Google Scholar] [CrossRef]
- Stoffelen, A. Toward the true near-surface wind speed: Error modeling and calibration using triple collocation. J. Geophys. Res. Oceans 1998, 103, 7755–7766. [Google Scholar] [CrossRef]
- Miralles, D.G.; Crow, W.T.; Cosh, M.H. Estimating spatial sampling errors in coarse-scale soil moisture estimates derived from point-scale observations. J. Hydrometeorol. 2010, 11, 1423–1429. [Google Scholar] [CrossRef]
- Pierdicca, N.; Fascetti, F.; Pulvirenti, L.; Crapolicchio, R.; Munoz-Sabater, J. Analysis of ASCAT, SMOS, in-situ and land model soil moisture as a regionalized variable over Europe and North Africa. Remote Sens. Environ. 2015, 170, 280–289. [Google Scholar] [CrossRef]
- Scipal, K.; Holmes, T.; de Jeu, R.; Naeimi, V.; Wagner, W. A possible solution for the problem of estimating the error structure of global soil moisture data sets. Geophys. Res. Lett. 2008. [Google Scholar] [CrossRef]
- Wang, S.; Mo, X.; Liu, S.; Lin, Z.; Hu, S. Validation and trend analysis of ECV soil moisture data on cropland in North China plain during 1981–2010. Int. J. Appl. Earth Obs. Geoinf. 2016, 48, 110–121. [Google Scholar] [CrossRef]
- Koike, T.; Nakamura, Y.; Kaihotsu, I.; Davaa, G.; Matsuura, N.; Tamagawa, K.; Fujii, H. Development of an Advanced Microwave Scanning Radiometer (AMSR-E) algorithm for soil moisture and vegetation water content. Proc. Hydraul. Eng. 2004, 48, 217–222. [Google Scholar] [CrossRef]
- Maeda, T.; Taniguchi, Y. Descriptions of GCOM-W1 AMSR2 Level 1r and Level 2 Algorithms; Japan Aerospace Exploration Agency Earth Observation Research Center: Ibaraki, Japan, 2013. [Google Scholar]
- Cho, E.; Moon, H.; Choi, M. First assessment of the Advanced Microwave Scanning Radiometer 2 (AMSR2) soil moisture contents in Northeast Asia. J. Meteorol. Soc. Jpn. 2015, 93, 117–129. [Google Scholar] [CrossRef]
- Jackson, T.J.; Cosh, M.H.; Bindlish, R.; Starks, P.J.; Bosch, D.D.; Seyfried, M.; Goodrich, D.C.; Moran, M.S.; Du, J.Y. Validation of advanced microwave scanning radiometer soil moisture products. IEEE Trans. Geosci. Remote Sens. 2010, 48, 4256–4272. [Google Scholar] [CrossRef]
- Owe, M.; de Jeu, R.; Holmes, T. Multisensor historical climatology of satellite-derived global land surface moisture. J. Geophys. Res. Earth Surf. 2008. [Google Scholar] [CrossRef]
- Das, N.N.; Entekhabi, D.; Njoku, E.G. An algorithm for merging SMAP radiometer and radar data for high-resolution soil-moisture retrieval. IEEE Trans. Geosci. Remote Sens. 2011, 49, 1504–1512. [Google Scholar] [CrossRef]
- Reichle, R.; Koster, R.; De Lannoy, G.; Crow, W.; Kimball, J. Level 4 Surface and Root Zone Soil Moisture (L4_SM) Data Product. Available online: http://nsidc.org/sites/nsidc.org/files/files/272_L4_SM_RevA_web.pdf (accessed on 10 November 2016).
- Reichle, R.H.; De Lannoy, G.J.; Liu, Q.; Colliander, A.; Conaty, A.; Jackson, T.; Kimball, J.; Koster, R.D. Soil Moisture Active Passive (SMAP) Project Assessment Report for The Beta-Release L4_SM Data Product; NASA Technical Report Series on Global Modeling and Data Assimilation, NASA/TM-2015; NASA: Houston, TX, USA, 2015.
- Schaefer, G.L.; Cosh, M.H.; Jackson, T.J. The usda natural resources conservation service soil climate analysis network (scan). J. Atmos. Ocean. Technol. 2007, 24, 2073–2077. [Google Scholar] [CrossRef]
- Jin, S.M.; Yang, L.M.; Danielson, P.; Homer, C.; Fry, J.; Xian, G. A comprehensive change detection method for updating the national land cover database to CIRCA 2011. Remote Sens. Environ. 2013, 132, 159–175. [Google Scholar] [CrossRef]
- Entekhabi, D.; Yueh, S.; O’Neill, P.E.; Kellogg, K.H.; Allen, A.; Bindlish, R.; Brown, M.; Chan, S.; Colliander, A.; Crow, W.T. SMAP Handbook–Soil Moisture Active Passive: Mapping Soil Moisture and Freeze/Thaw From Space; Jet Propulsion Laboratory: Pasadena, CA, USA, 2014.
- Fang, H.; Wei, S.; Jiang, C.; Scipal, K. Theoretical uncertainty analysis of global MODIS, Cyclopes, and Globcarbon Lai products using a triple collocation method. Remote Sens. Environ. 2012, 124, 610–621. [Google Scholar] [CrossRef]
- Barber, M.; Grings, F.; Bruscantini, C.; Karszenbaum, H. Rationale behind an optimal field experiment to assess the suitability of soil moisture retrieval algorithms for SAR data. IEEE Geosci. Remote Sens. Lett. 2015, 12, 791–795. [Google Scholar] [CrossRef]
- Cho, E.; Choi, M. Regional scale spatio-temporal variability of soil moisture and its relationship with meteorological factors over the Korean Peninsula. J. Hydrol. 2014, 516, 317–329. [Google Scholar] [CrossRef]
- Dorigo, W.; Wagner, W.; Hohensinn, R.; Hahn, S.; Paulik, C.; Xaver, A.; Gruber, A.; Drusch, M.; Mecklenburg, S.; Oevelen, P.V. The international soil moisture network: A data hosting facility for global in situ soil moisture measurements. Hydrol. Earth Syst. Sci. 2011, 15, 1675–1698. [Google Scholar] [CrossRef]
- Hollinger, S.E.; Isard, S.A. A soil-moisture climatology of illinois. J. Clim. 1994, 7, 822–833. [Google Scholar] [CrossRef]
- Vivoni, E.R.; Gebremichael, M.; Watts, C.J.; Bindlish, R.; Jackson, T.J. Comparison of ground-based and remotely-sensed surface soil moisture estimates over complex terrain during SMEX04. Remote Sens. Environ. 2008, 112, 314–325. [Google Scholar] [CrossRef]
- Wagner, W.; Lemoine, G.; Rott, H. A method for estimating soil moisture from ERS scatterometer and soil data. Remote Sens. Environ. 1999, 70, 191–207. [Google Scholar] [CrossRef]


| Spatial Distribution | No. of Soil Moisture Sampling Stations | |
|---|---|---|
| Monthly Average | Daily Average | |
| Overall | 105 | 162 |
| West | 32 | 61 |
| Central | 28 | 37 |
| East | 45 | 64 |
| Open Water Ice/Snow | 0 | 3 |
| Deciduous/Evergreen Forest | 13 | 29 |
| Shrub/Scrub | 14 | 33 |
| Grassland/Herbaceous | 12 | 24 |
| Pasture/Hay | 35 | 33 |
| Cultivated Crops | 29 | 37 |
| Woody Wetlands | 2 | 3 |
| 15/Apr | 15/May | 15/Jun | 15/Jul | 15/Aug | 15/Sep | 15/Oct | 15/Nov | 15/Dec | 16/Jan | 16/Feb | 16/Mar | ||||
|---|---|---|---|---|---|---|---|---|---|---|---|---|---|---|---|
| Average(R) | Region | SMAP | West | 0.5 | 0.55 | 0.39 | 0.31 | 0.31 | 0.51 | 0.48 | 0.46 | 0.63 | 0.57 | 0.61 | 0.61 |
| Central | 0.73 | 0.64 | 0.7 | 0.7 | 0.68 | 0.71 | 0.73 | 0.77 | 0.83 | 0.81 | 0.72 | 0.73 | |||
| East | 0.48 | 0.52 | 0.47 | 0.48 | 0.31 | 0.2 | 0.47 | 0.56 | 0.52 | 0.51 | 0.59 | 0.55 | |||
| AMSR2 | West | 0.05 | 0.13 | 0.1 | 0.05 | −0.07 | 0.25 | 0.13 | 0.01 | −0.02 | −0.05 | −0.06 | 0.06 | ||
| Central | 0.24 | 0.28 | 0.37 | 0.2 | 0.07 | 0.18 | 0.16 | 0.21 | 0.32 | 0.27 | 0.11 | 0.25 | |||
| East | 0.16 | 0.17 | 0.01 | 0.09 | 0.16 | 0.22 | 0.16 | 0.2 | 0.17 | 0.09 | 0.18 | 0.25 | |||
| Land Cover Type | SMAP | Deciduous/Evergreen Forest | 0.77 | 0.59 | 0.72 | 0.78 | 0.65 | 0.68 | 0.7 | 0.66 | 0.66 | 0.6 | 0.63 | 0.59 | |
| Shrub/Scrub | 0.56 | 0.68 | 0.57 | 0.34 | 0.09 | 0.16 | 0.36 | 0.57 | 0.72 | 0.77 | 0.8 | 0.85 | |||
| Grassland/Herbaceous | 0.59 | 0.81 | 0.68 | 0.69 | 0.65 | 0.63 | 0.52 | 0.72 | 0.81 | 0.84 | 0.71 | 0.59 | |||
| Pasture/Hay | 0.59 | 0.47 | 0.58 | 0.59 | 0.51 | 0.33 | 0.31 | 0.56 | 0.66 | 0.57 | 0.45 | 0.33 | |||
| Cultivated Crops | 0.75 | 0.7 | 0.68 | 0.67 | 0.59 | 0.58 | 0.61 | 0.72 | 0.76 | 0.77 | 0.71 | 0.7 | |||
| AMSR2 | Deciduous/Evergreen Forest | 0.46 | 0.29 | 0.25 | 0.15 | 0.02 | 0.31 | 0.2 | 0.35 | 0.29 | 0.09 | 0.16 | 0.18 | ||
| Shrub/Scrub | 0.03 | 0.26 | 0.25 | 0.05 | 0.12 | 0.23 | 0.29 | 0.21 | −0.07 | −0.21 | −0.27 | 0.09 | |||
| Grassland/Herbaceous | 0.26 | 0.39 | 0.34 | 0.28 | −0.01 | 0.23 | 0.09 | 0.25 | 0.26 | 0.23 | −0.04 | 0.03 | |||
| Pasture/Hay | 0.27 | 0.3 | 0.22 | 0.28 | 0.31 | 0.44 | 0.12 | 0.14 | 0.35 | 0.37 | 0.33 | 0.24 | |||
| Cultivated Crops | 0.47 | 0.33 | 0.28 | 0.24 | 0.21 | 0.07 | 0.1 | 0.4 | 0.36 | 0.35 | 0.27 | 0.37 | |||
| Standard Deviation(R) | Region | SMAP | West | 0.16 | 0.09 | 0.16 | 0.15 | 0.1 | 0.1 | 0.15 | 0.1 | 0.07 | 0.11 | 0.08 | 0.08 |
| Central | 0.1 | 0.1 | 0.09 | 0.12 | 0.11 | 0.07 | 0.1 | 0.07 | 0.05 | 0.07 | 0.08 | 0.08 | |||
| East | 0.19 | 0.18 | 0.21 | 0.13 | 0.1 | 0.17 | 0.19 | 0.14 | 0.15 | 0.16 | 0.15 | 0.11 | |||
| AMSR2 | West | 0.23 | 0.23 | 0.19 | 0.19 | 0.12 | 0.16 | 0.24 | 0.21 | 0.29 | 0.24 | 0.19 | 0.21 | ||
| Central | 0.26 | 0.24 | 0.26 | 0.28 | 0.29 | 0.21 | 0.21 | 0.23 | 0.21 | 0.23 | 0.23 | 0.25 | |||
| East | 0.23 | 0.18 | 0.19 | 0.22 | 0.25 | 0.15 | 0.26 | 0.27 | 0.24 | 0.26 | 0.22 | 0.2 | |||
| Land Cover Type | SMAP | Deciduous/Evergreen Forest | 0.13 | 0.15 | 0.09 | 0.06 | 0.09 | 0.11 | 0.14 | 0.1 | 0.11 | 0.14 | 0.15 | 0.2 | |
| Shrub/Scrub | 0.15 | 0.15 | 0.17 | 0.21 | 0.22 | 0.24 | 0.34 | 0.11 | 0.08 | 0.07 | 0.1 | 0.06 | |||
| Grassland/Herbaceous | 0.12 | 0.1 | 0.11 | 0.16 | 0.19 | 0.19 | 0.29 | 0.07 | 0.06 | 0.08 | 0.12 | 0.11 | |||
| Pasture/Hay | 0.07 | 0.13 | 0.1 | 0.12 | 0.14 | 0.2 | 0.25 | 0.12 | 0.09 | 0.1 | 0.15 | 0.13 | |||
| Cultivated Crops | 0.06 | 0.1 | 0.13 | 0.12 | 0.09 | 0.08 | 0.19 | 0.09 | 0.06 | 0.09 | 0.08 | 0.08 | |||
| AMSR2 | Deciduous/Evergreen Forest | 0.2 | 0.25 | 0.27 | 0.3 | 0.27 | 0.17 | 0.35 | 0.24 | 0.27 | 0.29 | 0.3 | 0.29 | ||
| Shrub/Scrub | 0.29 | 0.35 | 0.3 | 0.24 | 0.23 | 0.27 | 0.42 | 0.31 | 0.37 | 0.29 | 0.28 | 0.31 | |||
| Grassland/Herbaceous | 0.15 | 0.26 | 0.29 | 0.31 | 0.25 | 0.24 | 0.33 | 0.21 | 0.21 | 0.22 | 0.21 | 0.19 | |||
| Pasture/Hay | 0.26 | 0.21 | 0.25 | 0.27 | 0.27 | 0.18 | 0.37 | 0.31 | 0.29 | 0.16 | 0.19 | 0.17 | |||
| Cultivated Crops | 0.22 | 0.22 | 0.21 | 0.22 | 0.26 | 0.14 | 0.29 | 0.32 | 0.26 | 0.26 | 0.3 | 0.26 | |||
| Spatial Distribution | Daily Average | Monthly Average | ||||
|---|---|---|---|---|---|---|
| In Situ | SMAP | AMSR2 | In Situ | SMAP | AMSR2 | |
| Overall | 0.102 | 0.007 | 0.207 | 0.02 | 0.019 | 0.087 |
| Deciduous/Evergreen Forest | 0.004 | 0.012 | 0.995 | 0.014 | 0.066 | 5.049 |
| Shrub/Scrub | 0.023 | 0.004 | 2.434 | 0.065 | 0.03 | 0.393 |
| Grassland/Herbaceous | 0.033 | 0.019 | 0.674 | 0.052 | 0.025 | 1.004 |
| Pasture/Hay | 0.015 | 0.021 | 0.598 | 0.034 | 0.079 | 0.099 |
| Cultivated Crops | 0.009 | 0.01 | 0.115 | 0.038 | 0.03 | 0.097 |
| West | 0.07 | 0.051 | 8.71 | 0.03 | 0.076 | 1.055 |
| Central | 0.011 | 0.003 | 0.363 | 0.023 | 0.012 | 0.249 |
| East | 0.01 | 0.023 | 0.437 | 0.037 | 0.141 | 0.397 |
| Month | In Situ | SMAP | AMSR2 |
|---|---|---|---|
| January | 0.018 | 0.017 | 0.029 |
| February | 0.025 | 0.019 | 0.055 |
| March | 0.137 | 0.126 | 1.635 |
| April | 0.019 | 0.019 | 4.183 |
| May | 0.037 | 0.050 | 0.185 |
| June | 0.043 | 0.044 | 0.070 |
| July | 0.099 | 0.137 | 0.161 |
| August | 0.053 | 0.042 | 0.147 |
| September | 0.039 | 0.033 | 0.125 |
| October | 0.295 | 0.297 | 4.661 |
| November | 0.021 | 0.023 | 0.055 |
| December | 0.024 | 0.022 | 0.082 |
© 2017 by the authors. Licensee MDPI, Basel, Switzerland. This article is an open access article distributed under the terms and conditions of the Creative Commons Attribution (CC BY) license ( http://creativecommons.org/licenses/by/4.0/).
Share and Cite
Zhang, X.; Zhang, T.; Zhou, P.; Shao, Y.; Gao, S. Validation Analysis of SMAP and AMSR2 Soil Moisture Products over the United States Using Ground-Based Measurements. Remote Sens. 2017, 9, 104. https://doi.org/10.3390/rs9020104
Zhang X, Zhang T, Zhou P, Shao Y, Gao S. Validation Analysis of SMAP and AMSR2 Soil Moisture Products over the United States Using Ground-Based Measurements. Remote Sensing. 2017; 9(2):104. https://doi.org/10.3390/rs9020104
Chicago/Turabian StyleZhang, Xuefei, Tingting Zhang, Ping Zhou, Yun Shao, and Shan Gao. 2017. "Validation Analysis of SMAP and AMSR2 Soil Moisture Products over the United States Using Ground-Based Measurements" Remote Sensing 9, no. 2: 104. https://doi.org/10.3390/rs9020104
APA StyleZhang, X., Zhang, T., Zhou, P., Shao, Y., & Gao, S. (2017). Validation Analysis of SMAP and AMSR2 Soil Moisture Products over the United States Using Ground-Based Measurements. Remote Sensing, 9(2), 104. https://doi.org/10.3390/rs9020104