Article

Decline of Geladandong Glacier Elevation in Yangtze River’s Source Region: Detection by ICESat and Assessment by Hydroclimatic Data

1
MOE Key Laboratory of Fundamental Physical Quantities Measurement, School of Physics, Huazhong University of Science and Technology, Wuhan 430074, China
2
School of Geodesy and Geomatics, Wuhan University, Wuhan 430079, China
3
Department of Civil Engineering, National Chiao Tung University, 1001 Ta Hsueh Rd., Hsinchu 300, Taiwan
*
Author to whom correspondence should be addressed.
Remote Sens. 2017, 9(1), 75; https://doi.org/10.3390/rs9010075
Submission received: 3 August 2016 / Revised: 28 November 2016 / Accepted: 10 January 2017 / Published: 14 January 2017
(This article belongs to the Special Issue Earth Observations for a Better Future Earth)

Abstract

:
Several studies have indicated that glaciers in the Qinghai-Tibet plateau are thinning, resulting in reduced water supplies to major rivers such as the Yangtze, Yellow, Lancang, Indus, Ganges, Brahmaputra in China, and south Asia. Three rivers in the upstream of Yangtze River originate from glaciers around the Geladandong snow mountain group in central Tibet. Here we used elevation observations from Ice, Cloud, and land Elevation Satellite (ICESat) and reference elevations from a 3-arc-second digital elevation model (DEM) of Shuttle Radar Terrestrial Mission (SRTM), assisted with Landsat-7 images, to detect glacier elevation changes in the western (A), central (B), and eastern (C) regions of Geladandong. Robust fitting was used to determine rates of glacier elevation changes in regions with dense ICESat data, whereas a new method called rate averaging was employed to find rates in regions of low data density. The rate of elevation change was −0.158 ± 0.066 m·a−1 over 2003–2009 in the entire Geladandong and it was −0.176 ± 0.102 m·a−1 over 2003–2008 in Region C (by robust fitting). The rates in Regions A, B, and C were −0.418 ± 0.322 m·a−1 (2000–2009), −0.432 ± 0.020 m·a−1 (2000–2003), and −0.321 ± 0.139 m·a−1 (2000–2008) (by rate averaging). We used in situ hydroclimatic dataset to assess these negative rates: the glacier thinning was caused by temperature rises around Geladandong, based on the temperature records over 1979–2009, 1957–2013, and 1966–2013 at stations Tuotuohe, Wudaoliang, and Anduo. The thinning Geladandong glaciers led to increased discharges recorded at the river gauge stations Tuotuohe and Chumda over 1956–2012. An unabated Geladandong glacier melting will reduce its long-term water supply to the Yangtze River Basin, causing irreversible socioeconomic consequences and seriously degrading the ecological system of the Yangtze River Basin.

Graphical Abstract

1. Introduction

The Geladandong snow mountain group (90.5°–91.68°E, 33°–33.83°N) is located in the central Qinghai-Tibet plateau (QTP), and is part of the Tanggula Mountains, covering a region that provides source water to three major rivers in Asia (Figure 1). Below we will simply name the Geladandong snow mountain group “Geladandong” for brevity. Geladandong is within Amdo County, Nagqu Prefecture, in the Tibet Autonomous Region. The highest peak here is the Geladandong Snow Mountain, which is also the highest peak in the Tanggula Mountains. With a north–south dimension of 50 km and a west–east dimension of 30 km, Geladandong is home to more than 30 peaks higher than 6000 m. Geladandong has a persistent snow-covered area of about 1000 km2 and nurtures more than 130 glaciers. These glaciers supply water to Tuotuo River, ChiSuMei River, and Garang River around Geladandong. Tuotuo River is one of the origins of the Yangtze River and derives its water from JiangGudi Glacier west of Geladandong. ChiSuMei River originates from ChiSuMei Glacier in northern Geladandong and is a tributary of the Tuotuo River. Finally, Garang River flows northwards from GangJiaqu Glacier and is widely recognized as the official origin of the Yangtze River. According to Farrington [1], the four most important rivers in the Yangtze River’s source region (YRSR) are Tongtian (or upper Yangtze) River, Tuotuo River, Chumda River, and Dam Chu River. Figure 1a shows the locations of these rivers and the watershed of YRSR that includes these rivers.
Geladandong is an ideal spot for studying regional responses to global climate change, thanks to its extreme environment and rare human interference, which make it sensitive to climate change. The inaccessibility of Geladandong results in a lack of ground-based, continuous glacier elevation measurements. Because Geladandong glaciers supply water to the Yangtze River, its state is important for understanding how climate change affects the hydrological cycle of the Yangtze River Basin. It is estimated that, from the time of the Little Ice Age (LIA) to 1969, the area of Geladandong has shrunk by 5.6%, equivalent to an annual reduction rate of 0.02% [2,3]. In the past few decades, climate change has led to increased temperatures near the source region of the Yangtze River, resulting in glacier retreat around Geladandong and negative glacier mass balances in the Tanggula Mountains and Dongkemadi Ice Cap at a rate of −0.58 ± 0.31 m·w.e.a−1 during 2003–2009 [4] and a glacier elevation change rate at of −0.1 ± 2.2 m·a−1 during 2003–2009 in the East Kunlun and Inner Tibet [5]. Although glacier elevation changes around Geladandong have been investigated, the data are too sparse when compared to the size of the studied area. Moreover, little is known about the overall characteristics of glacier changes here and how the changes are correlated with weather records and river discharges in YRSR over the past decades.
Contemporary studies of the glacier state in a region are typically based on remote sensing techniques such as satellite imagery, digital elevation models (DEMs), and photogrammetry. With auxiliary data, such techniques can also estimate glacier mass balance in the region, which is one of the most important parameters for studying global climate change [6,7]. Due to the complicated topography, the vastness, and scarce ground-based observations, current estimates of glacier mass balance over the QTP contain large uncertainties [4,5,8,9]. Traditional glaciological measurements using methods such as direction intersection of theodolite, establishment of marks recording glacial advancing and retreating in the glacier tongue at a particular glacier site are typically available over a relatively short period of time [10,11,12,13]. For a glacier in an inaccessible area, collecting glaciological measurements can be difficult even if possible. Furthermore, due to problems in post-processing ground-based measurements, biases may occur over small and medium-sized glaciers and over areas covered by glacier debris [9]. For example, Vincent et al. [14] pointed out that information on recent glacier changes is based on sparse data, and the changes of these glaciers represented in such data contain large uncertainties. Additionally, there is an urgent need to maintain and develop long-term ground-based surface mass balance observations on benchmark glaciers in the Himalayas, whether they are covered by debris or not. Another example is given by Gardner et al. [5], who showed that, because of the short time spans in the in situ glacier measurements, the actual glacier mass losses over 2003–2009 in the entire high Asia area may be three times higher than the current estimates.
There are a number of methods for assessing glacier mass balance. A handbook for traditional stake-based methods is given by Ostrem and Brugman, available at the website of the World Glacier Monitoring Service [15]. One such method is based on the accumulation area ratio (AAR) of glacier and the method relies heavily on the availability of glaciological mass balances during various years in order to establish an empirical relationship between annual mass balance and AAR [16]. The extrapolation to unmeasured glaciers is not straightforward. This method has been applied by Kulkarni et al. [17] to 19 glaciers in northwest India. Another method is based on local hydrological measurements and such a hydrology-based method has been applied to the Pamir-Karakoram-Himalaya (PKH) areas. However, the hydrology-based method requires good precipitation and discharge measurements at high altitudes, making it difficult to use in practice [13,18].
A satellite-based method for estimating glacier mass balance uses measurements from the mission Gravity Recovery and Climate Experiment (GRACE). This method has been used to assess glacier changes over the Himalayas [8,19]. In the studies of Gardner et al. [5] and Matsuo et al. [19], GRACE-derived glacier losses in high-altitude regions of Asia (−14 ± 17 Gt·a−1, −23 ± 24 Gt·a−1 during August 2003–August 2009) are consistent with ground-based measurements within a two-standard error 95% confidence interval. However, GRACE estimates of glacier change suffer from low temporal and spatial resolutions, and Glacial Isostatic Adjustment (GIA) and hydrological corrections are needed for producing the final results [20].
Glacier mass balance can also be estimated using glacier elevation changes and snow/glacier densities. A direct method for detecting glacier elevation changes is based on measurements of glacier heights at different times. Such glacier elevation changes can be subsequently used to determine volume changes and mass balance [4,5,21,22,23,24,25,26,27]. In addition, the retreat of a mountain glacier terminus is associated with decreases in glacier elevations. Over a large area, a satellite-based method is the only feasible method to detect glacier elevation changes. Currently, the only laser altimeter mission serving this need is the ICE, Cloud, and Land Elevation satellite (ICESat). Because ICESat does not have exactly repeated ground tracks in the QTP, it can detect glacier elevation changes over a rugged terrain only with the assistance of a reference elevation model such as that from the Shuttle Radar Terrestrial Mission (SRTM), see Section 2. Also, satellite imagery, such as optical images, is typically used to judge whether an ICESat measurement is over a glacier. This ICESat-based method allows for measurements of elevations, slopes, and debris-covered percentages over a glacier [5,21,22,23,24,25]. However, ICESat observations can be sparse over a targeted glacier-covered area, making it difficult to form a reasonable time series of elevation changes that can be used to determine the rate and seasonal to inter-annual oscillations of the changes. Because of the potential problems of ICESat in data density and quality, results from ICESat should be assessed by ground observations or by results from independent remote sensing tools.
Previous ICESat studies of glacier changes around Geladandong such as [4,5] have provided useful information on the elevation changes around Geladandong. However, these studies did not provide a detailed analysis on why the elevations of the Geladandong glacier changed and the factors leading to the changes. It is likely that one can still improve ICESat’s data processing and error analysis techniques. One can also confirm Geladandong’s glacier state from ICESat using more ground data than were presented in previous studies. As such, this paper will focus on improved ICESat data processing and a ground-based assessment of ICESat-derived results. First, we will determine glacier elevation changes around Geladandong over 2000–2009 using ICESat measurements, a DEM of SRTM and Landsat-7 imagery. Second, we will investigate the correlations between glacier elevation changes and temperature and river discharge changes around Geladandong. The in situ hydroclimatic data we will use include river discharge records at stations Tuotuohe (Geladandong) and Chumda (eastern Tibet), and temperature records at stations Tuotuohe, Wudaoliang, and Anduo (Figure 1a). The novelty in this paper is (1) devising a new method to determine rates of glacier elevation changes when ICESat observations are sparse and (2) assessing the ICESat-estimated rates using in situ hydroclimatic dataset. We will propose a simple cause–effect scenario that will help to understand the response of Geladandong glaciers to ongoing and future climate change.

2. Data and Methods

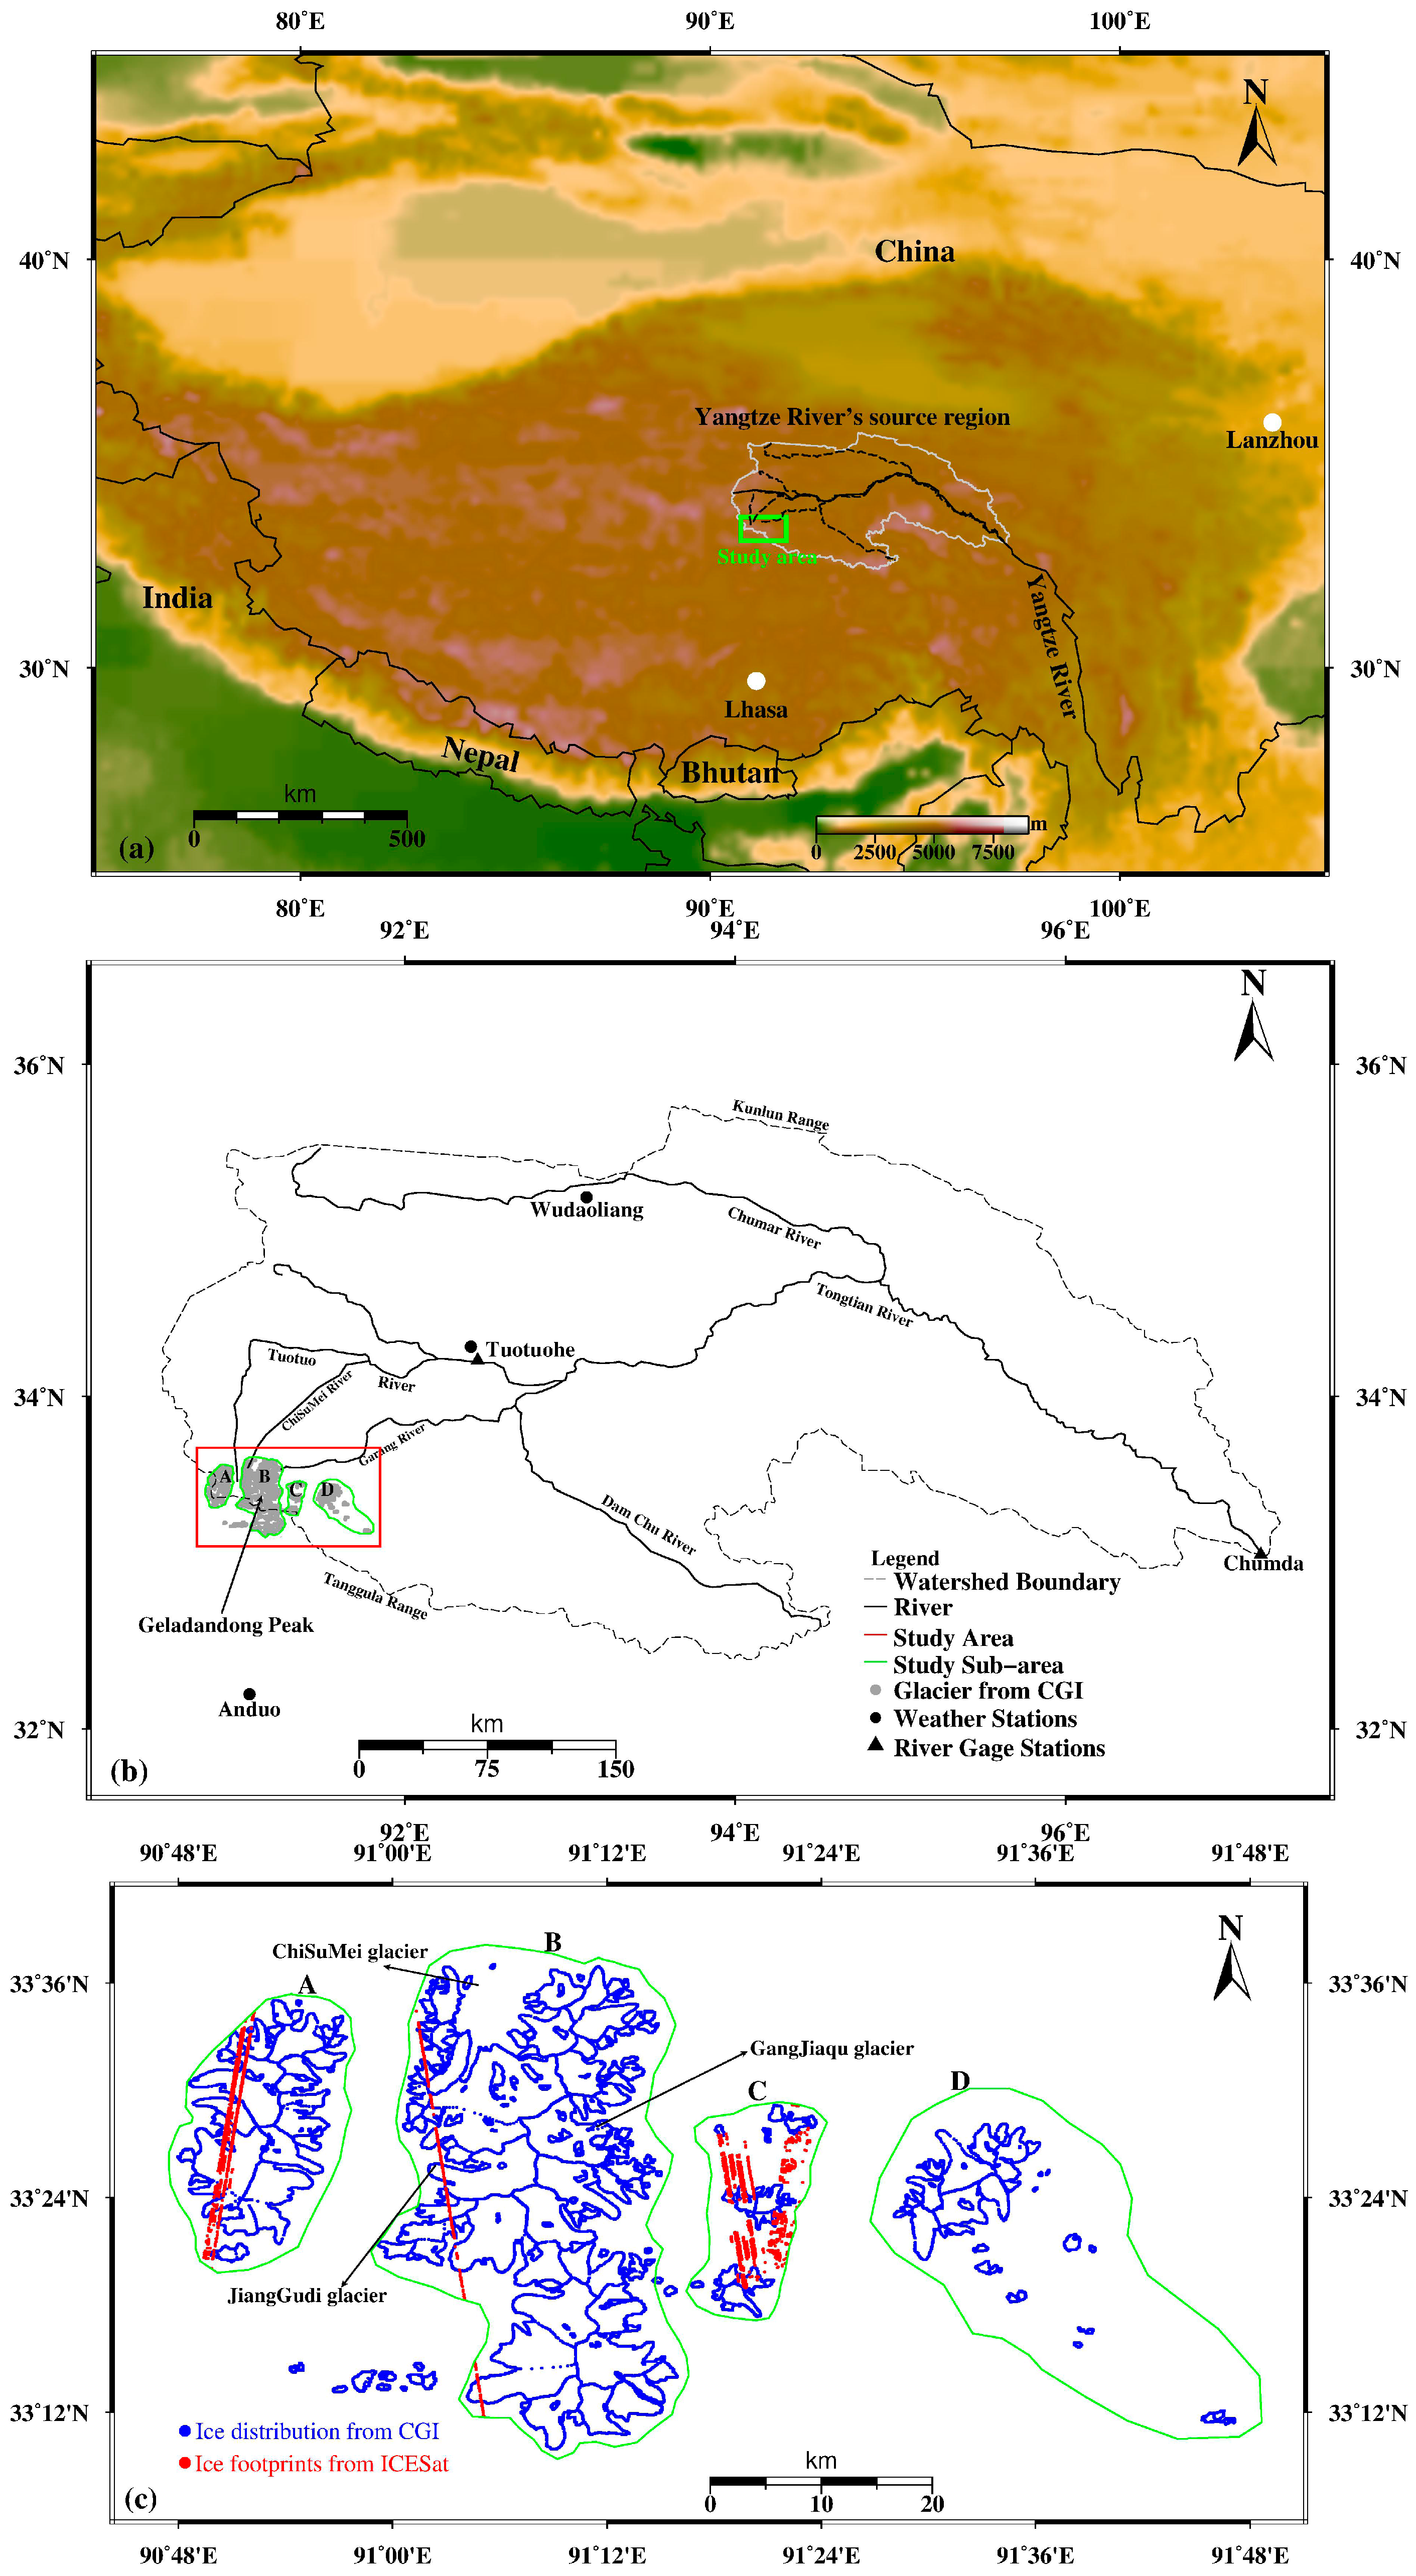
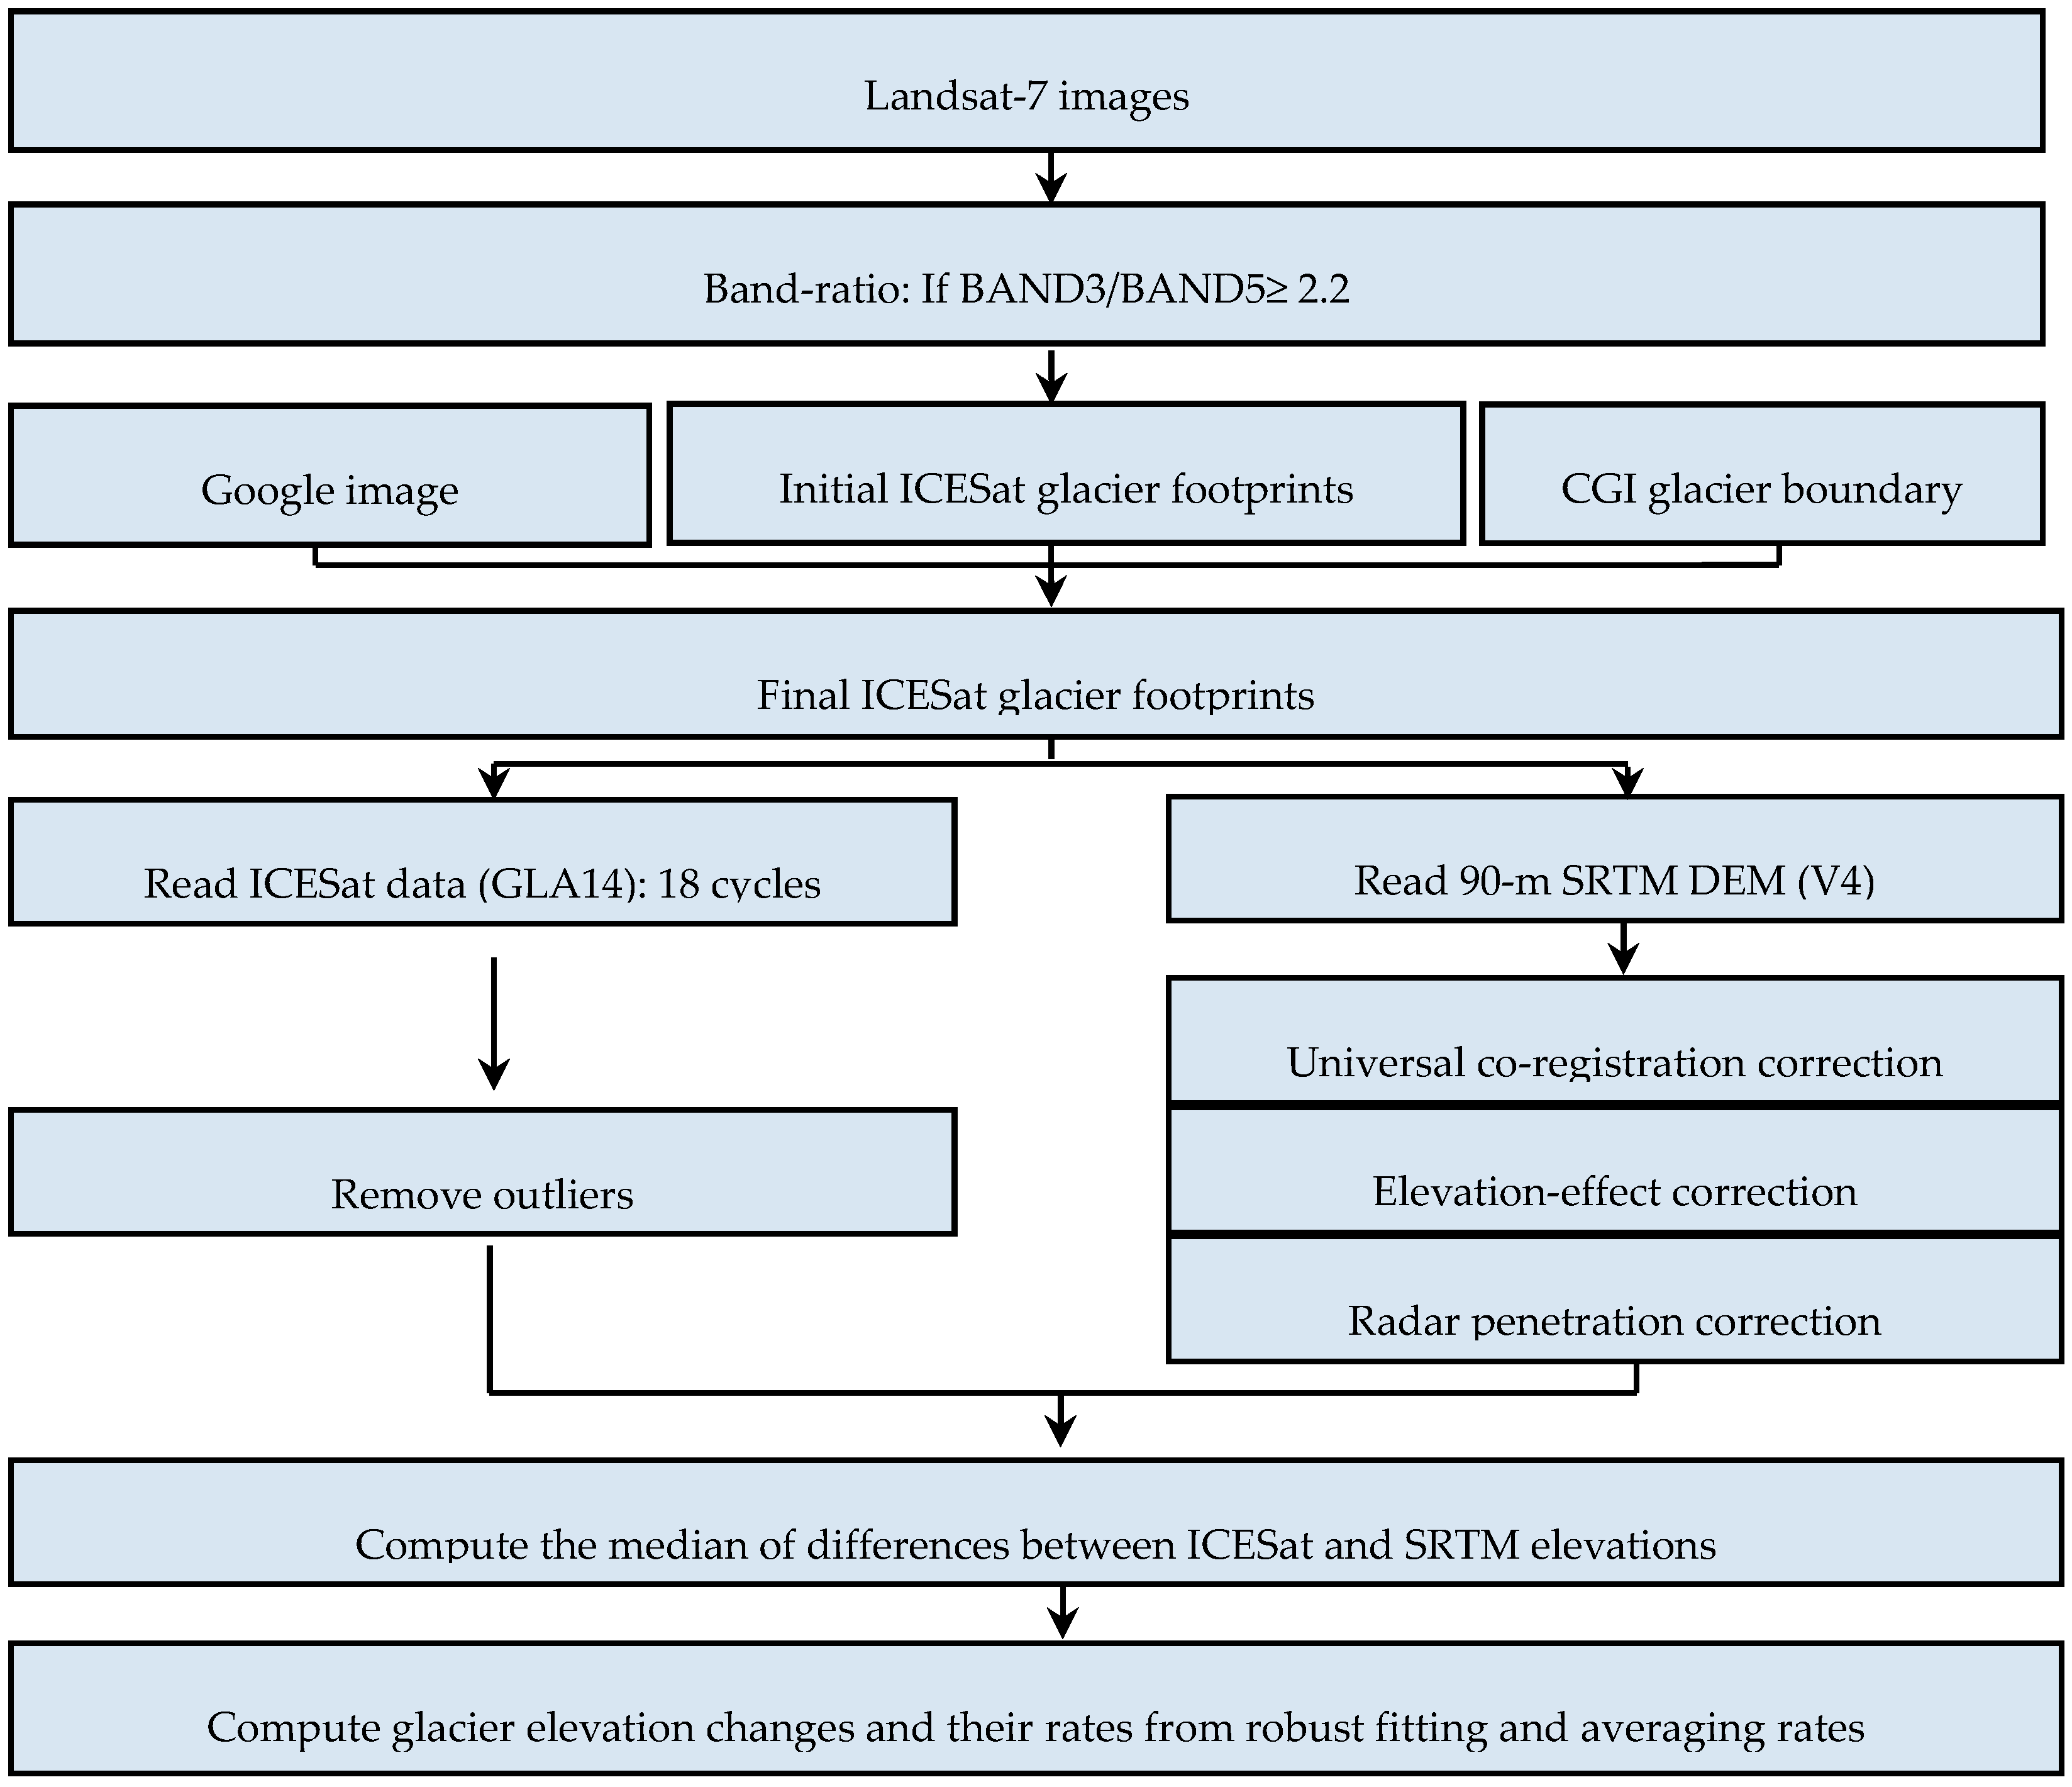
2.1. Landsat-7 Imagery for Glacier Identification

In this paper, we use a method that is based on the principle that snow and ice in the visible light spectra are strongly reflective, and absorptive in the infrared spectra, making it possible to determine whether an ICESat footprint is over glaciers [23,28,29]. We find that a ratio from BAND3/BAND5 is able to extract boundaries of shadow-covered glaciers better than a ratio from BAND4/BAND5, thus we decided to use the former to determine whether an ICESat footprint is over glaciers. Here, at a given pixel, Band3, Band4, and Band5 refer to spectral values at the red, and near-infrared (wavelength ~micrometer) bands, respectively. Based on our experiments using a large number of images, an optimal ratio threshold is key to the success of the band-ratio threshold method. The optimal threshold value depends on the image quality. For removing seasonal snow effects, BAND3/BAND5 ratios around 2.0 ± 0.2 are best.
Using Landsat-7 images on 10 July 1999 (path 138 and row 37) and on 3 June 2000 (path 137 and row 37), for which the atmospheric corrections have been applied, we made a preliminary judgement on the ICESat footprints that are over Geladandong glaciers using the criterion that ratios BAND3/BAND5 ≥2.2. Then, based on the Chinese Glacier Inventory (CGI, [30,31]) and Google Earth images, we determined the final ICESat footprints suitable for studying elevation changes over Geladandong glaciers (Figure 1b). Using the distribution of glaciers, we divided Geladandong into Regions A (west), B (center), and C (east). Region D is also shown in Figure 1b, but it does not contain ICESat observations. In summary, the following procedure is used to identify ICESat footprints for glacier change detection:
(1)
If the ratio Band3/Band5 is greater than 2.2, the footprint is a candidate point over glacier;
(2)
If the candidate point is not within a polygon of glaciers (Figure 1b) but is over an ice surface given by an Google Earth Image (23 June 2007 from CNES/Spot image), it is regarded as a point over glaciers;
(3)
If the candidate is neither within a glacier polygon nor over an ice surface defined by a Google image, it is not regarded as a point over glaciers.

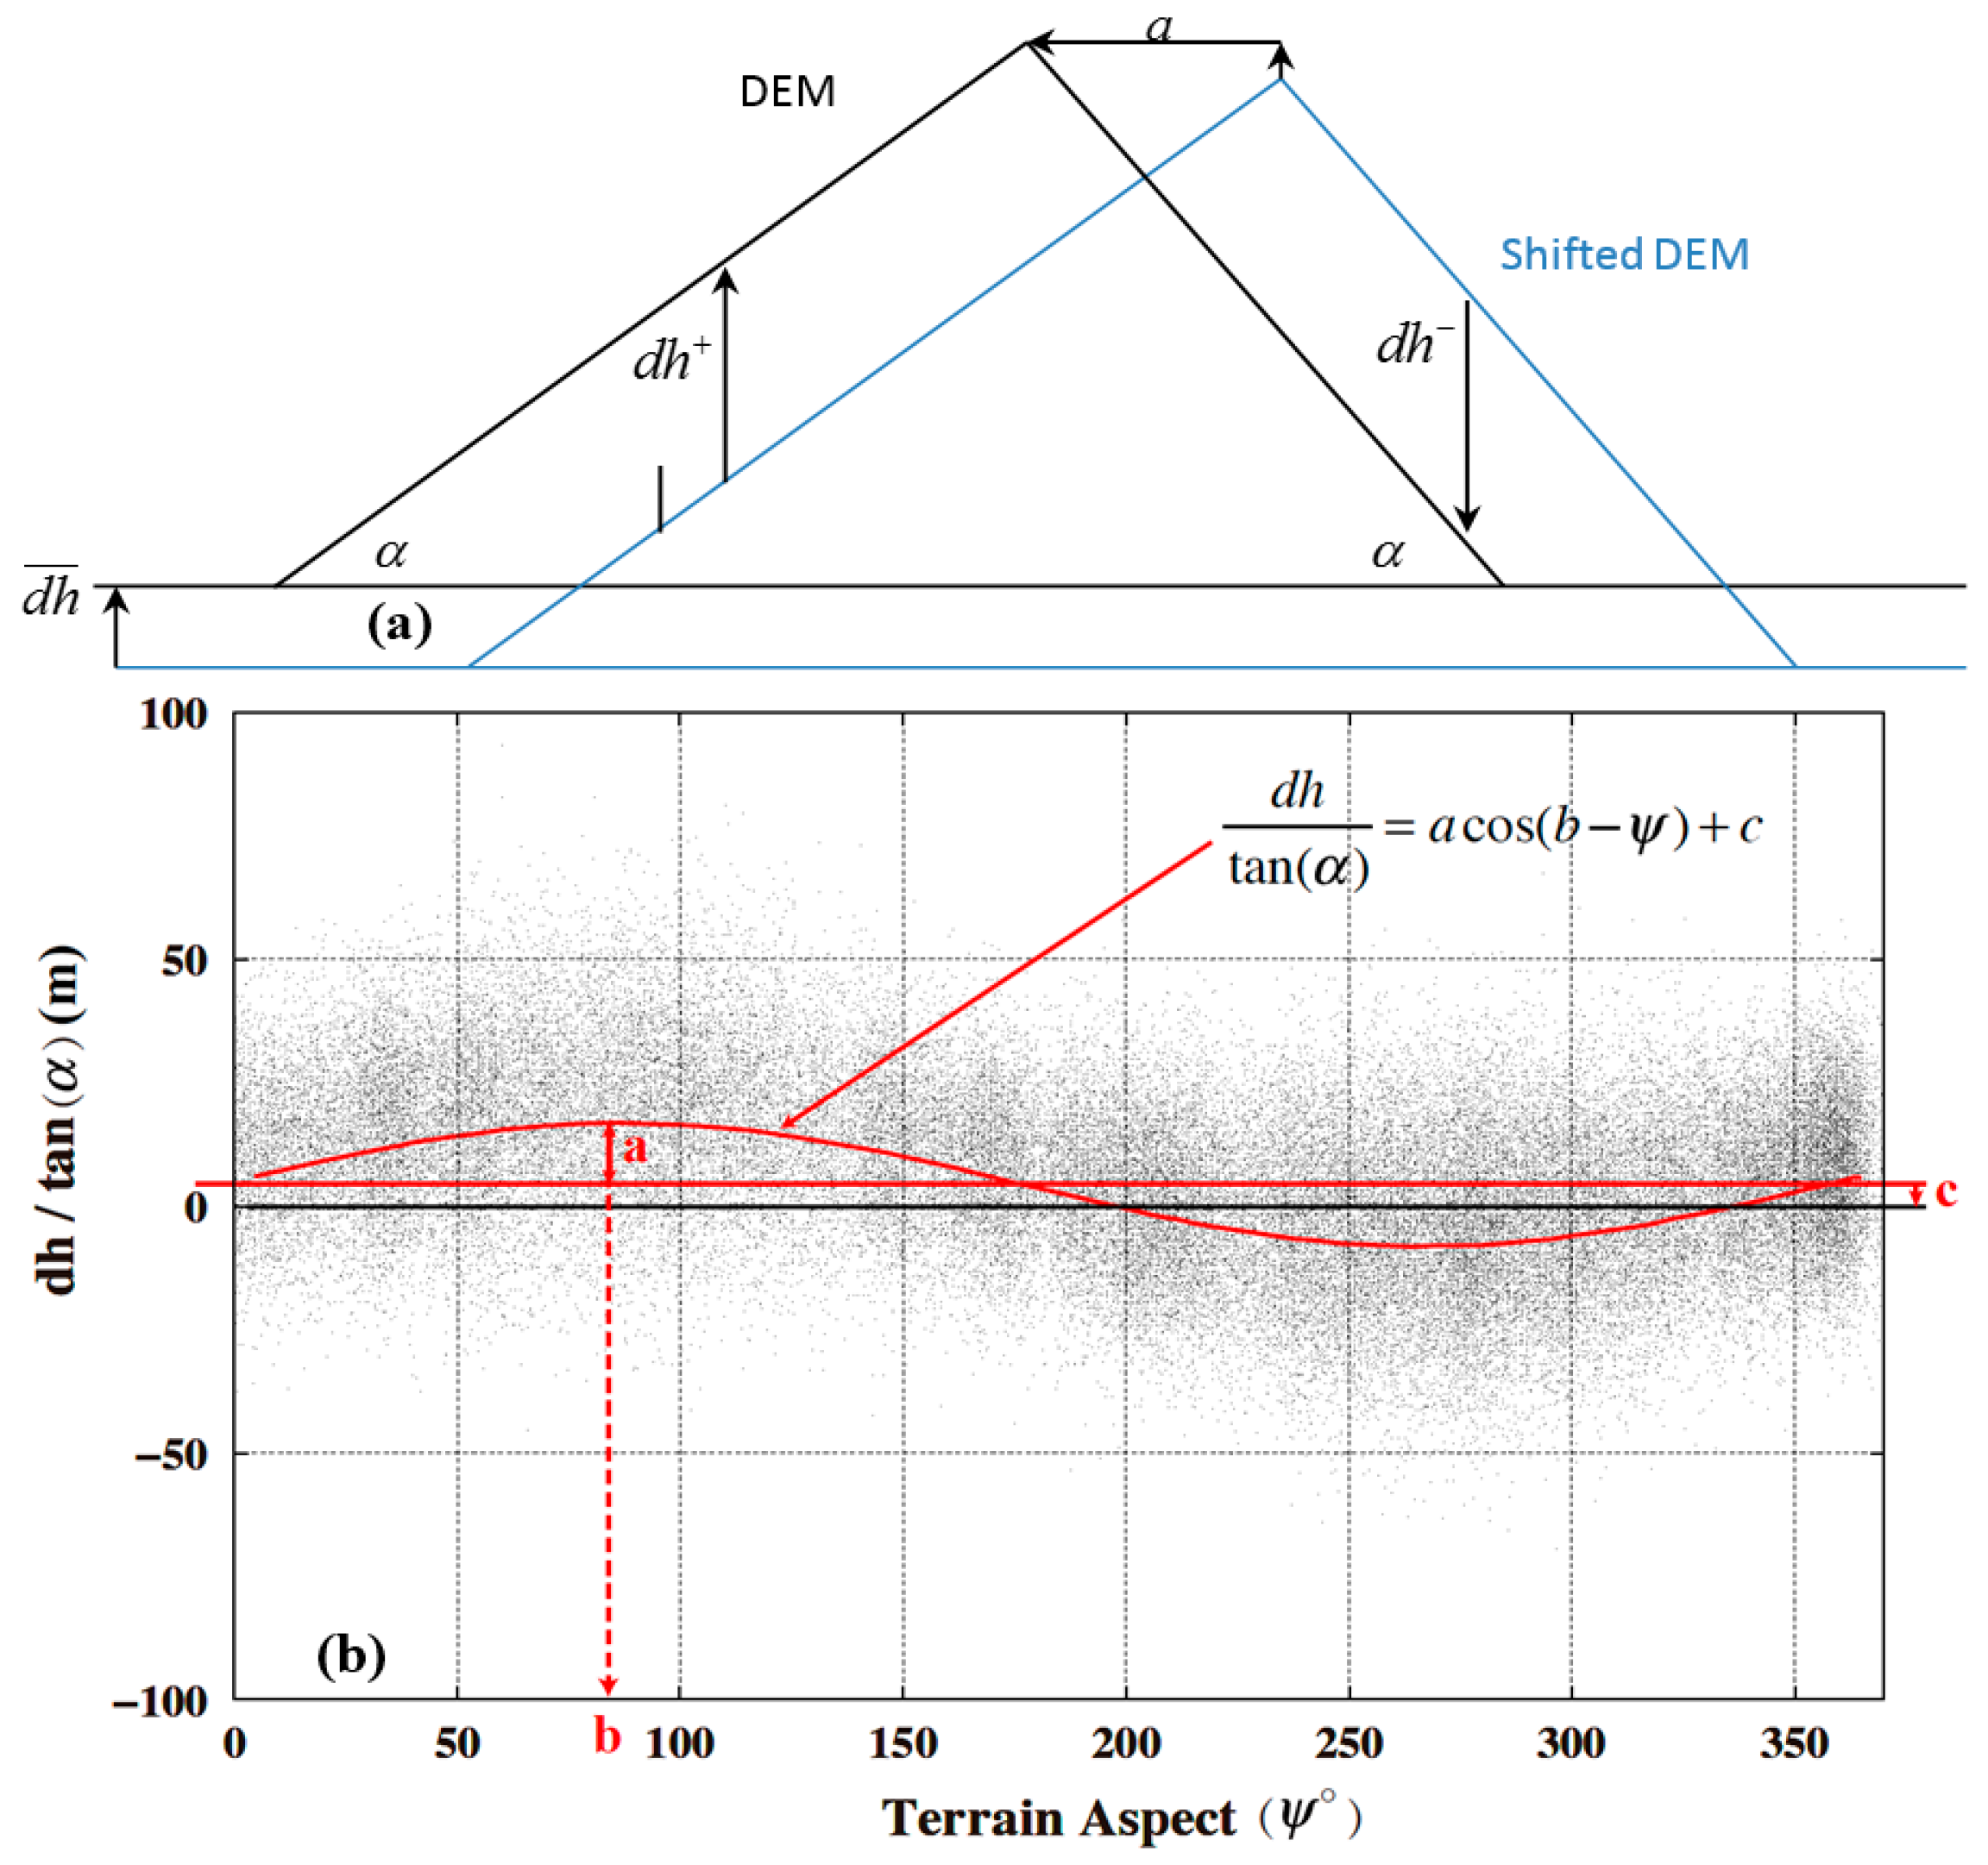
2.2. Reference Elevations from SRTM

Because ICESat did not repeat exact ground tracks in the Geladandong, a reference DEM is needed to detect glacier elevation changes from ICESat’s height measurements. The reference DEM used in this paper is from the SRTM mission. SRTM uses an interferometric synthetic aperture radar (InSAR) to measure elevations within latitudes between 60° N to 56° S. The mission was launched on 11 February 2000, collecting data in a total of 222 h and 23 min. SRTM-derived elevations have a mean vertical accuracy of ±16 m. The elevation accuracy will be improved as the processing techniques for the raw SRTM data are upgraded. In this paper, we used the 3-arc-second gridded DEM of SRTM, namely V4 [32], to determine reference elevations for ICESat-derived elevations. According to Nuth and Kääb [33] and Gardelle et al. [34], an elevation from a DEM of SRTM cannot be directly used to determine a differenced elevation with an ICESat-derived elevation; it requires corrections for universal co-registration, elevation effect and radar penetration effect. A brief description of the corrections applied to SRTM DEMs in this paper is as follows.
(1) A universal co-registration correction (errors due to different coordinate frames)
If the geodetic reference frames for two different DEMs over the same terrain surface are not the same, apparent elevation differences will occur. Such reference frame-induced differences can be modeled as [33]:
d h tan ( α ) = a cos ( b ψ ) + c ,
where d h is the individual elevation difference, α is the terrain slope, a is the magnitude of the horizontal shift, b is the direction of the shift vector, and ψ is the terrain aspect. In Equation (1), c is a constant representing the following ratio:
c = d h ¯ tan ( α ¯ ) ,
where d h ¯ is the mean elevation difference between the two elevation datasets and α ¯ is the mean slope. Given observations d h , ψ , and α from two DEMs, Equation (1) was used to set up observation equations to solve for the three parameters ( a , b , c ) using the least-squares method. The terrain aspect ( ψ ) was considered a known parameter associated with the two DEMs. Slopes and aspects were calculated by a standard GIS package. The parameters were then used for the universal co-registration correction. In Figure 2, we demonstrate the theory of the universal correction using a Global Digital Elevation Model (GDEM) from the Advanced Spaceborne Thermal Emission and Reflection Radiometer (ASTER) at [35] and a DEM from SRTM over Geladandong. The original grid interval of ASTER is 30 m. We re-sampled the original grid onto a 3-arc-second grid, which was then differenced with the 3-arc-second SRTM DEM. Figure 2a shows the effect due to the difference between the two coordinate frames, and Figure 2b shows the “observed” elevation differences between the DEMs from ASTER and SRTM. The differences follow the function given in Equation (1). In Figure 2, The ASTER DEM has a nominal spatial resolution of 30 m and is from Version 2 of ASTER GDEM that is constructed from satellite images over 2000–2011 acquired in the ASTER mission.
(2) Elevation-dependent correction
An elevation-dependent bias results from an uneven spatial distribution of the ground control points in the x-y-z planes that leads to a poorly resolved stereo orientation. A poor orientation can also cause a distortion in the z-scale in the measurement of parallaxes. We model such biases using [33]:
d h = k Z + τ ,
where d h is bias, Z is elevation, and k and τ are the regression parameters. Previous studies show that elevation-dependent biases range from 1 to 40 m per 1000 m [21,36]. Given d h as observations, Equation (3) was used to solve for the two parameters using the method of Robust Linear Regression [37].
(3) Radar penetration correction
Another error source in glacier elevation changes determined using only one radar frequency is radar penetration depth. For SRTM, penetration depths of the C-band radar can be estimated using the differences in heights measured by its X-band (9.7 GHz) and C-band (5.7 GHz) radars. This is possible because the X-band radar has a short wave length that produces negligible penetration depths. However, the X-band radar generates along-track DEMs at a swath width of about 50 km, making possible the estimation of the C-band radar penetration depths along only selected strips. In addition, DEMs from the SRTM X-band radar are accessible over only limited parts of the world. According to Gardelle et al. [34], DEMs from SRTM’s C-band radar are subject to height-dependent biases at altitudes >5000 m, reaching ~5 m at 6000 m. Over the Geladandong glacier, we cannot obtain measurements from SRTM’s X-band radar, so here we lack reliable estimates of the height-dependent biases due to radar penetration. However, we infer that the elevations over the snow-covered areas of Geladandong should be about 2–3 m larger than the true elevations. As such, we adopted a constant value of 3 m to correct for the C-band radar penetration effect around Geladandong.

2.3. ICESat Altimetry for Determining Glacier Elevation Changes and Change Rates

The ICESat laser altimeter measures elevations in 18 cycles, with each cycle lasting 12–15 days. Previous studies, such as Baghdadi et al. [38], have shown that the mean accuracy of ICESat-derived elevations over flat deserts is ±15 cm and the mean accuracy of differenced elevations at crossover points over glaciers of gentle slopes is ±1 m. However, as ICESat’s precision spacecraft pointing control was not used in the mid-latitudes between 59° S and 59° N, over a rugged terrain like the QTP it is difficult to obtain reliable elevation changes from ICESat using either the collinear method or the crossover method [39]. This difficulty can be mitigated by combining ICESat elevation measurements with SRTM-derived elevations (Section 2.2) [4,5,23]. ICESat provides two sets of global elevation data—GLA06 and GLA14. GLA06 contains the L1B Global Elevation Data and is suitable for studying smooth ice sheets [33]. GLA14 contains the L2 Global Land Surface Altimetry Data and is suitable for studying rougher terrain surfaces [33]. Because Geladandong is at high altitudes and has a complicated topography, we choose to use elevations from GLA14 (Version 33; see [40,41]). In this paper, we used a total of 17 cycles of ICESat measurements in the entire Geladandong.
The reference ellipsoid for the heights derived from ICESat has the same semi-major axis and flattening as those of Topex/Poseidon’s ellipsoid, but these two ellipsoidal parameters are different from those of WGS84’s ellipsoid (for GPS). To convert heights from ICESat to heights in the WGS84 system and to obtain orthometric heights for differencing with SRTM elevations, we use the following height conversion formula:
ICESat elevation = ICESat elevation _ measured ICESat geoid 0.7 ,
where ICESat elevation _ measured and ICESat geoid are the ellipsoidal (geodetic) and geoidal heights directly available from ICESat’s data records, and 0.7 m is the difference between the semi-major axes of TOPEX/Poseidon and WGS84’s ellipsoids. Figure 3 shows a flowchart of data selection and height determination from ICESat. In addition, we edited the ICESat observations using the following empirical procedure:
(1)
Remove ICESat elevations exceeding the minimum and maximum of the SRTM elevations within the study region.
(2)
Remove the elevations at two consecutive along-track footprints that have a difference exceeding 300 m. Rationale: If we allow a maximum glacier slope of 60° for two neighboring along-track footprints spaced at about 172 m, the maximum elevation difference will be about 294 m.
(3)
Determine a smoothed value h n ¯ at a given point using n neighboring points (n = 100 in this paper). First, along a sufficiently long ground track, the differences between the original and smoothed heights are computed to determine a standard deviation δ n . Then, if an original height, h i , meets the condition that | h i h n ¯ | > 3 δ n , then h i is removed.
(4)
Remove the ICESat elevations that differ from the SRTM elevations by more than 150 m [23].
The ICESat-derived rates of elevation changes can be used to estimate the mass balance over the entire Geladandong from 2000 to 2009, if the glacier flow and density information is given [42]. However, such information is not available, so we simply focus on calculating glacier elevation changes and their rates in the accumulation and ablation areas of Geladandong and in Region C (Figure 1) without estimating the mass balance. This leads to our conditional results that can be used to detect a number of glacier changes, such as glacier thinning with respect to altitude, sudden glacier elevation changes caused by glacier surging, and surface elevation increase due to snow accumulation. The mean equilibrium line altitude (ELA) over Geladandong is 5740 m [43], where the separation between accumulation and ablation occurs.
We compute the rate of glacier elevation changes by two methods as follows:

2.3.1. Method 1: Robust Fitting

Method 1 is a standard technique and is used in the case of a relatively high number of elevation changes from ICESat (for the entire Geladandong and Region C). The robust fitting uses an iterative re-weighted least-squares approach to determine the rate of elevation change. In the first-round rate estimation, all elevation changes receive an identical weight and their residuals are computed. In the subsequent iterations, the weights of the elevation changes decrease with the magnitudes of their residuals. The iteration ends when the residuals do not vary within a given threshold value. In this paper, the robust fitting is implemented by the MATLAB function “robustfit” with a default parameterization.
For Method 1, we estimate the standard error of an elevation change rate as [5]:
δ d h / d t = δ s t d 2 + δ b i a s 2 + δ s p a t 2 + δ t e m p 2 + δ a r e a 2 + δ E L A 2 ,
where, δ s t d : standard error directly from the robust fit [24]; δ b i a s : error due to inter-campaign biases and crustal uplift (0.03 m·a−1); δ s p a t : error due to uneven spatial sampling (0.03 m·a−1); δ t e m p : error due to uneven temporal sampling (0.03 m·a−1); δ a r e a : error due to snow depth effect and mis-identification of laser glacier footprints (10% of dh/dt); δ E L A : error due to ELA uncertainty, caused by the sparse spatial data coverage of published ELA values. This error is based on the recommendation by [4].
A detailed description and quantification of each error component can be found in the auxiliary material of Gardner et al. [5] and Moholdt et al. [44]. The term δ s t d is the largest and is attributed to measurement noises. The term δ b i a s is due to systematic elevation biases ( δ b i a s ), whose time-variation is difficult to model. Here we adopted a constant value of 0.03 m·a−1 for δ b i a s following the recommendation of [5]. The terms δ s p a t and δ t e m p are caused by random variations in spatiotemporal sampling. Based on the assessments carried out in Antarctica and Greenland by Gardner et al. [5] and Moholdt et al. [44], we adopted a constant value of 0.03 m·a−1 for δ s p a t and δ t e m p . The term δ a r e a is caused by the seasonality of snow coverage and varying snow thickness that lead to mis-identifications of glacier for ICESat footprints. We adopted the estimate that δ a r e a = 10% of dh/dt. Finally, the snowlines in this paper were manually selected for several glaciers with different angles of inclination and slope in our study region. As such, we decided to adopt δ E L A = 30% of ELA uncertainty, i.e., δ E L A = 0.03 m·a−1, following the recommendation of [4].

2.3.2. Method 2: Rate Averaging

Method 1 works only when ICESat data are sufficiently dense, which is not always the case. Here we propose a new method (Method 2), called rate averaging, to estimate glacier elevation change rates when ICESat measurements are so sparse (such as Regions A and B) that a reasonable time series of elevation changes cannot be formed. In Method 2, a rate is determined by averaging rates from individual elevation changes. First, we computed rates from individual ICESat elevation change measurements using
R a t e = D h / ( T I C E S a t T S R T M + n ) ,
where D h is the difference between an ICESat elevation and its reference elevation from SRTM, T I C E S a t is the ICESat acquisition time, T S R T M is the time corresponding to the reference elevation of SRTM and n is a time correction term in year. If T I C E S a t is in winter (the end of a year), n is 0, otherwise n is 1 [45]. Then, we averaged the rates from all elevation change measurements to determine a mean rate.
For Method 2, the standard error of an estimated elevation change rate is the difference between the elevation change rates using heights from SRTM DEMs before and after the corrections for universal co-registration, elevation and radar penetration effects (Section 2.2). The idea behind such an estimation of uncertainty is that, if SRTM delivers precise elevations, the corrections should be small, and it is expected that a SRTM DEM’s uncertainty will increase with such corrections.

2.4. In Situ Hydroclimatic Data

Climate change is a potential driving factor of Geladandong’s glacier elevation changes. Climate change will introduce changes in temperature and precipitation around the glaciers. In this paper, we present an analysis of the ICESat-derived glacier elevation changes (Section 3.1) in connection to climate change over 1970–2009, 1957–2013, and 1966–2013 using in situ hydroclimatic data recorded at the Tuotuohe, Wudaoliang, and Anduo weather stations and river discharges over 1956–2012 at the Tuotuohe and Chumda river gauge stations. We obtained the weather records from the China Meteorological data sharing service system at [46]. The Tuotuohe weather station is located in the township of Tuotuohe (34.2°N, 92.4°E; elevation 4533 m; see Figure 1a) and is the nearest weather station to Geladandong. The Wudaoliang weather station is located in the northern catchment region of YRSR (35.2°N, 93.1°E; elevation 4665 m; see Figure 1a) and the Anduo weather station is located in southern Geladandong (32.3°N, 91.7°E; elevation 4800 m; see Figure 1a). The Tuotuohe river gauge was installed at the hydrological control station of Tuotuohe, which is one of the origins of the Yangtze River (see Section 1) and the Chumda river gauge station is near the eastern boundary of the catchment region (Figure 1a). These two gauge stations are the most important stations for monitoring river discharges in YRSR. In this paper, we used the in situ discharge data over 1956–2012 (57 years) at the Tuotuohe and Chumda hydrological surveying stations, as collected by Sun et al. [47].

3. Results

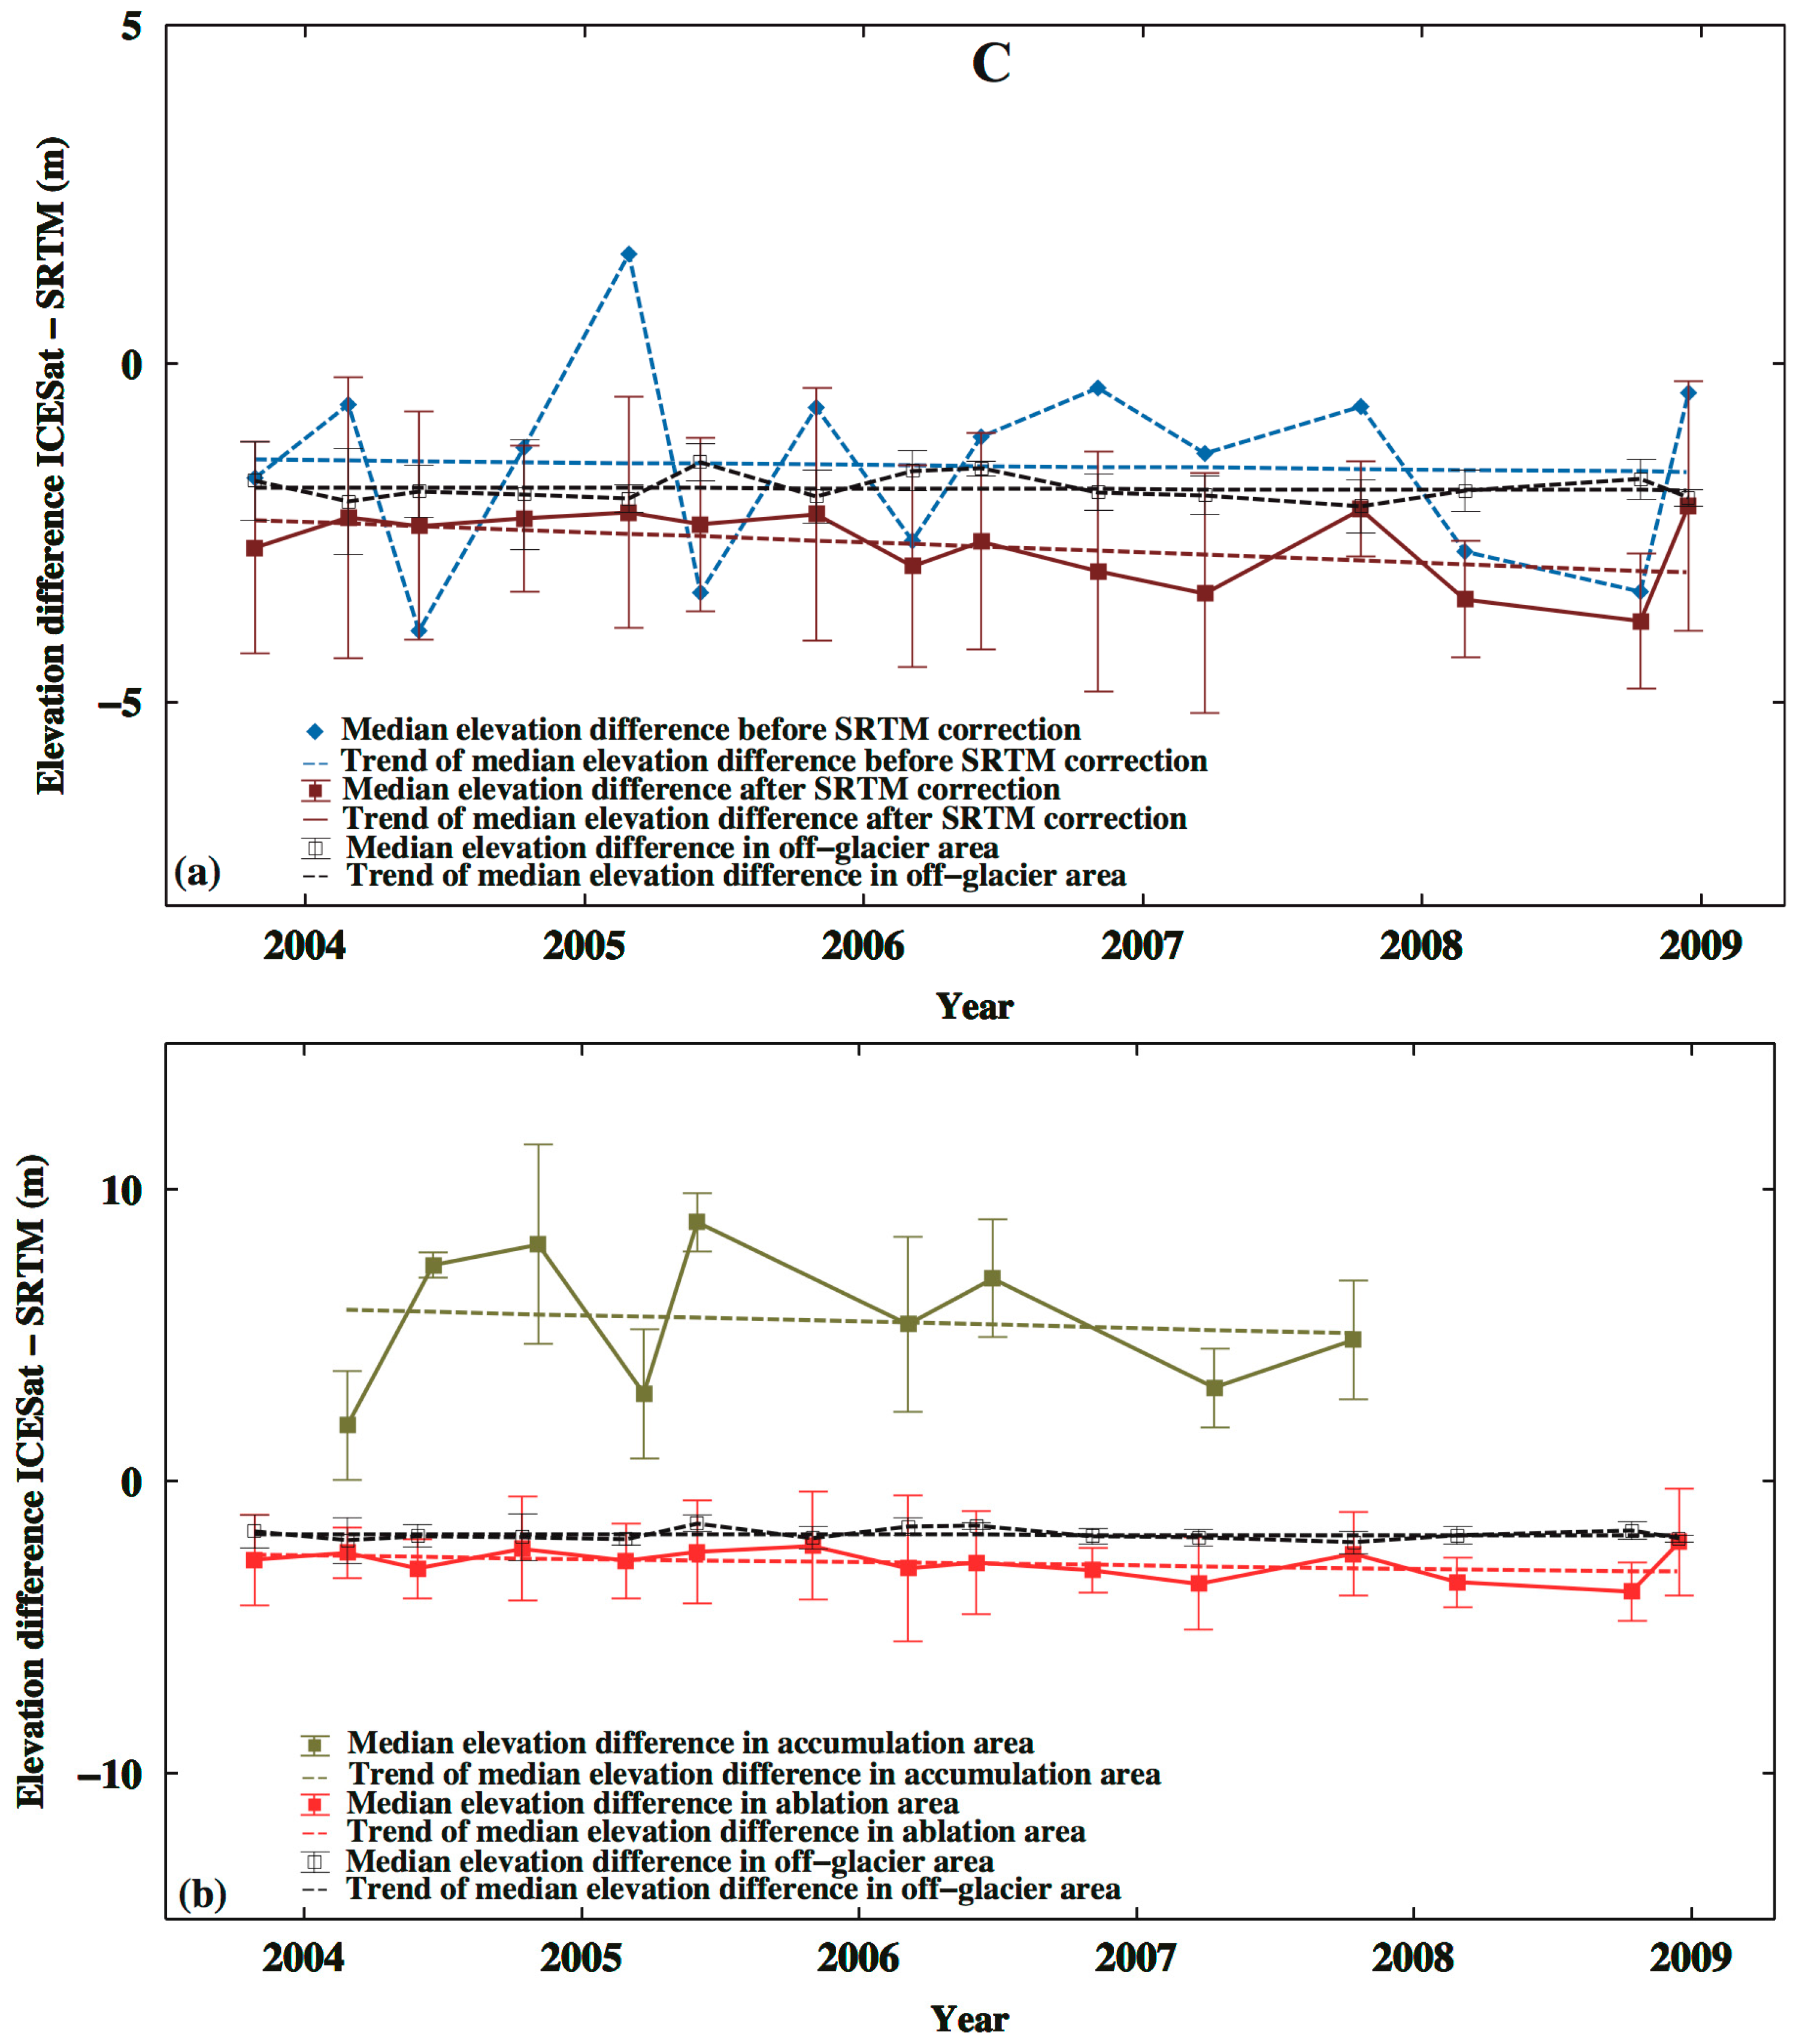
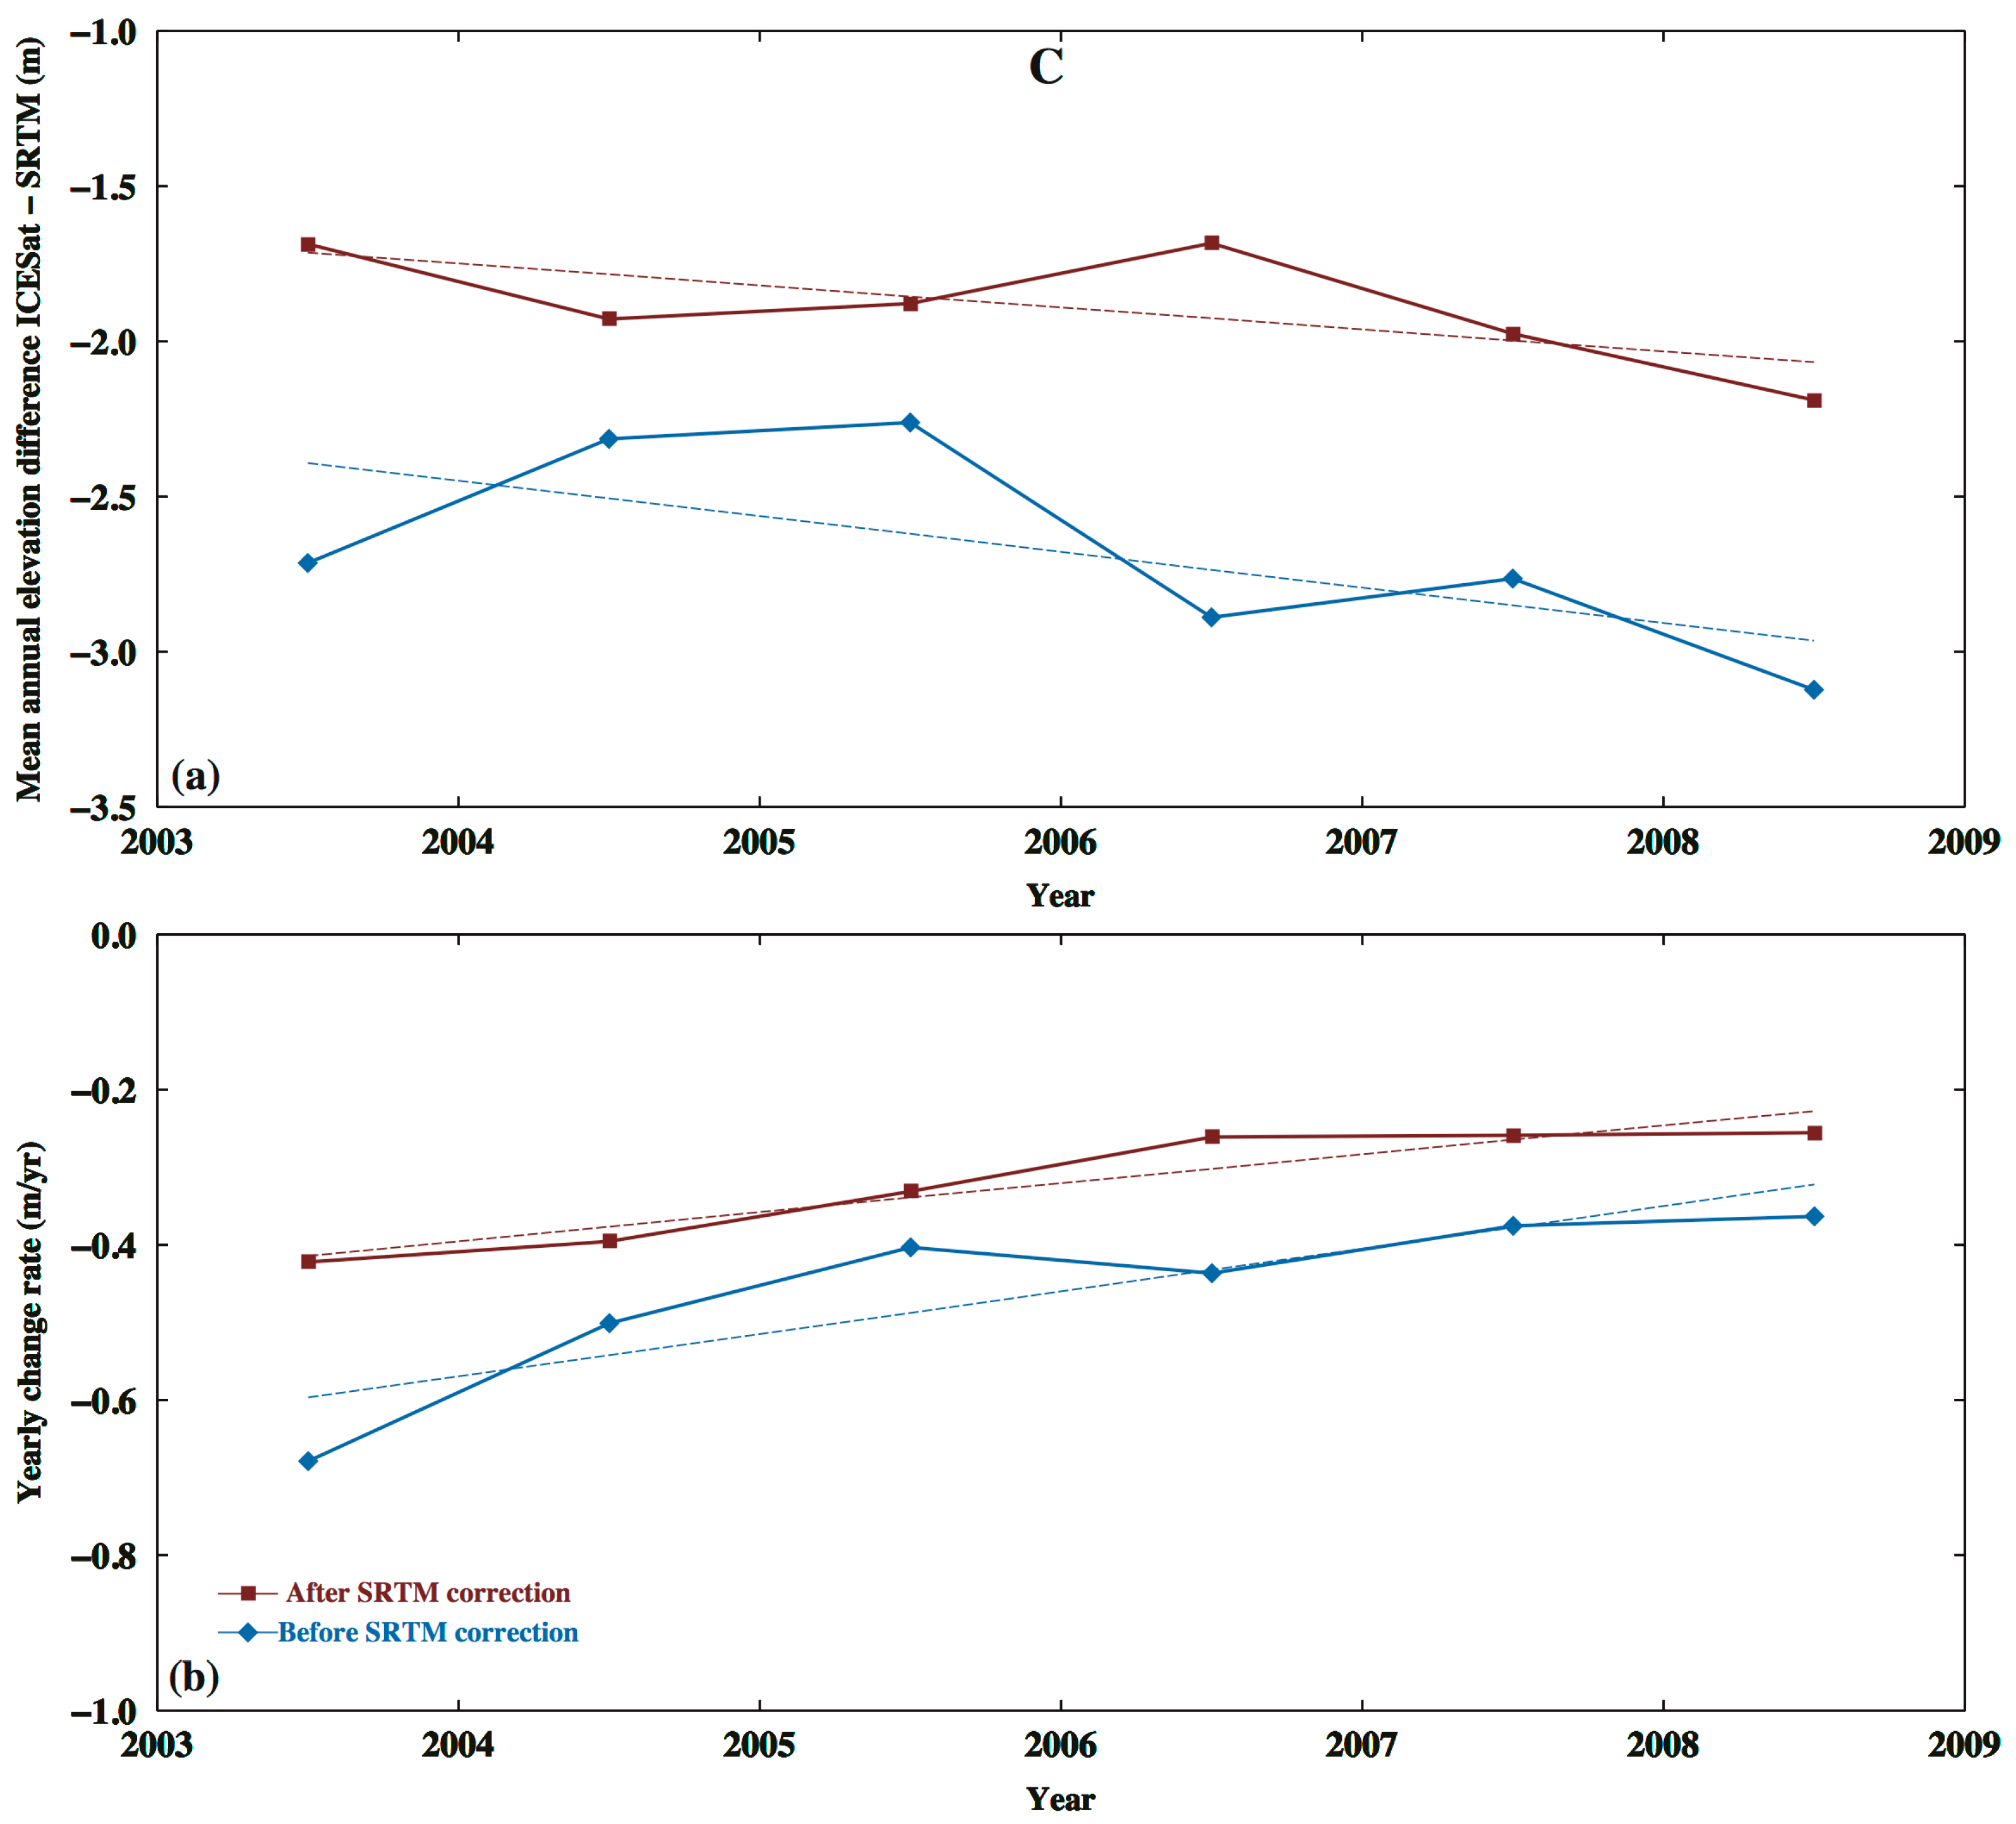
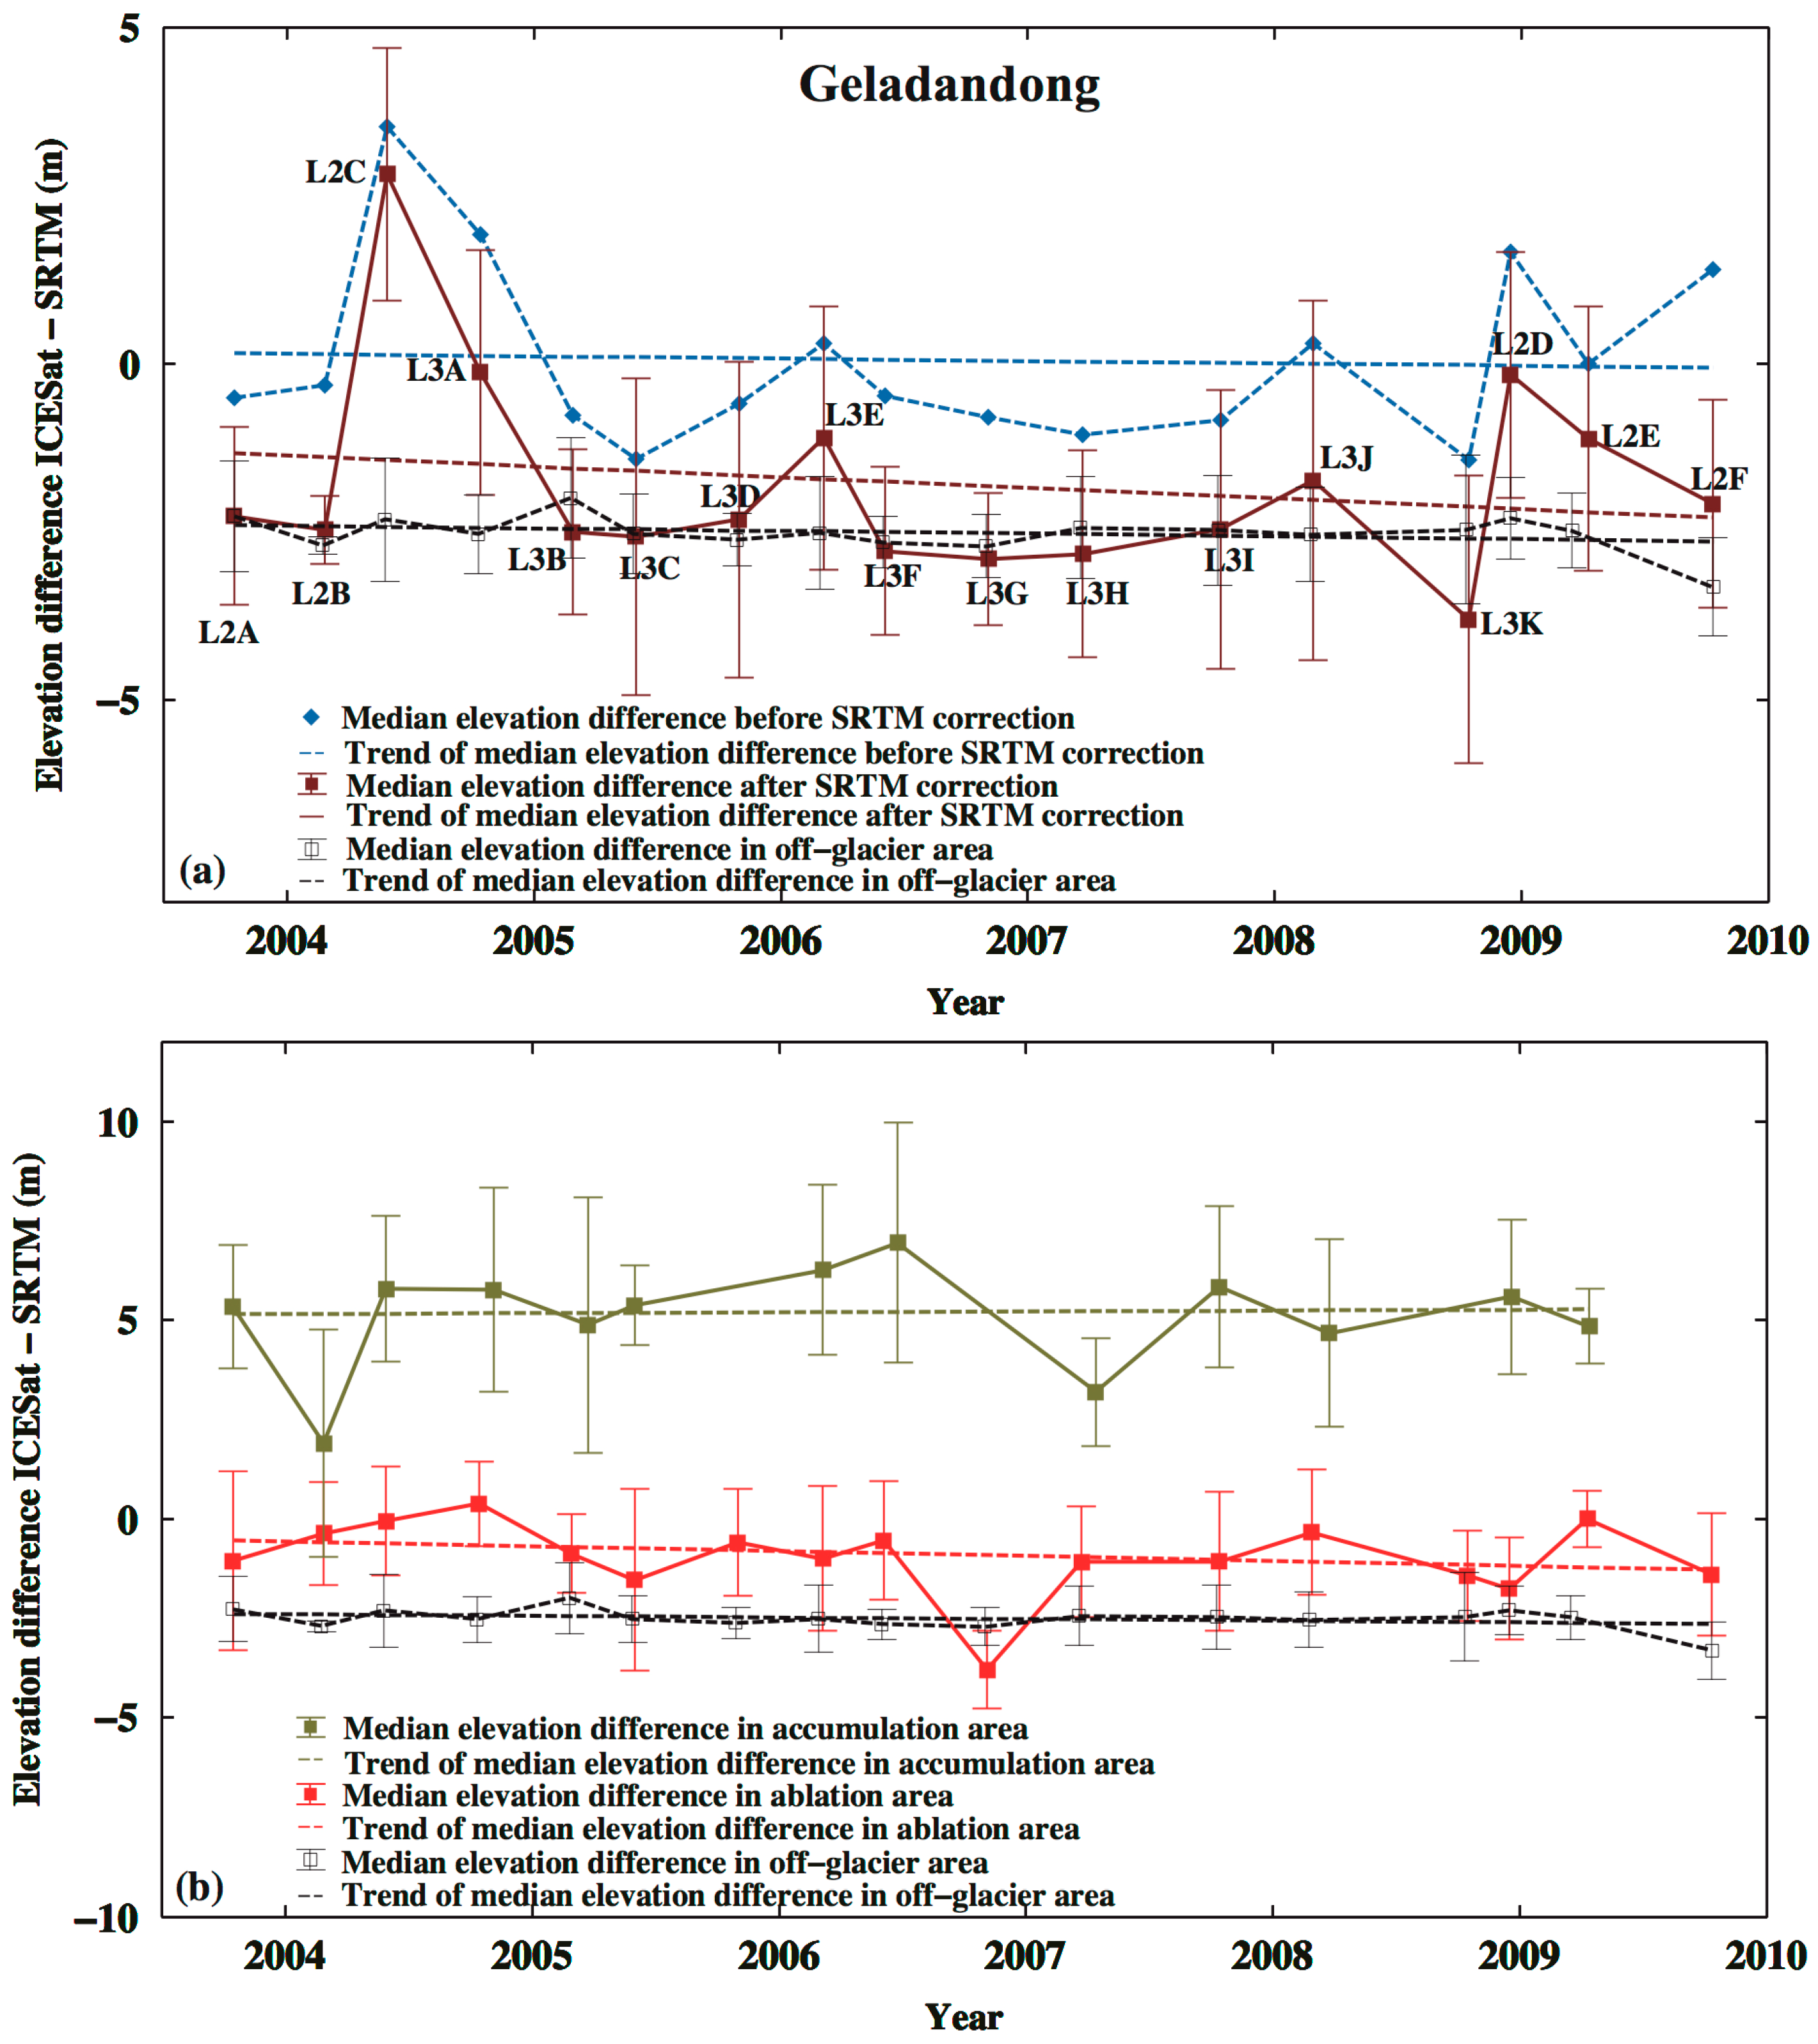
3.1. Glacier Elevation Changes and Their Rates from ICESat

Using the ICESat measurements, we determined a time series of glacier elevation changes over 2003–2009 in the entire Geladandong, and a separate time series over 2003–2008 in Region C. Note that, in Region C, cycle L2E contains only seven measurements and cycle L2F contains one measurement. Such measurements are not on glaciers defined by CGI, so they are excluded when determining the time series. We also calculated elevation changes separately for the accumulation and ablation areas in the entire Geladandong and in Region C [4]. The results are shown in Figure 4 and Figure 5 and Table 1. Note that, in Figure 4a, if the SRTM elevations are not corrected by the errors listed in Section 2.2, the height differences between the elevations from ICESat cycles L2C, L3A, L3E, L3J, L2D, and L2F, and the SRTM-derived elevations are positive (blue lines); after the corrections, the elevation changes from these ICESat cycles turn to negative values (brown lines, except L2C). In addition, for a given ICESat cycle, the height change is the median value of the elevation changes of the cycle. We used median values, instead of mean values, to avoid outliers that will introduce errors in determining the rates of elevation change. The median elevation change over the entire area is based on all elevation changes over the accumulation and ablation areas, and it may be different from the average elevation change based on the median elevation changes over the accumulation and ablation areas.
A summary based on Figure 4 and Figure 5 and Table 1 is as follows:
(1) The rates of elevation changes in the accumulation and ablation areas are +0.075 ± 0.223 m·a−1 and −0.123 ± 0.109 m·a−1 (Figure 4b and Table 1). While the elevation changes in the accumulation area did not vary with time, those in the ablation area declined steadily over time. According to Neckel et al. [4], the rates of glacier elevation changes are +0.55 ± 0.33 m·a−1 and −0.68 ± 0.35 m·a−1 in the accumulation area and ablation area in the entire central Tibetan Plateau (see in Region D in Neckel et al. [4]). The rates of glacier elevation changes in Region D of Neckel et al. [4]) are much larger than the rates determined in this paper. The inconsistency between the result in this paper and that in Neckel et al. [4] is partially due to the different sizes of glacier-covered areas in this paper and the work of Neckel et al. [4]; the latter is much larger.
(2) The rates of elevation changes in Region C and its accumulation and ablation areas are −0.176 ± 0.102 m·a−1, −0.291 ± 0.818 m·a−1, and −0.128 ± 0.097 m·a−1, respectively (Figure 5 and Table 1). Furthermore, the standard errors of the estimated rates in Table 1 are directly from the robust fitting. In some cases, the standard errors are larger than the rates, and this also happened in the studies of [4,5,24]. As shown in Section 2.1, Section 2.2 and Section 2.3, there are several uncertainties in the data from Landsat-7, ICESat, and SRTM, which may have reduced the signal-to-noise ratios when estimating rates from these data (see Equation (5)). However, it is encouraging that the standard errors of the rates in the ablation areas over the entire Geladandong and Region C are smaller than the rates.
Table 2 shows the available ICESat repeat cycles around Geladandong and the statistics about the resulting elevation changes. Region A contains measurements from cycles L2C, L2D, L2E, L3A, L3E, and L3J, Region B contains measurements from cycle L2A and Region C contains measurements from all cycles around Geladandong, except the first cycle L1AB. The results in Figure 4a and Table 2 show that the ICESat-measured heights in Regions A, B and C are higher than 5000 m. In general, elevation decreased with time, suggesting that glaciers here were melting. In Region A, use of the corrected SRTM elevations in 2004, 2008, and 2009 led to larger glacier elevation changes, thereby increasing the rate of elevation change over 2000–2009. In the later period of 2000–2009, the elevation changes were larger than those in the early period, indicating that glacier melting around Geladandong was accelerating. In Region A, the rates of elevation changes vary with time and the rates range from −0.185 to −0.598 m·a−1. The mean rates in regions A and C were −0.418 ± 0.322 m·a−1 and − 0.432 ± 0.020 m·a−1 over 2000–2009 and 2000–2008, respectively. Region B contains measurements from just one ICESat cycle (Figure 1b, L2A in 2003), so here the glacier elevation changes were obtained by subtracting the SRTM reference heights in 2000 from the ICESat-derived heights in 2003. This results in a mean elevation change of −1.728 m from 2000 to 2003. With 15 cycles, Region C contains the most ICESat height measurements and here the rates of elevation changes range from −0.049 to −1.389 m·a−1, with a mean rate of −0.321 ± 0.139 m·a−1.
Figure 6a shows the yearly rates of elevation changes in Region C. A yearly rate is defined as the mean of the ratios between the elevation differences (changes) and time differences within a given year. Because the ICESat measurements in Regions A and B are sparse, no reliable time series can be formed here. In Region C, the elevations decreased rapidly. Using Equation (6), we computed the yearly rates over different years to assess possible accelerations in glacier elevation changes in Region C, as shown in Figure 6b. In Region C, the yearly rate in 2003 was the largest, and the rate declined steadily after 2003. This suggests that the glacier melting in Region C may have been slowed down since 2003. But again, we emphasize that the rates using all ICESat measurements around Geladandong show that (1) the glacier elevation was persistently declining, and (2) the declining rates tend to decrease with time. For example, the yearly declining rate is about −0.40 m·a1 in 2003, dropping to −0.25 m·a1 in 2008 (the absolute magnitudes change from 0.40 to 0.25 m·a1). (See also the discussions about Table 2 and Figure 4a in the previous two paragraphs.)

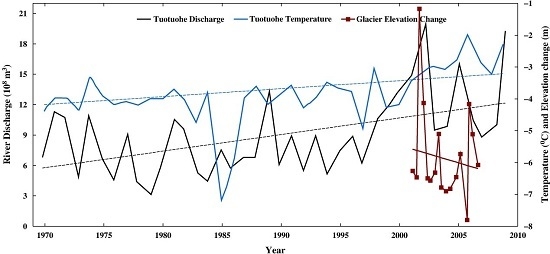
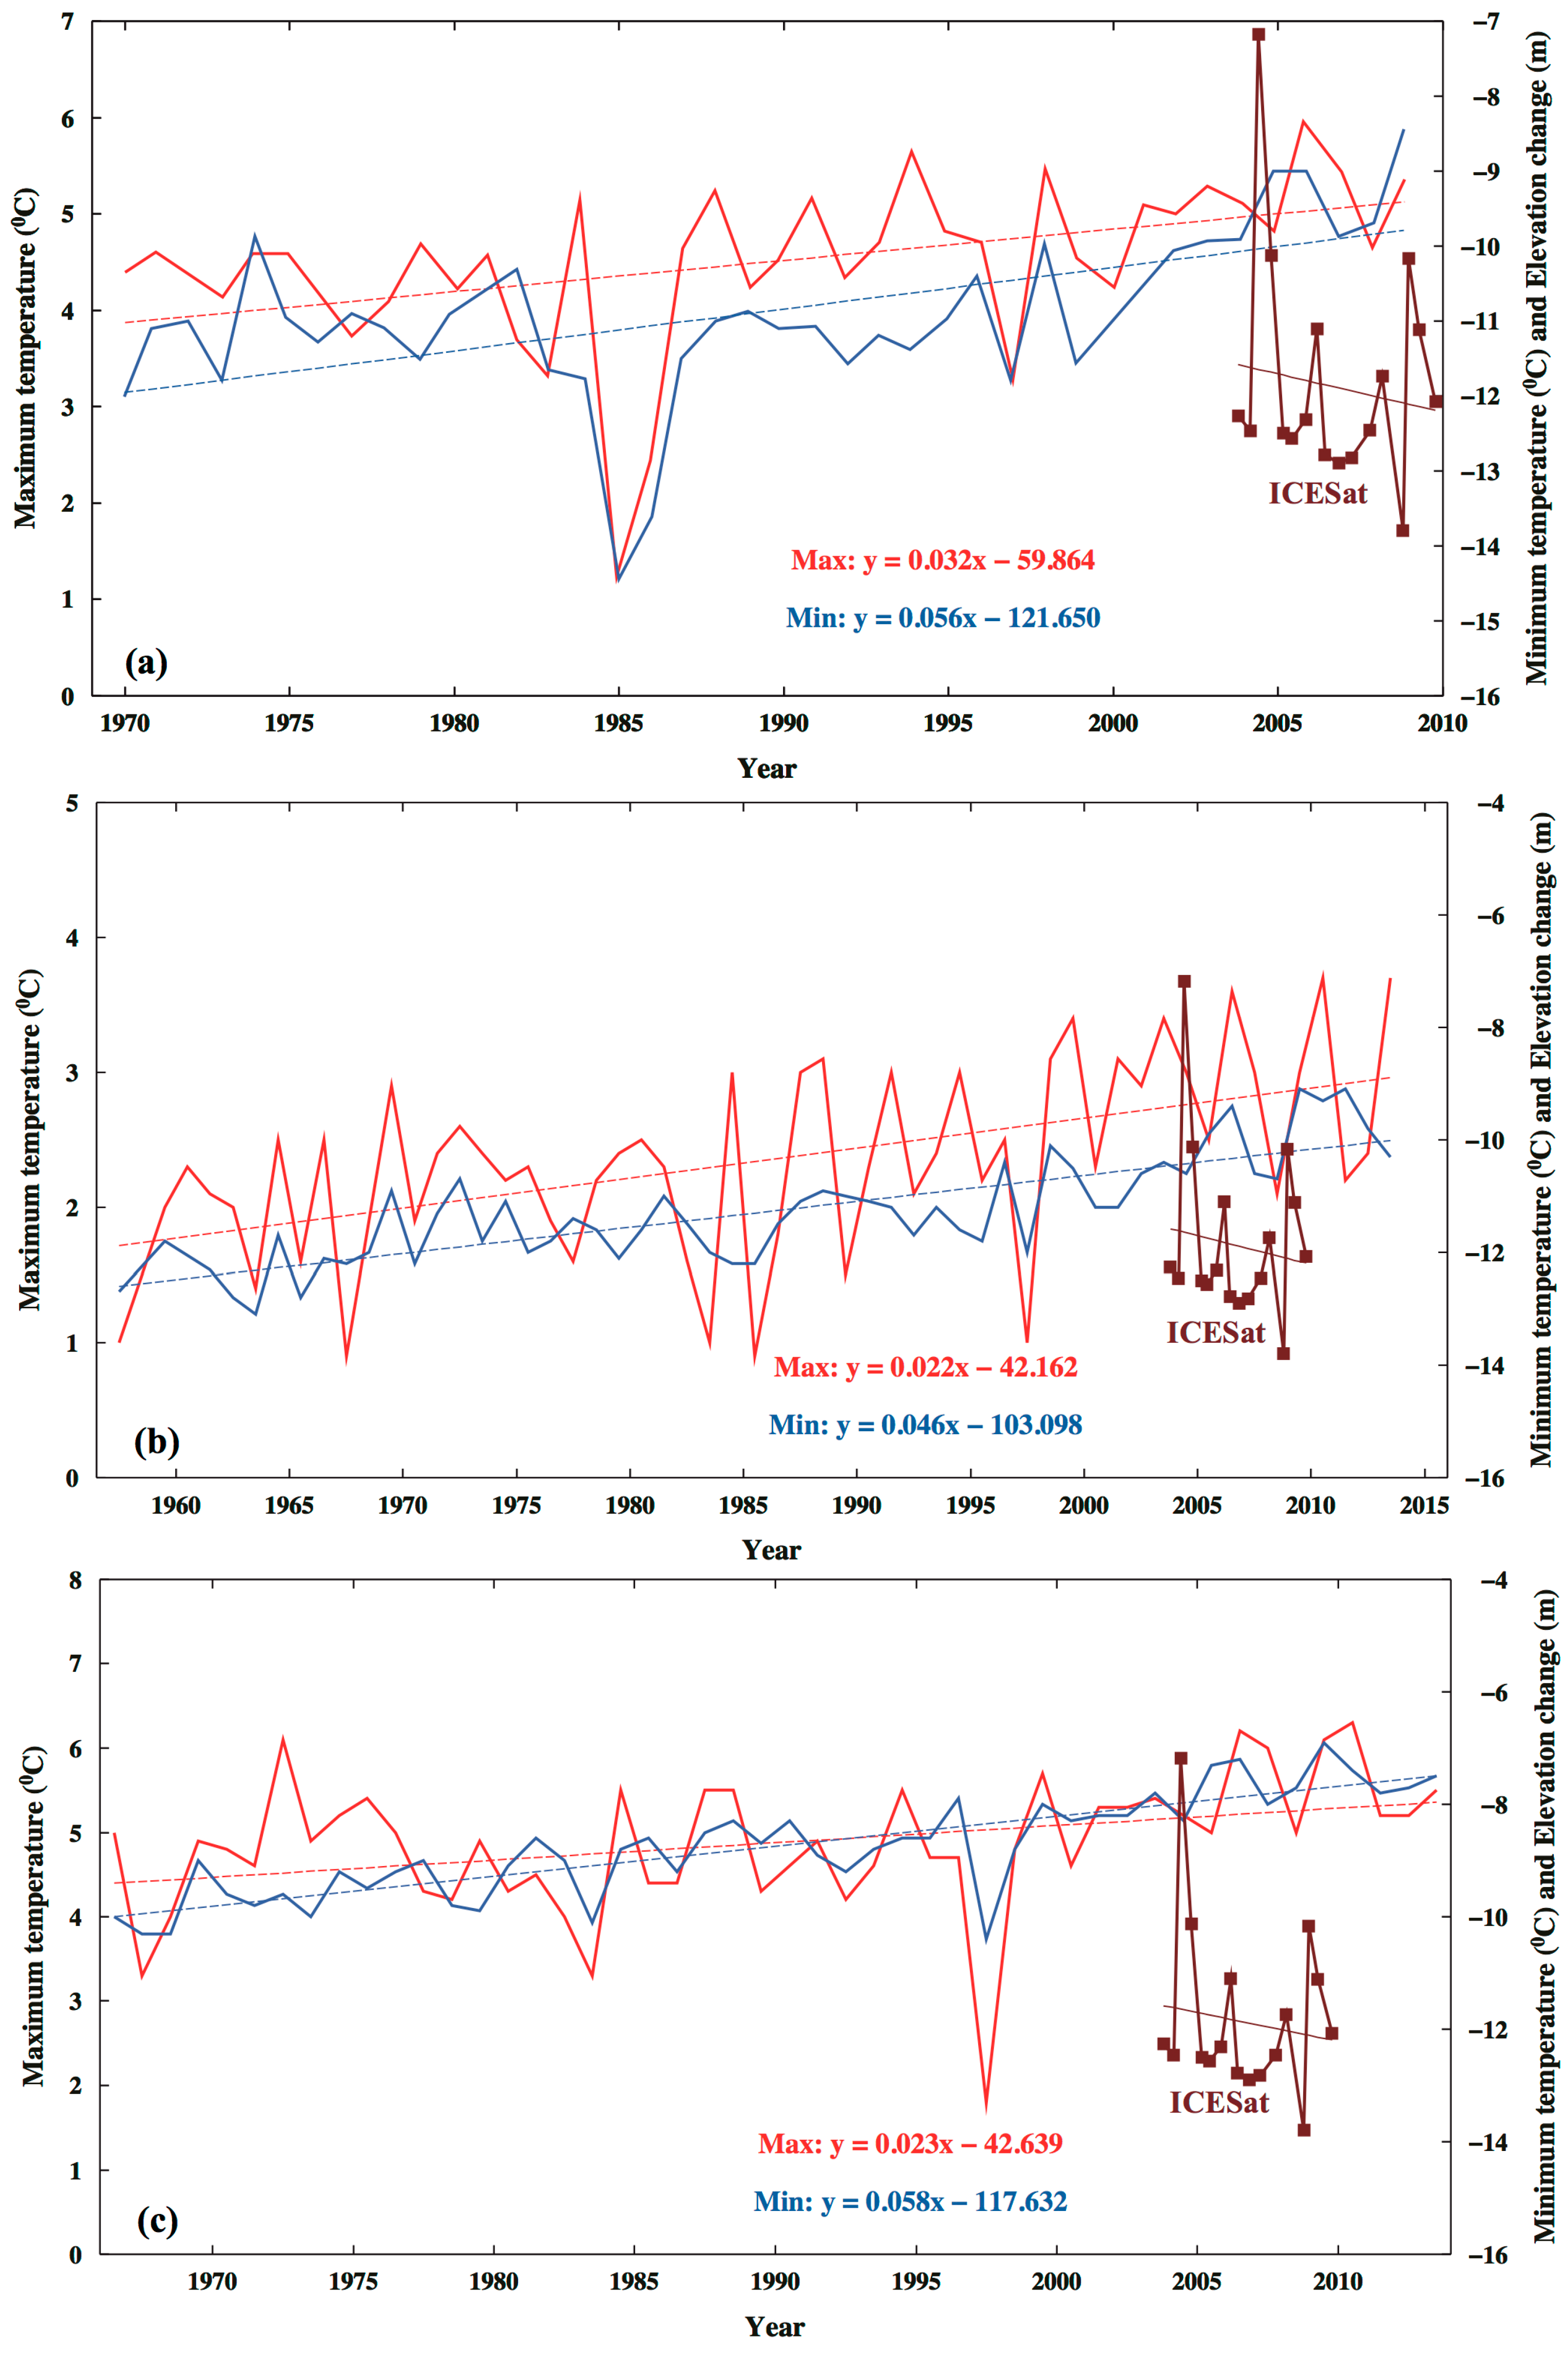
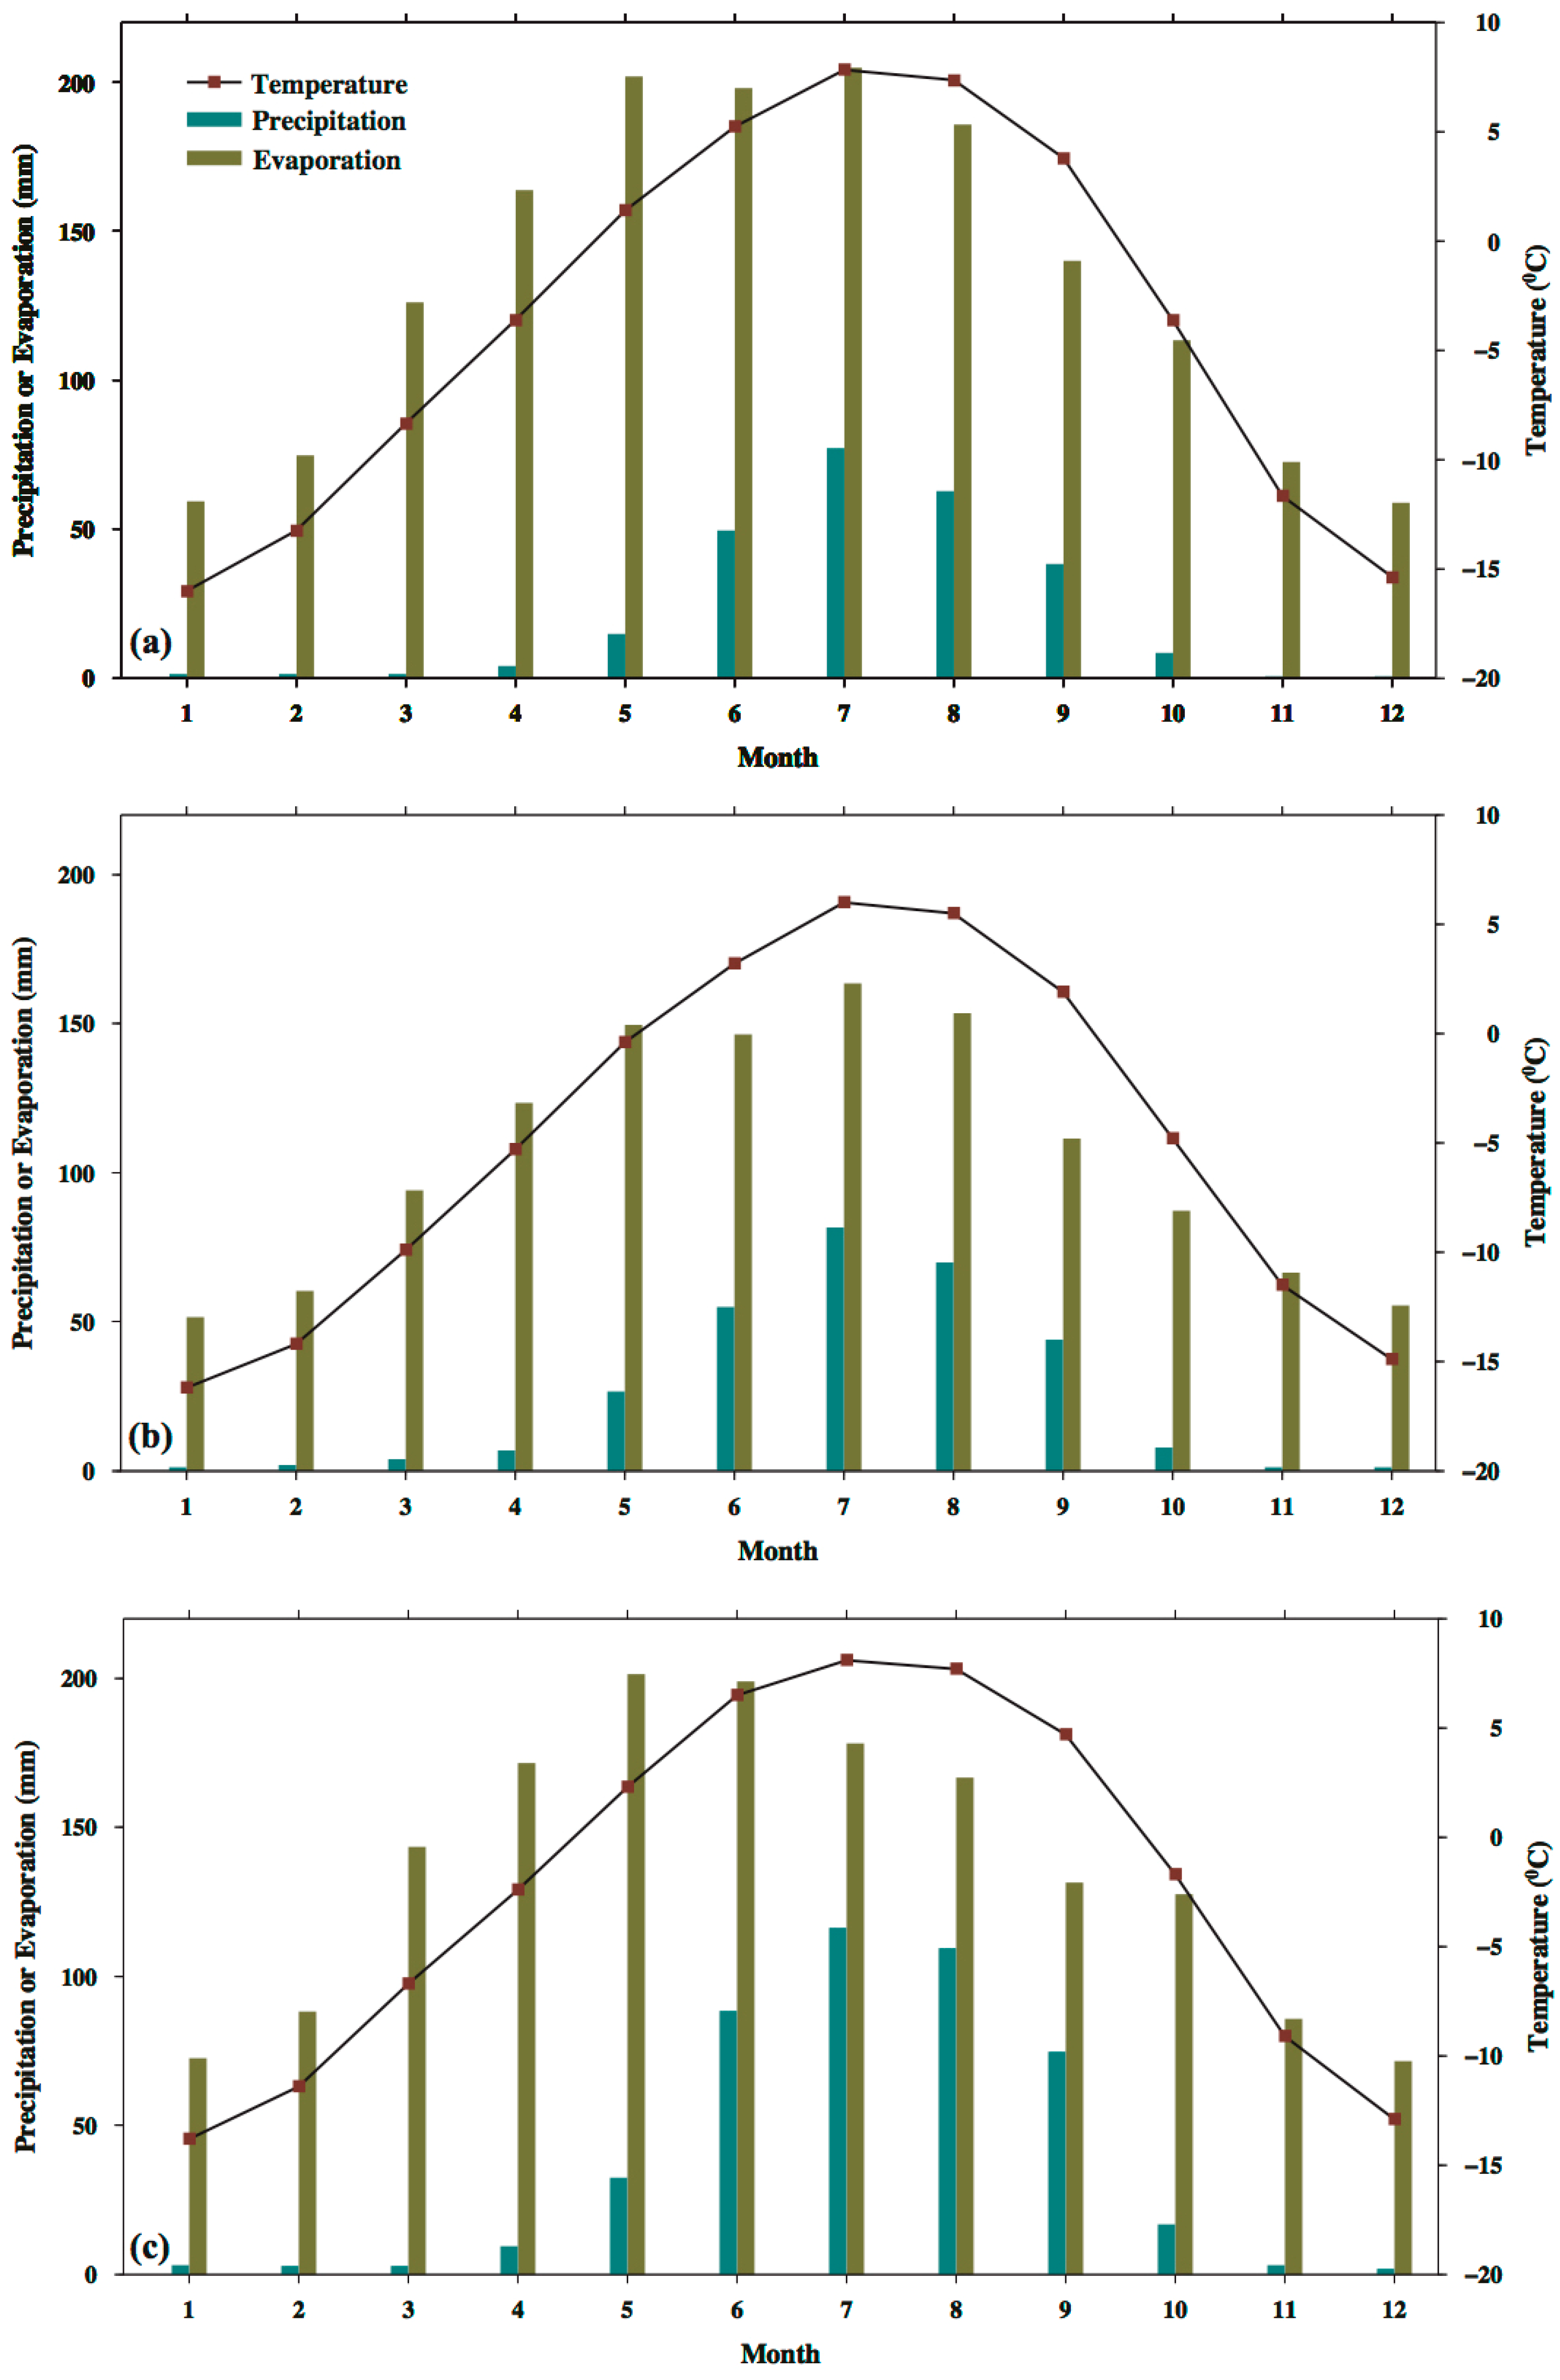
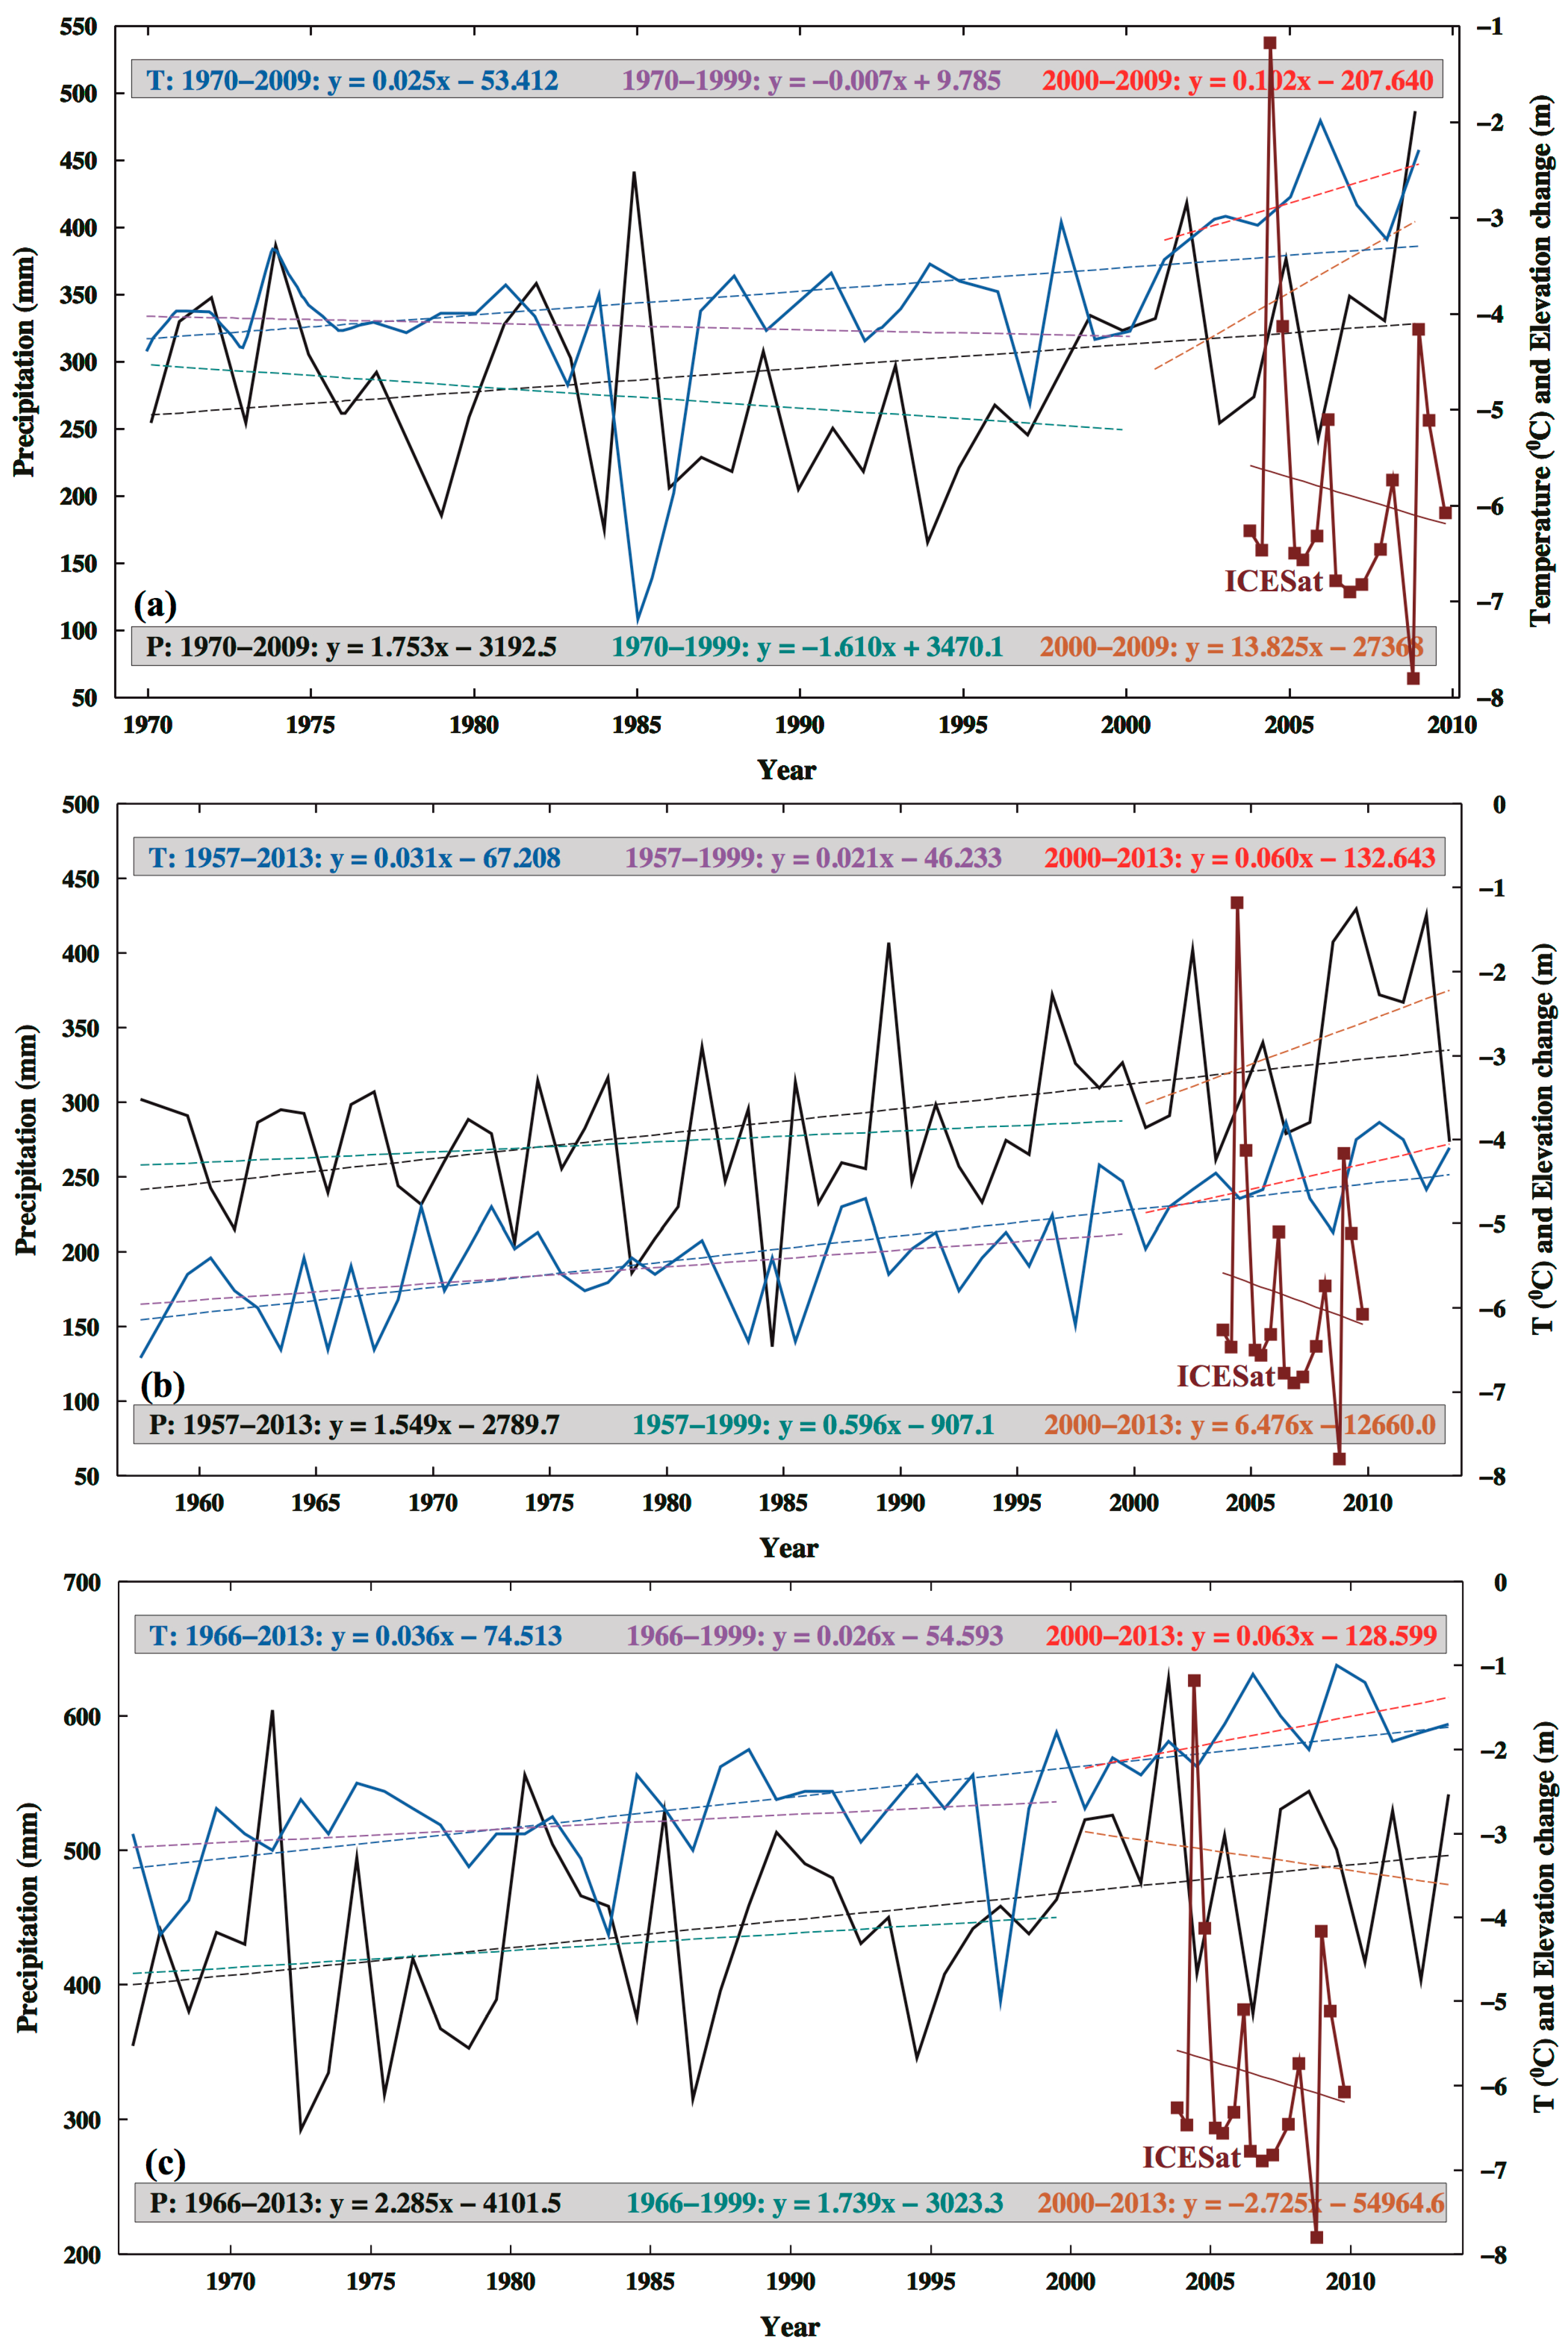
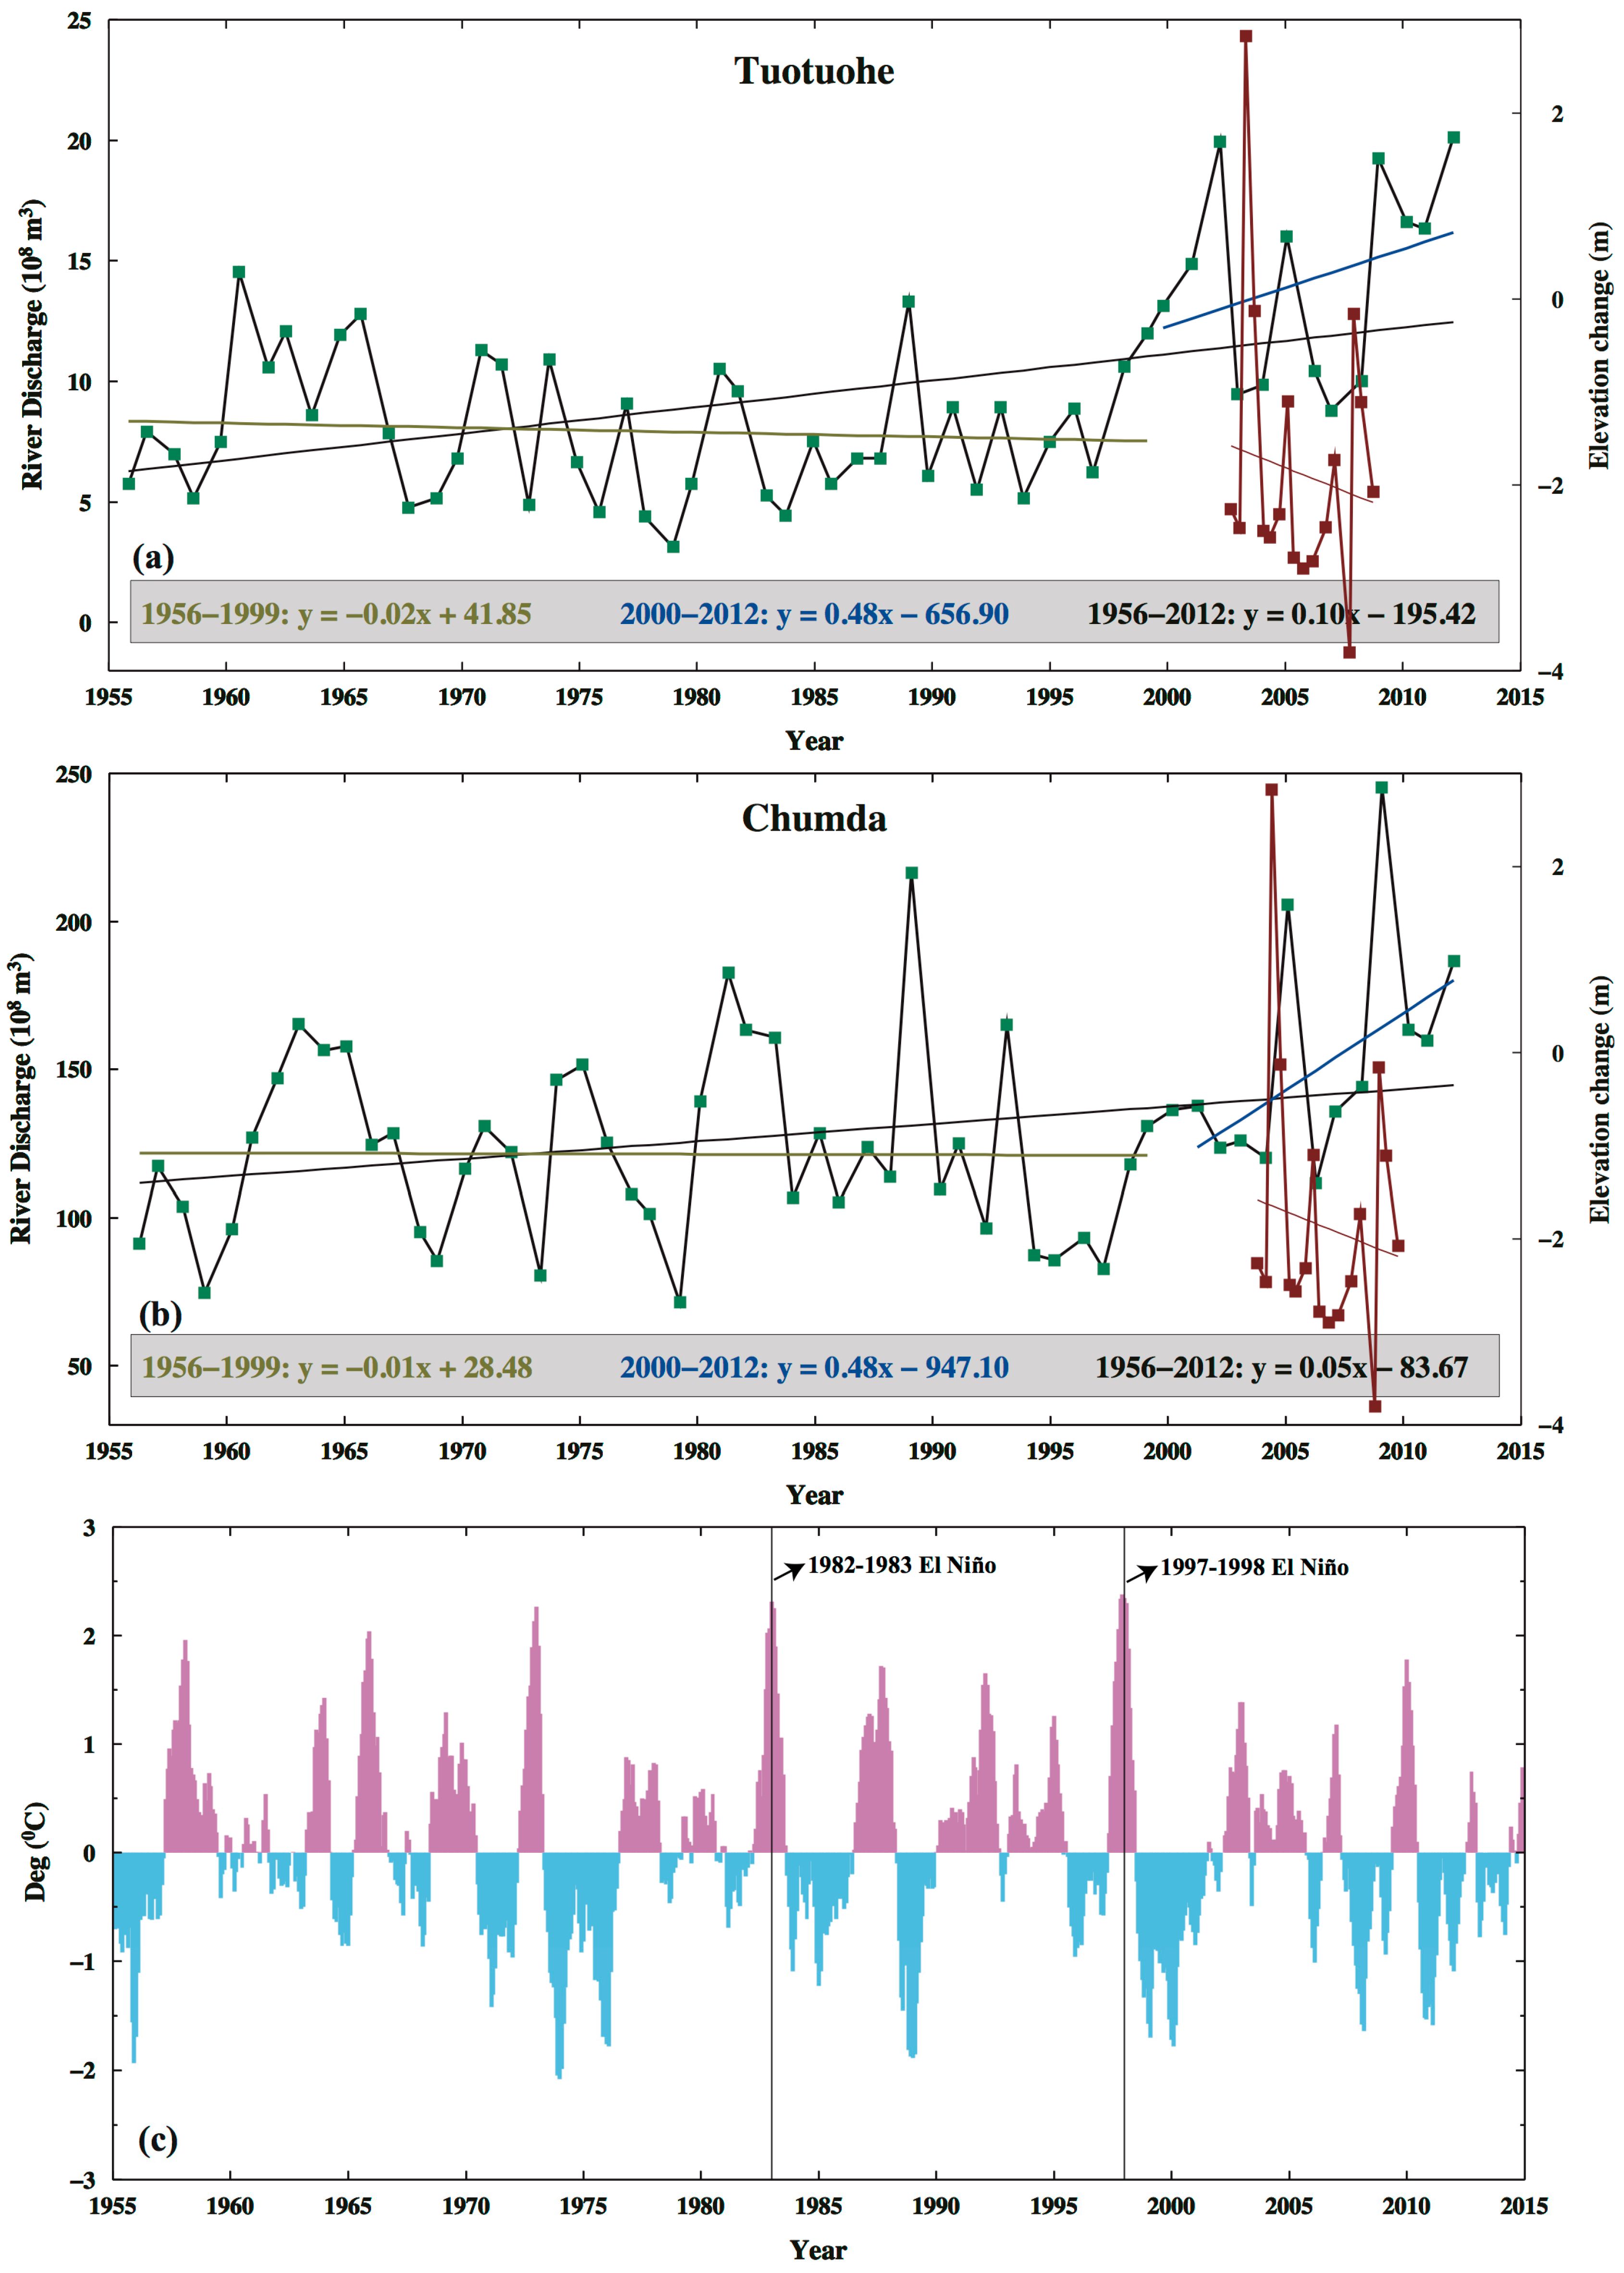
3.2. Decline of Geladandong Glacier Elevation: Its Correlation with Evaporation, Temperature, Precipitation, and River Discharge

Figure 7 shows the mean monthly evaporations, precipitations, and temperature recorded at Tuotuohe over 1970–2009, and at Wudaoliang and Anduo over 1981–2010. At Tuotuohe, the annual mean temperature is −3.9 °C. Here the coldest month is December, with a mean December temperature of −16.1 °C. The monthly precipitations range from 1 to 77 mm, with an annual mean of 260 mm. The monthly evaporations are between 58 and 205 mm, resulting in a cumulative yearly evaporation of 1596 mm. On average, the monthly evaporations are larger than the corresponding monthly precipitations, with differences ranging from 57 to 186 mm. Moreover, the monthly evaporations, precipitations, and temperatures at Wudaoliang and Anduo show that the trends and seasonal variations are consistent with those at Tuotuohe. These weather data indicate that Geladandong is a cold and arid region with high evaporation. The decline of the mean glacier elevation seen in Figure 4a is connected to the changes in the three weather parameters presented in Figure 7, as shown below.
Figure 8a shows the rates of annual temperatures and precipitations at Tuotuohe over different periods of time from 1979 to 2009. From 1970 to 2000, the overall rates of temperature and precipitation were negative, meaning that the two weather parameters were declining over 1970–2000. However, from 2000 onward, the temperatures and precipitations around Tuotuohe started to increase. As a result, the mean temperature and precipitation rates over 1979–2009 were positive. Figure 9a shows the rates of maximum and minimum temperatures at Tuotuohe, which were also positive over 1979–2009.
Figure 8b shows the rates of annual temperatures and precipitations at Wudaoliang in the northern catchment area of YRSR over 1957–2013. Here the annual mean temperature, precipitation, and evaporation are −5.4 °C, 278 mm, and 1629 mm, respectively. The results from Figure 8a,b indicate that the overall precipitations at Wudaoliang are more than those at Tuotuohe, which is near Geladandong. Furthermore, Figure 9b shows the rates of maximum and minimum temperatures at Wudaoliang, which were positive from 1957 to 2013 and indicate a rising trend of temperature as that at Tuotuohe.
Now we analyze the in situ hydroclimatic data at Anduo, located south of Geladandong (Figure 1a). Here the annual mean temperature, precipitation, and evaporation are −2.8 °C, 435 mm, and 1458 mm, respectively. From 1966 to 2013, the rates of annual temperatures and precipitations at Anduo were positive, but the precipitations decreased steadily over 2000–2013 (Figure 8c). In addition, Figure 9c shows that the rates of maximum and minimum temperatures at Anduo were positive over 1966–2013. In summary, the rates of temperature changes in the immediate eastern region (Tuotuohe) and the southern region of Geladandong (Anduo) are consistently positive.
Figure 10a,b show the river discharges at Tuotuohe and Chumda over 1956–2012. From 2000 onward, the annual discharges at these two stations have increased steadily. The discharge increases are likely caused by increasing meltwater from Geladandong after 2000 and reflects the glacier thinning around Geladandong. Moreover, the inter-annual variations of discharge in Figure 10b,c may be associated with El Niño and La Niña events. To support this link, we show in Figure 10c the Niño 3.4 index (from the official site [48]) over 1975–2014. This index shows exceptionally large temperature anomalies associated with the 1982–1983 and 1997–1998 El Niño. Large annual oscillations of discharges at Tuotuohe and Chumda also occurred after the 1982–1983 and 1997–1998 El Niños. Specifically, the weather records at Tuotuohe, Wudaoliang, and Anduo (Figure 8a–c and Figure 9a–c) show that the 1982–1983 and the 1997–1998 El Niños have disrupted the patterns of temperature and precipitation around Geladandong. In 1984, the annual mean temperature, annual maximum temperature, and annual minimum temperature at Tutuohe dropped abruptly (Figure 8a and Figure 9a), while the annual precipitation increased sharply (Figure 8a). However, at Wudaoliang, the mean annual temperature and annual maximum temperature in 1984 increased (Figure 8b and Figure 9b) and the annual precipitation decreased (Figure 8b). In contrast, in 1984, the variations in temperature and precipitation at Anduo were insignificant (Figure 8c and Figure 9c). After 1998, the trends of annual mean temperatures at Tuotuohe, Wudaoliang, and Anduo were all positive (Figure 8a–c); the trends of annual precipitation were also positive (Figure 8a,b), except Anduo. In addition, the discharges at both Tuotuohe and Chumda decreased during the 1997–1998 El Niño, but increased from 2000 onward (Figure 10); the increases in discharge coincided with the thinning of Geladandong glaciers that would have yielded more meltwater (Figure 4 and Figure 5).

4. Discussion

4.1. Mechanism for the Geladandong Glacier Surface Decline

The results from previous studies using hydroclimate data (Section 2.4) may have implied that the Geladandong glacier was melting, but these studies lacked direct evidence of the glacier elevation decline due to melting. The lack of evidence may be due to the inaccessibility of the Geladandong glacier. In addition, previous ICESat studies of the Geladandong glacier, such as Neckel et al. [4], did not discuss why the elevation here was declining in connection to changes in temperature, rain and evaporation. By contrast, our study presents an improved ICESat determination of the Geladandong elevation changes and uses the hydroclimatic data given in Section 2.4 to show how river discharges in the catchment area of YRSR were modified in response to the glacier melting and how changes in temperature, rain, and evaporation were related to the glacier elevation decline (Figure 8, Figure 9 and Figure 10).
The development of glaciers is determined by factors such as air temperature and precipitation [49,50]. For example, Oerlemans [51] extracted a climate signal by constructing a temperature history for different parts of the world from 169 glacier length records, suggesting that a 25% or 35% [51,52] increase in annual precipitation is typically needed to compensate for the mass loss due to a uniform 1 °C warming. Zhang et al. [53] showed that the altitudes of the equilibrium lines at several typical glaciers in High Asia Mountains fluctuated between 52 and 152 m in response to a summer mean air temperature change of 1 °C, and between 9 to 85 m in response to an annual precipitation change of 100 mm. However, when the increase of air temperature is larger than a threshold value, a significant ablation of glacier will occur, even in a glacier accumulation zone and under an increasing precipitation condition [54,55]. Furthermore, Singh et al. [56] used a hydrological model involving rainfall–discharge, evaporation losses, snow and glacier melt to show the impact of a warmer climate on glacier melt and evaporation in the Indus Basin. They showed that a 2 °C increase in temperature will lead to a reduction of annual snow melt by about 18% in a snow-fed basin, but an increase by about 33% in a glacier-fed basin. Also, in a study on the Tianshan glacier state by Wang et al. [57], it was shown that temperature is the dominant factor affecting Tianshan’s glacier state. As such, the increase in precipitation around Geladandong during 2000–2009 (Figure 8) may have created a positive mass balance around Geladandong, but it was offset by the increased temperature, eventually leading to the ICESat-detected glacier elevation decline and the increased river discharges.

4.2. The Limitations and Development of ICESat Determination of Glacier Elevation Change

The method for processing the ICESat and SRTM in this paper is an effective method and has been widely used in previous studies, such as Kääb et al. [23], Gardner et al. [5], and Neckel et al. [4]. Our results are consistent with those from other studies. For example, Yao et al. [9] showed the states of a number of glaciers in the QTP using topographic maps, satellite images, and in situ observations. One of the glaciers studied by Yao et al. [9] is the Xiaodongkemadi glacier (33.07° N, 92.08° E), which is located near the Geladandong glacier and was retreating. In this paper, not only are the detailed lowering rates of Geladandong glacier are determined by ICESat and SRTM, but the causes of the decline are also studied using the climatic records shown in Section 2.4. In addition, the ICESat follow-up mission will be launched in 2017. Methods for processing data from the ICESat follow-on mission for detecting glacier elevation changes will be more or less similar to the method used in this paper.
Due to the limited number of ICESat observations in Tibet and the fact that ICESat did not repeat ground tracks within ±59° latitude [4], we cannot determine glacier elevation changes from ICESat without auxiliary data such as a SRTM DEM. As such, the uncertainties in the auxiliary data will also contribute errors to glacier elevation changes. The combined error from ICESat and SRTM and the ICESat data density are reflected in the disrupted time series in Figure 4 and the uncertainties of glacier elevation change rates in Table 1 and Table 2. This data problem will occur not only over Geladandong, but also elsewhere in Tibet and the Himalayas, where the glacier states are highly important for assessing the effect of global warming. A plausible solution for this data problem for the ICESat follow-up mission is to control the attitude of the mission to repeat its ground tracks, much like the repeat ground tracks of a radar altimeter mission.

5. Conclusions

This paper uses the elevation measurements from ICESat and the reference elevations from a 3-arc-second DEM of SRTM to determine glacier elevation changes around Geladandong. Compared to previous studies, we identify a refined spatial coverage of Geladandong glaciers and use two methods (robust fitting and rate averaging) to estimate rates of elevation changes, and present a detailed analysis for errors associated with these two methods and for errors in elevation changes from ICESat and SRTM. The rates of elevation changes in the western, central, and eastern regions of Geladandong were all negative, suggesting that the Geladandong glaciers were thinning. The glacier thinning has resulted in increased discharges at the Tuotuohe and Chumda river gauge stations over 1956–2012. Using weather records from Tuotuohe, Wudaoliang, and Anduo weather stations, we attribute the glacier thinning to temperature increases around Geladandong.
Geladandong glaciers provide the source water for the Yangtze River. An unabated melting of Geladandong glaciers will reduce such a supply, leading to reductions in river fluxes and freshwater supplies in YRSR and subsequently in the Yangtze River Basin, which has a population of 0.5 billion people. Furthermore, the ICESat result indicates that the Geladandong glaciers were continually shrinking over 2000–2009. If the shrinkage continues, it may lead to the worst-case scenario: the Geladandong glaciers will completely disappear, causing irreversible socioeconomic consequences and a seriously degraded ecological system in the Yangtze River Basin. Therefore, the glacier state of Geladandong should be continuously monitored by satellite-borne sensors such as the follow-up mission of ICESat, for an in-depth understanding of the long-term impact of global climate change on high-altitude glaciers in Tibet.

Acknowledgments

We are grateful to NASA for the ICESat and SRTM data. This study was supported by NSFC (China) under Grants 41274032, 41474018, and 41429401, by the National 973 Project of China, under Grants 2013CB733301 and 2013CB733302, and by the Basic Research Foundation 14-02-04 of the Key Laboratory of Geospace Environment and Geodesy of Ministry of Education, Wuhan University. The study was also partially supported by the Ministry of Science and Technology of Taiwan, under Grants 103-2221-E-009-114-MY3 and 104-2611-M-009-001. We thank guest editor Yuei-An Liu for inviting the corresponding author to present parts of this work in a keynote speech of ICEO&SI 2016.

Author Contributions

Zhengtao Wang initiated this study. Nengfang Chao, Zhengtao Wang, and Cheinway Hwang carried out the data analyses and wrote the first draft; Cheinway Hwang finalized the data interpretations and the draft; Taoyong Jin and Yung-Sheng Cheng helped with some of the plots and data analyses.

Conflicts of Interest

The authors declare no conflict of interest.

References

  1. Farrington, D.F. Impacts of Climate Change on the Yangtze Source Region and Adjacent Areas; China Meteorological Press, World Wide Fund China-Lhasa Programme Office: Beijing, China, 2010. [Google Scholar]
  2. Yang, J.P.; Ding, Y.J.; Liu, S.Y.; Lu, A.-X.; Chen, R.-S. Glacier change and its effect on surface runoff in the source region of the Yangtze and Yellow rivers. J. Nat. Res. 2003, 18, 595–602. (In Chinese) [Google Scholar]
  3. Zhang, J.; Braaten, D.; Li, X.; She, J.; Tao, F. An inventory of glacier changes between 1973 and 2011 for the Geladandong Mountain area, China. Cryosphere 2013, 7, 507–531. [Google Scholar] [CrossRef]
  4. Neckel, N.; Kropáček, J.; Bolch, T.; Hochschild, V. Glacier mass changes on the Tibetan Plateau 2003–2009 derived from ICESat laser altimetry measurements. Environ. Res. Lett. 2014, 9, 014009. [Google Scholar] [CrossRef]
  5. Gardner, A.S.; Moholdt, G.; Cogley, J.G.; Wouters, B.; Arendt, A.A.; Wahr, J.; Berthier, E.; Hock, R.; Pfeffer, W.T.; Kaser, G.; et al. A Reconciled Estimate of Glacier Contributions to Sea Level Rise: 2003 to 2009. Science 2013, 340, 852–857. [Google Scholar] [CrossRef] [PubMed] [Green Version]
  6. Oerlemans, J. Glaciers and Climate Change; A. A. Balkema Publishers: Leiden, The Netherlands, 2001. [Google Scholar]
  7. Vincent, C. Influence of climate change over the 20th Century on four French glacier mass balances. J. Geophys. Res. 2002, 107, 4375–4386. [Google Scholar] [CrossRef]
  8. Jacob, T.; Wahr, J.; Pfeffer, W.; Swenson, S. Recent contributions of glaciers and ice caps to sea level rise. Nature 2012, 482, 514–518. [Google Scholar] [CrossRef] [PubMed]
  9. Yao, T.; Thompson, L.; Yang, W.; Yu, W.; Gao, Y.; Guo, X.; Yang, X.; Duan, K.; Zhao, H.; Xu, B.; et al. Different glacier status with atmospheric circulations in Tibetan Plateau and surroundings. Nat. Clim. Chang. 2012, 2, 663–667. [Google Scholar] [CrossRef]
  10. Dobhal, D.; Gergan, J.; Thayyen, R. Mass balance studies of the Dokirani Glacier from 1992 to 2000 Garhwal Himalaya. India Bull. Glaciol. Res. 2008, 25, 9–17. [Google Scholar]
  11. Fujita, K.; Nuimura, T. Spatially heterogeneous wastage of Himalayan glaciers. Proc. Natl. Acad. Sci. USA 2011, 108, 14011–14014. [Google Scholar] [CrossRef] [PubMed]
  12. Azam, M.; Wagnon, P.; Ramanathan, A.; Vincent, C.; Sharma, P.; Arnaud, Y.; Linda, A.; Pottakkal, J.G.; Chevallier, P.; Singh, V.B.; et al. From balance to imbalance: A shift in the dynamic behaviour of Chhota Shigri glacier, western Himalaya, India. J. Glaciol. 2012, 58, 315–324. [Google Scholar] [CrossRef]
  13. Bolch, T.; Kulkarni, A.; Kääb, A.; Huggel, C.; Paul, F.; Cogley, J.G.; Frey, H.; Kargel, J.S.; Fujita, K.; Scheel, M.; et al. The state and fate of Himalayan Glaciers. Science 2012, 336, 310–314. [Google Scholar] [CrossRef] [PubMed] [Green Version]
  14. Vincent, C.; Ramanathan, A.; Wagnon, P.; Dobhal, D.P.; Linda, A.; Berthier, E.; Sharma, P.; Arnaud, Y.; Azam, M.F.; Jose, P.G.; et al. Balanced conditions or slight mass gain of glaciers in the Lahaul and Spiti region (northern India, Himalaya) during the nineties preceded recent mass loss. Cryosphere 2013, 7, 569–582. [Google Scholar] [CrossRef] [Green Version]
  15. World Glacier Monitoring Service. Available online: http://wgms.ch/ (accessed on 12 January 2017).
  16. Rabatel, A.; Dedieu, J.; Vincent, C. Using remote-sensing data to determine equilibrium-line altitude and mass-balance time series: Validation on three French glaciers, 1994–2002. J. Glaciol. 2005, 51, 539–546. [Google Scholar] [CrossRef]
  17. Kulkarni, A.; Rathore, B.; Singh, S.; Bahuguna, I. Understanding changes in the Himalayan cryosphere using remote sensing techniques. Int. J. Remote Sens. 2011, 32, 601–615. [Google Scholar] [CrossRef]
  18. Immerzeel, W.W.; Pellicciotti, F.; Shrestha, A. Glaciers as a proxy to quantify the spatial distribution of precipitation in the Hunza basin. Mt. Res. Dev. 2012, 32, 30–38. [Google Scholar] [CrossRef]
  19. Matsuo, K.; Heki, K. Time-variable ice loss in Asian high mountains from satellite gravimetry. Earth Planet. Sci. Lett. 2010, 290, 30–36. [Google Scholar] [CrossRef]
  20. Zhang, G.; Yao, T.; Xie, H.; Kang, S.; Lei, Y. Increased mass over the Tibetan Plateau: From lakes or glaciers? Geophys. Res. Lett. 2013, 40, 2125–2130. [Google Scholar] [CrossRef]
  21. Berthier, E.; Arnaud, Y.; Kumar, R.; Ahmad, S.; Wagnon, P.; Chevallier, P. Remote sensing estimates of glacier mass balances in the Himachal Pradesh (Western Himalaya, India). Remote Sens. Environ. 2007, 108, 327–338. [Google Scholar] [CrossRef] [Green Version]
  22. Bolch, T.; Pieczonka, T.; Benn, D.I. Multi-decadal mass loss of glaciers in the Everest area (Nepal Himalaya) derived from stereo imagery. Cryosphere 2011, 5, 349–358. [Google Scholar] [CrossRef] [Green Version]
  23. Kääb, A.; Berthier, E.; Nuth, C.; Gardelle, J.; Arnaud, Y. Contrasting patterns of early 21st century glacier mass change in the Himalayas. Nature 2012, 488, 495–498. [Google Scholar] [CrossRef] [PubMed]
  24. Nuimura, T.; Fujita, K.; Yamaguchi, S.; Sharma, R. Elevation changes of glaciers revealed by multitemporal digital elevation models calibrated by GPS survey in the Khumbu region, Nepal Himalaya, 1992–2008. J. Glaciol. 2012, 58, 648–656. [Google Scholar] [CrossRef]
  25. Pieczonka, T.; Bolch, T.; Wei, J.F.; Liu, S.Y. Heterogeneous mass loss of glaciers in the Aksu-Tarim Catchment (Central Tien Shan) revealed by 1976 KH-9 Hexagon and 2009 SPOT-5 stereo imagery. Remote Sens. Environ. 2013, 130, 233–244. [Google Scholar] [CrossRef] [Green Version]
  26. Gardelle, J.; Berthier, E.; Arnaud, Y. Slight mass gain of Karakorum glaciers in the early 21st century. Nat. Geosci. 2012, 5, 322–325. [Google Scholar] [CrossRef]
  27. Huss, M. Density assumptions for converting geodetic glacier volume change to mass change. Cryosphere 2013, 7, 877–887. [Google Scholar] [CrossRef]
  28. Paul, F.; Kääb, A.; Maisch, M.; Kellenberger, T.; Haeberli, W. The new remote-sensing-derived Swiss glacier inventory: I. Methods. Ann. Glaciol. 2002, 34, 355–361. [Google Scholar] [CrossRef] [Green Version]
  29. Scherler, D.; Bookhagen, B.; Strecker, M.R. Hillslope-glacier coupling: The interplay of topography and glacial dynamics in High Asia. J. Geophys. Res. Earth 2011, 116. [Google Scholar] [CrossRef]
  30. Li, X. GLIMS Glacier Database (Boulder, CO: National Snow and Ice Data Center/World Data Center for Glaciology) Digital Media. 2003. Available online: http://www.glims.org/ (accessed on 12 January 2017).
  31. Guo, W.Q.; Liu, S.Y.; Xu, J.L.; Wu, L.Z.; Shangguan, D.H.; Yao, X.J.; Wei, J.F.; Bao, W.J.; Yu, P.C.; Liu, Q.; et al. The second Chinese glacier inventory: Data, methods and results. J. Glaciol. 2015, 61, 357–372. [Google Scholar] [CrossRef]
  32. SRTM Data Search. Available online: http://srtm.csi.cgiar.org/SELECTION/inputCoord.asp (accessed on 10 May 2016).
  33. Nuth, C.; Kääb, A. Co-registration and bias corrections of satellite elevation data sets for quantifying glacier thickness change. Cryosphere 2011, 5, 271–290. [Google Scholar] [CrossRef]
  34. Gardelle, J.; Berthier, E.; Arnaud, Y. Impact of resolution and radar penetration on glacier elevation changes computed from multi-temporal DEMs. J. Glaciol. 2012, 58, 419–422. [Google Scholar] [CrossRef]
  35. Advanced Spaceborne Thermal Emission and Reflection Radiometer (ASTER). Available online: http://gdem.ersdac.jspacesystems.or.jp/ (accessed on 11 May 2016).
  36. Kääb, A. Glacier Volume Changes Using ASTER Satellite Stereo and ICESat GLAS Laser Altimetry, A Test Study on Edgeya, Eastern Svalbard. IEEE Int. Geosci. Remote Sens. 2008, 46, 2823–2830. [Google Scholar] [CrossRef]
  37. Huber, P.J. Robust Statistics; John Wiley and Sons: Hoboken, NJ, USA, 1981. [Google Scholar]
  38. Nicolas, B.; Nicolas, L.; Hani, A.; Jean, S.B. The Relevance of GLAS/ICESat Elevation Data for the Monitoring of River Networks. Remote Sens. 2011, 3, 708–720. [Google Scholar]
  39. Moholdt, G.; Nuth, C.; Hagen, J.; Kohler, J. Recent elevation changes of Svalbard glaciers derived from ICESat laser altimetry. Remote Sens. Environ. 2010, 114, 2756–2767. [Google Scholar] [CrossRef]
  40. Surazakov, A.B.; Aizen, V.B. Estimating volume change of mountain glaciers using SRTM and map-based topographic data. IEEE Trans. Geosci. Remote Sens. 2006, 44, 2991–2995. [Google Scholar] [CrossRef]
  41. Brenner, A.C.; Bentley, C.R.; Csatho, B.M.; Harding, D.J.; Hofton, M.A.; Minster, J.; Roberts, L.; Saba, J.L.; Schutz, R.; Thomas, R.H.; et al. Derivation of Range and Range Distributions From Laser Pulse Waveform Analysis for Surface Elevations, Roughness, Slope, and Vegetation Heights, version 3.0; Algorithm Theoretical Basis Document; Goddard Space Flight Center: Greenbelt, MD, USA, 2003. [Google Scholar]
  42. Bliss, A.; Hock, R.; Radić, V. Global response of glacier runoff to twenty-first century climate change. J. Geophys. Res. Earth Surf. 2014, 119, 717–730. [Google Scholar] [CrossRef]
  43. Pu, J.; Yao, T.; Yang, M.; Tian, L.; Wang, L.N.; Ageta, Y.; Fujita, K. Rapid decrease of mass balance observed in the Xiao (Lesser) Dongkemadi Glacier, in the central Tibetan Plateau. Hydrol. Process. 2008, 22, 2953–2958. [Google Scholar] [CrossRef]
  44. Moholdt, G.; Wouters, B.; Gardner, A.S. Recent mass changes of glaciers in the Russian High Arctic. Geophys. Res. Lett. 2012, 39, L10502. [Google Scholar] [CrossRef]
  45. Zong, J.B.; Ye, Q.H.; Tian, L.D. Recent Naimona’Nyi glacier surface elevation changes on the Tibetan Plateau based on ICESat/GLAS, SRTM DEM and GPS measurements. Chin. Sci. Bull. 2013, 58, 2108–2118. (In Chinese) [Google Scholar] [CrossRef]
  46. China Meteorological Data Service Center. Available online: http://cdc.nmic.cn/home.do (accessed on 13 January 2017).
  47. Sun, Y.S.; Duan, S.Q.; Li, Y.; Cao, G.C. Variation characteristics and trend analysis of runoff at the source regions of the three rivers in Qinghai during recent years. J. Water Resour. Eng. 2015, 26, 52–57. (In Chinese) [Google Scholar]
  48. Niño 3.4 Sea Surface Temperature Index. Available online: http://www.esrl.noaa.gov/psd/gcos_wgsp/Timeseries/Nino34/ (accessed on 26 May 2016).
  49. Kang, E.; Cheng, G.D.; Dong, Z.C. Glacier-Snow Water Resources and Mountain Runoff in the Arid Area of Northwest China; Science Press: Beijing, China, 2002; pp. 14–54. (In Chinese) [Google Scholar]
  50. Shi, Y.F. Concise Glacier Inventory of China; Shanghai Popular Science Press: Shanghai, China, 2008; pp. 1–205. [Google Scholar]
  51. Oerlemans, J. Extracting a climate signal from 169 glacier records. Science 2005, 308, 675–677. [Google Scholar] [CrossRef] [PubMed]
  52. Raper, S.; Brown, O.; Braithwaite, R.J. A geometric glacier model for sea-level change calculations. J. Glaciol. 2000, 46, 357–368. [Google Scholar] [CrossRef]
  53. Zhang, Y.; Fujita, K.; Ageta, Y.; Nakawo, M.; Yao, T.; Pu, J. The response of glacier ELA to climate fluctuations on High-Asia. Bull. Glacier Res. 1998, 16, 1–11. [Google Scholar]
  54. Liu, S.Y.; Xie, Z.C.; Wang, N.L.; Ye, B. Mass balance sensitivity to climate change: A case study of Glacier No. 1 at Urumqi Riverhead, Tianshan Mountains, China. Chin. Geogr. Sci. 1999, 9, 134–140. [Google Scholar] [CrossRef]
  55. Li, Z.Q.; Han, T.D.; Jing, Z.F.; Yang, H.A.; Jiao, K.Q. A summary of 40-year observed variation facts of climate and Glacier No. 1 at headwater of Urumqi River, Tianshan, China. J. Glaciol. Geocryol. 2003, 25, 117–123. (In Chinese) [Google Scholar]
  56. Singh, P.; Bengtsson, L. Impact of warmer climate on melt and evaporation for the rainfed, snowfed and glacierfed basins in the Himalayan region. J. Hydrol. 2005, 300, 140–154. [Google Scholar] [CrossRef]
  57. Wang, S.; Zhang, M.; Li, Z.; Wang, F.; Li, H.; Li, Y.; Huang, X. Glacier area variation and climate change in the Chinese Tianshan Mountains since 1960. J. Geogr. Sci. 2011, 21, 263–273. [Google Scholar] [CrossRef]
Figure 1. (a) The topography of the Qinghai-Tibetan plateau with locations of major rivers in Yangtze River’s source region; (b) the Geladandong snow mountain group (bordered by the red box), major rivers in the watershed of the source region, Tuotuohe, Wudaoliang, and Anduo weather stations, and Tuotuohe and Chumda river gauge stations; (c) CGI-defined glacier boundaries in Regions A, B, C, and D and Ice footprints from ICESat.
Remotesensing 09 00075 g001
Figure 2. Elevation differences due to different coordinate frames (registration-induced errors). (a) A 2D scheme of elevation differences induced by a coordinate shift; (b) elevation differences following the relationship in Equation (1) between the vertical deviations normalized by the slope tangent (y-axis) and the terrain aspect (x-axis). (The method is from Nuth and Kääb [33]).
Remotesensing 09 00075 g002
Figure 3. The flowchart for determining glacier elevation changes and their rates using ICESat measurements and the SRTM DEM.
Remotesensing 09 00075 g003
Figure 4. (a) Glacier elevation changes and the estimated rates for the entire Geladandong (red box). Rates are determined using all median values of elevation differences between ICESat and SRTM over ICESat footprints (Section 2.3). The rates are determined in (a) the entire glacier area (marked with ICESat cycles) using corrected and uncorrected SRTM elevations and (b) in the accumulation and ablation areas using corrected SRTM elevations.
Remotesensing 09 00075 g004
Figure 5. Same as Figure 4, but for Region C only. The rates are determined (a) in Region C using corrected and uncorrected SRTM elevations and (b) in the accumulation and ablation areas using corrected SRTM elevations.
Remotesensing 09 00075 g005
Figure 6. (a) Time series of yearly glacier elevation changes from the differences between ICESat and SRTM-derived heights in Region C; (b) yearly rates of glacier elevation changes in different years from Equation (6) (change is marked at the mean time of a year) in Region C.
Remotesensing 09 00075 g006
Figure 7. Monthly temperature, precipitation, and evaporation at (a) Tuotuohe weather station over 1970–2009; (b) Wudaoliang weather station over 1981–2010; and (c) Anduo weather station over 1981–2010.
Remotesensing 09 00075 g007
Figure 8. Mean annual temperatures (T, blue), annual precipitations (P, black)) at (a) Tuotuohe weather station; (b) Wudaoliang weather station; and (c) Anduo weather station, fitted by straight lines y = ax + b over different periods of time. (x is time, y is T or P, a is the rate in °C/year or mm/year, and b is a constant). Overlapped in (ac) are elevation changes from Figure 4, shifted by 4 m. The vertical labels on the right are for both temperature and shifted elevation change.
Remotesensing 09 00075 g008
Figure 9. Mean annual maximum temperatures (red) and minimum temperatures (blue) at (a) Tuotuohe weather station over 1979–2009; (b) Wudaoliang weather station over 1957–2013; and (c) Anduo weather station over 1966–2013, fitted by lines described in Figure 8. Overlapped in (ac) are elevation changes from Figure 4, shifted by 10 m. The vertical labels on the right are for mean annual minimum temperature and shifted elevation change.
Remotesensing 09 00075 g009
Figure 10. Annual river discharges at (a) Tuotuohe and (b) Chumda River gauge stations over 1956–2012, fitted by lines as described in Figure 8 (Source: Sun et al. [43]); the vertical labels on the right are for elevation changes from Figure 4 in (a) and (b); (c) the Niño 3.4 index over 1975–2014, showing the large positive temperature anomalies during the 1982–1983 and 1997–1998 El Niños.
Remotesensing 09 00075 g010
Table 1. Rates of glacier elevation changes by robust fitting.
Region and Time PeriodRate of Elevation Change from Robust Fitting *
Accumulation Area (m·a−1)Ablation Area (m·a−1)Entire Area (m·a−1)Off-Glacier Area (m·a−1)
Geladandong (2003–2009)+0.075 ± 0.223−0.123 ± 0.109−0.158 ± 0.066−0.010 ± 0.059
C (2003–2008)−0.291 ± 0.818−0.128 ± 0.097−0.176 ± 0.102−0.007 ± 0.063
* Because only few ICESat laser periods over glacier footprints are available in Regions A and B, here no rates are determined by robust fitting. The locations of Regions A–C are shown in Figure 1 and the fitted lines are shown in Figure 4 and Figure 5. Uncertainties correspond to a 95% confidence interval.
Table 2. Statistics of differences between ICESat and SRTM-derived heights and rates in Regions A, B, and C from Equation (6).
RegionYearSeasonICESat CycleNo. of ICESat over Non-GlacierNo. of ICESat over GlacierTime Difference with SRTM (Year)Elevation Range (m)Difference before Corrections (m)Difference after Corrections (m)Rate before Corrections (m·a−1)Rate after Corrections (m·a−1)Mean Rate (m·a−1)
A2004WinterL2C144255389.74/6013.87−4.830−2.988−0.966−0.598−0.598 ± 0.368
FallL3A3011855264.05/6044.73−2.854−2.702−0.571−0.540−0.540 ± 0.031
Mean −3.842−2.845−0.769−0.569−0.569 ± 0.200
2006WinterL3E3710865352.27/5970.55−7.281−1.838−1.214−0.306−0.306 ± 0.908
2008WinterL3J4411785356.57/6036.16−0.202−1.480−0.025−0.185−0.185 ± 0.160
FallL2D2211295259.85/6040.47−2.813−2.247−0.313−0.250−0.250 ± 0.063
Mean −1.508−1.864−0.169−0.218−0.218 ± 0.049
2009WinterL2E4895696.00/5818.38−7.281−5.169−0.809−0.574−0.574 ± 0.235
Mean −0.740−0.418−0.418 ± 0.322
B2003FallL2A4216745320.61/6052.85−1.674−1.728−0.412−0.432−0.432 ± 0.020
C2003FallL2A1855745157.24/5657.92−2.714−1.687−0.679−0.422−0.422 ± 0.257
2004WinterL2B1846745174.79/5895.91−2.269−0.597−0.567−0.149−0.149 ± 0.418
SummerL2C171755213.84/5811.41−2.391−3.947−0.478−0.789−0.789 ± 0.311
FallL3A1225255215.5/5888.92−2.283−1.237−0.457−0.247−0.247 ± −0.210
Mean −2.314−1.927−0.501−0.395−0.395 ± 0.106
2005WinterL3B1026255219.9/5984.17−2.194−1.623−0.439−0.324−0.324 ± 0.115
SummerL3C1034465204.58/5745.15−2.373−3.373−0.400−0.562−0.562 ± 0.162
FallL3D1876465202.93/5702.13−2.219−0.642−0.370−0.107−0.107 ± 0.263
Mean −2.262−1.879−0.403−0.331−0.331 ± 0.072
2006WinterL3E1545165208.13/5856.86−2.986−2.616−0.498−0.436−0.436 ± 0.062
SummerL3F1236375141.87/5961.69−2.619−1.074−0.374−0.153−0.153 ± 0.221
FallL3G1955675185.33/5696.44−3.066−1.359−0.438−0.194−0.194 ± 0.244
Mean −2.890−1.683−0.437−0.261−0.261 ± 0.176
2007WinterL3H925775214.19/5938.8−3.386−1.321−0.484−0.188−0.188 ± 0.296
FallL3I1915885199.65/5855.53−2.144−2.630−0.268−0.329−0.329 ± 0.061
Mean −2.765−1.976−0.376−0.259−0.259 ± 0.117
2008WinterL3J564585197.92/5655.95−3.474−2.775−0.434−0.346−0.346 ± 0.088
FallL3K1072195188.28/5723.47−3.798−3.356−0.422−0.373−0.373 ± 0.049
FallL2D763995259.42/5643.58−2.095−0.438−0.233−0.049−0.049 ± 0.184
Mean −3.122−2.190−0.363−0.256−0.256 ± 0.107
Mean −0.460−0.321−0.321 ± 0.139

