Article

Global Surface Net-Radiation at 5 km from MODIS Terra

1
Jet Propulsion Laboratory, California Institute of Technology, 4800 Oak Grove Dr., Pasadena, CA 91109, USA
2
Department of Environmental Research and Innovation (ERIN), Luxembourg Institute of Science and Technology (LIST), Belvaux L-4422, Luxembourg
3
Department of Landscape Architecture and Rural Systems Engineering, Seoul National University, Seoul 151-921, Korea
4
Japan Agency for Marine-Earth Science and Technology, Yokohama 236-0001, Japan
5
Lawrence Berkeley National Laboratory, 1 Cyclotron Road, Berkeley, CA 94720, USA
6
Department of Environmental Systems Science, ETH Zurich, Zurich 8092, Switzerland
7
Environmental Research Institute, Civil and Environmental Engineering Department, University College, Cork T12P2FY, Ireland
8
Institute of Ecology, University of Innsbruck, Sternwartestr. 15, Innsbruck 6020, Austria
9
Research Group of Plant and Vegetation Ecology, Department of Biology, University of Antwerp, Antwerp 2610, Belgium
10
CIRAD, UMR Eco & Sols (Ecologie Fonctionnelle & Biogéochimie des Sols & Agroécosystèmes), Montpellier 34000, France
11
CATIE (Tropical Agricultural Centre for Research and Higher Education), Turrialba 93-7170, Costa Rica
12
Institute of Biometeorology (IBIMET—CNR), via G.Caproni 8, Firenze 50145, Italy
13
School of Geography and Earth Sciences, McMaster Centre for Climate Change, McMaster University, 1280 Main Street West, Hamilton, ON L8S 4K1, Canada
14
European Commission, Joint Research Centre, Directorate for Sustainable Resources, Ispra 21027, Italy
*
Author to whom correspondence should be addressed.
Remote Sens. 2016, 8(9), 739; https://doi.org/10.3390/rs8090739
Submission received: 20 April 2016 / Revised: 17 August 2016 / Accepted: 23 August 2016 / Published: 6 September 2016

Abstract

:
Reliable and fine resolution estimates of surface net-radiation are required for estimating latent and sensible heat fluxes between the land surface and the atmosphere. However, currently, fine resolution estimates of net-radiation are not available and consequently it is challenging to develop multi-year estimates of evapotranspiration at scales that can capture land surface heterogeneity and are relevant for policy and decision-making. We developed and evaluated a global net-radiation product at 5 km and 8-day resolution by combining mutually consistent atmosphere and land data from the Moderate Resolution Imaging Spectroradiometer (MODIS) on board Terra. Comparison with net-radiation measurements from 154 globally distributed sites (414 site-years) from the FLUXNET and Surface Radiation budget network (SURFRAD) showed that the net-radiation product agreed well with measurements across seasons and climate types in the extratropics (Wilmott’s index ranged from 0.74 for boreal to 0.63 for Mediterranean sites). Mean absolute deviation between the MODIS and measured net-radiation ranged from 38.0 ± 1.8 W∙m−2 in boreal to 72.0 ± 4.1 W∙m−2 in the tropical climates. The mean bias was small and constituted only 11%, 0.7%, 8.4%, 4.2%, 13.3%, and 5.4% of the mean absolute error in daytime net-radiation in boreal, Mediterranean, temperate-continental, temperate, semi-arid, and tropical climate, respectively. To assess the accuracy of the broader spatiotemporal patterns, we upscaled error-quantified MODIS net-radiation and compared it with the net-radiation estimates from the coarse spatial (1° × 1°) but high temporal resolution gridded net-radiation product from the Clouds and Earth’s Radiant Energy System (CERES). Our estimates agreed closely with the net-radiation estimates from the CERES. Difference between the two was less than 10 W·m−2 in 94% of the total land area. MODIS net-radiation product will be a valuable resource for the science community studying turbulent fluxes and energy budget at the Earth’s surface.

Graphical Abstract

1. Introduction

Surface net-radiation is a critical component of the global water and energy cycle [1]. It couples the land surface to the lower atmosphere and exerts a dominant control on the terrestrial hydrological cycle [2,3,4]. Fine scale, error-quantified estimates of net-radiation are required to understand and model nonlinear, heterogeneous land–atmosphere interactions [5] and estimate evapotranspiration (ET) and sensible heat flux. However, currently, remote sensing-based surface net-radiation estimates are available at moderate spatial resolution [6,7,8]. Similarly, modeled-data assimilated reanalysis products such as Modern-Era Retrospective Analysis for Research and Applications (MERRA) and ERA40 [9,10] are also available at coarse spatial resolution. Both remote sensing and reanalysis-based products have high temporal resolution, but because of their coarse spatial resolution are not suitable for developing global and continental scale estimates of ET at fine spatial resolution. Although the MODIS ET product (MOD16) [11] is available at 1 km resolution, it, in fact, uses net-radiation derived from reanalysis at coarse spatial resolution (0.66° or higher). In a recent study, Jiang et al. [12] developed a high resolution net-radiation product using non-linear empirical methods. In this study, we develop and evaluate a global daily net-radiation product at 5 km, derived from mutually consistent land and atmosphere data from the Moderate Resolution Imaging Spectroradiometer (MODIS) following an approach based on physical principles. Several studies [5,13,14,15,16] have used MODIS data to estimate net-radiation from local to regional scales. In this study, we build on previous efforts and derive net-radiation as an independent seamless product at 5 km spatial resolution and eight-day time step for the entire global land area by combining an atmospheric radiative transfer model [17] with land and atmosphere data from MODIS for 2001 to 2009. We rigorously evaluate our product using high-quality, field measurements from 154 field sites (414 site-years) spread all across the globe.
Amongst polar-orbiting sensors, MODIS provides consistent, daily, near-global observations of land and atmosphere in 36 different bands, and has been employed for estimating net-radiation at local and landscape scale [13,14,18]. These estimates showed good agreement with field measurements at local [14] and landscape scale [19]. Recently, Hendrix et al. [20] developed an effective, end-to-end system to reproject daily MODIS L2 swath products to the MODIS sinusoidal grid at the Lawrence Berkeley National Laboratory (LBNL). These reprojected and re-gridded MODIS products include the aerosol (MOD04) [21], precipitable water (MOD05) [22], cloud (MOD060 [23], atmospheric profile (MOD07) [24], and land surface temperature (LST; MOD11_L2) [25], and are available online (https://portal.nersc.gov/MODIS/) from 2000 to 2009. We make use of these datasets and combine three atmosphere and three land products and generate daily net-radiation at 5 km in all sky conditions. To evaluate the accuracy of our net-radiation estimates we compare them with field measurements from the “La Thuile” data of FLUXNET (147 sites) and Surface Radiation (SURFRAD; 7 sites) [26] network. The 154 FLUXNET and SURFRAD sites record net-radiation and its components at 30- and 3-min resolution, respectively, and are spread across different climate types. Thus, these sites provide the best available, high quality reference measurements for the evaluation of our global estimates from MODIS.
After quantifying the errors and uncertainty in the MODIS net-radiation product with the high spatial resolution field data, we upscale our product and compare it with the net-radiation estimates from the gridded net-radiation product from the Clouds and Earth’s Radiant Energy System—Energy Balanced and Filled (CERES-EBAF) [6]. CERES is one of the high priority missions of the National Aeronautics and Space Administration (NASA) and provides high quality estimates of the various components of the Earth’s energy cycle. The CERES net-radiation has coarse spatial resolution (1° × 1°), but is estimated at sub-daily temporal resolution and provides a high-quality reference to compare large-scale patterns modeled by the MODIS product.
The rest of this manuscript is organized as follows. In Section 2, we describe how MODIS and other ancillary data are combined to estimate the four components of surface net-radiation. We also provide details of the field measurements of surface net-radiation obtained from the FLUXNET and SURFRAD networks, share the characteristics of the CERES product, and describe the statistical methods and metrics used in evaluating the accuracy and reliability of our net-radiation product while taking uncertainty into account. In Section 3, we share results from our analyses about the accuracy and reliability of our product and also quantify errors and uncertainty in our estimates in different climate types. In Section 4, we discuss our results connecting them with the current state of knowledge. Finally, in Section 5, we discuss the main conclusions from the study.

2. Materials and Methods

2.1. Estimation of Instantaneous Net-Radiation at Satellite Overpass Time

Instantaneous net-radiation at the Earth’s surface is defined as follows:
R n = ( 1 a ) × S W i n + L W i n L W o u t
Here, Rn, a, SWin, LWin, and LWout are net-radiation, surface albedo, downwelling shortwave, downwelling longwave, and upwelling longwave radiation, respectively.
We computed downwelling shortwave radiation by the Forest Light Environmental Simulator (FLiES) [17], an atmosphere and plant canopy radiative transfer model. FLiES has a one dimensional atmospheric radiative transfer module, which is a simplified version of the three dimensional Monte Carlo Atmospheric Radiative Transfer Simulator (MCARaTS) [27]. FLiES integrates the optical effects of aerosols and clouds [28] and determine the atmospheric temperature, pressure, and water vapor profiles. We simulated the radiative transfer model in forward mode for all possible combination of input variables and generated a look-up table to reduce the computation time. For simulations, we discretized solar zenith angle at 5° step from 5° to 85° and aerosol optical thickness at 550 nm at 0.2 step from 0.1 to 0.9. We used 10 different discrete values of cloud optical thickness at 0.1, 0.5, 1, 5, 10, 20, 40, 60, 80, and 110, and 3 different values of land surface albedo at 0.1, 0.4, 0.7. We prescribed standard atmospheric profiles, aerosol, and cloud types following Hess et al. [28] and used Köppen-Geiger climate classification to demarcate climate types. We input cloud optical thickness, cloud top altitude, and solar zenith angle information from the MODIS cloud product (MOD06, 5 km, daily), aerosol optical thickness at 550 nm from the aerosol product (MOD04, 10 km, daily), shortwave albedo from the MODIS albedo product (MCD43B, 500 m, eight-day) [29], and land cover from the MODIS land surface dynamics product (MCD12, 500 m, yearly) [30,31]. We utilized the look-up table to compute the ratio of direct and diffuse radiation and estimated blue-sky albedo. We filled missing values in albedo and aerosol optical thickness using nearest neighbor interpolation from the nearby values in space. We searched for good quality data in the neighborhood of pixels with missing values and progressively enlarged the search window until we found sufficient good-quality similar pixels within the same MODIS tile. If a sufficient number of nearby values were not available in space, we assigned mean values based on the climate or land cover of a pixel.
We used emissivity and LST and computed upwelling longwave radiation according to the Stephen-Boltzmann law. For clear-sky days, we obtained emissivity in Band 31 (10.78–11.28 μm) and 32 (11.77–12.27 μm), and land surface temperature from MOD11. Following [32], we estimated broadband surface emissivity as in Equation (2) below.
ε s = 0.273 + 1.778 × ε 31 1.807 × ε 31 × ε 32 1.307 × ε 32 + 1.774 × ε 32 2
Here, εs, ε31, and ε32 are broadband surface emissivity, and emissivity in Band 31 and 32, respectively. For cloudy days, we assigned broadband emissivity based on the land cover of each pixel, and used temperature from National Centers for Environmental Prediction (NCEP) along with spatial averaging to fill the gaps. Note that even for clear days, emissivity values in the MOD11 product are prescribed and are estimated via a classification-based method [33].
The magnitude of downwelling longwave radiation depends on the emissivity and temperature of near surface air [2,34]. The MOD07 product provides atmospheric data at 20 different pressure levels ranging from 5 to 1000 hPa. The temperature and moisture profiles in MOD07 are retrieved using data from MODIS channels 25 (4.482–4.549 µm), 27 to 29 (6.535 to 8.579 µm), and from 30 to 36 (9.580 to 14.385 µm). The algorithms are based on the International TOVS Processing Package (ITPP), which retrieves the parameters in 4 steps: cloud detection, bias adjustment, regression retrieval, and nonlinear iterative physical retrieval [35,36]. The MODIS cloud mask (MOD35_L2) is used for cloud screening. The algorithm also requires NCEP analysis of surface pressure. Assuming that near-surface temperature is equal to the temperature at the maximum pressure level is likely to result in errors [5,37]. Thus, we first calculated the height difference between the two pressure-levels nearest to the surface using (3).
d z = R × T z 1 g 0 log ( p 1 p 2 )
Here, dz, R, Tz1, g0, p1, and p2 are height difference between two successive pressure levels in the MOD07 product, dry gas constant, temperature, acceleration due to gravity, and pressures, respectively. The value of dz showed variation in space and over season with the typical values around 400 m. Combining this information with temperatures at the corresponding levels, we calculated the lapse rate, and extrapolated air and dew point temperature to the near-surface level. For cloudy days, when information from the MOD07 product was not available, we substituted near-surface air temperature from the NCEP reanalysis datasets.
We calculated vapor pressure using dew point temperature as follows:
E a = 2.1718 × 10 10 × e 4157 T d 33.91
We then estimated air emissivity as follows [34].
ε a = 1 ( 1 + 0.465 E a T a ) × e ( 1.2 + 3 × 0.465 × E a T a ) 0.5
Here, Ea, Ta, and εa are vapor pressure, air temperature, and air emissivity, respectively. Unlike other studies that estimate cloudy and clear fraction in a pixel [38], we assumed that a pixel is completely cloudy or clear. This is a reasonable assumption given the fine spatial resolution of MODIS.
Several different empirical formulations have been suggested to estimate downwelling longwave radiation in cloudy conditions [39]. Each of these first calculates downwelling radiation for clear sky and then enhances it with empirical functions to account for additional radiation from clouds [40,41]. Alternatively, clear sky radiation is enhanced using cloud emissivity and cloud top temperature [5]. The empirical functions that account for additional radiation from cloudy sky often require local calibration and thus are unlikely to be valid at a global scale. Similarly, cloud top temperature is likely to be a poor proxy of cloud bottom temperature, which is required to calculate the actual downwelling radiation from clouds. For this study, we tested two different approaches. In the first, to enhance the radiation in cloudy sky we simply assumed that the atmosphere in cloudy conditions has an emissivity of a blackbody. In the second approach, we developed and calibrated empirical formulations specific to land cover based on FLUXNET data. We did not find any significant difference in the accuracy of estimated net-radiation between the two approaches, and hence in this study we are reporting our estimates based on the first approach, shown in Equations (6) and (7).
L W d = σ × T a 4
L W c = ε a × σ × T a 4
Here LWcl and LWc are incoming longwave radiation in cloudy and clear sky, respectively, σ is Stephen–Boltzman’s constant, εa is clear sky emissivity from Equation (4), and Ta is near-surface air temperature. Table 1 summarizes different MODIS products used in the estimation of the four components of net-radiation.

2.2. Instantaneous to Daily Net-Radiation

We computed instantaneous net-radiation at the MODIS Terra overpass time by combining downwelling and upwelling components of shortwave and longwave radiation as described in Equation (1). Following Bisht et al. [13,19], we used a sinusoidal curve to integrate instantaneous net-radiation to mean daytime (sunrise to sunset) values.
R n d a y t i m e = K × R i n s π × sin ( π × O v e r p a s s   t i m e     S u n r i s e   t i m e S u n r i s e   t i m e     S u n s e t   t i m e )
Here, Rndaytime is the integrated daytime net-radiation and Rnins is the instantaneous net-radiation at the satellite overpass time. In Bisht et al. [19], K is equal to 2 and sunrise and sunset time are set to an hour after the actual sunrise and an hour before the actual sunset time, respectively. Although Equation (8) is based on theoretical considerations, the sunrise and sunset times were modified to suit the landscape covered by Bisht et al. [19]. We used Equation (8) with two minor modifications: we input the actual sunrise and sunset time and found a K of 1.6 to be more appropriate for our global product.

2.3. MODIS Data

We obtained the required MODIS data from a variety of sources and at different resolutions. The reprojected daily MODIS products developed by Hendrix et al. [20] were downloaded from the data portal of the National Energy Research Scientific Computing Center (https://portal.nersc.gov/MODIS/) and included MOD04, MOD05, MOD06, MOD07 at 5 km and MOD11 at 1 km resolution. We downloaded MCD12Q1 (500 m, annual), MCD43B2 (1 km, 16 day), MCD43B3 (1 km, 16 day), MOD13A1 (500 m, 16 day), and MOD15A2 (1 km, 8 day) from the Land Process Distributed Active Archive Center (LP-DAAC, https://lpdaac.usgs.gov/products/MODIS_products_table), and acquired gridded NCEP datasets for temperature and specific humidity from the National Oceanic and Atmospheric Administration’s (NOAA) Earth System Research Laboratory (ESRL; http://www.esrl.noaa.gov/psd/data/reanalysis/reanalysis.shtml). In all, this represented approximately 14 terabytes of data from 2001 to 2009.
A significant amount of time was spent in downloading MODIS data for local availability. Global net-radiation calculations were performed in a parallel computing environment using institutional facilities of California Institute of Technology, Jet Propulsion Laboratory (JPL). We downloaded all of the MODIS data and indexed it for fast retrieval via an abstracted Python interface, which was invoked from within the MATLAB distributed computing environment on JPL’s SGI Altix cluster. Where necessary, resampling to 5 km was done on the fly, and all intermediate and final data products were stored on the local Lustre-based high performance parallel file system.

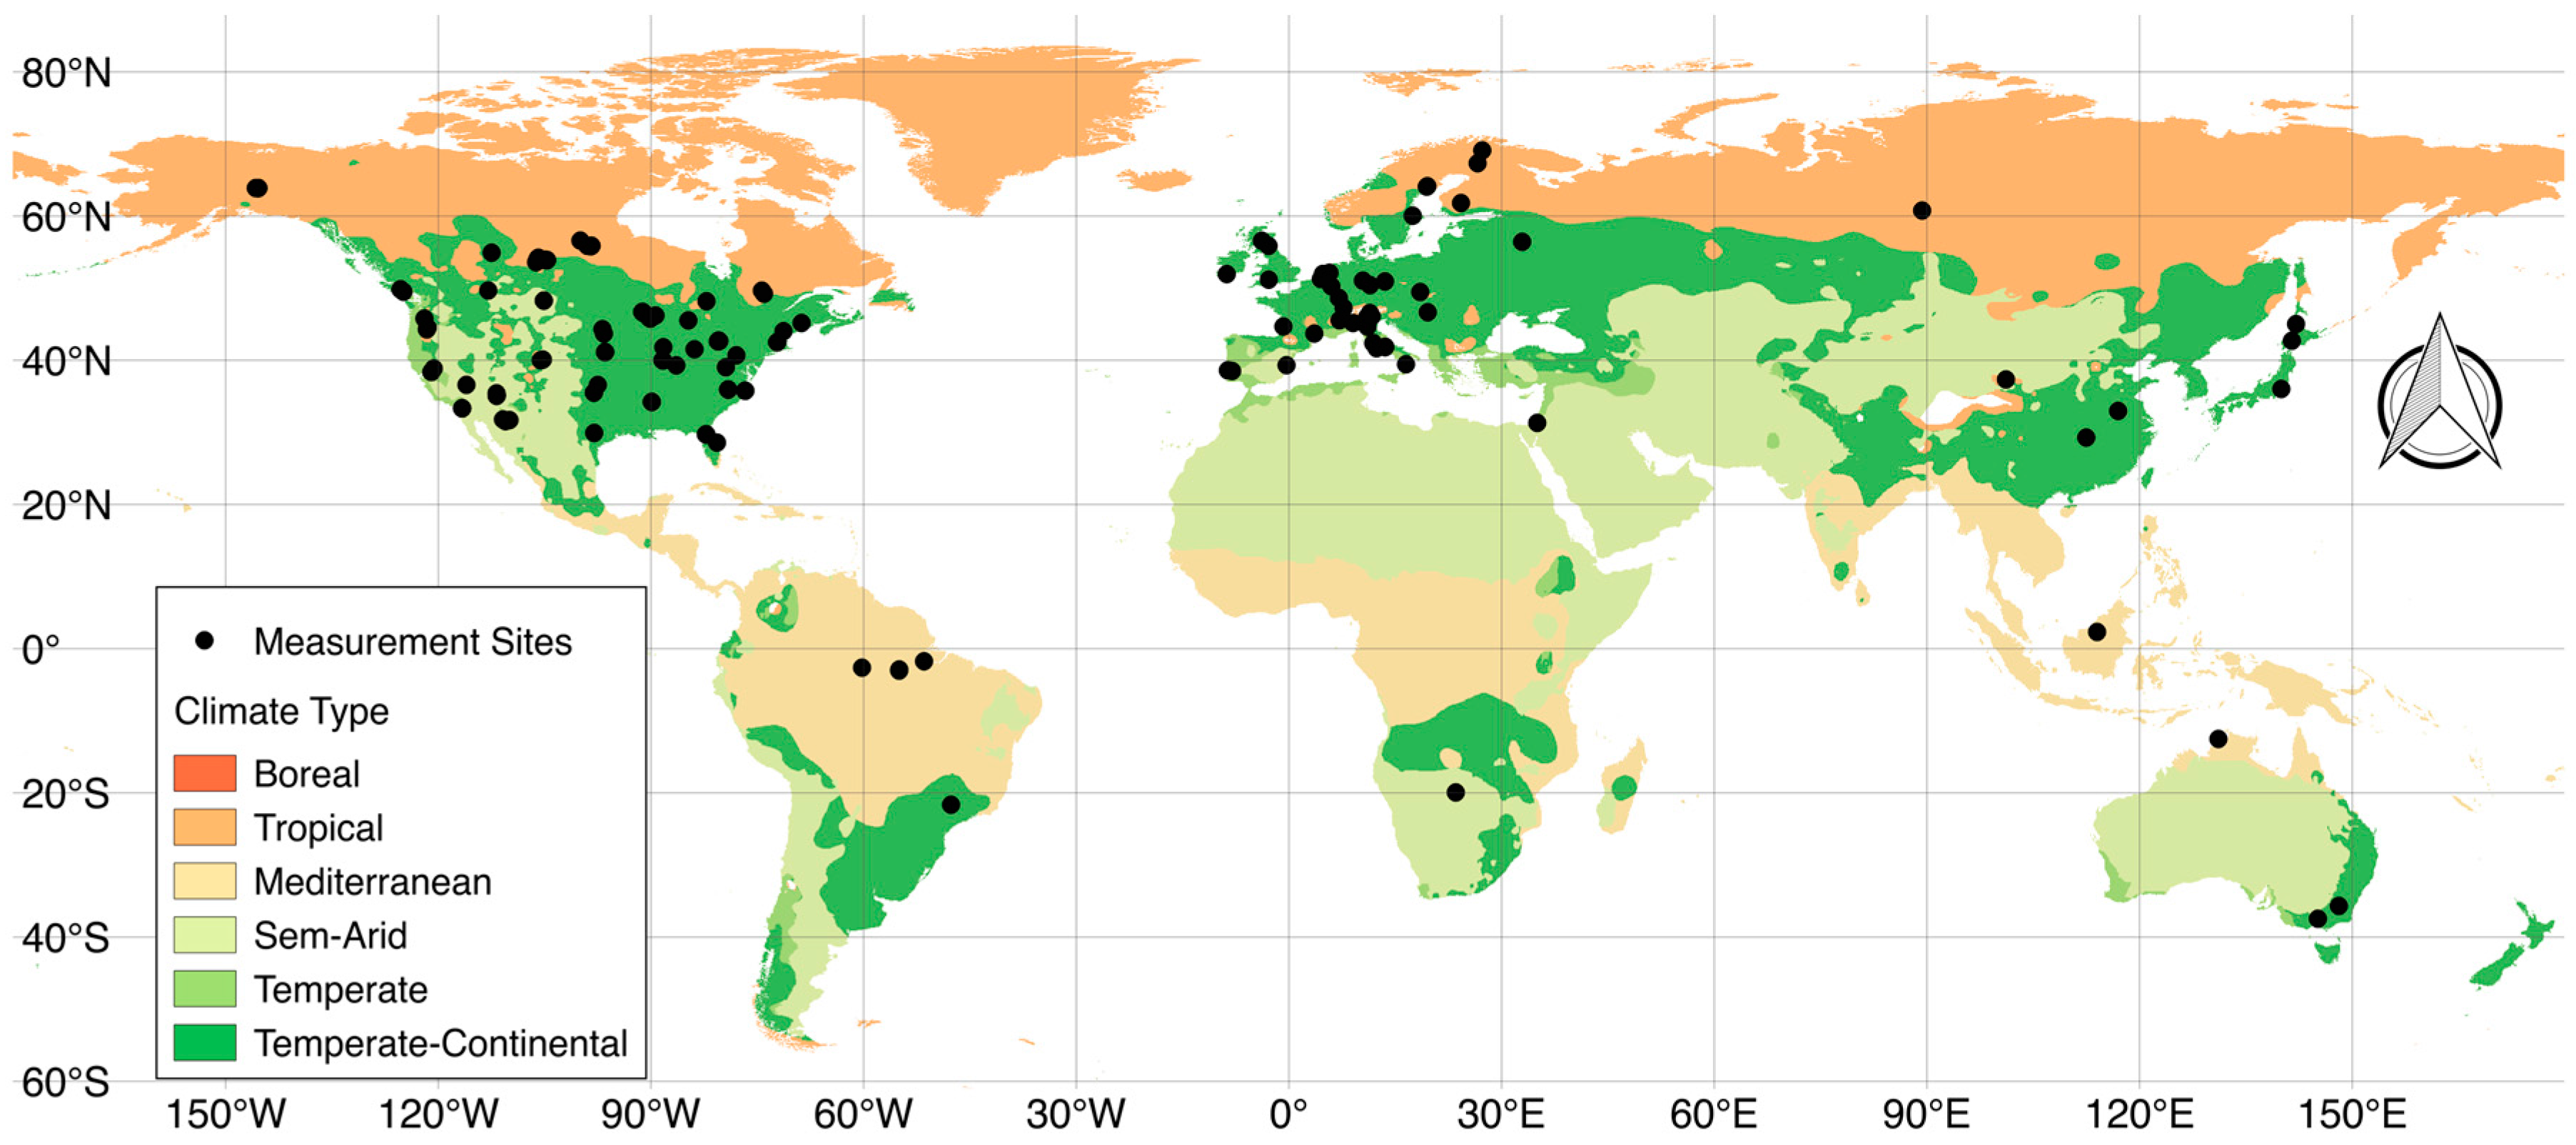
2.4. Net Radiation Measurements from FLUXNET and SURFRAD

We employed net-radiation measurements from the “La Thuile” data of FLUXNET (www.fluxdata.org) and SURFRAD (http://www.esrl.noaa.gov/gmd/grad/surfrad/) to evaluate the accuracy and reliability of MODIS net-radiation. The “La Thuile” data contains 30-min measurements of radiative fluxes from more than 250 sites between the early 1990s and 2007. We used data from 2001 to 2007, which overlaps with the availability of MODIS data. We downloaded daily and 30-min net-radiation, the four components of net-radiation, and associated quality flags. We found sufficiently dense data that overlapped with the availability of MODIS net-radiation for 147 sites for ~250 site years (Figure 1; Supplementary Table S1).
The SURFRAD network consists of seven stations located in different climatic regimes in the US (Supplementary Table S1). These stations record net-radiation, its components, and associated quality flags every three minutes. We downloaded data from 2001 to 2007 for six stations and from 2003 to 2007 for Sioux Falls, South Dakota. To be consistent with the FLUXNET measurements, we aggregated ten 3-min observations to calculate 30-min radiation at the satellite overpass time and aggregated 3-min data to calculate daily net-radiation and its components. We combined 3-min quality flags to arrive at the quality information for the 30-min and daily data.
Because of soil moisture and land surface heterogeneity, albedo and LST can vary within a MODIS pixel and can potentially produce a mismatch between estimated and measured upwelling shortwave and longwave radiation. However, even for heterogeneous patches within a MODIS pixel, the seasonal evolution of albedo and LST is likely to be synchronous and significantly larger than the difference amongst patches. We therefore focused more on data quality and assumed that land surface heterogeneity only has minor effects on the MODIS net-radiation.
The FLUXNET stations record observations in local time and the SURFRAD stations in Universal Time. We converted these to solar time and extracted instantaneous measurements at the MODIS Terra overpass time. The selected sites are located in different climate and land cover regimes, albeit with a bias towards northern latitudes (Figure 1; Supplementary Table S1).

2.5. CERES Net-Radiation

We downloaded gridded net-radiation EBAF-SURFACE data from the CERES (http://ceres.larc.nasa.gov/) website. The CERES is one of the highest priority satellite mission developed by NASA for developing high quality estimates of different components of Earth’s energy budget. The CERES algorithm uses cloud information from MODIS onboard both Terra and Aqua platforms and combines it with information from geostationary satellites to accurately capture the diurnal cycles of clouds. The radiative transfer model outputs are constrained to match observed outgoing top-of-atmosphere radiation [42]. It also utilizes information from the Cloud-Aerosol Lidar and Infrared Pathfinder Satellite Observation (CALIPSO) and CloudSat to improve the estimates of downwelling longwave radiation. We downloaded the CERES monthly estimates at 1° × 1° resolution.

2.6. Statistical Analyses

2.6.1. Evaluation of MODIS Net-Radiation

In the first part, using measured net-radiation as ground-truth, we assessed how well the instantaneous and daytime (sunrise to sunset, computed every eight-day) MODIS net-radiation agreed with measurements in boreal, temperate-continental, temperate, Mediterranean, semi-arid, and tropical climates. It is increasingly advocated that measurement uncertainties [43,44,45] should be factored in model evaluation. Random uncertainty in measured net-radiation at the daily time scale can be more than what is claimed by manufacturers [46]. Since we used net-radiation measurements for validation, we adopted a conservative approach and assumed that the random uncertainty in measured daily net-radiation in field conditions is 10% of the measurements, as claimed by one of the main instrument manufacturers (http://www.campbellsci.com/), and has a Gaussian distribution. Then, following Harmel and Smith [43], we used Equation (9) below to calculate difference between modeled and observed values.
e i = c f i 0.5 ( O i P i )
where ei, cfi, Oi, and Pi are the deviation between observed and predicted net-radiation, correction factor, observed net-radiation, and predicted net-radiation, respectively, for the ith pair. For a predicted value that is more than 3.9 σ away from the observed value, the correction factor is 0.5 and ei = Oi − Pi. On the other hand, when the predicted value is equal to the observed, the correction factor is zero. For other situations, when predicted value lies between observed value and ±3.9 σ, the correction factor is cfi = p (|Oi| < Z < |Pi|) and is calculated as the area under the normal curve bounded by Oi and Pi with Oi as the mean of the distribution (see Figure 2 in Harmel and Smith [38]).
Using Equation (9), we first calculated weighted Willmott’s index of agreement (IoAs) [47], mean absolute error (MAEs), and mean bias (Biass) between daily modeled and tower net-radiation for each site-year (labeled “s”) (Equation (10)–(12)). We weighted each net-radiation measurement with its quality-flag “wi”.
I o A s = 1 i = 1 n w i ( c f i 0.5 | O i P i | ) i = 1 n w i ( | P i O ¯ | + | O i O ¯ | )
M A E s = i = 1 n w i ( c f i 0.5 | O i P i | ) i = 1 n w i
B i a s s = i = 1 n w i ( c f i 0.5 ( O i P i ) ) i = 1 n w i
Here, “n” is the number of observations (usually 46 for eight-day estimates) in a site-year. Next, taking IoAs, MAEs, and Biass as variables distributed over space, we calculated climate specific across-site mean and standard errors for each of the three metrics. IoA can be sensitive to large errors. Therefore, we used absolute deviation instead of squared deviation. Both IoA and Nash–Sutcliffe coefficient have been widely used to compare model prediction with observations. We preferred IoA because it is bounded from both above and below (varies between zero and one) and is thus easier to interpret and compare across different categories. Generally, a value of IoA above 0.6 is considered above average, more than 0.7 shows good agreement, and above 0.8 and 0.9 reflect very strong agreement.

2.6.2. Comparison with Net-Radiation from CERES
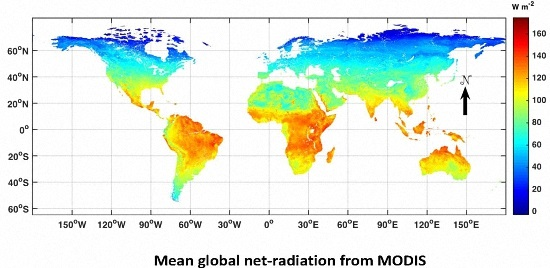
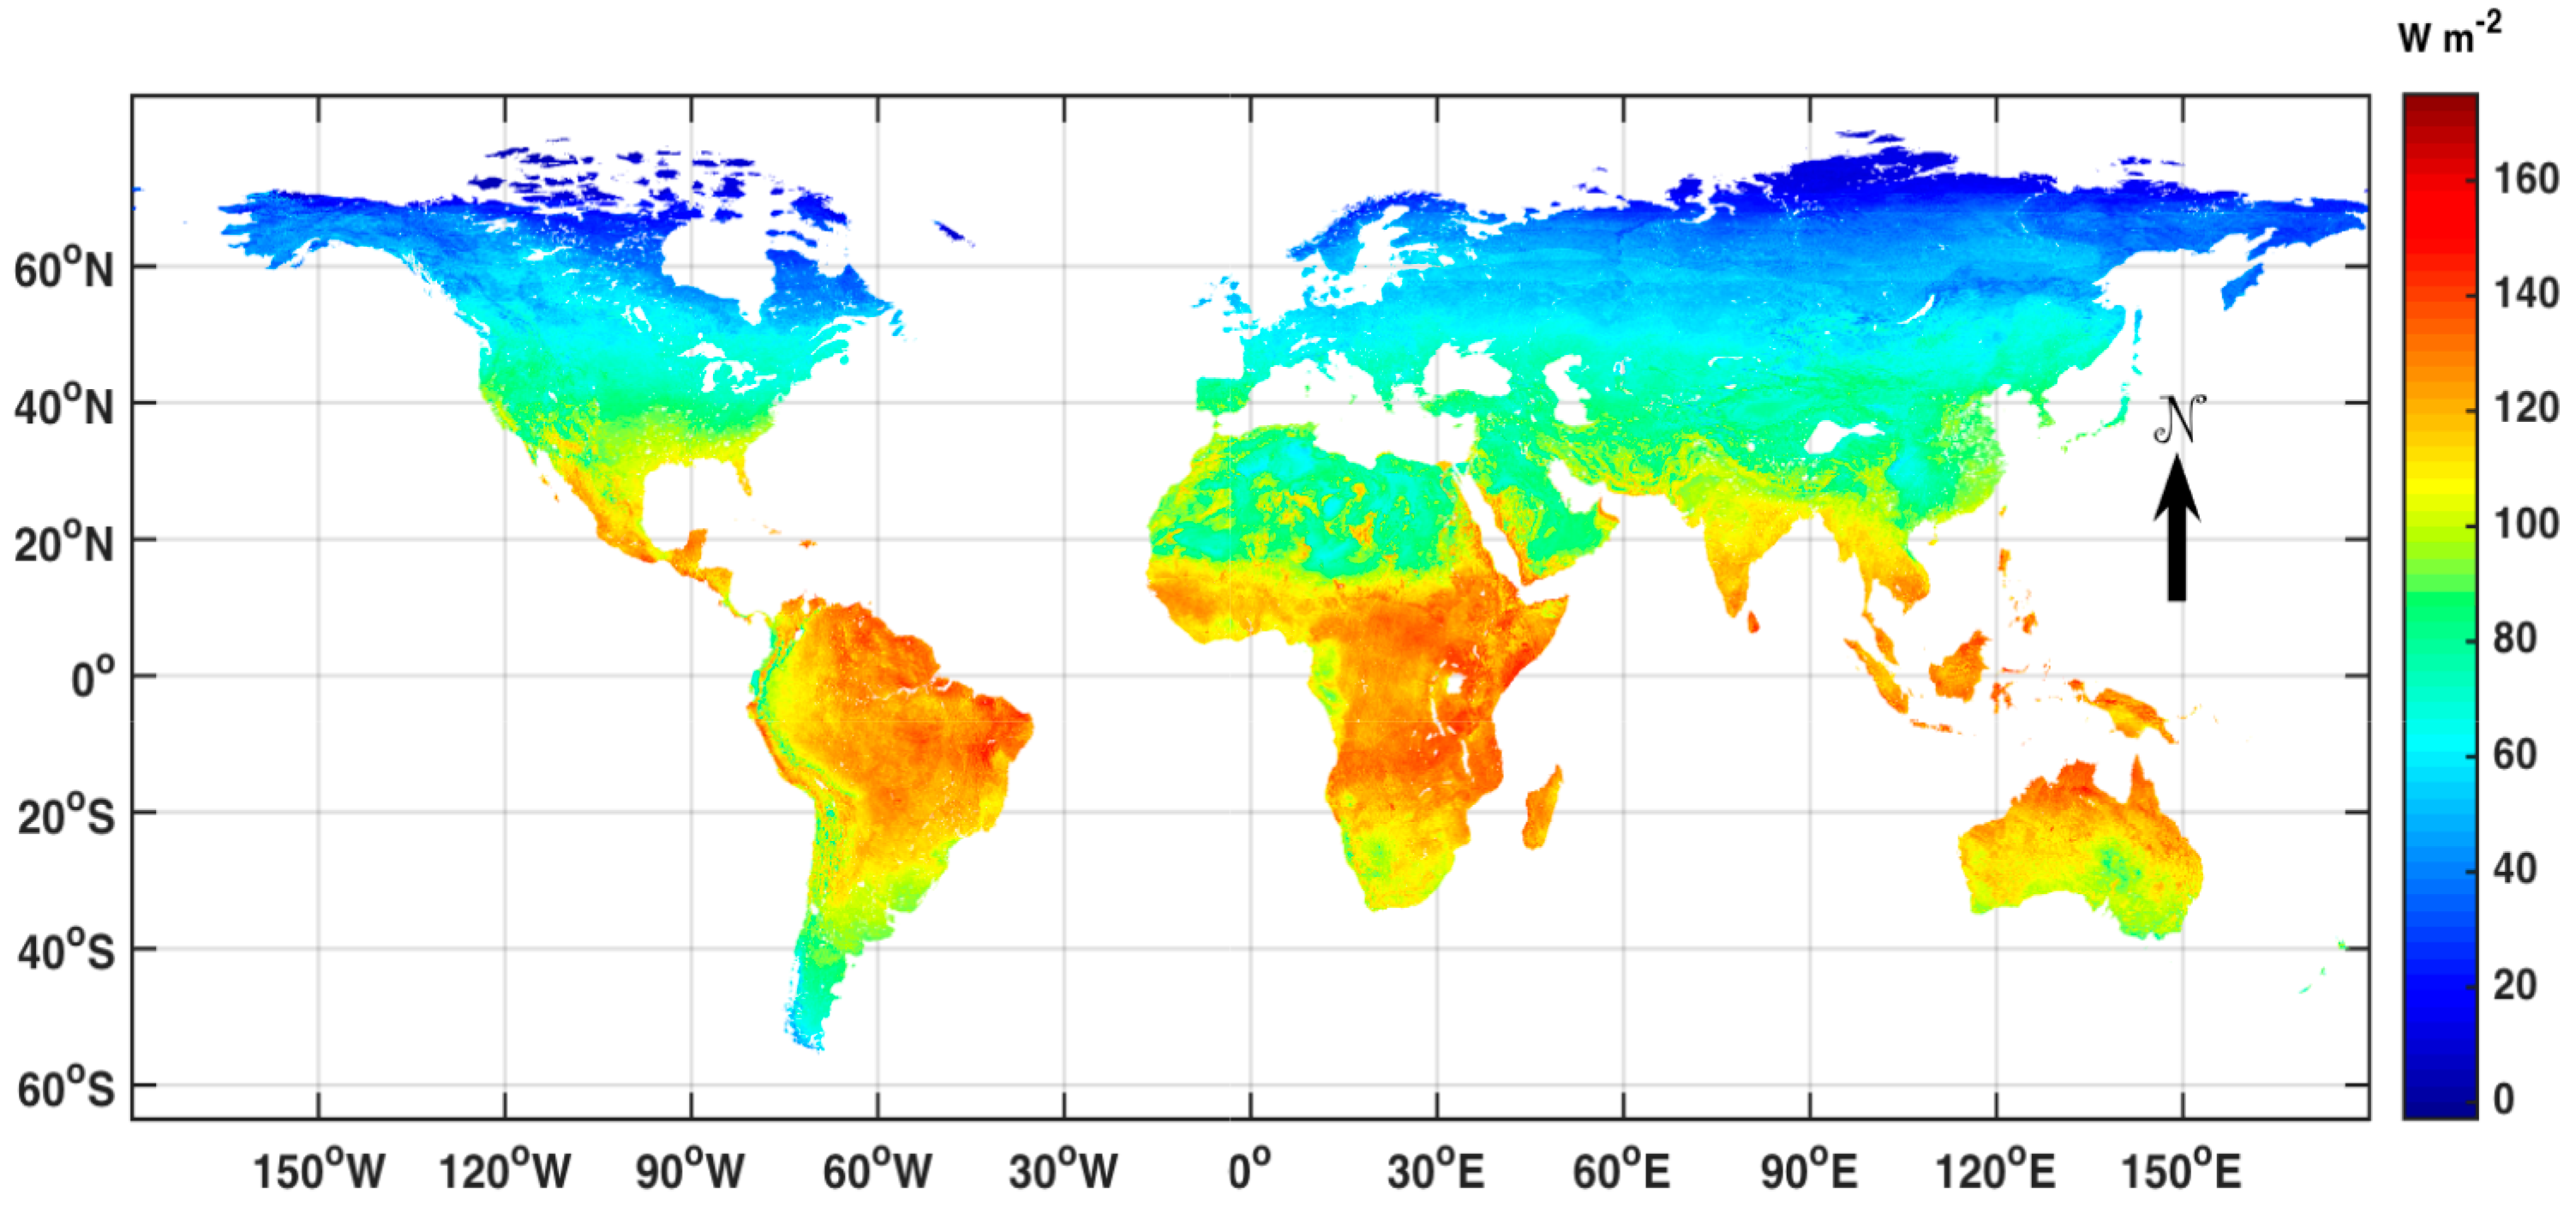
We first compared monthly CERES net-radiation with tower data. To ensure a reasonable spatial sampling within 1° × 1° cells of the CERES product, we only selected cells that had 3 or more tower sites within their boundary. There were a total 53 CERES pixels with 3 or more (maximum 7) tower sites. The tower sites were located between 30° and 64° N latitude and 145° W and 122° E longitude.
After validating CERES product, we compared mean daily (24-h) net-radiation from MODIS with the corresponding estimates from CERES. To do this, we converted daily daytime (sunrise to sunset) MODIS net-radiation to daily (24-h) net-radiation. Simple parameterizations have been suggested to compute nighttime upwelling and downwelling long wave radiation [48]. We instead used tower data to calibrate a simple globally constant relationship between mean daily (24-h) and daytime (sunrise to sunset) net-radiation and used this empirical relationship to convert mean daytime net-radiation from MODIS to daily values.
Before comparing MODIS net-radiation we used results from the analysis in Section 2.6.1, and adjusted the MODIS net-radiation for the bias and marked the error bounds in bias-corrected MODIS net-radiation based on the climate type of a pixel. We then estimated the mean random error (MEc) in each climate type “c” as follows.
M E c = 1.5 × M A E c B i a s c 2
where MAEc and Biasc are the mean absolute error and the absolute value of mean bias, respectively, in climate type “c” from the analysis in Section 2.6.1. Thus, we assumed that the bias in daily net-radiation is the same as in daytime net-radiation, but the random error in daily net-radiation is higher (1.5 times) than in daytime net-radiation. We also assumed that as we aggregate the daily MODIS data to coarser temporal resolution (monthly) the random error goes down to half.
We re-sampled MODIS net-radiation to match the resolution of CERES net-radiation. We assumed that the random errors “MEc” in MODIS net-radiation are uniformly distributed and calculated net-radiation and error bounds of resampled MODIS pixels as follows.
n r r s = 1 n i = 1 n n r i
u b _ n r r s = 1 n i = 1 n n r i + m e i
l b _ n r r s = 1 n i = 1 n n r i m e i
Here, nrrs, ub_nrrs, and lb_nrrs are estimated net-radiation, and upper- and lower-bound on net-radiation, respectively, of the coarse resolution resampled pixel. The other three variables nri, mei, and n are the net-radiation and mean error of the ith fine resolution pixel, and the total number of fine resolution pixels contained in the coarse resolution resampled pixel, respectively. We assigned mei to each fine resolution pixel based on its climate type. We obtained the information of climate type at 0.1° from Peel et al. [49].
After estimating the net-radiation and error bounds in re-sampled pixels, we compared mean MODIS net-radiation with corresponding estimates from the CERES net-radiation product. We calculated paired deviations “ei” between the MODIS (taken as reference data in this part) and the CERES net-radiation as follows [43].
e i = 0   i f   l b _ n r r s P i u b _ n r r s
e i = l b _ n r r s P i   i f   P i l b _ n r r s
e i = P i u b _ n r r s   i f   P i u b _ n r r s
Here, Pi is the predicted net-radiation from the coarse resolution gridded net radiation products.

3. Results

This section is divided into two subsections. First, we present the evaluation of the fine resolution MODIS estimates with measured net-radiation at the site level. Next, we share results about spatiotemporal agreements between the MODIS and CERES net-radiation.

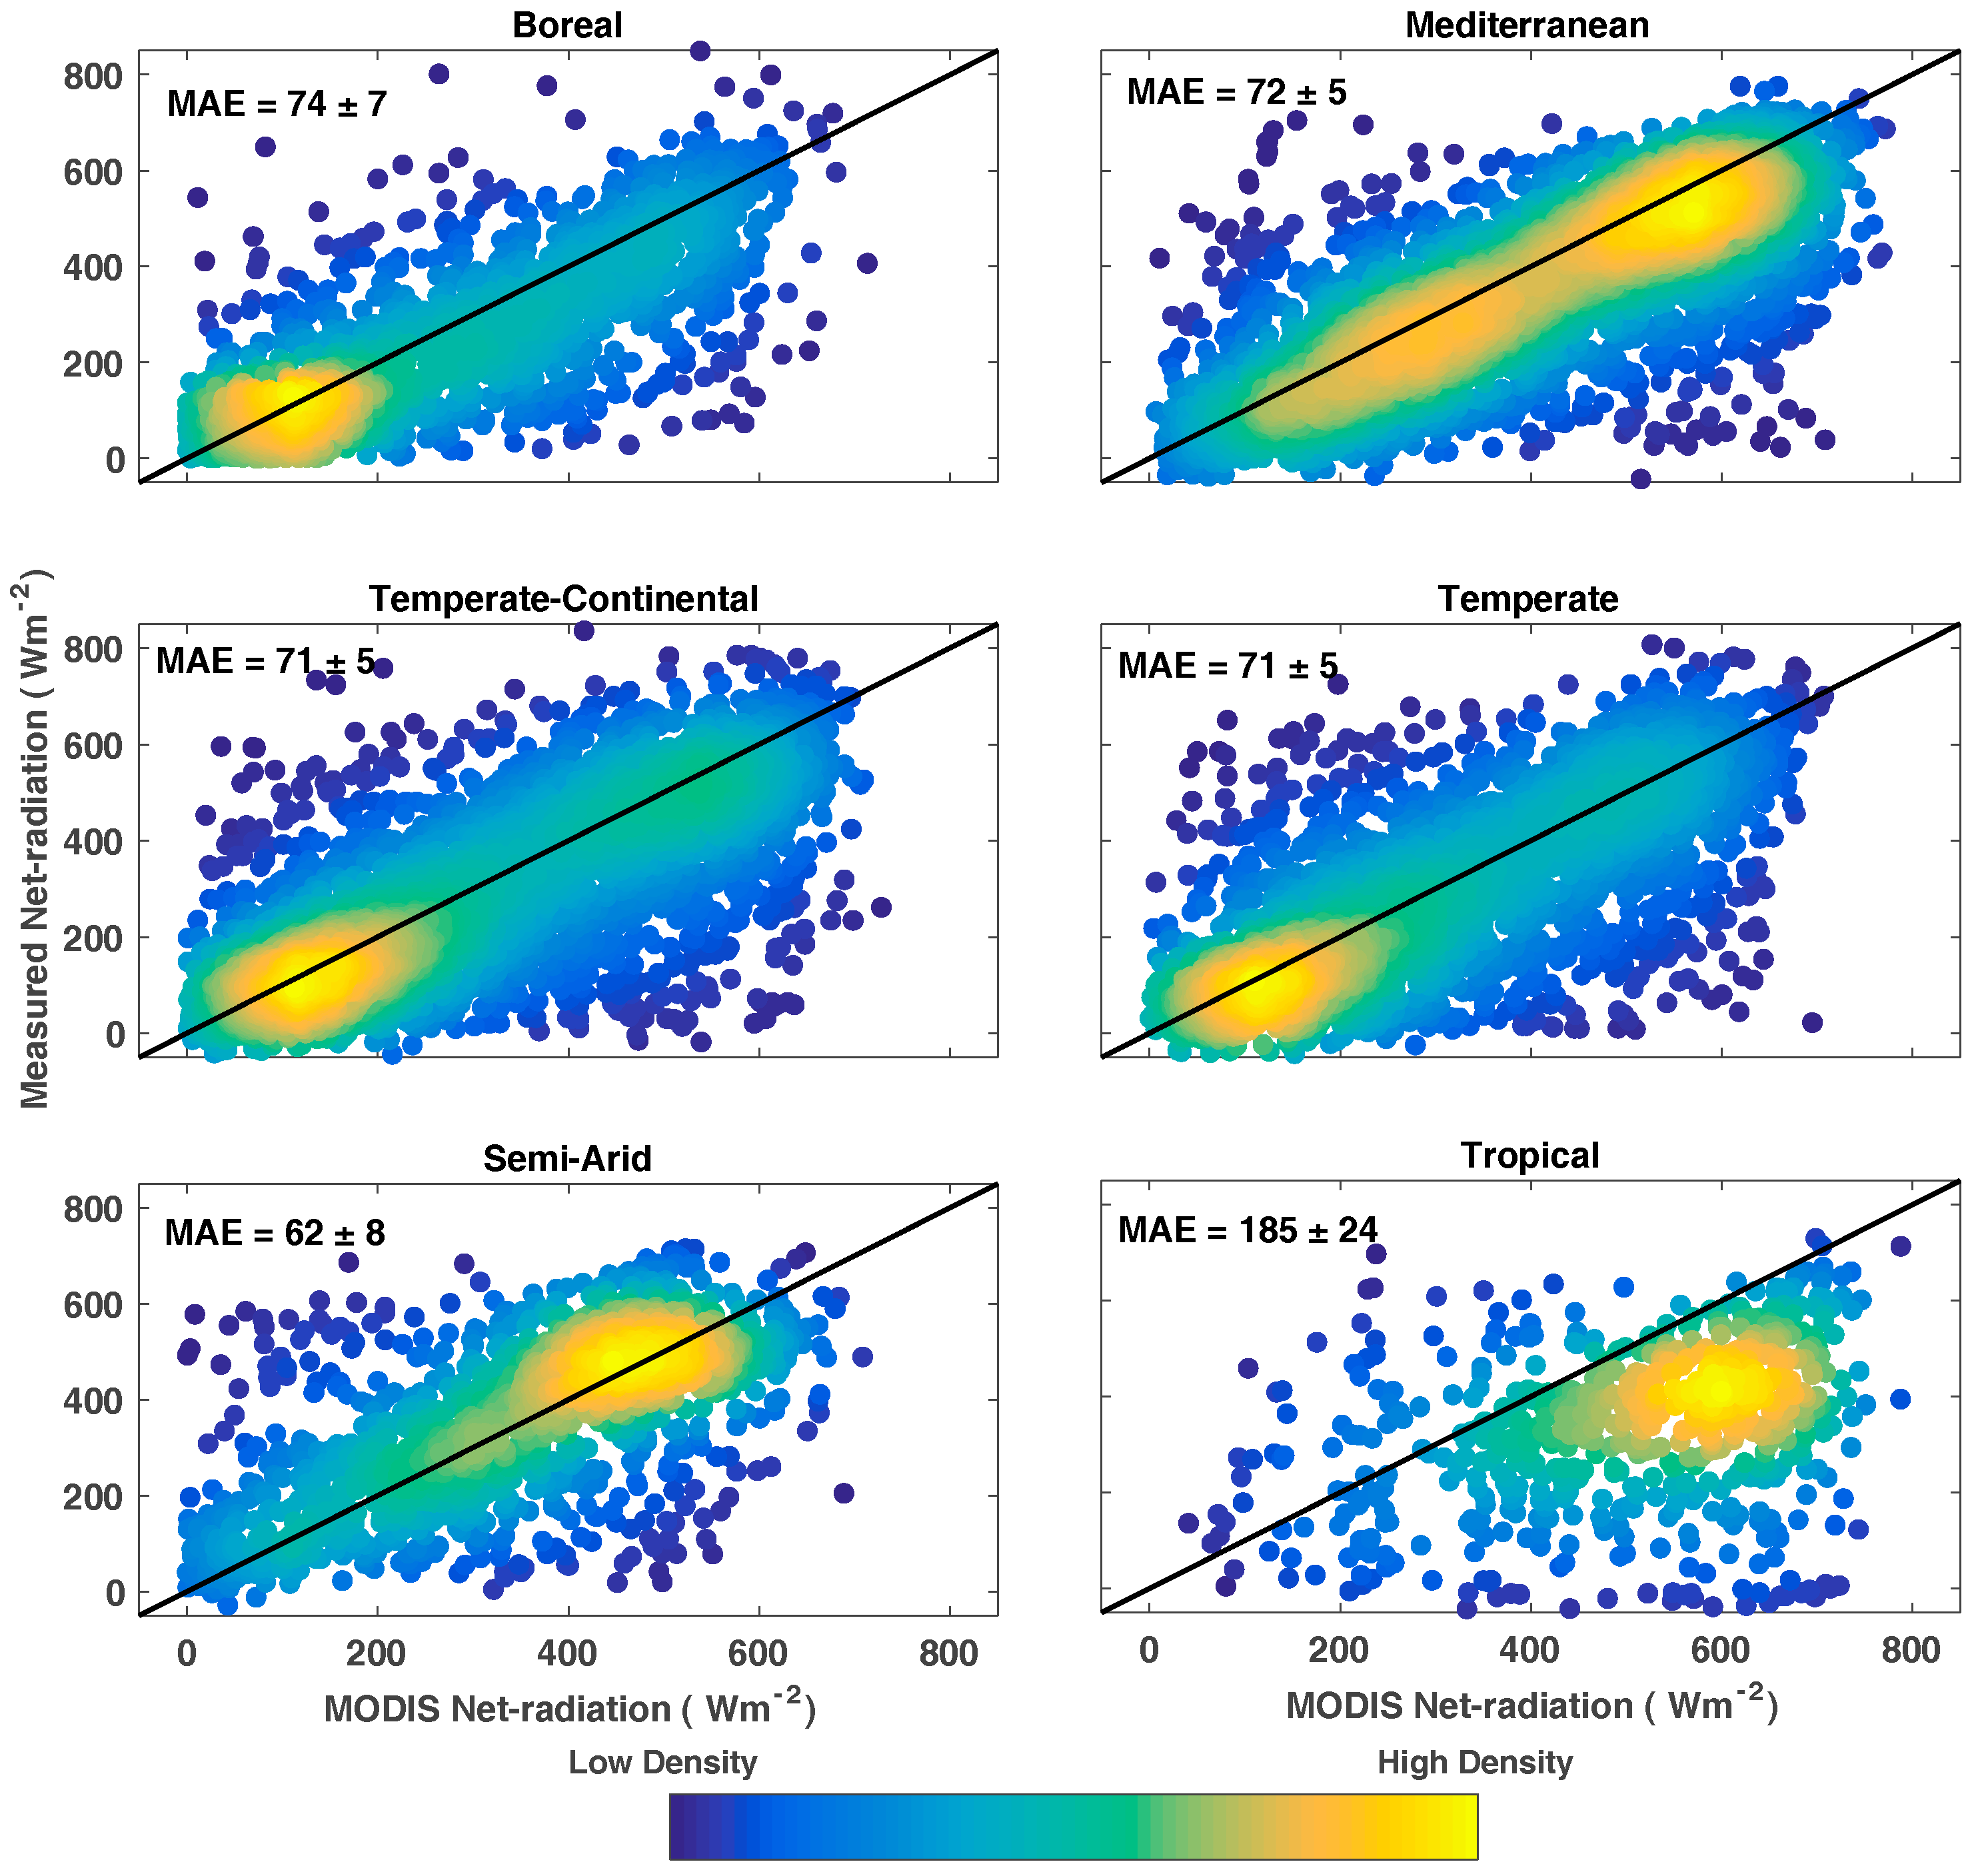
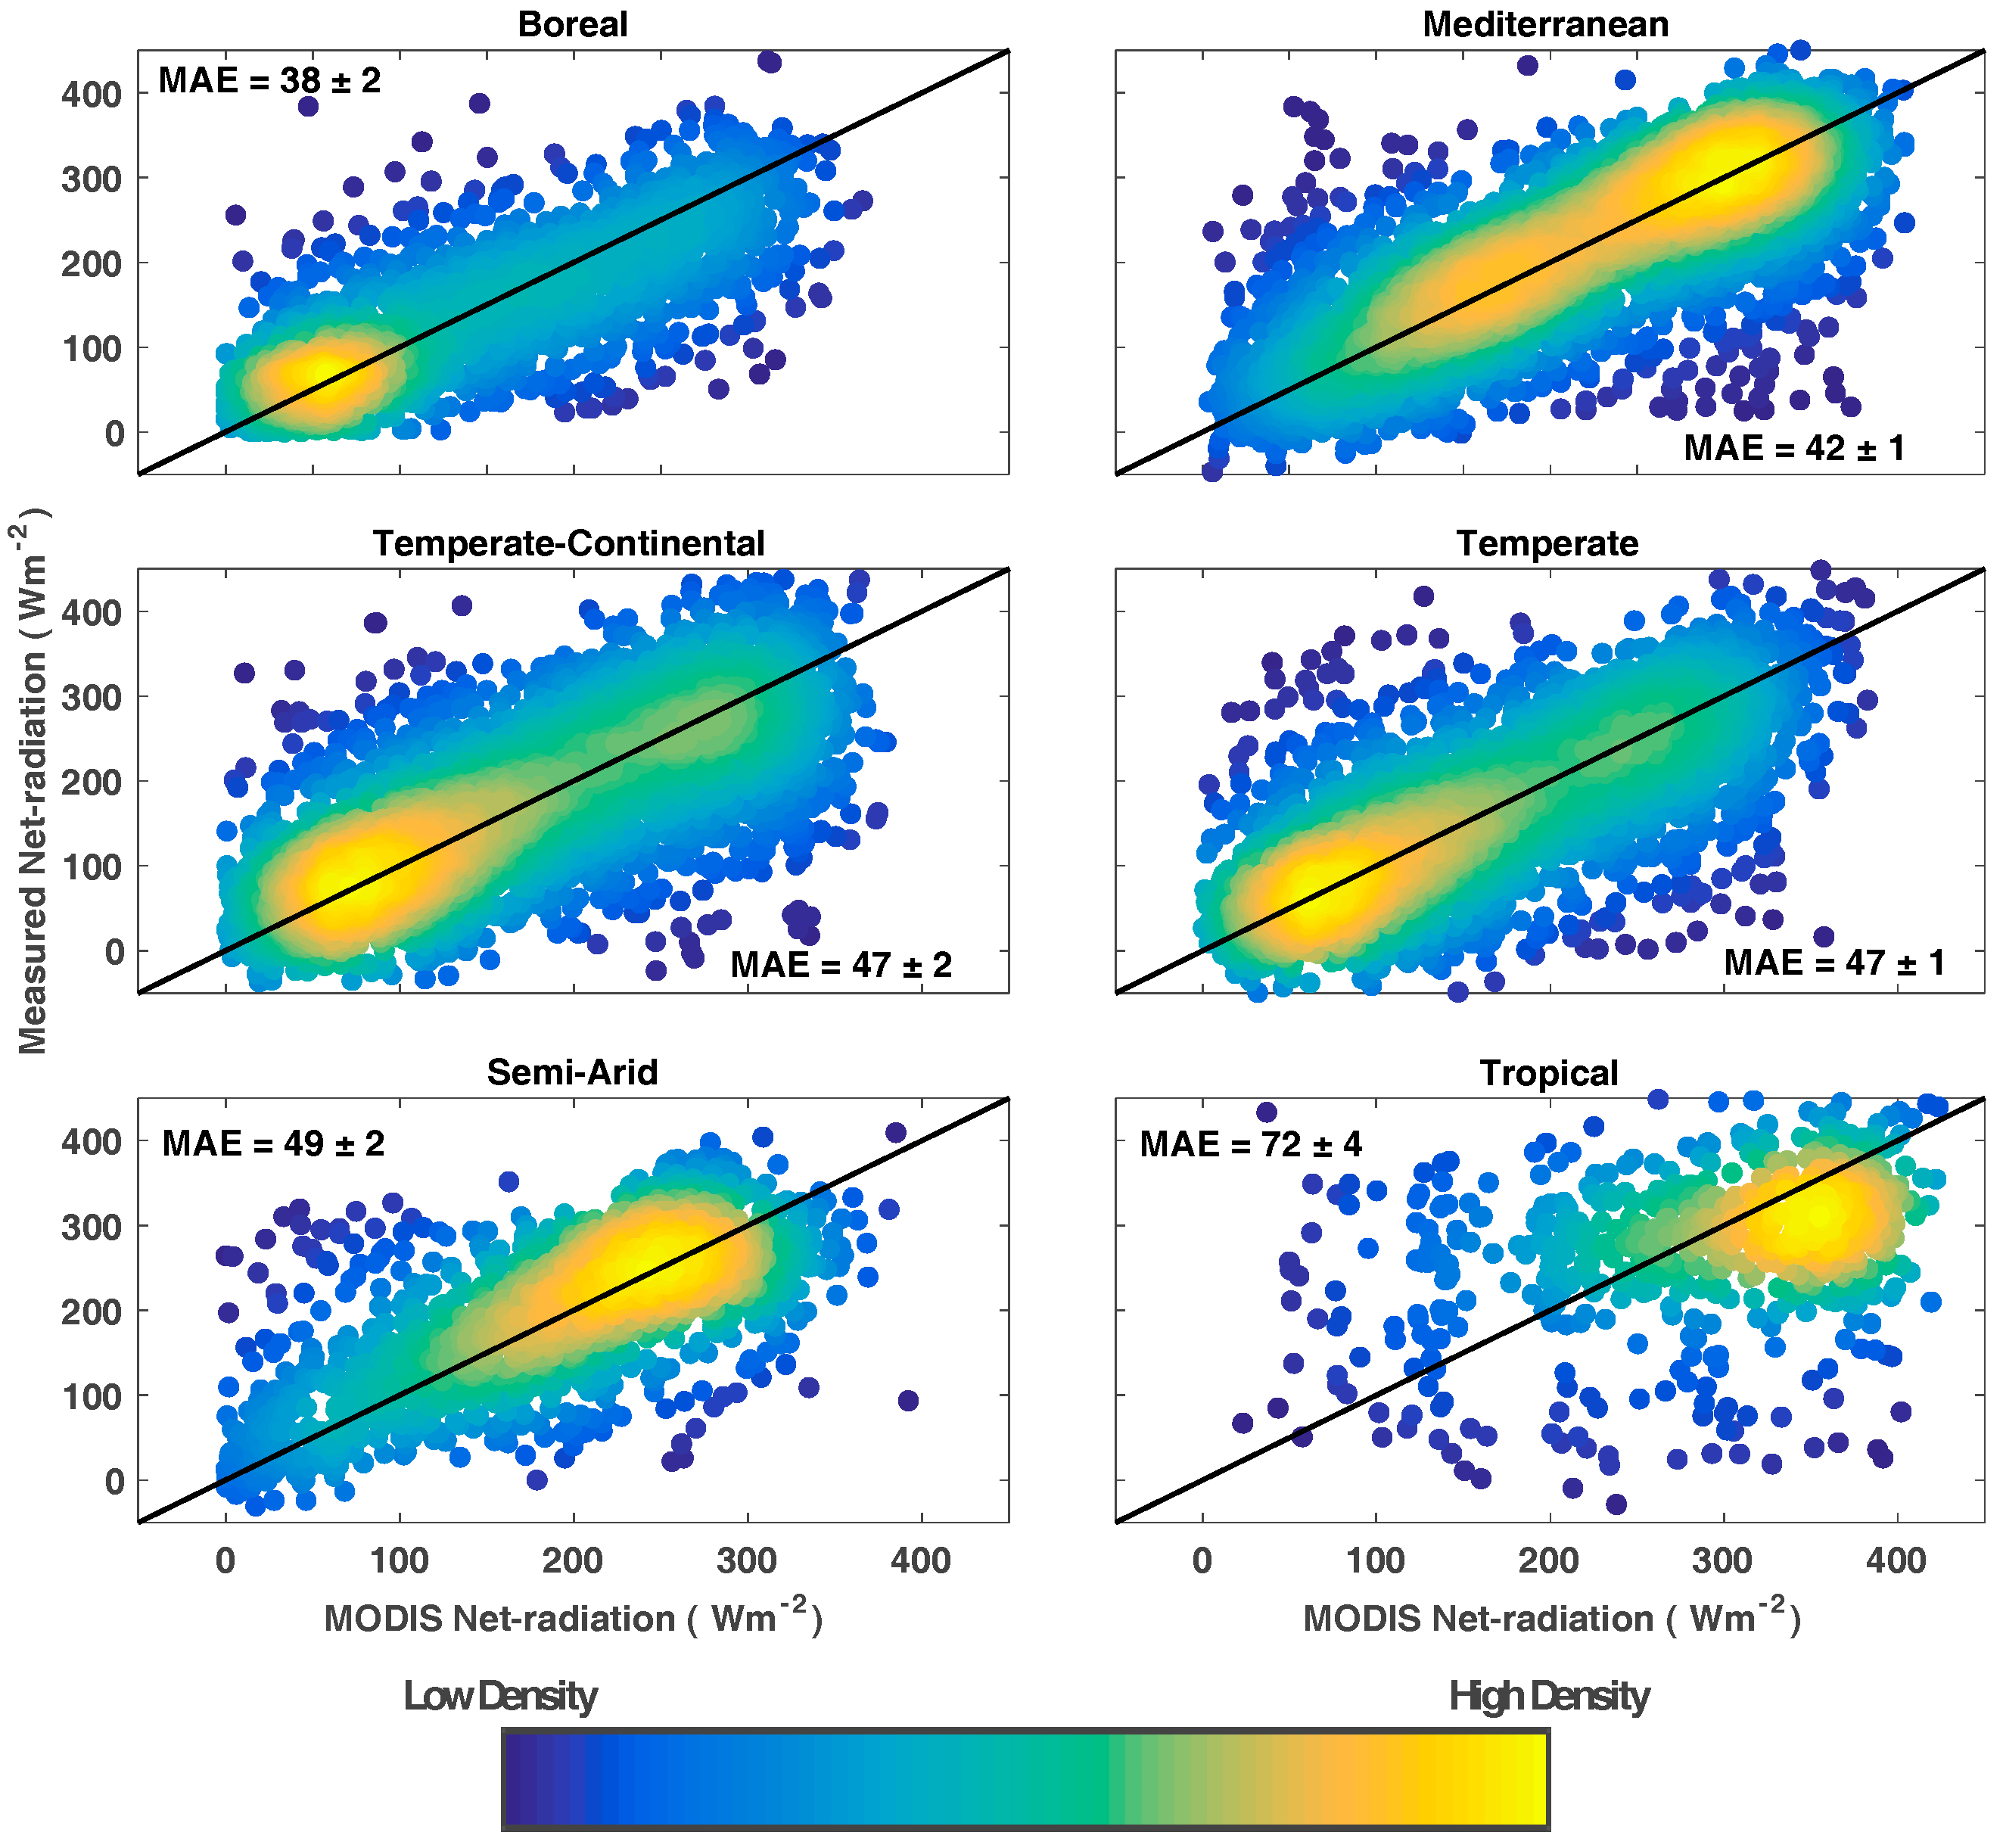
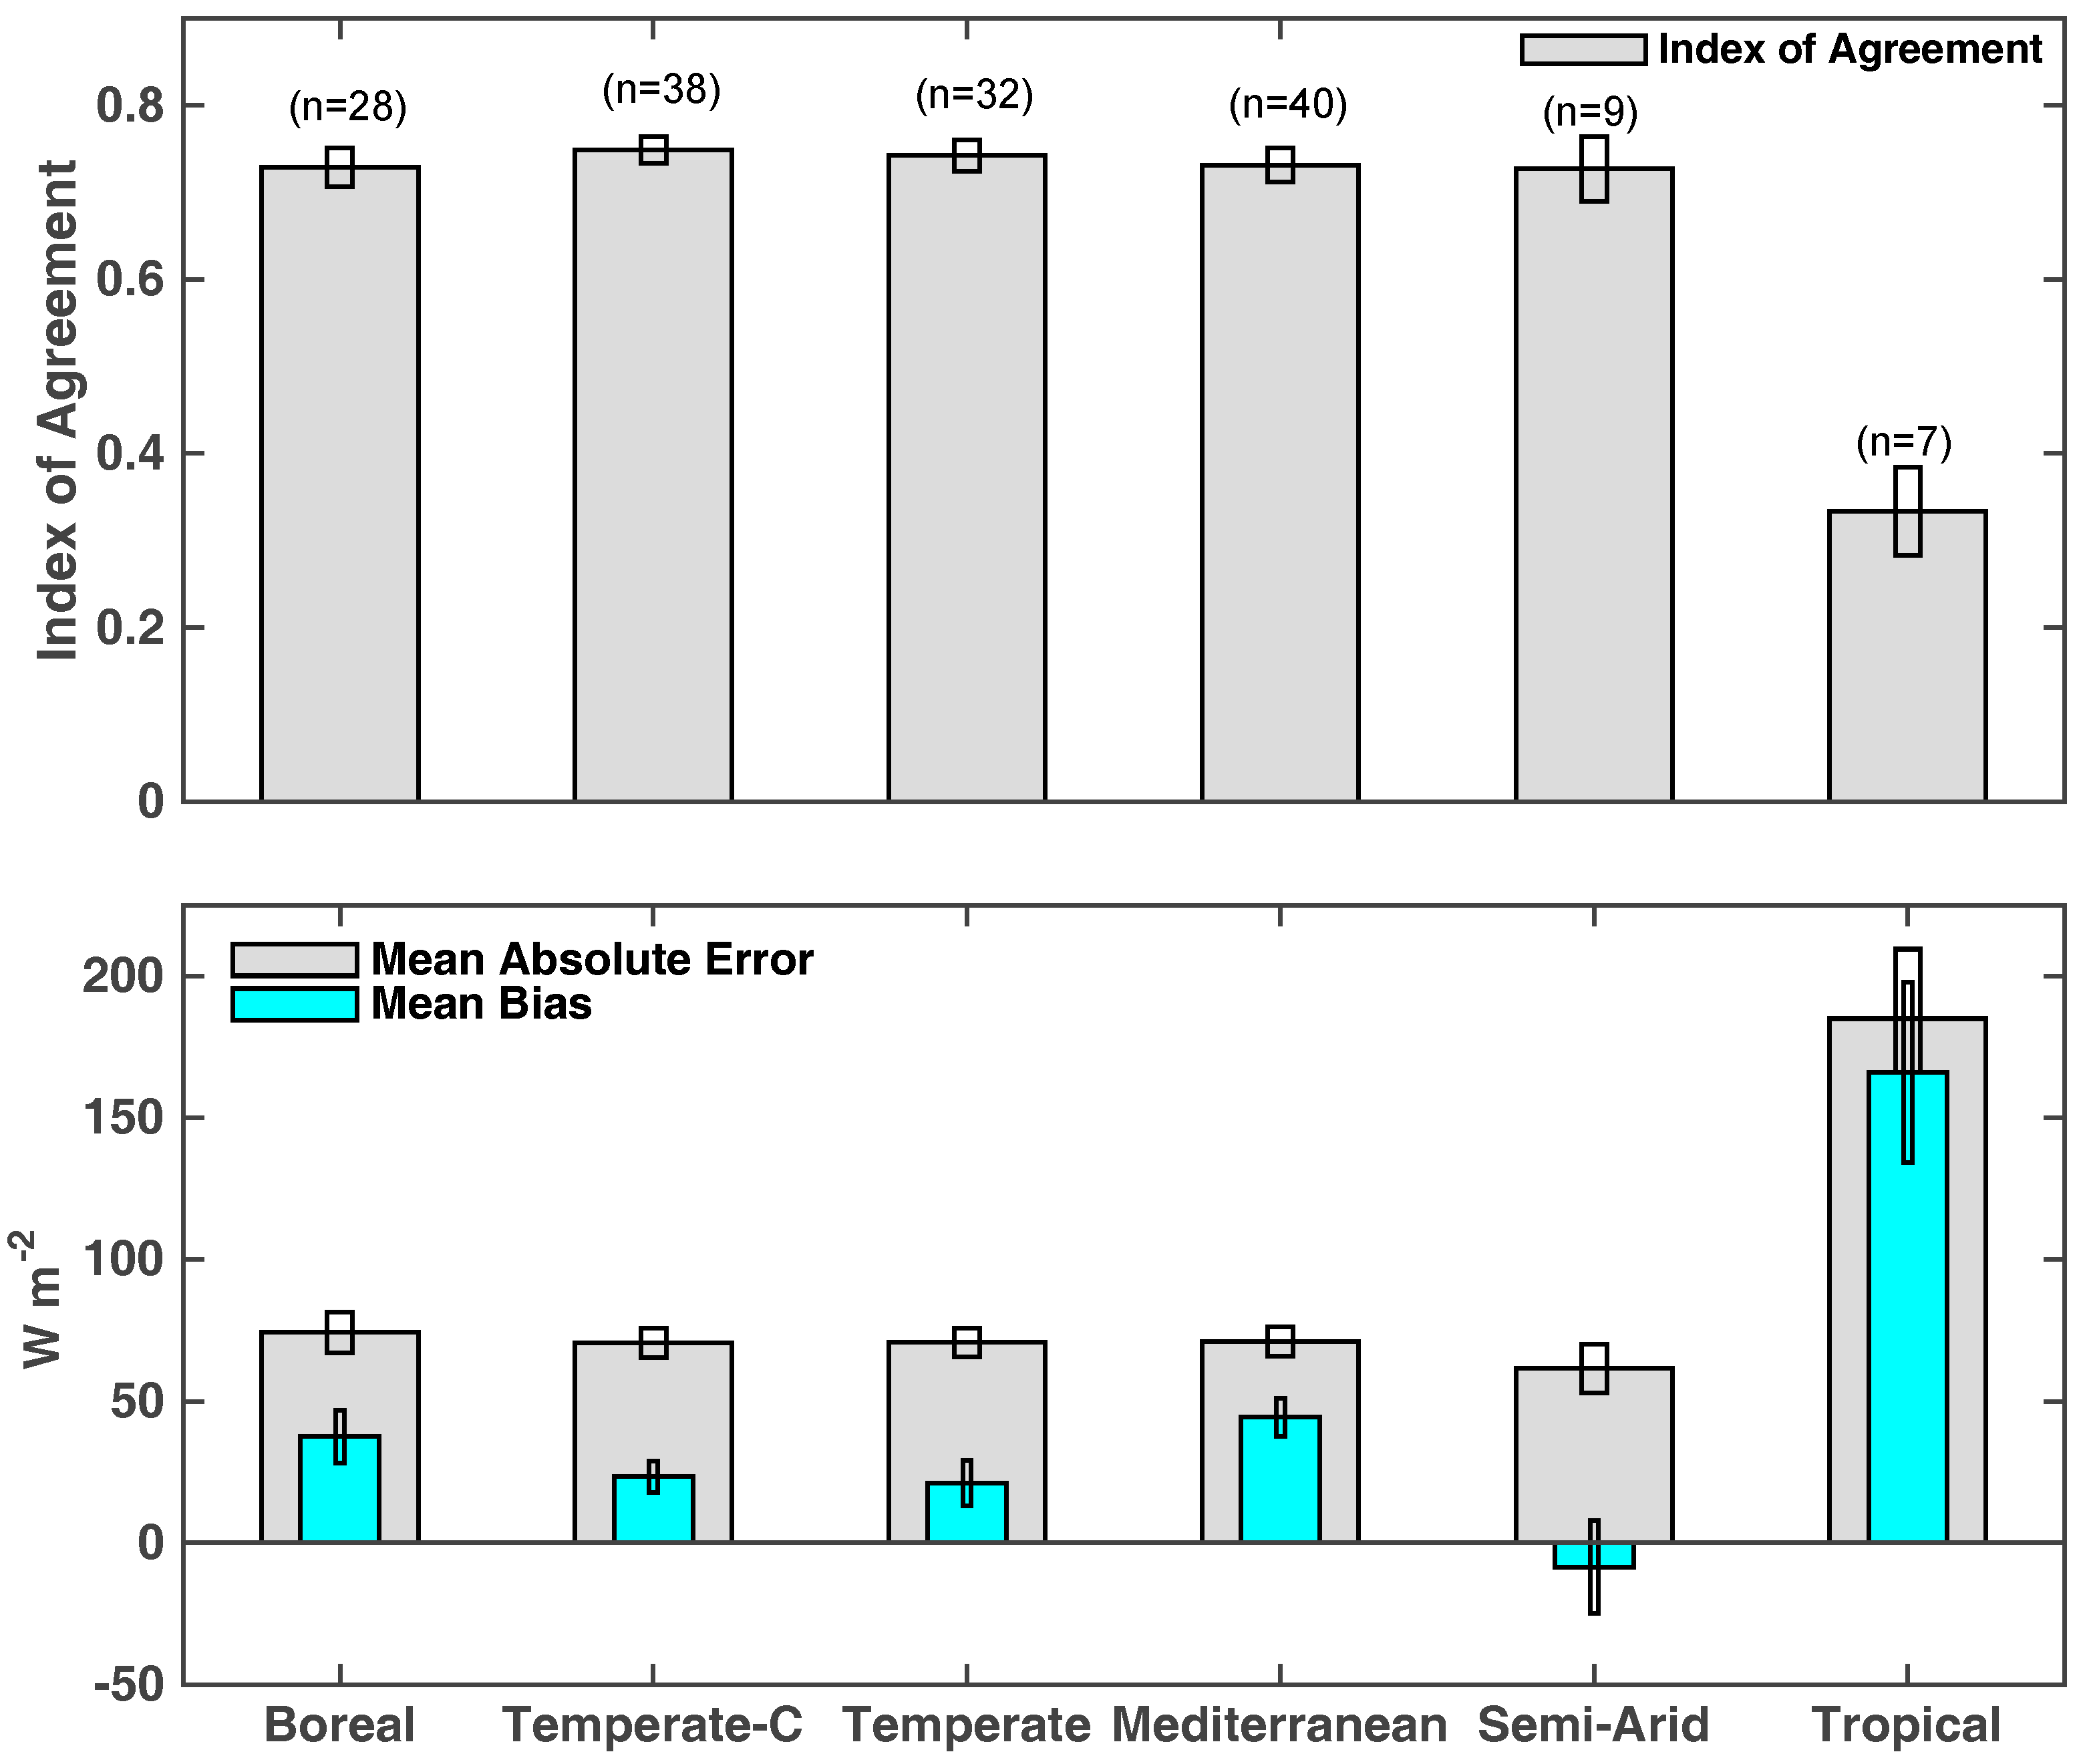
3.1. Agreement between Instantaneous MODIS and Measured Net-Radiation at Satellite Overpass Time

Instantaneous MODIS net-radiation showed good agreement with measured net-radiation in extra tropics (Figure 2 and Figure 3). In five out of six climate types (boreal, temperate-Continental, temperate, semi-arid, and Mediterranean), the IoA between the MODIS and measured net-radiation was close to 0.73 and MAE was approximately 70 W·m−2 (Figure 2). In tropics, however, discrepancy between the modeled and measured net-radiation was relatively more with a low IoA (≈0.35) and high mean error (≈180 W·m−2). The instantaneous MODIS net-radiation was positively biased in all but semi-arid zone where it had a small negative bias (Figure 2 and Figure 3). The positive bias was highest (≈165 W·m−2) in the tropics and was 90% of the MAE (Figure 3). In all six climate types, mean peak instantaneous net-radiation varied between 600 and 700 W·m−2.

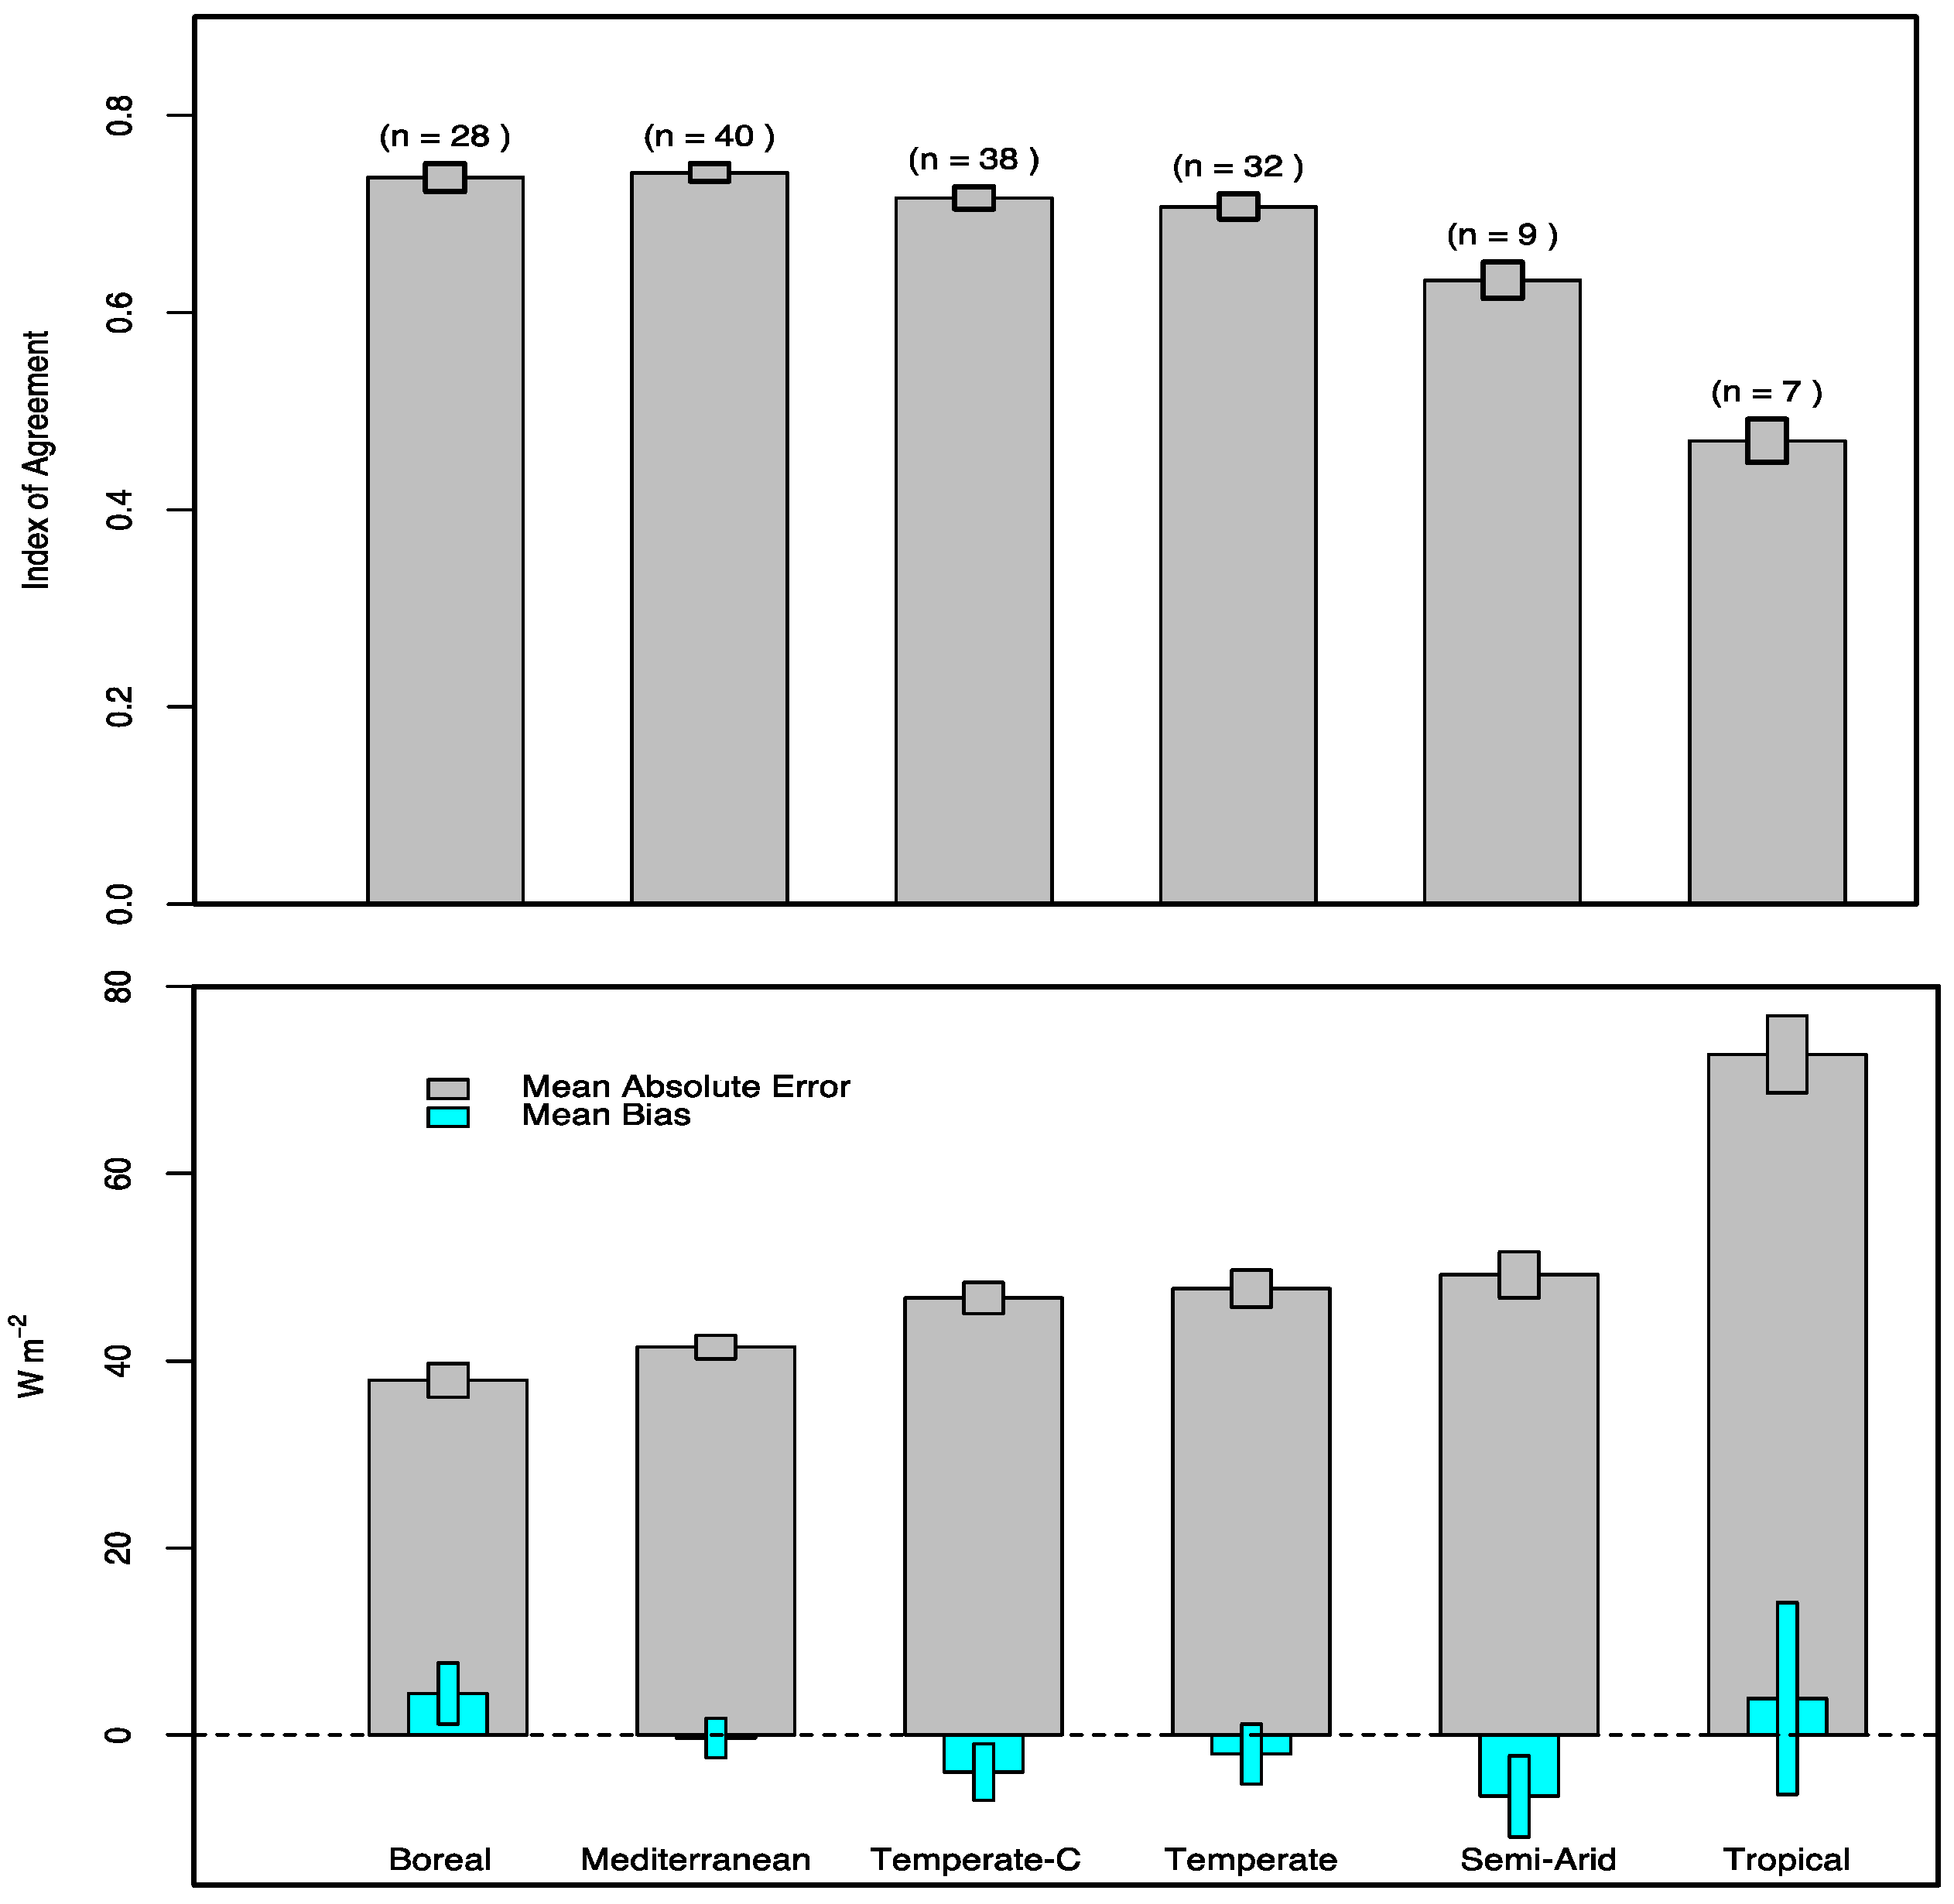
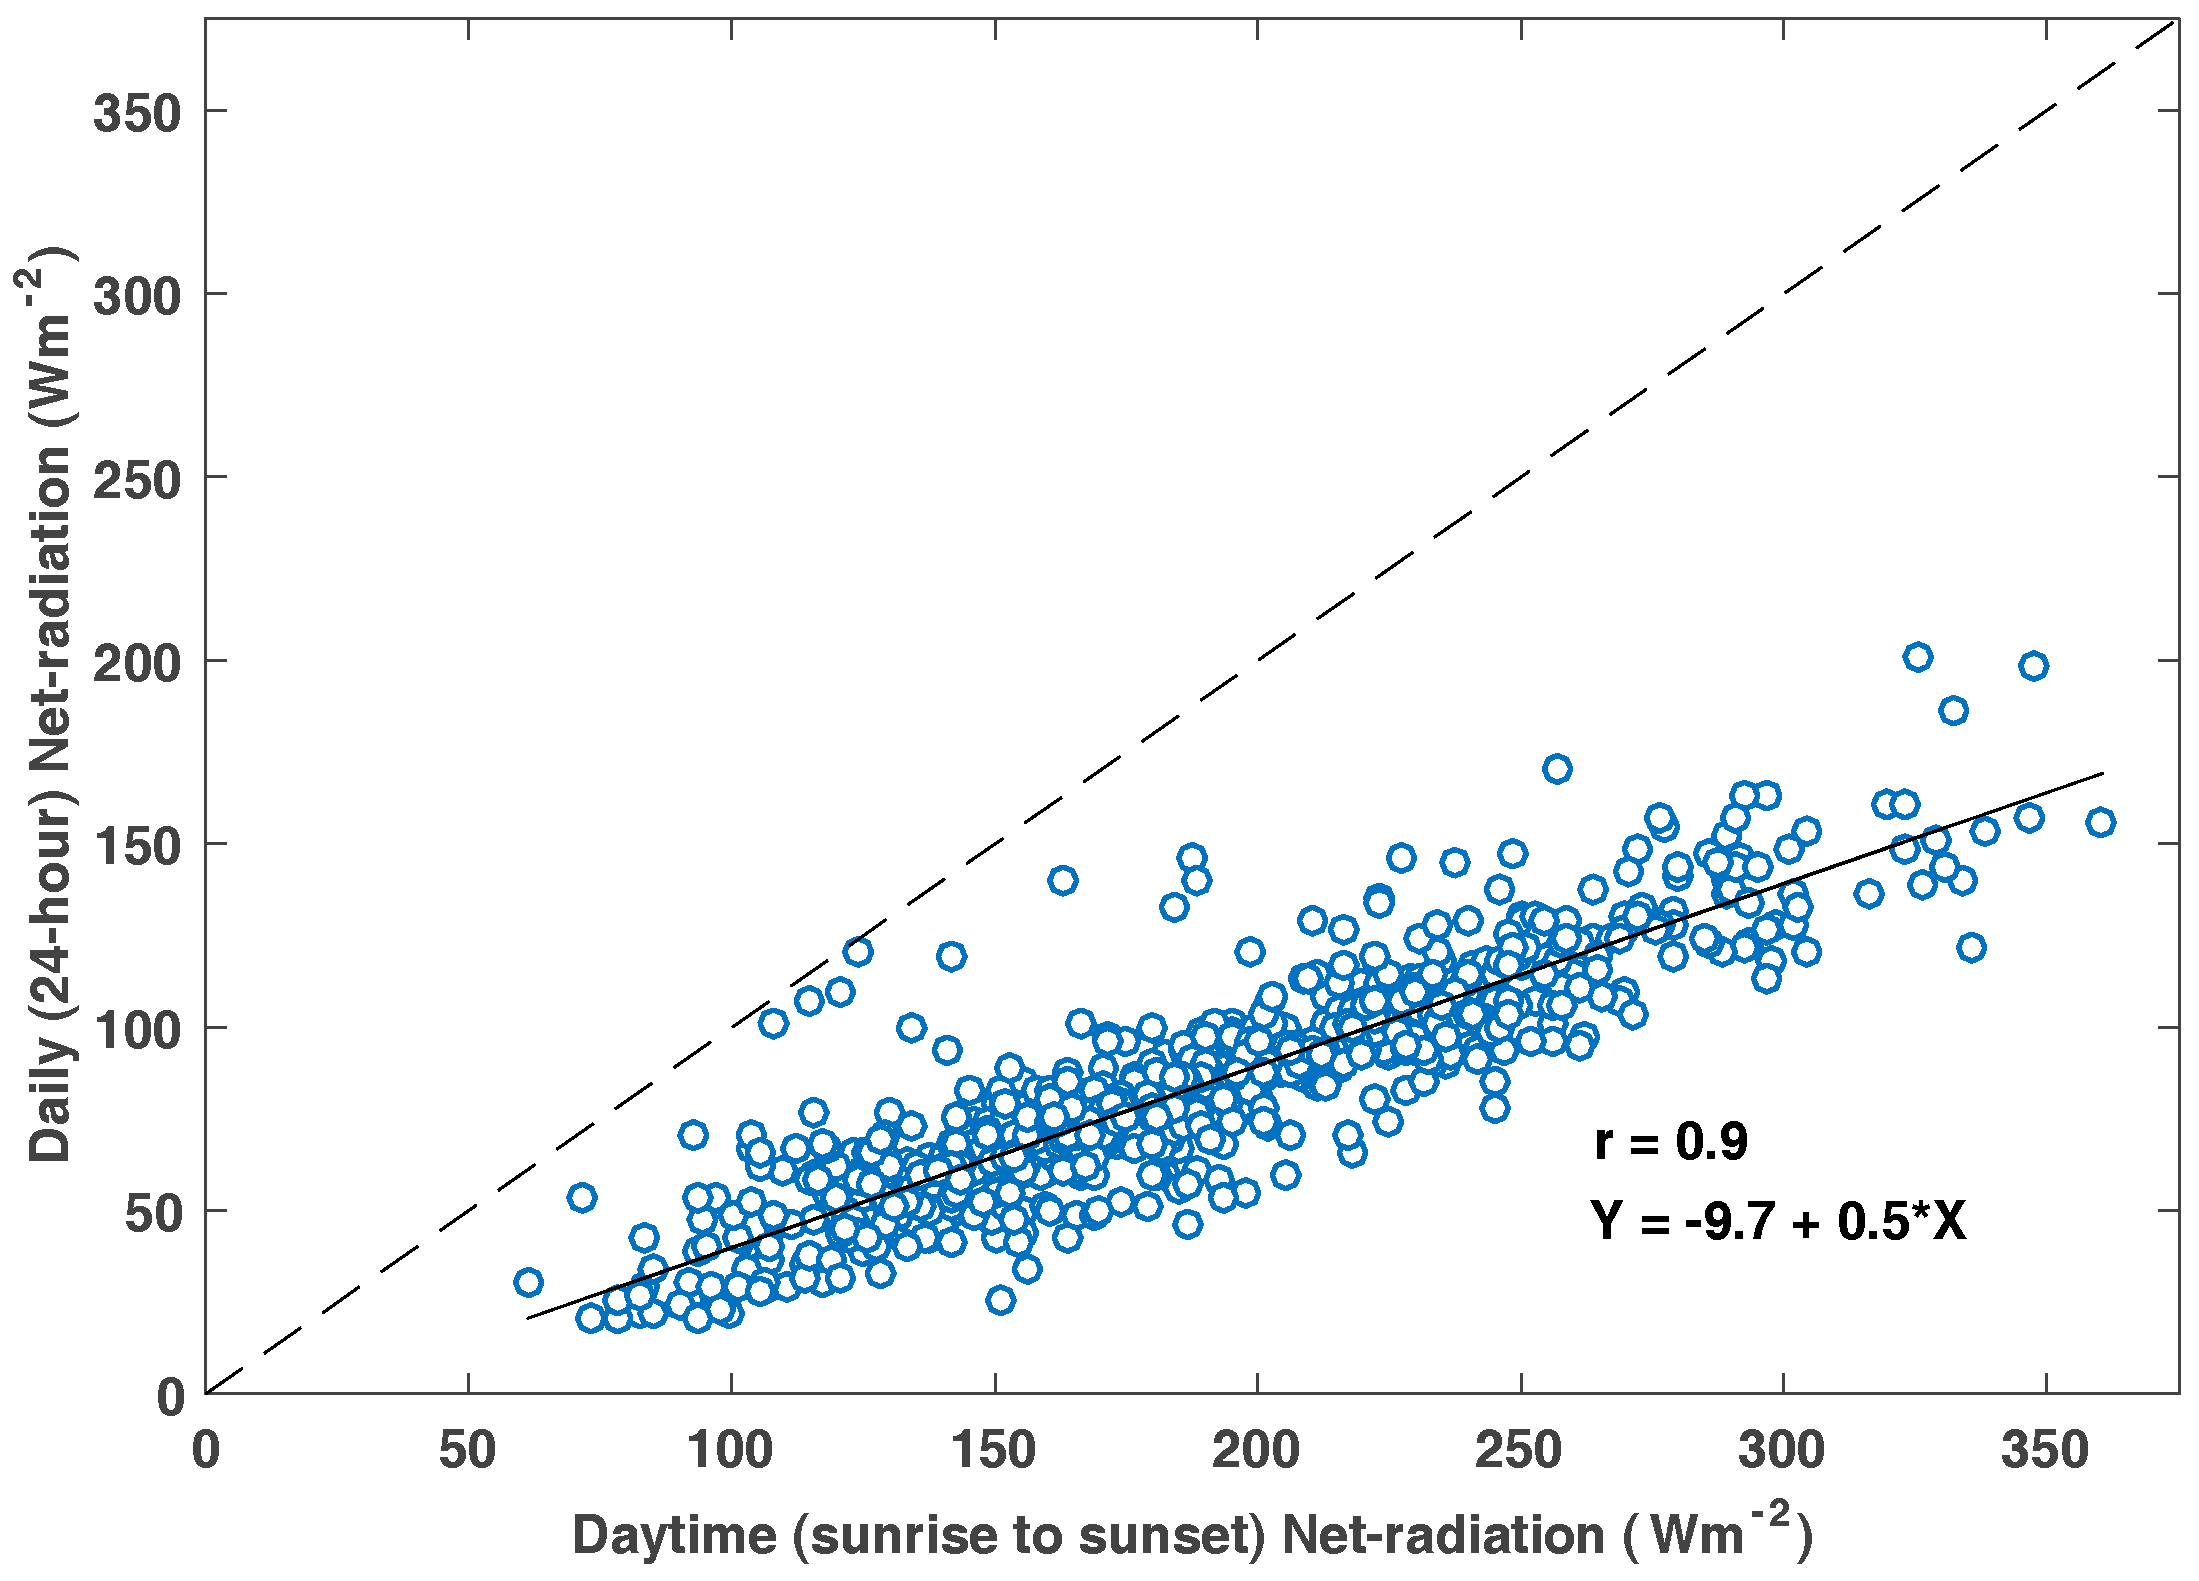
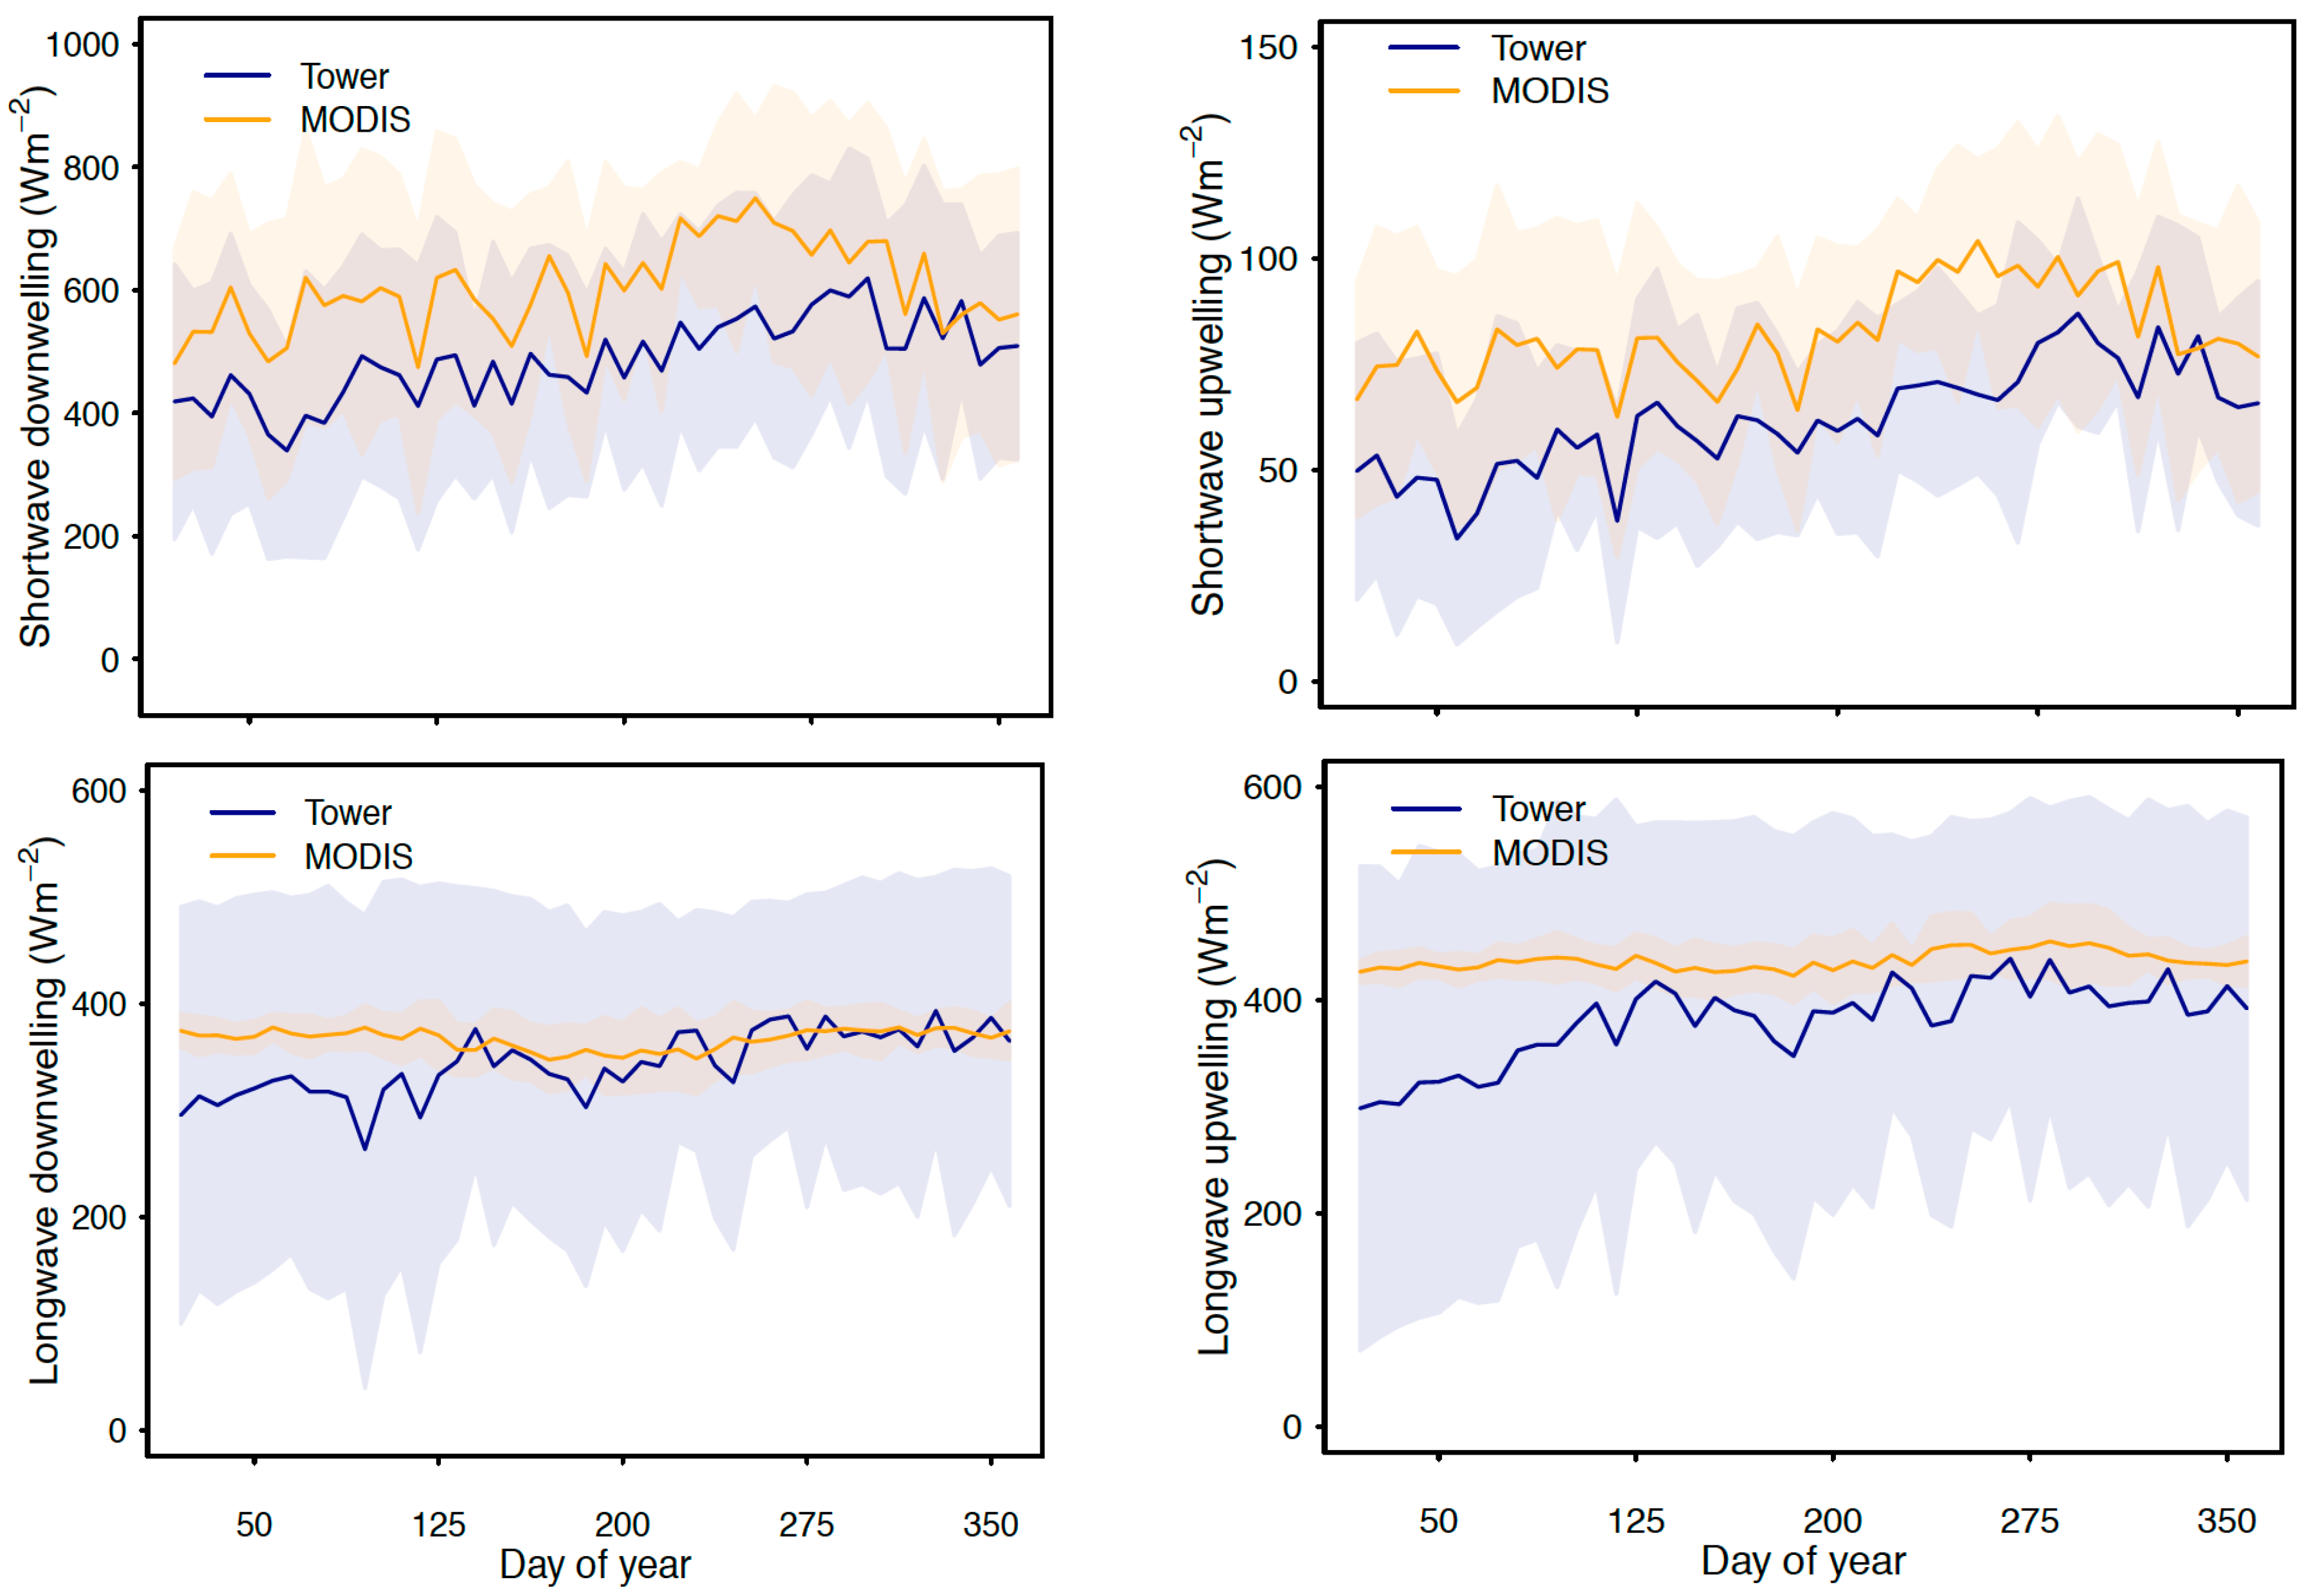
3.2. Agreement between Integrated Daytime MODIS and Measured Net-Radiation

The daytime (sunrise to sunset) MODIS net-radiation agreed well (0.63 < IoA < 0.74) with tower net-radiation in extra tropics (Figure 4 and Figure 5). MODIS net-radiation agreed the best with measured net-radiation at boreal (n = 28) and Mediterranean (n = 40) sites with the highest mean IoA (≈0.74 ± 0.01), and low MAE (≈38.0 ± 1.8, 42.0 ± 1.4 W·m−2, respectively) and mean bias (≈4 ± 3, 0 ± 2 W·m−2, respectively; Figure 4). Predicted net-radiation also agreed very well with measurements at the temperate-continental (n = 38) and temperate (n = 32) sites (Figure 4).
There was indistinguishable difference in model performance at temperate-continental and temperate sites (IoA ≈ 0.72 ± 0.01; MAE ≈ 47.0 ± 1.7 W·m−2, and bias ≈ −3 W·m−2). The MODIS net-radiation agreed moderately well with measured net-radiation at the semi-arid sites (n = 9; IoA ≈ 0.63 ± 0.02, MAE ≈ 49 ± 2 W·m−2, and mean bias ≈ −6 ± 4 W·m−2).
As expected, due to relatively low seasonal variability in net-radiation, the agreement between the MODIS net-radiation and measurements was the lowest at tropical sites (n = 7; IoA ≈ 0.47 ± 0.05, MAE ≈ 72 ± 4 W·m−2, and mean bias ≈ 3.9 ± 10.2 W·m−2).
In all six climate types the mean bias was small and constituted only 11.0%, 0.7%, 8.4%, 4.2%, 13.3%, and 5.4% of the mean absolute error in daytime net-radiation in boreal, Mediterranean, temperate-continental, temperate, semi-arid, and tropical climate, respectively (Figure 4 and Figure 5). After correcting for positive bias, the mean absolute error in daytime net-radiation was 33, 41, 42, 45, 42, and 68 W·m−2 in boreal, Mediterranean, temperate-continental, temperate, semi-arid, and tropical climates, respectively.

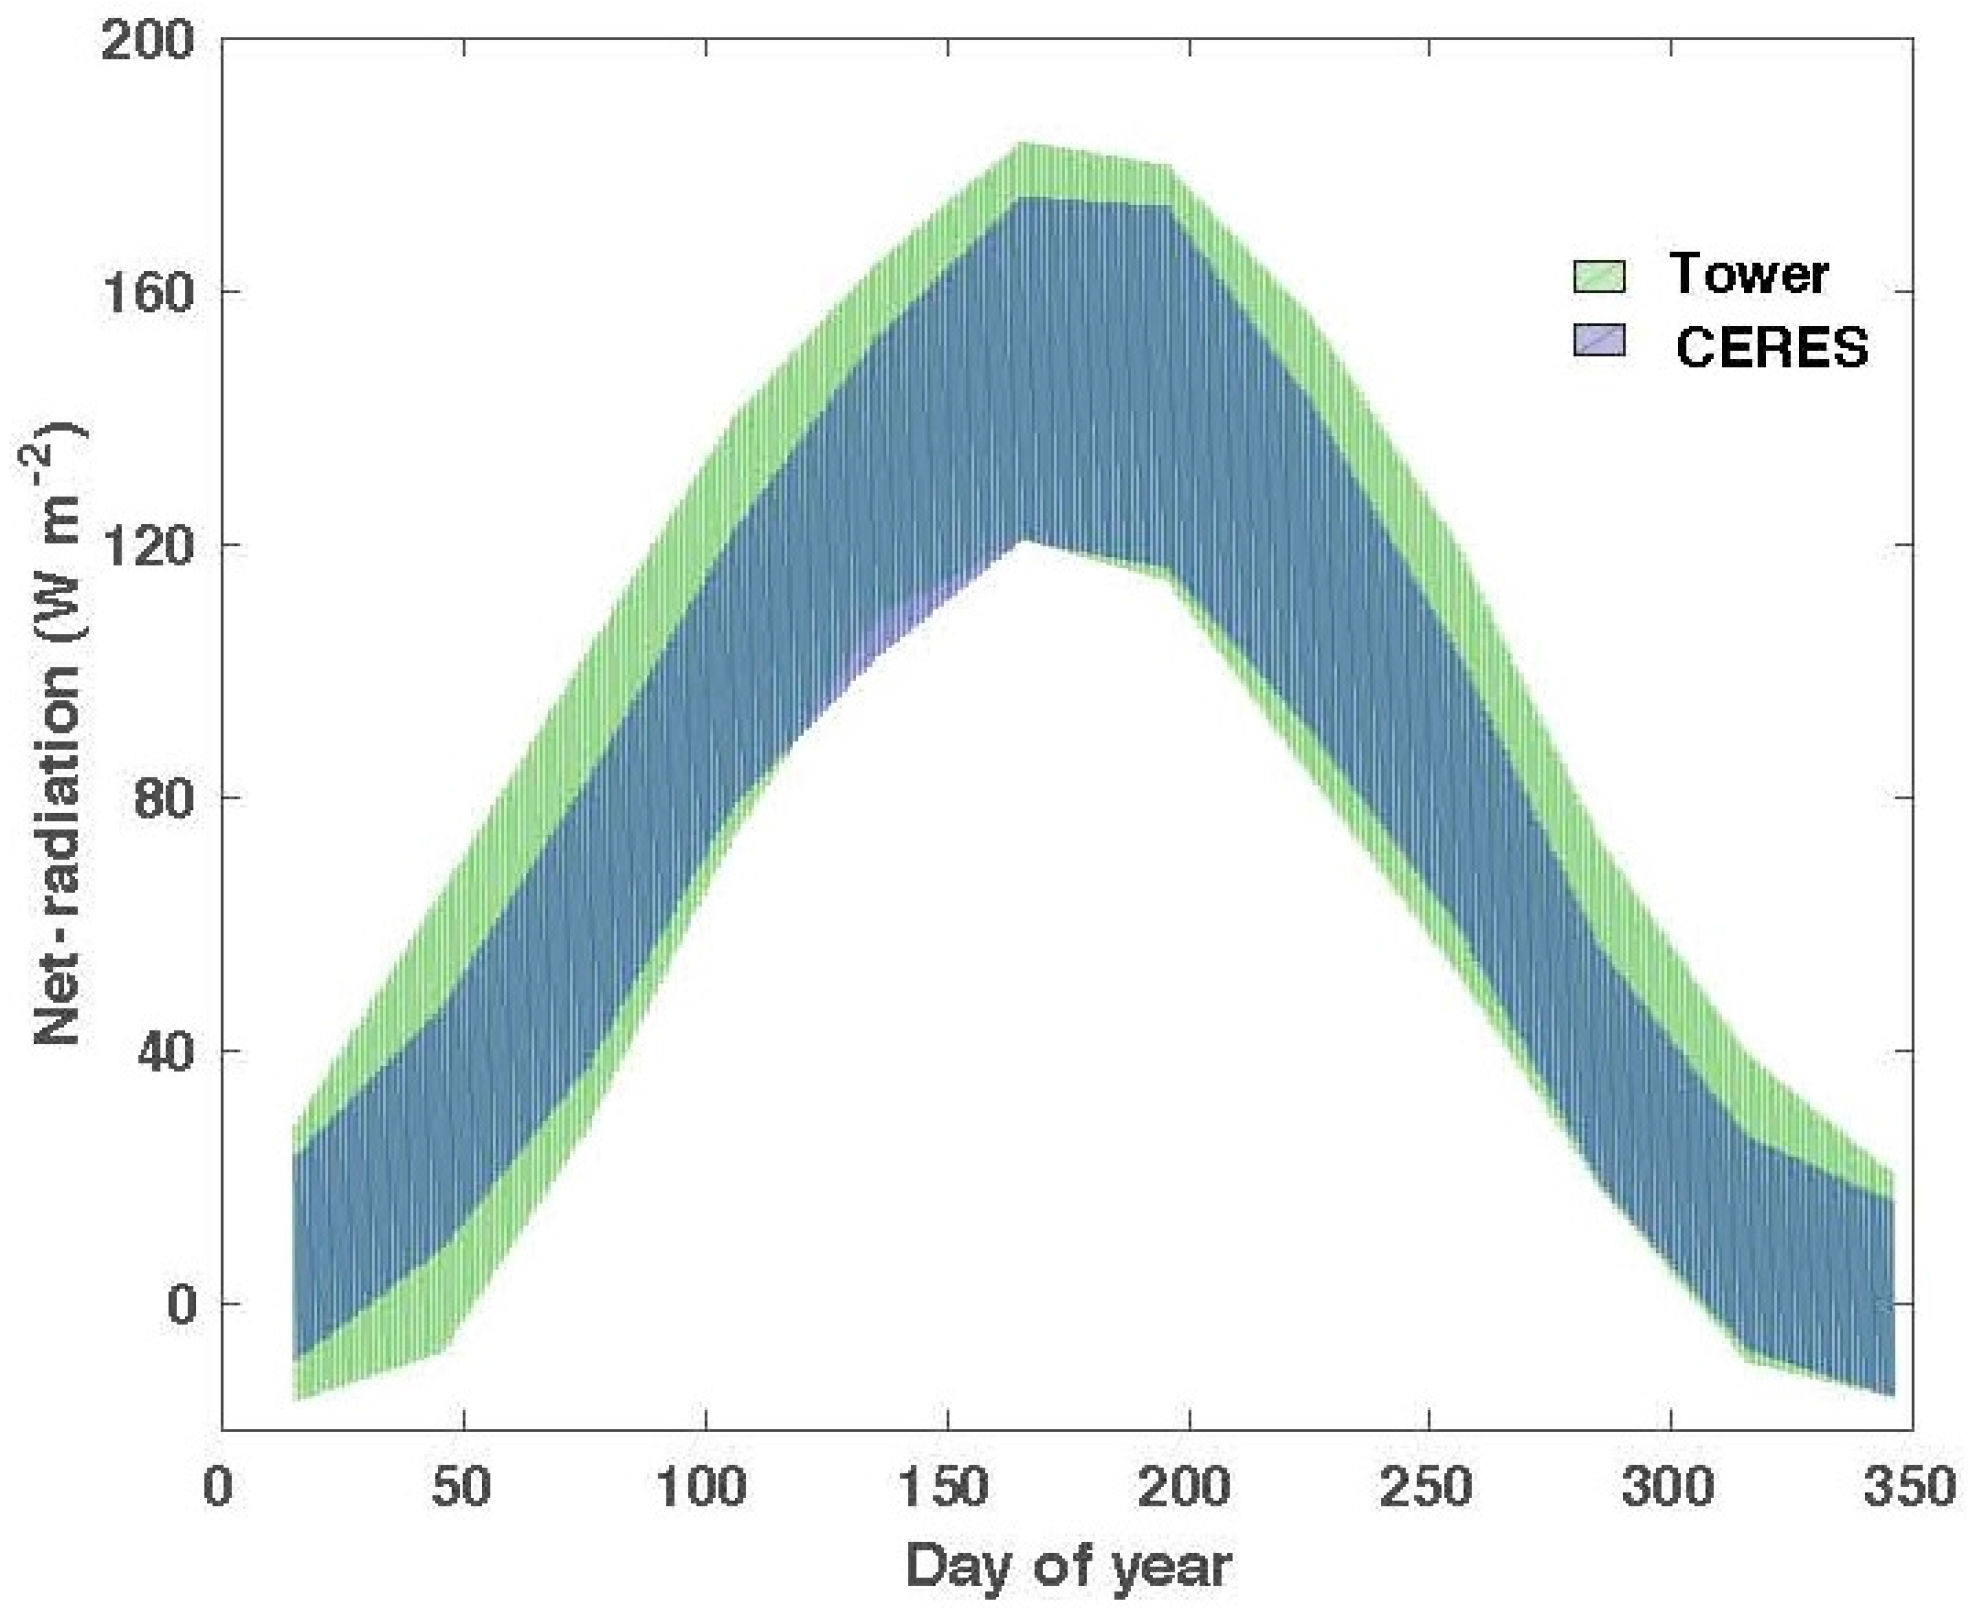
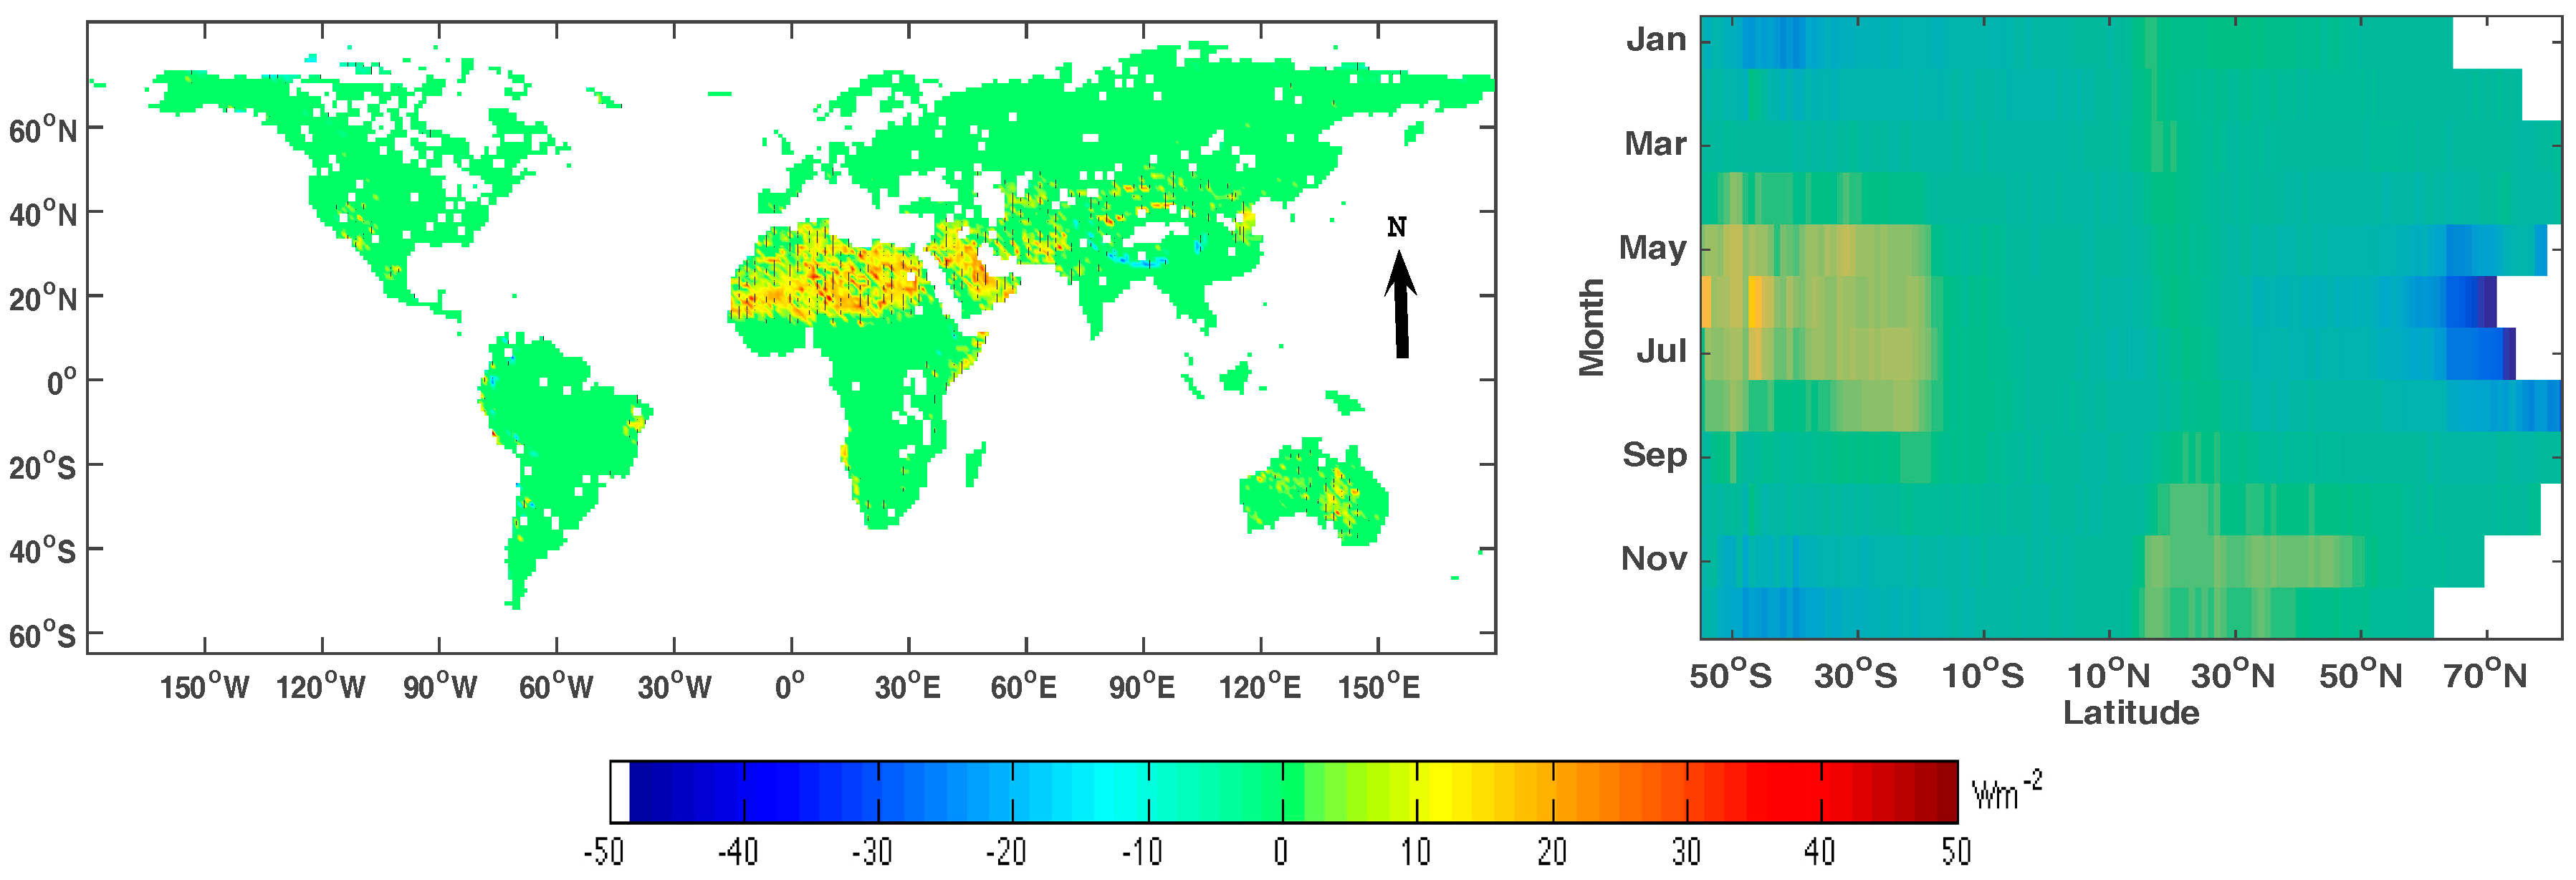
3.3. Agreement between MODIS and the CERES Net-Radiation

3.3.1. Validation of CERES with Tower Data

Monthly CERES output agreed very well with the tower data (Figure 6; MAE = 18 W·m−2). Net-radiation from CERES matched the seasonality of measured net-radiation very closely both in magnitude and temporal variation and was within the margin of uncertainty in measured net-radiation. These results confirmed the high quality of CERES estimates shown in previous studies [42] and justifies its use as reference data for validating large scale pattern in our net-radiation product.

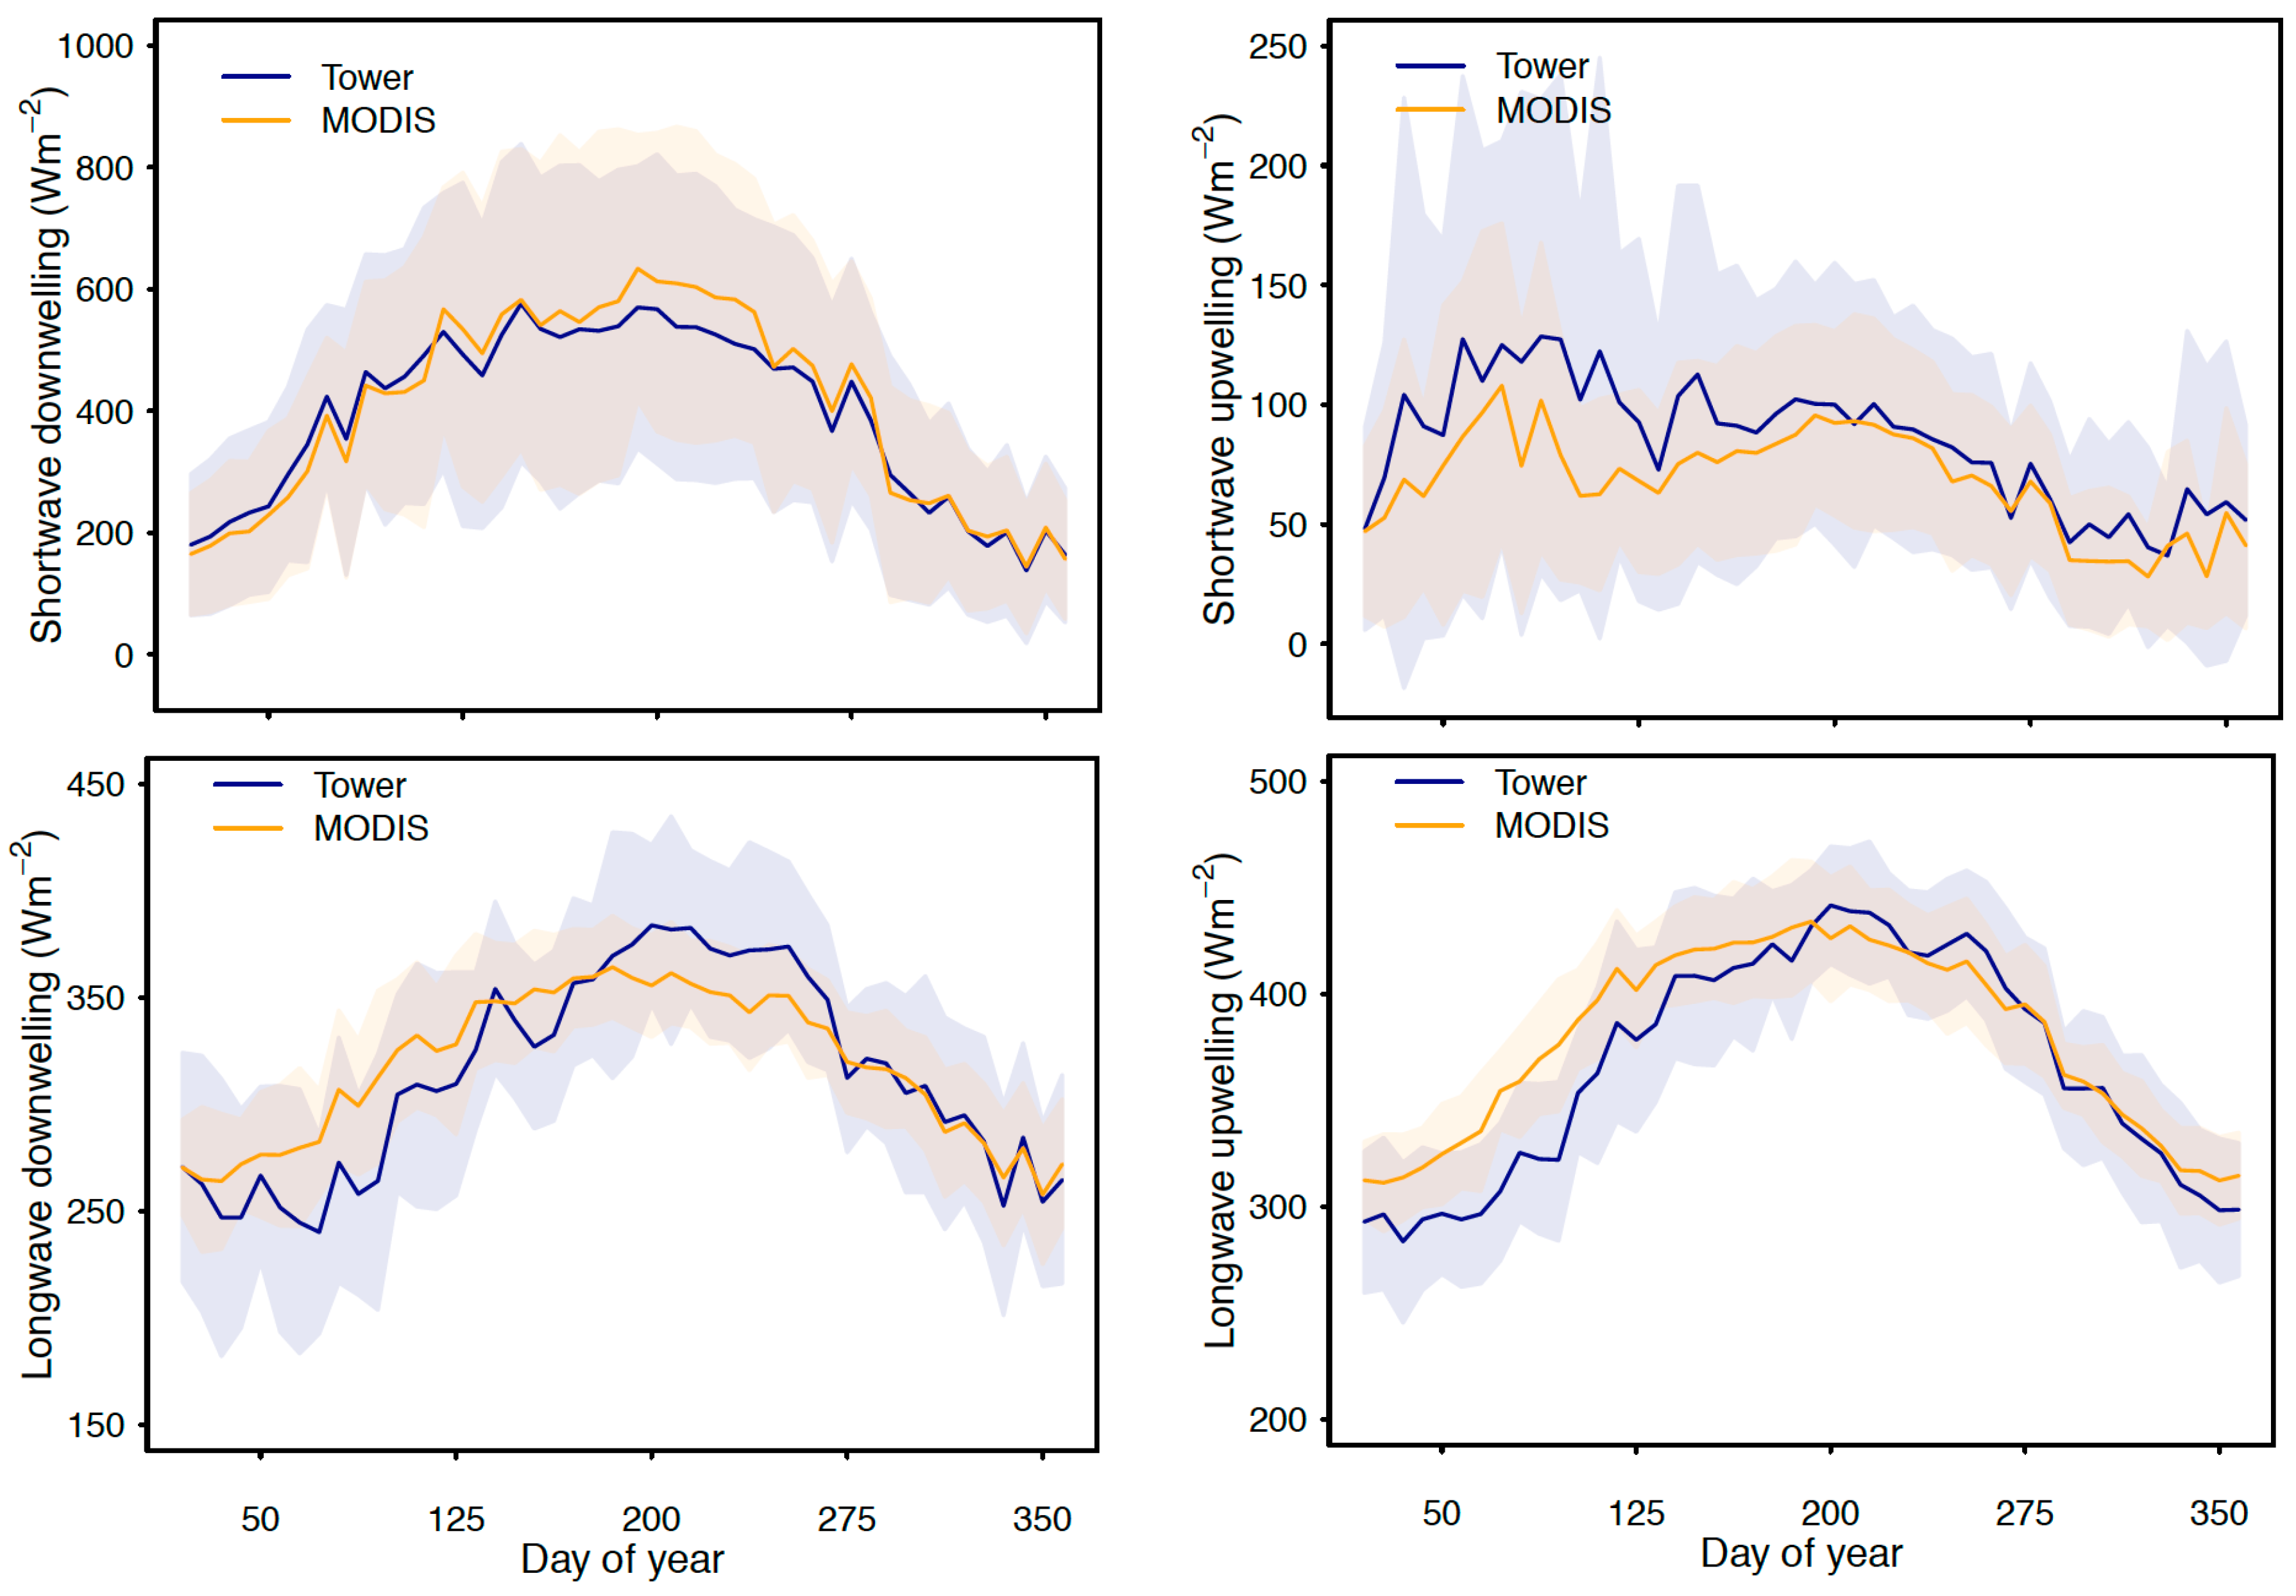
3.3.2. Comparison of MODIS with CERES

Measurements from across sites showed that mean annual daytime net-radiation was strongly related with the daily net-radiation (Figure 7). We used this relationship and converted MODIS daytime to daily net-radiation. Figure 8 shows the estimated global daily (24-h) net-radiation from MODIS averaged over 2001 to 2007 and confirms that it captures the broad patterns of spatial variability very well.
We compared the broader spatiotemporal patterns in mean daily net-radiation with the corresponding estimates from the CERES. Mean annual daily global terrestrial net-radiation from MODIS and CERES was 71 and 68 W·m−2, respectively. Mean net-radiation from MDOIS agreed very well with the corresponding estimates from the CERES product (Figure 9). In 94% of the total 1° × 1° grid cells, the difference between the mean MODIS net-radiation and the CERES net-radiation was less than 10 W·m−2. The difference between the two products was evident in northern Africa (Figure 5). In these areas, the CERES values were usually lower than the corresponding estimates from MODIS. As the Hovmoller diagram shows the MODIS estimate also agreed well with the estimates from the CERES over time (Figure 8).

4. Discussion

4.1. Reliability and Accuracy of MODIS Net-Radiation

Seasonal variation in daytime MODIS net-radiation agreed well with in situ measurements, albeit with some bias. The magnitude of bias varied across different climate types from a minimum of 0.3 W·m−2 (1% of total error) in Mediterranean to a maximum of −6.5 W·m−2 (13% of total error) in semi-arid climate. We used sinusoidal integration to compute mean daytime net-radiation from instantaneous net-radiation. Developing a suitable method that can be applied across climate and land cover types for integrating instantaneous quantities to daily values remains a challenge and is an active area of research [50,51,52].
However, it appears that sinusoidal integration does a reasonably good job and, in fact, reduces the bias in instantaneous net-radiation without adversely affecting the correlation between the modeled and tower net-radiation (Figure 3 and Figure 5). The index of agreement between MODIS and measured net-radiation is almost identical for the instantaneous and daytime net-radiation. But, the proportion of bias relative to mean absolute error decreased for daytime net-radiation in each of the six climate types. Estimated instantaneous values varied within the range of measurements and also agreed well with values reported in other studies. For example, it has been observed in a continental Mediterranean area (42°1′N; 4°32′W and 732 m above sea level) that minimum measured net-radiation values varied between 87 and 90 W·m−2 and the maximum between 570 and 585 W·m−2 in July 1995 [53,54].
Observations from the FLUXNET and SURFRAD stations showed that of the four components, incoming shortwave radiation was most strongly correlated with net-radiation across all six climate types, and was the main driver of seasonal variations in instantaneous net-radiation [1,55,56]. Mean R2 (across site) between incoming shortwave radiation and net-radiation was 0.89, 0.86, 0.91, 0.91, 0.82, and 0.80 in boreal, temperate-continental, temperate, Mediterranean, semi-arid, and tropical climates, respectively. Thus, accurately modeling downwelling shortwave net-radiation is necessary, though not sufficient, for capturing seasonal variability in net-radiation [19]. The modeled incoming shortwave radiation tracked the instantaneous measured incoming shortwave radiation well in the extra-tropics (e.g., see Figure 10 for temperate-continental sites). However, in tropical areas the seasonal amplitude of incoming shortwave radiation was relatively small and the discrepancy between measured and MODIS instantaneous shortwave radiation was large (Figure 11). In fact, discrepancy between the MODIS and measured values was evident in the tropics for the other three components as well (Figure 11). In the tropics, burning biomass, aerosols, and cloudy skies can corrupt reflected [57] and emitted radiation [58] and make it difficult to get accurate, temporally frequent estimates of the variables such as land surface temperature, near surface pressure and temperature, and albedo from MODIS. In the humid tropics, high atmospheric moisture adds to the difficulty of retrieving land surface temperature from thermal infrared radiation. Moreover, in tropical areas the diurnal profile of clouds and atmospheric vapor varies significantly [59] and presents extra challenges in converting instantaneous measurements at the satellite overpass time to integrated daily values. We assumed a pixel to be either cloudy or clear. However, in tropics, 5 km2 area can have significant sub-pixel heterogeneity in cloud cover, which can affect the accuracy of the retrievals.
The components that contributed to the bias and error in other climate types varied. The accuracy of estimated components is partly dependent on the accuracy of input data [60]. For example, MODIS albedo is known to be biased in snow or partially snow covered situations [61]. Although, daily net-radiation is not very sensitive to albedo [1], over seasonal time scale variations in albedo in higher latitudes can influence net-radiation through its effect on outgoing shortwave radiation [55]. To calculate outgoing longwave radiation we used prescribed emissivity in band 31 and 32 from the MOD11 product and used a simple formulation to estimate broadband emissivity. These average prescribed values are unlikely to capture fine-scale, real-time spatiotemporal variations in emissivity and its effect on retrieved land surface temperature [62], and can cause bias and errors in estimated instantaneous outgoing longwave radiation. Similarly, the LST of a pixel is the effective value of the temperatures and emissivities of different end-members such as vegetation and soil that make up a pixel. In 5 km2 area variation in soil and vegetation proportion can nonlinearly affect the emitted radiation and introduce errors in estimated mean LST. We deal with downwelling longwave radiation in cloudy sky be assuming that it behaves like a black body with a perfect emissivity. As explained earlier in Material and Methods, we made this choice because the alternatives demand more data that is not available. However, this method is likely to lead to an overestimation because in reality clouds do not behave like perfect blackbody and their effective emissivity depends on several factors such as cloud optical thickness and effective radius of ice particles.
The close agreement between daily MODIS and CERES net-radiation over time and space (Figure 9) validates the overall accuracy of the broad patterns in the MODIS estimates. Although both the CERES and our algorithms rely on inputs from MODIS, they differ significantly in terms of detailed calculations and other sources of input data. The CERES algorithm uses a variety of other input data, is run at a finer 3-h resolution, uses more sophisticated models, but has coarse spatial resolution [42]. Except for the incoming shortwave component, our algorithm relies on simple parameterized formulations, but has fine spatial resolution. Despite these differences, the two estimates agreed well with each other over both space and time.

4.2. Sensitivity of Estimated Net-Radiation to Gap Filling and NCEP Data

For days that are cloudy at the satellite overpass time, some of the MODIS data (such as LST, atmospheric profile, and albedo) were not available. Thus, in cloudy days we used spatial interpolation or land cover based mean values and employed data from NCEP. To investigate the effect of these steps we compared how well do instantaneous and daytime net-radiation in clear and cloudy sky agree with corresponding measurements.
At instantaneous time scale the IoA between MODIS and measured net-radiation in cloudy sky was 0.71, 0.67, 0.67, 0.70, 0.51, and 0.46 in boreal, Mediterranean, temperate-continental, temperate, semi-arid, and tropical climates, respectively. For clear sky, the IoA was 0.75, 0.72, 0.73, 0.73, 0.70, and 0.43 for the six respective climate types. For daytime (sunrise to sunset) the IoA between MODIS and measured net-radiation was 0.74, 0.72, 0.70, 0.71, 0.52, and 0.42 in boreal, Mediterranean, temperate-continental, temperate, semi-arid, and tropical climates, respectively, in cloudy sky, whereas, for clear sky, the IoA in the six climate types was 0.76, 0.76, 0.74, 0.71, 0.69, and 0.52, respectively. Thus, although the estimated net-radiation from MODIS agreed better with measurements in clear than cloudy days at both instantaneous and daily time scale, the performance of MODIS net-radiation in cloudy days was also very good. In all but semi-arid climate, the difference in IoA for clear and cloudy days was small.

5. Conclusions

We produced the global daily surface net-radiation at 5 km by combining 11 variables from six different MODIS land and atmosphere products with a radiative transfer model and ancillary datasets from NCEP. Our algorithm estimates the four components of net-radiation—downwelling shortwave, upwelling shortwave, downwelling longwave, and upwelling longwave radiation—globally in all-sky conditions. We rigorously evaluated the accuracy and reliability of our net-radiation estimates using direct measurements from 154 globally distributed sites. Our net-radiation product performed well and agreed closely with in situ measurements in extratropics. However, in tropical areas, the agreement with measurements was relatively weaker. Some of the key challenges in modeling net-radiation in the tropics are to account for the effects of aerosols, atmospheric moisture, and frequently changing clouds. High frequency changes in these factors coupled with relatively low seasonal variability in net-radiation makes it difficult to accurately capture the four components of net-radiation. Validating remote sensing-based estimates of net-radiation also remains a challenge due to the paucity of in-situ measurements in tropics. Although the two ground networks included many stations in the extra-tropics, there were only seven sites in the tropics. Given that the reliability of modeled net-radiation was the least in the tropics there is a need to expand ground coverage in tropical area and generate adequate samples in space and time.
Polar orbiting satellites such as MODIS cannot capture the diurnal variation of clouds. However, sub-daily changes in clouds can cause the diurnal profile of net-radiation to deviate away from the idealized sinusoidal trajectory, causing discrepancy between the modeled and actual integrated net-radiation. In the future versions of our products, we will integrate information about the diurnal variability in the different components using data from MODIS Aqua and other sources such as geostationary satellites. We used atmospheric variables and land surface temperature from Terra in this study. Currently, re-gridded data from Aqua is not available. Together, Aqua (1:30 p.m. overpass time at equator) and Terra (10:30 a.m. overpass time at equator) data will provide better constraint for integrating instantaneous net-radiation to daily values. Following Hendrix et al. [20], we plan to re-project Aqua data on the sinusoidal grid and integrate it in the next version of our product. In the next version of our product we will also downscale the MOD04, MOD06, and MOD07 products at 1 km. Since MODIS albedo and land-cover data are already available at 500 m and MODIS land surface temperature at 1 km the downscaling will allow us to improve the spatial resolution of our product to 1 km. Downloading global, multiple year MODIS data for several products, and checking it for data integrity and error is a time-consuming operation. Addressing dataflow efficiencies in data downloads will also be an area of emphasis in the next version of our product.
The uncertainty-quantified MODIS net-radiation product is available to the global science community and will be a valuable resource for a variety of investigations such as estimation of evapotranspiration at continental and global scale, validation of climate and land surface model outputs, and understanding and estimating the strength of land–atmosphere coupling.

Supplementary Materials

The following are available online at https://www.mdpi.com/2072-4292/8/9/739/s1, Table S1: Sites from FLUXENT and Surface Radiation (SURFRAD) network used in this study.

Acknowledgments

Support for this study was provided by the NASA Terrestrial Hydrology Program and Jet Propulsion Laboratory Strategic Research & Technology Development Climate Initiative. The research was carried out at the Jet Propulsion Laboratory, California Institute of Technology, under a contract with the National Aeronautics and Space Administration. Copyright 2015 California Institute of Technology. Government sponsorship acknowledged. This work used net-radiation data acquired by the FLUXNET community and in particular by the following networks: AmeriFlux (U.S. Department of Energy, Biological and Environmental Research, Terrestrial Carbon Program (DE-FG02-04ER63917 and DE-FG02-04ER63911)), AfriFlux, AsiaFlux, CarboAfrica, CarboEuropeIP, CarboItaly, CarboMont, ChinaFlux, Fluxnet-Canada (supported by CFCAS, NSERC, BIOCAP, Environment Canada, and NRCan), GreenGrass, KoFlux, LBA, NECC, OzFlux, TCOS-Siberia, USCCC. The authors gratefully acknowledge the efforts of the FLUXNET community to compile and make available the La Thuile data set. Data from AU-Fog—Fogg Dam, AU-How—Howard Springs, AU-Wac—Wallaby Creek was funded by the Australian Research Council (DP0451247, DP0344744, DP0772981 and DP130101566). Support for collection and archiving was provided through the Australia Terrestrial Ecosystem Research Network (TERN) (http://www.tern.org.au). SW was supported by the European Commission with a Marie Curie International Outgoing Fellowship (grant 300083).

Author Contributions

M.V., and J.F. designed the study. A.G., M.V., G.M., J.F., R.Y., and H.K. developed codes. M.V. carried out the analyses and wrote the initial draft of the manuscript with inputs from J.F. S.W., G.K., G.W., B.G., O.R., P.T., A.A., and A.C. provided field data. LR and VH provided MODIS atmospheric data at 5 km. M.S. helped with Figure 10 and Figure 11. All of the co-authors provided feedbacks and comments on the manuscript.

Conflicts of Interest

The authors declare no conflict of interest. The founding sponsors had no role in the design of the study; in the collection, analyses, or interpretation of data; in the writing of the manuscript, and in the decision to publish the results.

References

  1. Alados, I.; Foyo-Moreno, I.; Olmo, F.J.; Alados-Arboledas, L. Relationship between net radiation and solar radiation for semi-arid shrub-land. Agric. For. Meteorol. 2003, 116, 221–227. [Google Scholar] [CrossRef]
  2. Diak, G.R.; Mecikalski, J.R.; Anderson, M.C.; Norman, J.M.; Kustas, W.P.; Torn, R.D.; Dewolf, R.L. Estimating land surface energy budgets from space: Review and current efforts at the university of Wisconsin—Madison and USDA–ARS. Bull. Am. Meteorol. Soc. 2004, 85, 65–78. [Google Scholar] [CrossRef]
  3. Fisher, J.B.; Malhi, Y.; Bonal, D.; Da Rocha, H.R.; de Araujo, A.C.; Gamo, M.; Goulden, M.L.; Hirano, T.; Huete, A.R.; Kondo, H.; et al. The land-atmosphere water flux in the tropics. Glob. Chang. Biol. 2009, 15, 2694–2714. [Google Scholar] [CrossRef]
  4. Mallick, K.; Jarvis, A.J.; Boegh, E.; Fisher, J.B.; Drewry, D.T.; Tu, K.P.; Hook, S.J.; Hulley, G.; Ardö, J.; Beringer, J. A surface temperature initiated closure (STIC) for surface energy balance fluxes. Remote Sens. Environ. 2014, 141, 243–261. [Google Scholar] [CrossRef]
  5. Bisht, G.; Bras, R.L. Estimation of net radiation from the MODIS data under all sky conditions: Southern Great Plains case study. Remote Sens. Environ. 2010, 114, 1522–1534. [Google Scholar] [CrossRef]
  6. Rutan, D.A.; Kato, S.; Doelling, D.R.; Rose, F.G.; Nguyen, L.T.; Caldwell, T.E.; Loeb, N.G. Ceres synoptic product: Methodology and validation of surface radiant flux. J. Atmos. Ocean Technol. 2015, 32, 1121–1143. [Google Scholar] [CrossRef]
  7. Stackhouse, P.; Gupta, S.; Cox, S.; Mikovitz, J.; Zhang, T.; Chiacchio, M. 12-year surface radiation budget data set. GEWEX News 2004, 14, 10–12. [Google Scholar]
  8. Zhang, Y.C.; Rossow, W.B.; Lacis, A.A.; Oinas, V.; Mishchenko, M.I. Calculation of radiative fluxes from the surface to top of atmosphere based on isccp and other global data sets: Refinements of the radiative transfer model and the input data. J. Geophys. Res. Atmos. 2004, 109. [Google Scholar] [CrossRef]
  9. Bosilovich, M.G.; Robertson, F.R.; Chen, J. Global energy and water budgets in Merra. J. Clim. 2011, 24, 5721–5739. [Google Scholar] [CrossRef]
  10. Uppala, S.M.; Kållberg, P.; Simmons, A.; Andrae, U.; Bechtold, V.d.; Fiorino, M.; Gibson, J.; Haseler, J.; Hernandez, A.; Kelly, G. The ERA-40 re-analysis. Q. J. R. Meteorol. Soc. 2005, 131, 2961–3012. [Google Scholar] [CrossRef]
  11. Mu, Q.; Heinsch, F.; Zhao, M.; Running, S. Development of a global evapotranspiration algorithm based on MODIS and global meteorology data. Remote Sens. Environ. 2007, 111, 519–536. [Google Scholar] [CrossRef]
  12. Jiang, B.; Liang, S.; Ma, H.; Zhang, X.; Xiao, Z.; Zhao, X.; Jia, K.; Yao, Y.; Jia, A. Glass daytime all-wave net radiation product: Algorithm development and preliminary validation. Remote Sens. 2016, 8, 222. [Google Scholar] [CrossRef]
  13. Bisht, G.; Venturini, V.; Islam, S.; Jiang, L. Estimation of the net radiation using MODIS (moderate resolution imaging spectroradiometer) data for clear sky days. Remote Sens. Environ. 2005, 97, 52–67. [Google Scholar] [CrossRef]
  14. Ryu, Y.; Kang, S.; Moon, S.-K.; Kim, J. Evaluation of land surface radiation balance derived from moderate resolution imaging spectroradiometer (MODIS) over complex terrain and heterogeneous landscape on clear sky days. Agric. For. Meteorol. 2008, 148, 1538–1552. [Google Scholar] [CrossRef]
  15. Sobrino, J.; Gómez, M.; Jiménez-Muñoz, J.; Olioso, A. Application of a simple algorithm to estimate daily evapotranspiration from NOAA–AVHRR images for the Iberian Peninsula. Remote Sens. Environ. 2007, 110, 139–148. [Google Scholar] [CrossRef]
  16. Ryu, Y.; Baldocchi, D.D.; Kobayashi, H.; van Ingen, C.; Li, J.; Black, T.A.; Beringer, J.; van Gorsel, E.; Knohl, A.; Law, B.E.; et al. Integration of MODIS land and atmosphere products with a coupled-process model to estimate gross primary productivity and evapotranspiration from 1 km to global scales. Glob. Biogeochem. Cycles 2011, 25. [Google Scholar] [CrossRef] [Green Version]
  17. Kobayashi, H.; Iwabuchi, H. A coupled 1-D atmosphere and 3-D canopy radiative transfer model for canopy reflectance, light environment, and photosynthesis simulation in a heterogeneous landscape. Remote Sens. Environ. 2008, 112, 173–185. [Google Scholar] [CrossRef]
  18. Hou, J.; Jia, G.; Zhao, T.; Wang, H.; Tang, B. Satellite-based estimation of daily average net radiation under clear-sky conditions. Adv. Atmos. Sci. 2014, 31, 705–720. [Google Scholar] [CrossRef]
  19. Bisht, G.; Bras, R. Estimation of net radiation from the moderate resolution imaging spectroradiometer over the continental united states. IEEE Trans. Geosci. Remote Sens. 2011, 49, 2448–2462. [Google Scholar] [CrossRef]
  20. Hendrix, V.; Ramakrishnan, L.; Ryu, Y.; van Ingen, C.; Jackson, K.R.; Agarwal, D. Camp: Community access MODIS pipeline. Future Gener. Comput. Syst. 2014, 36, 418–429. [Google Scholar] [CrossRef]
  21. Chu, D.; Kaufman, Y.; Ichoku, C.; Remer, L.; Tanré, D.; Holben, B. Validation of MODIS aerosol optical depth retrieval over land. Geophys. Res. Lett. 2002, 29, MOD2-1–MOD2-4. [Google Scholar] [CrossRef]
  22. Kaufman, Y.J.; Gao, B.C. Remote-sensing of water-vapor in the near IR from EOS/MODIS. IEEE Trans. Geosci. Remote Sens. 1992, 30, 871–884. [Google Scholar] [CrossRef]
  23. Platnick, S.; King, M.; Ackerman, S.; Menzel, W.; Baum, B.; Riédi, J.; Frey, R. The MODIS cloud products: Algorithms and examples from Terra. IEEE Trans. Geosci. Remote Sens. 2003, 41, 459–473. [Google Scholar] [CrossRef]
  24. Seemann, S.; Li, J.; Gumley, L.; Strabala, K.; Menzel, W. Operational retrieval of atmospheric temperature, moisture, and ozone from MODIS infrared radiances. J. Appl. Meteorol. 2003, 42, 168–176. [Google Scholar] [CrossRef]
  25. Wan, Z.; Zhang, Y.; Zhang, Q.; Li, Z.-L. Quality assessment and validation of the MODIS global land surface temperature. Int. J. Remote Sens. 2004, 25, 261–274. [Google Scholar] [CrossRef]
  26. Augustine, J.A.; DeLuisi, J.J.; Long, C.N. SURFRAD-A national surface radiation budget network for atmospheric research. Bull. Am. Meteorol. Soc. 2000, 81, 2341–2357. [Google Scholar] [CrossRef]
  27. Iwabuchi, H. Efficient Monte Carlo methods for radiative transfer modeling. J. Atmos. Sci. 2006, 63, 2324–2339. [Google Scholar] [CrossRef]
  28. Hess, M.; Koepke, P.; Schult, I. Optical properties of aerosols and clouds: The software package OPAC. Bull. Am. Meteorol. Soc. 1998, 79, 831–844. [Google Scholar] [CrossRef]
  29. Schaaf, C.; Gao, F.; Strahler, A.; Lucht, W.; Li, X.; Tsang, T.; Strugnell, N.; Zhang, X.; Jin, Y.; Muller, J.-P. First operational BRDF, albedo nadir reflectance products from MODIS. Remote Sens. Environ. 2002, 83, 135–148. [Google Scholar] [CrossRef]
  30. Friedl, M.A.; McIver, D.K.; Hodges, J.C.F.; Zhang, X.Y.; Muchoney, D.; Strahler, A.H.; Woodcock, C.E.; Gopal, S.; Schneider, A.; Cooper, A.; et al. Global land cover mapping from MODIS: Algorithms and early results. Remote Sens. Environ. 2002, 83, 287–302. [Google Scholar] [CrossRef]
  31. Friedl, M.A.; Sulla-Menashe, D.; Tan, B.; Schneider, A.; Ramankutty, N.; Sibley, A.; Huang, X.M. MODIS collection 5 global land cover: Algorithm refinements and characterization of new datasets. Remote Sens. Environ. 2010, 114, 168–182. [Google Scholar] [CrossRef]
  32. Liang, S. Quantitative Remote Sensing of Land Surfaces; John Wiley and Sons: New York, NY, USA, 2005. [Google Scholar]
  33. Wan, Z. Modis Land Surface Temperature Products Users’ Guide; Institute for Computational Earth System Science (ICESS), University of California: Santa Barbara, CA, USA, 2006. [Google Scholar]
  34. Prata, A. A new long-wave formula for estimating downward clear-sky radiation at the surface. Q. J. R. Meteorol. Soc. 1996, 122, 1127–1151. [Google Scholar] [CrossRef]
  35. Menzel, W.; Seemann, S.; Li, J.; Gumley, L. Modis Atmospheric Profile Retrieval Algorithm Theoretical Basis Document, Version 6, Reference Number: Atbd-mod-07. 2002. Available online: MODIS.gsfc.nasa. gov/data/atbd/atbd_mod07.pdf (accessed on 12 April 2014). [Google Scholar]
  36. Li, J.; Wolf, W.W.; Menzel, W.P.; Zhang, W.; Huang, H.-L.; Achtor, T.H. Global soundings of the atmosphere from ATOVS measurements: The algorithm and validation. J. Appl. Meteorol. 2000, 39, 1248–1268. [Google Scholar] [CrossRef]
  37. Tang, B.; Li, Z.L. Estimation of instantaneous net surface longwave radiation from MODIS cloud-free data. Remote Sens. Environ. 2008, 112, 3482–3492. [Google Scholar] [CrossRef]
  38. Sridhar, V.; Elliott, R.L. On the development of a simple downwelling longwave radiation scheme. Agric. For. Meteorol. 2002, 112, 237–243. [Google Scholar] [CrossRef]
  39. Choi, M.H.; Jacobs, J.M.; Kustas, W.P. Assessment of clear and cloudy sky parameterizations for daily downwelling longwave radiation over different land surfaces in Florida, USA. Geophys. Res. Lett. 2008, 35. [Google Scholar] [CrossRef]
  40. Crawford, T.M.; Duchon, C.E. An improved parameterization for estimating effective atmospheric emissivity for use in calculating daytime downwelling longwave radiation. J. Appl. Meteorol. 1999, 38, 474–480. [Google Scholar] [CrossRef]
  41. Duarte, H.F.; Dias, N.L.; Maggiotto, S.R. Assessing daytime downward longwave radiation estimates for clear and cloudy skies in southern brazil. Agric. For. Meteorol. 2006, 139, 171–181. [Google Scholar] [CrossRef]
  42. Kratz, D.P.; Gupta, S.K.; Wilber, A.C.; Sothcott, V.E. Validation of the Ceres Edition 2B surface-only flux algorithms. J. Appl. Meteorol. Climatol. 2010, 49, 164–180. [Google Scholar] [CrossRef]
  43. Harmel, R.D.; Smith, P.K. Consideration of measurement uncertainty in the evaluation of goodness-of-fit in hydrologic and water quality modeling. J. Hydrol. 2007, 337, 326–336. [Google Scholar] [CrossRef]
  44. Keenan, T.F.; Baker, I.; Barr, A.; Ciais, P.; Davis, K.; Dietze, M.; Dragon, D.; Gough, C.M.; Grant, R.; Hollinger, D.; et al. Terrestrial biosphere model performance for inter-annual variability of land-atmosphere CO2 exchange. Glob. Chang. Biol. 2012, 18, 1971–1987. [Google Scholar] [CrossRef]
  45. Moriasi, D.; Arnold, J.; van Liew, M.; Bingner, R.; Harmel, R.; Veith, T. Model evaluation guidelines for systematic quantification of accuracy in watershed simulations. Trans. Am. Soc. Agric. Biol. Eng. 2007, 50, 885–900. [Google Scholar]
  46. Michel, D.; Philipona, R.; Ruckstuhl, C.; Vogt, R.; Vuilleumier, L. Performance and uncertainty of cnr1 net radiometers during a one-year field comparison. J. Atmos. Ocean Technol. 2008, 25, 442–451. [Google Scholar] [CrossRef]
  47. Willmott, C.J. On the validation of models. Phys. Geogr. 1981, 2, 184–194. [Google Scholar]
  48. Samani, Z.A.; Tran, V.D.; Bleiwess, M.; Skaggs, R. Estimating daily and 24-hour net radiation for all sky conditions through remote sensing and climatic data. J. Irrig. Drain. Eng. 2013, 139, 208–213. [Google Scholar] [CrossRef]
  49. Peel, M.C.; Finlayson, B.L.; McMahon, T.A. Updated world map of the koppen-geiger climate classification. Hydrol. Earth Syst. Sci. 2007, 11, 1633–1644. [Google Scholar] [CrossRef]
  50. Cammalleri, C.; Anderson, M.C.; Kustas, A.P. Upscaling of evapotranspiration fluxes from instantaneous to daytime scales for thermal remote sensing applications. Hydrol. Earth Syst. Sci. 2014, 18, 1885–1894. [Google Scholar] [CrossRef] [Green Version]
  51. Kim, H.Y.; Liang, S.L. Development of a hybrid method for estimating land surface shortwave net radiation from MODIS data. Remote Sens. Environ. 2010, 114, 2393–2402. [Google Scholar] [CrossRef]
  52. Ryu, Y.; Baldocchi, D.D.; Black, T.A.; Detto, M.; Law, B.E.; Leuning, R.; Miyata, A.; Reichstein, M.; Vargas, R.; Ammann, C.; et al. On the temporal upscaling of evapotranspiration from instantaneous remote sensing measurements to 8-day mean daily-sums. Agric. For. Meteorol. 2012, 152, 212–222. [Google Scholar] [CrossRef] [Green Version]
  53. De Miguel, A.; Bilbao, J. Surface heat turbulent fluxes: Comparison of bowen ratio and aerodynamic techniques. WIT Trans. Ecol. Environ. 1997, 19. [Google Scholar] [CrossRef]
  54. De Miguel, A.; Bilbao, J. Ozone dry deposition and resistances onto green grassland in summer in central spain. J. Atmos. Chem. 1999, 34, 321–338. [Google Scholar] [CrossRef]
  55. Kaminsky, K.Z.; Dubayah, R. Estimation of surface net radiation in the boreal forest and northern prairie from shortwave flux measurements. J. Geophys. Res. Atmos. 1997, 102, 29707–29716. [Google Scholar] [CrossRef]
  56. Kustas, W.P.; Pinker, R.T.; Schmugge, T.J.; Humes, K.S. Daytime net-radiation estimated for a semiarid rangeland basin from remotely-sensed data. Agric. For. Meteorol. 1994, 71, 337–357. [Google Scholar] [CrossRef]
  57. Kobayashi, H.; Dye, D.G. Atmospheric conditions for monitoring the long-terrn vegetation dynamics in the amazon using normalized difference vegetation index. Remote Sens. Environ. 2005, 97, 519–525. [Google Scholar] [CrossRef]
  58. Mildrexler, D.J.; Zhao, M.; Running, S.W. A global comparison between station air temperatures and MODIS land surface temperatures reveals the cooling role of forests. J. Geophys. Res. 2011, 116, G03025. [Google Scholar] [CrossRef]
  59. Ratnam, M.V.; Santhi, Y.D.; Rajeevan, M.; Rao, S.V.B. Diurnal variability of stability indices observed using radiosonde observations over a tropical station: Comparison with microwave radiometer measurements. Atmos. Res. 2013, 124, L07812. [Google Scholar] [CrossRef]
  60. Zhang, Y.; Rossow, W.B.; Stackhouse, P.W. Comparison of different global information sources used in surface radiative flux calculation: Radiative properties of the surface. J. Geophys. Res. 2007, 112, D01102. [Google Scholar] [CrossRef]
  61. Stroeve, J.; Box, J.E.; Gao, F.; Liang, S.; Nolin, A.; Schaaf, C. Accuracy assessment of the MODIS 16-day albedo product for snow: Comparisons with greenland in situ measurements. Remote Sens. Environ. 2005, 94, 46–60. [Google Scholar] [CrossRef]
  62. Hulley, G.; Veraverbeke, S.; Hook, S. Thermal-based techniques for land cover change detection using a new dynamic MODIS multispectral emissivity product (MOD21). Remote Sens. Environ. 2014, 140, 755–765. [Google Scholar] [CrossRef]
Figure 1. Location of the FLUXNET and Surface Radiation budget network (SURFRAD) sites used in this study.
Remotesensing 08 00739 g001
Figure 2. Agreement between instantaneous MODIS and measured net-radiation at satellite overpass time. Temperate-C denotes Temperate-Continental. The numbers atop the bars in the upper panel show the number of sites in each of the six climate types.
Remotesensing 08 00739 g002
Figure 3. Comparison between MODIS and measured instantaneous net-radiation at Terra overpass time in six different climate types. MAE denotes mean absolute error estimate in W∙m−2.
Remotesensing 08 00739 g003
Figure 4. Agreement between daytime (sunrise to sunset, eight-day time scale) MODIS and measured net-radiation in six different climate types. Temperate-C denotes Temperate-Continental. Number of field sites are shown atop the bars in the upper panel.
Remotesensing 08 00739 g004
Figure 5. Comparison between daytime MODIS and measured net-radiation in six different climate types. MAE denotes mean absolute error in W·m−2.
Remotesensing 08 00739 g005
Figure 6. Comparison of monthly CERES net-radiation with measurements. Only CERES cells that had three or more towers sites within their boundaries were included.
Remotesensing 08 00739 g006
Figure 7. Relationship between mean annual daytime (sunrise to sunset) net-radiation and daily (24-h) net-radiation from measurements.
Remotesensing 08 00739 g007
Figure 8. Mean daily (24-h) global net-radiation from MODIS.
Remotesensing 08 00739 g008
Figure 9. Comparison of MODIS net-radiation with corresponding estimates from CERES: (left) the difference between mean daily net-radiation from MODIS and CERES; and (right) (Hovmoller diagram) the monthly latitudinal distribution of difference between mean net-radiation from MODIS and CERES.
Remotesensing 08 00739 g009
Figure 10. Comparison between the four components of net-radiation from MODIS and corresponding measurements at Terra overpass time at 38 temperate-continental sites. Note that the Y-axis scales are different in different subplots.
Remotesensing 08 00739 g010
Figure 11. Comparison between the four components of net-radiation from MODIS and corresponding measurements at Terra overpass time at 7 tropical sites. Note that the Y-axis scales are different in different subplots.
Remotesensing 08 00739 g011
Table 1. Different data products used in calculating the four components of net-radiation in clear and cloudy days.
Component of Net-RadiationData Products Used in Calculation
Downwelling shortwaveCloud optical thickness, cloud top altitude, and solar zenith angle from the MODIS cloud product (MOD06, 5 km, daily)
Aerosol optical thickness at 550 nm from the aerosol product (MOD04, 10 km, daily)
Radiative transfer model
Upwelling shortwaveFor clear days, shortwave albedo from the MODIS albedo product (MCD43B, 500 m, eight-day)
Ratio of direct and diffuse radiation from a look-up table
For cloudy days, albedo based on land cover
Land cover from the MODIS land surface dynamics product (MCD12, 500 m, yearly)
Downwelling longwaveAtmospheric profile from MOD07 for clear days
Estimation of the emissivity of near surface atmosphere from temperature and moisture
For cloudy days near surface temperature and humidity from NCEP
Upwelling longwaveLand surface temperature for clear days from MOD11
Estimates of broadband emissivity from the emissivity in Band 31 (10.78–11.28 μm) and 32 (11.77–12.27 μm) from MOD11
For cloudy days, emissivity based on land cover and temperature from NCEP
Spatial averaging to fill gaps

