Article

Diel and Spatial Dependence of Humpback Song and Non-Song Vocalizations in Fish Spawning Ground

Department of Electrical and Computer Engineering, Northeastern University, 360 Huntington Ave., Boston, MA 02115, USA
*
Author to whom correspondence should be addressed.
Remote Sens. 2016, 8(9), 712; https://doi.org/10.3390/rs8090712
Submission received: 10 June 2016 / Revised: 9 August 2016 / Accepted: 23 August 2016 / Published: 30 August 2016
(This article belongs to the Special Issue Underwater Acoustic Remote Sensing)

Abstract

:
The vocalization behavior of humpback whales was monitored over vast areas of the Gulf of Maine using the passive ocean acoustic waveguide remote sensing technique (POAWRS) over multiple diel cycles in Fall 2006. The humpback vocalizations comprised of both song and non-song are analyzed. The song vocalizations, composed of highly structured and repeatable set of phrases, are characterized by inter-pulse intervals of 3.5 ± 1.8 s. Songs were detected throughout the diel cycle, occuring roughly 40% during the day and 60% during the night. The humpback non-song vocalizations, dominated by shorter duration (≤3 s) downsweep and bow-shaped moans, as well as a small fraction of longer duration (∼5 s) cries, have significantly larger mean and more variable inter-pulse intervals of 14.2 ± 11 s. The non-song vocalizations were detected at night with negligible detections during the day, implying they probably function as nighttime communication signals. The humpback song and non-song vocalizations are separately localized using the moving array triangulation and array invariant techniques. The humpback song and non-song moan calls are both consistently localized to a dense area on northeastern Georges Bank and a less dense region extended from Franklin Basin to the Great South Channel. Humpback cries occur exclusively on northeastern Georges Bank and during nights with coincident dense Atlantic herring shoaling populations, implying the cries are feeding-related.

Graphical Abstract

1. Introduction

The diel vocalization behavior of Northwestern Atlantic humpback whales (Megaptera Novaeangliae) was monitored over vast areas of the Gulf of Maine using the passive ocean acoustic waveguide remote sensing (POAWRS) technique [1,2,3] from 19 September to 6 October 2006. Humpback vocalizations were measured using a large-aperture densely-sampled coherent hydrophone array system at a rate of approximately 1800 ± 1100 calls per day occurring in the 100–1000 Hz frequency range. The coherent hydrophone array provides orders of magnitude higher array gain [4] than a single sensor, enabling whale vocalizations to be detected, localized and classified over an approximately 100,000 km 2 region instantaneously by POAWRS (see POAWRS detection region for whale vocalizations in Figure 3a of [1]).
Here we provide representative beamformed spectrograms of the detected humpback song and non-song vocalization sequences, and quantify the temporal-spectral characteristics that distinguish them. Humpback song sequences are identified as those composed of repeatable themes or patterned set of phrases [2,5,6,7,8], where each phrase is composed of units with distinctive time-frequency characteristics. Song sequences were detected every day, during both daytime (roughly 06:00 EDT to 18:00 EDT) and nighttime (roughly 18:00 EDT to 06:00 EDT the next day). Calls and call sequences without a repeatable theme or patterned set of phrases were categorized as non-song. The non-song vocalizations detected were dominated by short duration downsweep (1–2 s) and bow-shaped (∼3 s) moans, as well as a small fraction of longer duration (∼5 s) cries [2]. The non-song calls were detected during nighttime hours with negligible detections during the day. Here we provide the histogram of inter-pulse intervals separately for contiguous humpback song and non-song vocalization sequences. We quantify the means and standard deviations of the humpback song and non-song inter-pulse interval histograms and show they are significantly different.
The vocalization rate spatial distributions of the detected humpback song, non-song moan and cry vocalizations are provided separately. The humpback song and non-song vocalization sequences are localized from their measured bearing versus time trajectories by employing the moving array triangulation [2,9,10] and the array invariant [2,9,10,11] techniques. The humpback song and non-song vocalization rate spatial distributions are overlain with the spatial distribution of their fish prey, the Atlantic herring. The fish distributions were instantaneously and simultaneously acquired over tens of thousands of square kilometer areas by ocean acoustic waveguide imaging (OAWRS) [12,13,14,15], combined with conventional fisheries ultrasonic echosounding [16] and fish trawl sampling [17] to obtain thousands of calibrations at statistically significant locations [13]. Here we examine the temporospatial correlation between the humpback song, non-song moan and cry vocalizations with the fish areal population densities. These results are used to infer potential functions of the non-song moan and cry vocalizations for humpback whales in the spawning ground of their fish prey.
Previous work in passive marine mammal acoustics have focused on identifying the time-frequency characteristics and function of call types from various marine mammal species, quantifying overall diel or day/night vocalization rates and infering marine mammal behaviors. For humpback whales, their song vocalizations have been extensively monitored, studied and compared for several different ocean regions [5,6,7,8,18,19,20,21]. Male humpbacks vocalize songs as breeding displays in their mating grounds, and have been observed to carry the tunes into their feeding grounds. Humpback non-song vocalization types have also been characterized and examined in several different ocean regions and in several different contexts. They include social sounds either vocalized or generated via surface activities, signals for coordinated movement during feeding and migration, as well as nighttime communication [1,2,21,22,23,24,25,26,27,28,29,30].
The ability to observe predator behavior and distributions with respect to changing prey field distributions is essential for advancing our understanding of ecosystem processes [31,32,33]. Here we provide further analysis of the humpback vocalization data from the Gulf of Maine 2006 Experiment described in [1,2] where concurrent measurements of their fish prey distribution over thousands of square kilometer areas are uniquely available. Wang et al. [1] and Gong et al. [2] examined overall diel-dependent vocalization rates of humpback whales and their correlation to the diel-dependent Atlantic herring shoaling areal population densities. Here we examine the diel progression and relative occurrence of the different types of humpback vocalizations that include both song and various non-song (Figure 1). We correlate the temporospatial distribution of the different humpback vocalization types individually to the fish distribution in order to further elucidate their vocalization behaviors in a major fish spawning region of the Gulf of Maine.

2. Materials and Methods

2.1. The Gulf of Maine 2006 Experiment Data Collection

The Gulf of Maine is an important North Atlantic marine mammal foraging ground which contains a number of significant spawning areas for various fish species [34,35,36,37], including the Atlantic herring (Clupea harengus) [38,39,40]. The herring comprise a keystone prey species, common in the diets of many marine mammals, piscivorous fish and seabirds of the region [38,41]. The spawning activity of Atlantic herring on the northern flank of Georges Bank during the Fall season each year has been observed and recorded [16,17,38,39,42] by the US National Marine Fisheries Services (NMFS) for over 30 years, coinciding their annual survey of the Georges Bank herring stock with this period each year.
The Gulf of Maine 2006 Experiment [1,2,9,12,13,15,43,44] was conducted from 19 September to 6 October in 2006 by a collaborative team from the Massachusetts Institute of Technology, Northeastern University, Penn State University and the Woodshole Oceanographic Institution in the US, and the Institute of Marine Research in Bergen, Norway, in conjunction with the US NMFS annual Atlantic herring acoustic survey of the Gulf of Maine and Georges Bank.
Acoustic recordings of whale vocalizations were acquired using a large-aperture densely-sampled coherent hydrophone array towed by a research vessel along designated tracks in Franklin Basin, north of Georges Bank [2]. The multiple nested sub-apertures of the array contain a total of 160 hydrophones spanning a frequency range from below 50 Hz to 3750 Hz for spatially unaliased sensing. A fixed sampling frequency of 8000 Hz was used so that acoustic signals with frequency contents up to 4000 Hz were recorded without temporal aliasing. Two linear sub-apertures of the array, the low-frequency (LF) sub-aperture and the mid-frequency (MF) sub-aperture, each of which consists of 64 equally spaced hydrophones with inter-element spacing of 1.5 m and 0.75 m respectively, were used to analyse whale calls with fundamental frequency content below 1000 Hz. The angular resolution or equivalent beamwidth β ( ϕ , f c ) of the horizontal receiver array is β ( ϕ , f c ) = 1 . 44 ( λ / L cos ϕ ) for broadside ( ϕ = 0 ) through angles near endfire ( ϕ = π / 2 ) , where λ = c / f c is the acoustic wavelength, c is the sound speed, f c is the center frequency, and L is the array aperture length [2,13]. At endfire, the angular resolution is β ( ϕ , f c ) 2 . 8 λ / L [45]. The angular resolution of the receiver array is tabulated in Table 1 of [13] for selected frequencies. Note that the equivalent beamwidth is the angular width of a rectangular or uniform function that has the same receptivity as the array integrated over all azimuths. The water depth ranged from 180 to 250 m at the array locations and the array tow depth was roughly 105 m. Physical oceanography was monitored by sampling water-column temperature and salinity with expendable bathythermographs (XBTs) and conductivity-temperature-depth (CTD) sensors at regular hourly intervals. The water-column sound speed profile was found to be relatively constant in space and time over the experimental duration, as shown by the compilation of over roughly 200 samples taken during the experiment in Figure 3 of [13].
Acoustic pressure time series measured by sensors across the receiver array were converted to two-dimensional beam-time series by beamforming [46]. A total of 64 beams were formed spanning 360 degree horizontal azimuth about the receiver array. Each beam-time series was converted to a beamformed spectrogram by short-time Fourier transform (sampling frequency = 8000 Hz, frame = 526 samples, overlap = 1/2, Hann window). Continuous tonal noises were attenuated by normalizing the spectrogram in each frequency band with the long-time averaged mean spectral level within that band. Whale vocalizations were detected using a peak detector with 5.6 dB detection threshold and verified by visual inspection. The detection of long-range propagated biological sounds is significantly enhanced by spatial beamforming and spectrogram analysis which filters background noise that is outside of the whale vocalization beam and frequency band [2,3]. The high gain [4,46] of the densely-sampled large aperture coherent POAWRS receiver array used here, up to 10 log 10 n = 18 dB gain where n = 64 hydrophones for each sub-aperture, enabled detection of whale vocalizations either two orders of magnitude more distant in range or lower in SNR than a single hydrophone which has no array gain (see Extended Data Figure 1 of [1] and Figure 13 of [2]).
The POAWRS receiver array detected vocalizations from a variety of baleen and toothed whale species during the Gulf of Maine 2006 Experiment in the frequency range from 10 Hz up to 4 kHz [1]. They include vocalizations from fin, sei, minke, humpback, blue, sperm, pilot, killer whales, and a variety of other delphinid species [1]. Here we focus our analysis on humpback whale vocalizations largely occurring in the 100 to 1000 Hz frequency range. Negligible humpback vocalizations were found outside this frequency range. The humpback vocalizations can be readily distinguished and segregated from the vocalizations of the other marine mammal species via their vocalization frequency range and unique bearing versus time trajectories (see Extended Data Figures 1–4 of [1] showing distinct vocalization frequency range and bearing versus time trajectories for various marine mammal species detected using POAWRS).

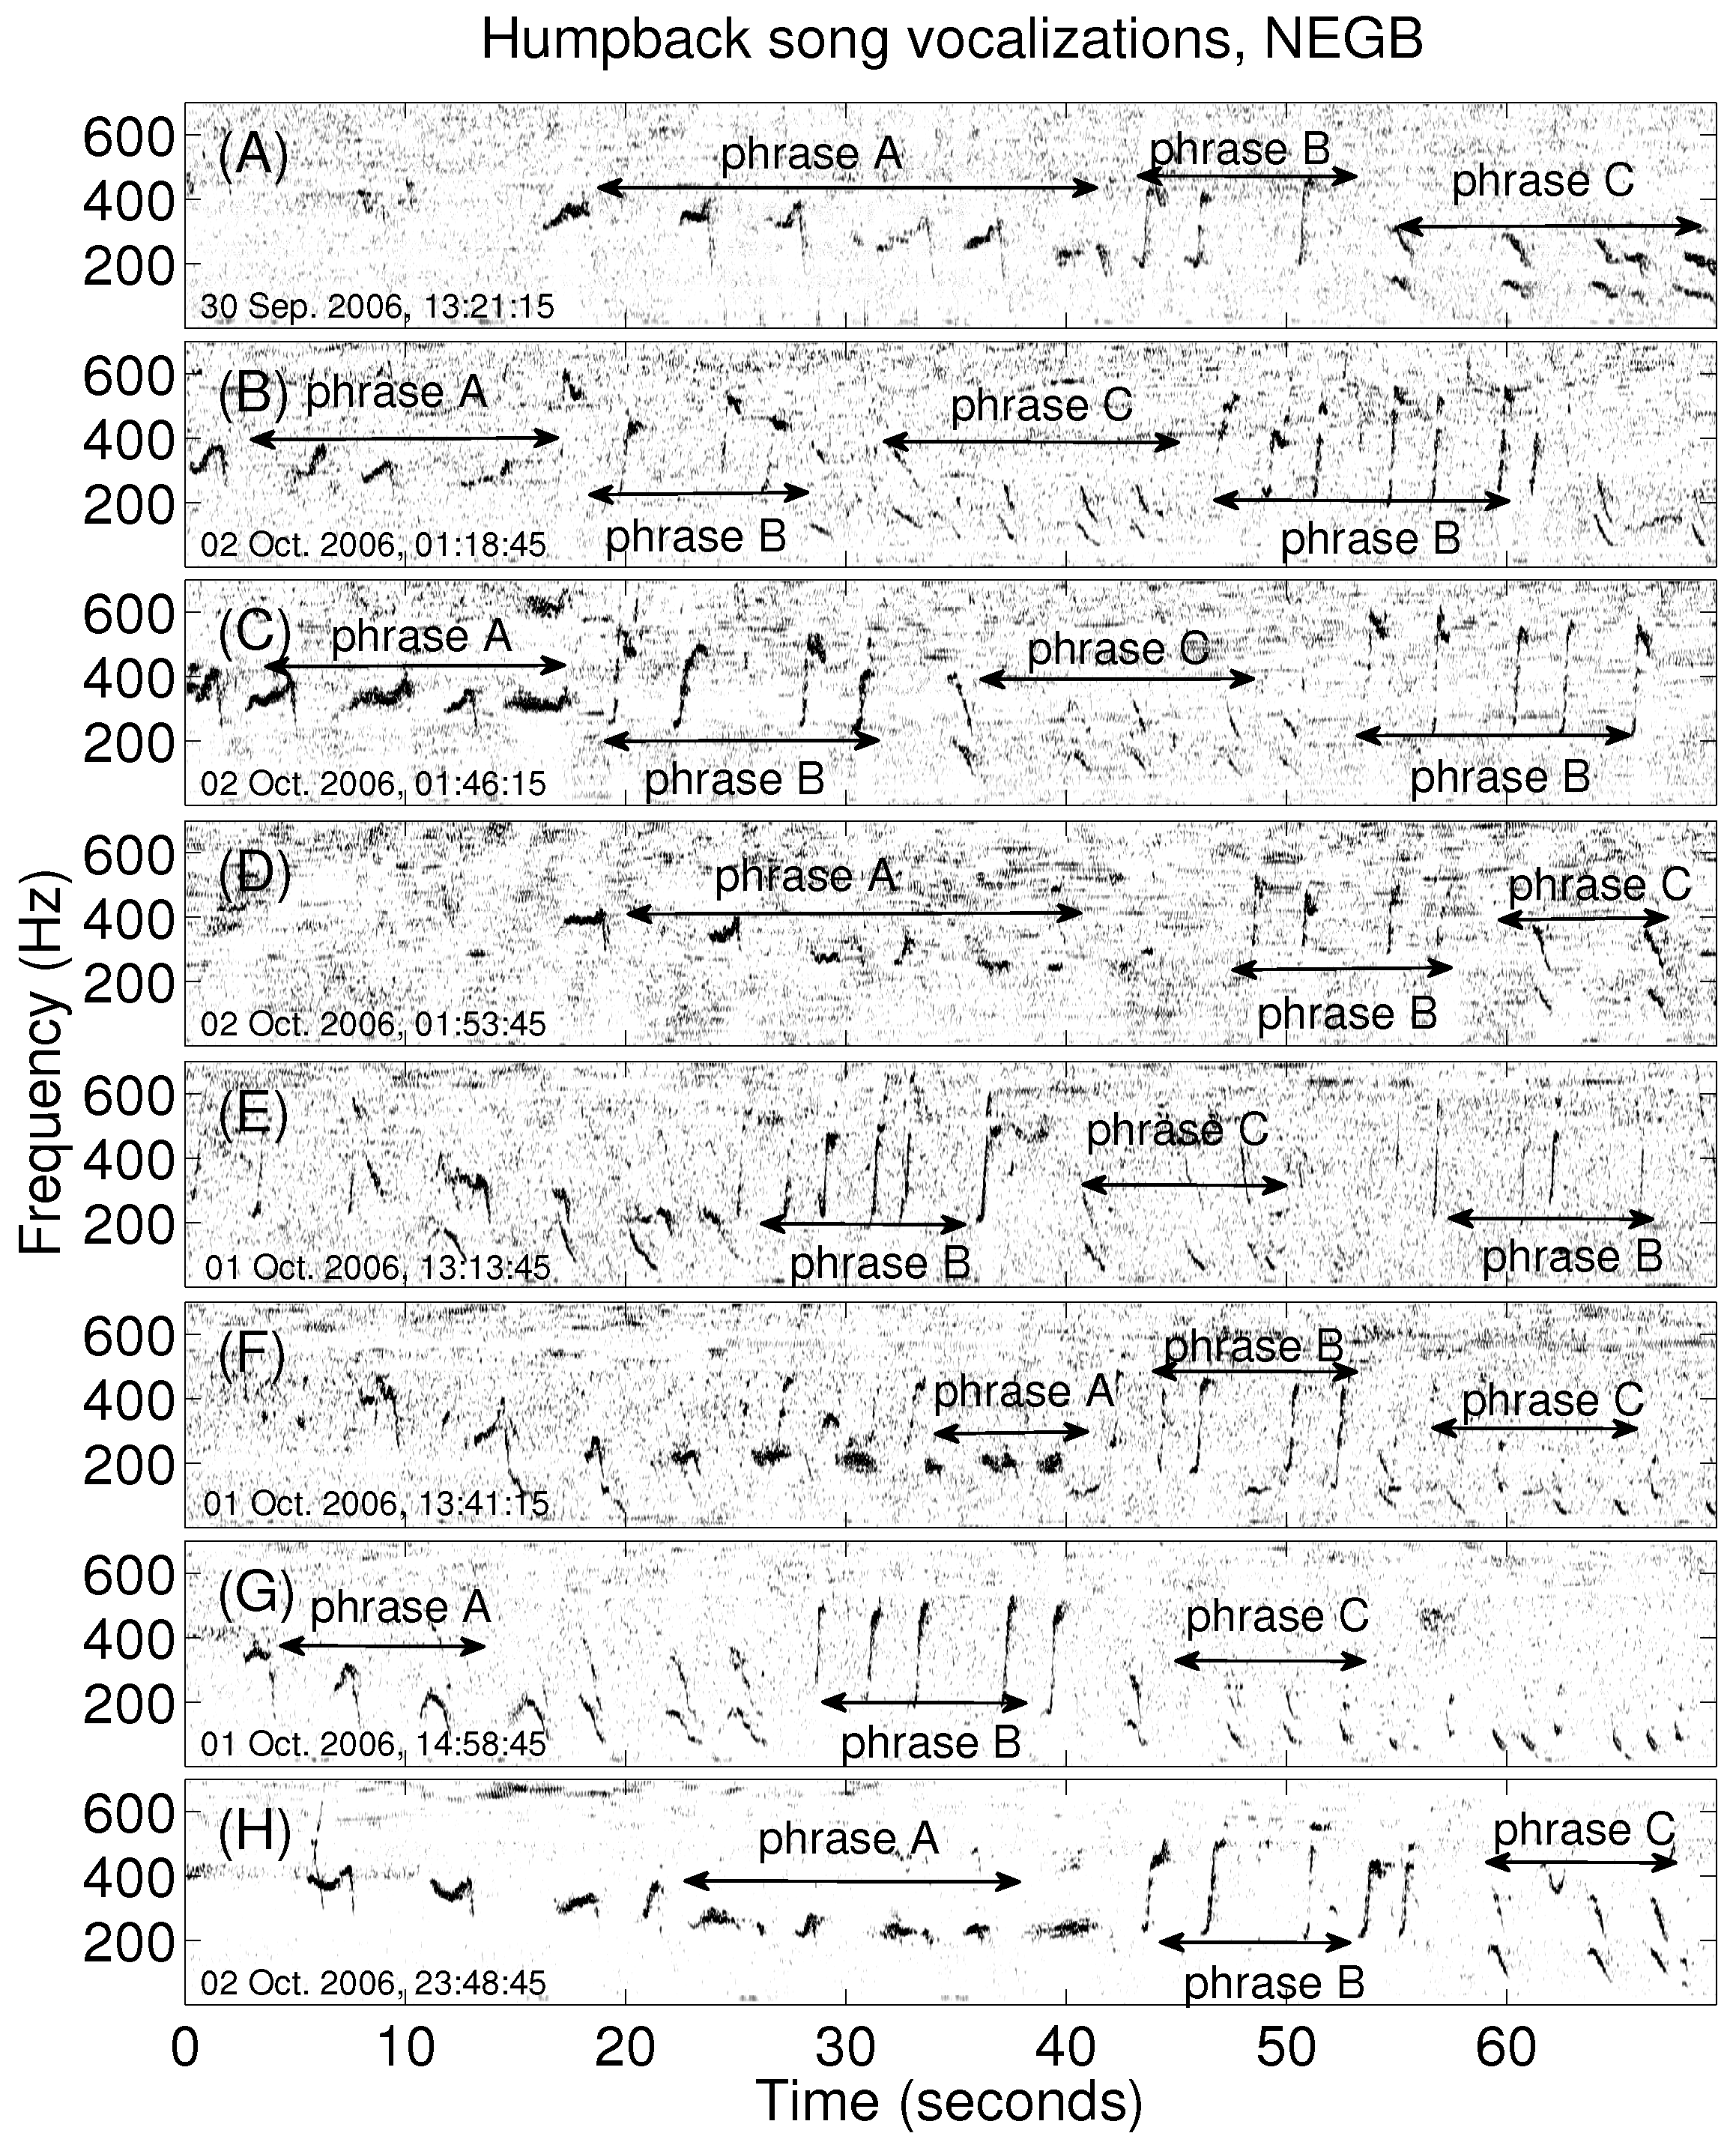
2.2. Analysis of Humpback Song and Non-Song Vocalizations

Humpback song sequences are identified as those composed of repeating themes that can be sub-divided into phrases and units (Figure 2 and Figure 3). A song session typically consisted of at least two themes and often lasted over tens of minutes, with gaps of silence not exceeding ten minutes between any two themes. Humpback vocalization sequences that did not meet the criteria for song were categorized as non-song (Figure 4). The non-song calls were dominated by downsweep moans (D-moans or “meow” calls of [2]) and bow-shaped moans (B-moans or “bow-shaped” calls of [2]), as well as a small fraction of cries. The inter-pulse intervals for calls within song and non-song sequences are calculated separately and plotted as histograms in Figure 5A.
Each humback non-song vocalization signal is next represented as a pitch track that describes the time-variation of the fundamental frequency in the signal [47,48]. The pitch track contains a time series t = ( t 1 , t 2 , . . . , t i ) , a frequency series f = ( f 1 , f 2 , . . . , f i ) , and an amplitude series A = ( A 1 , A 2 , . . . , A i ) , determined using a time-frequency peak detector from the beamformed spectrogram which is created from short time Fourier transforms of the audio data (sampling frequency = 8000 Hz, frame = 526 samples, overlap = 1/2, Hann window). The time and frequency variation for the ensemble of pitch tracks and the mean pitch-track are plotted and compared in Figure 6 for various non-song vocalizations. Since D-moans comprise the most frequent and abundant humpback vocalization type received during night time hours (Figure 5B), they have been further sub-classified (Figure 6A,B) using their pitch-tracks following the approach outlined in the Appendix.

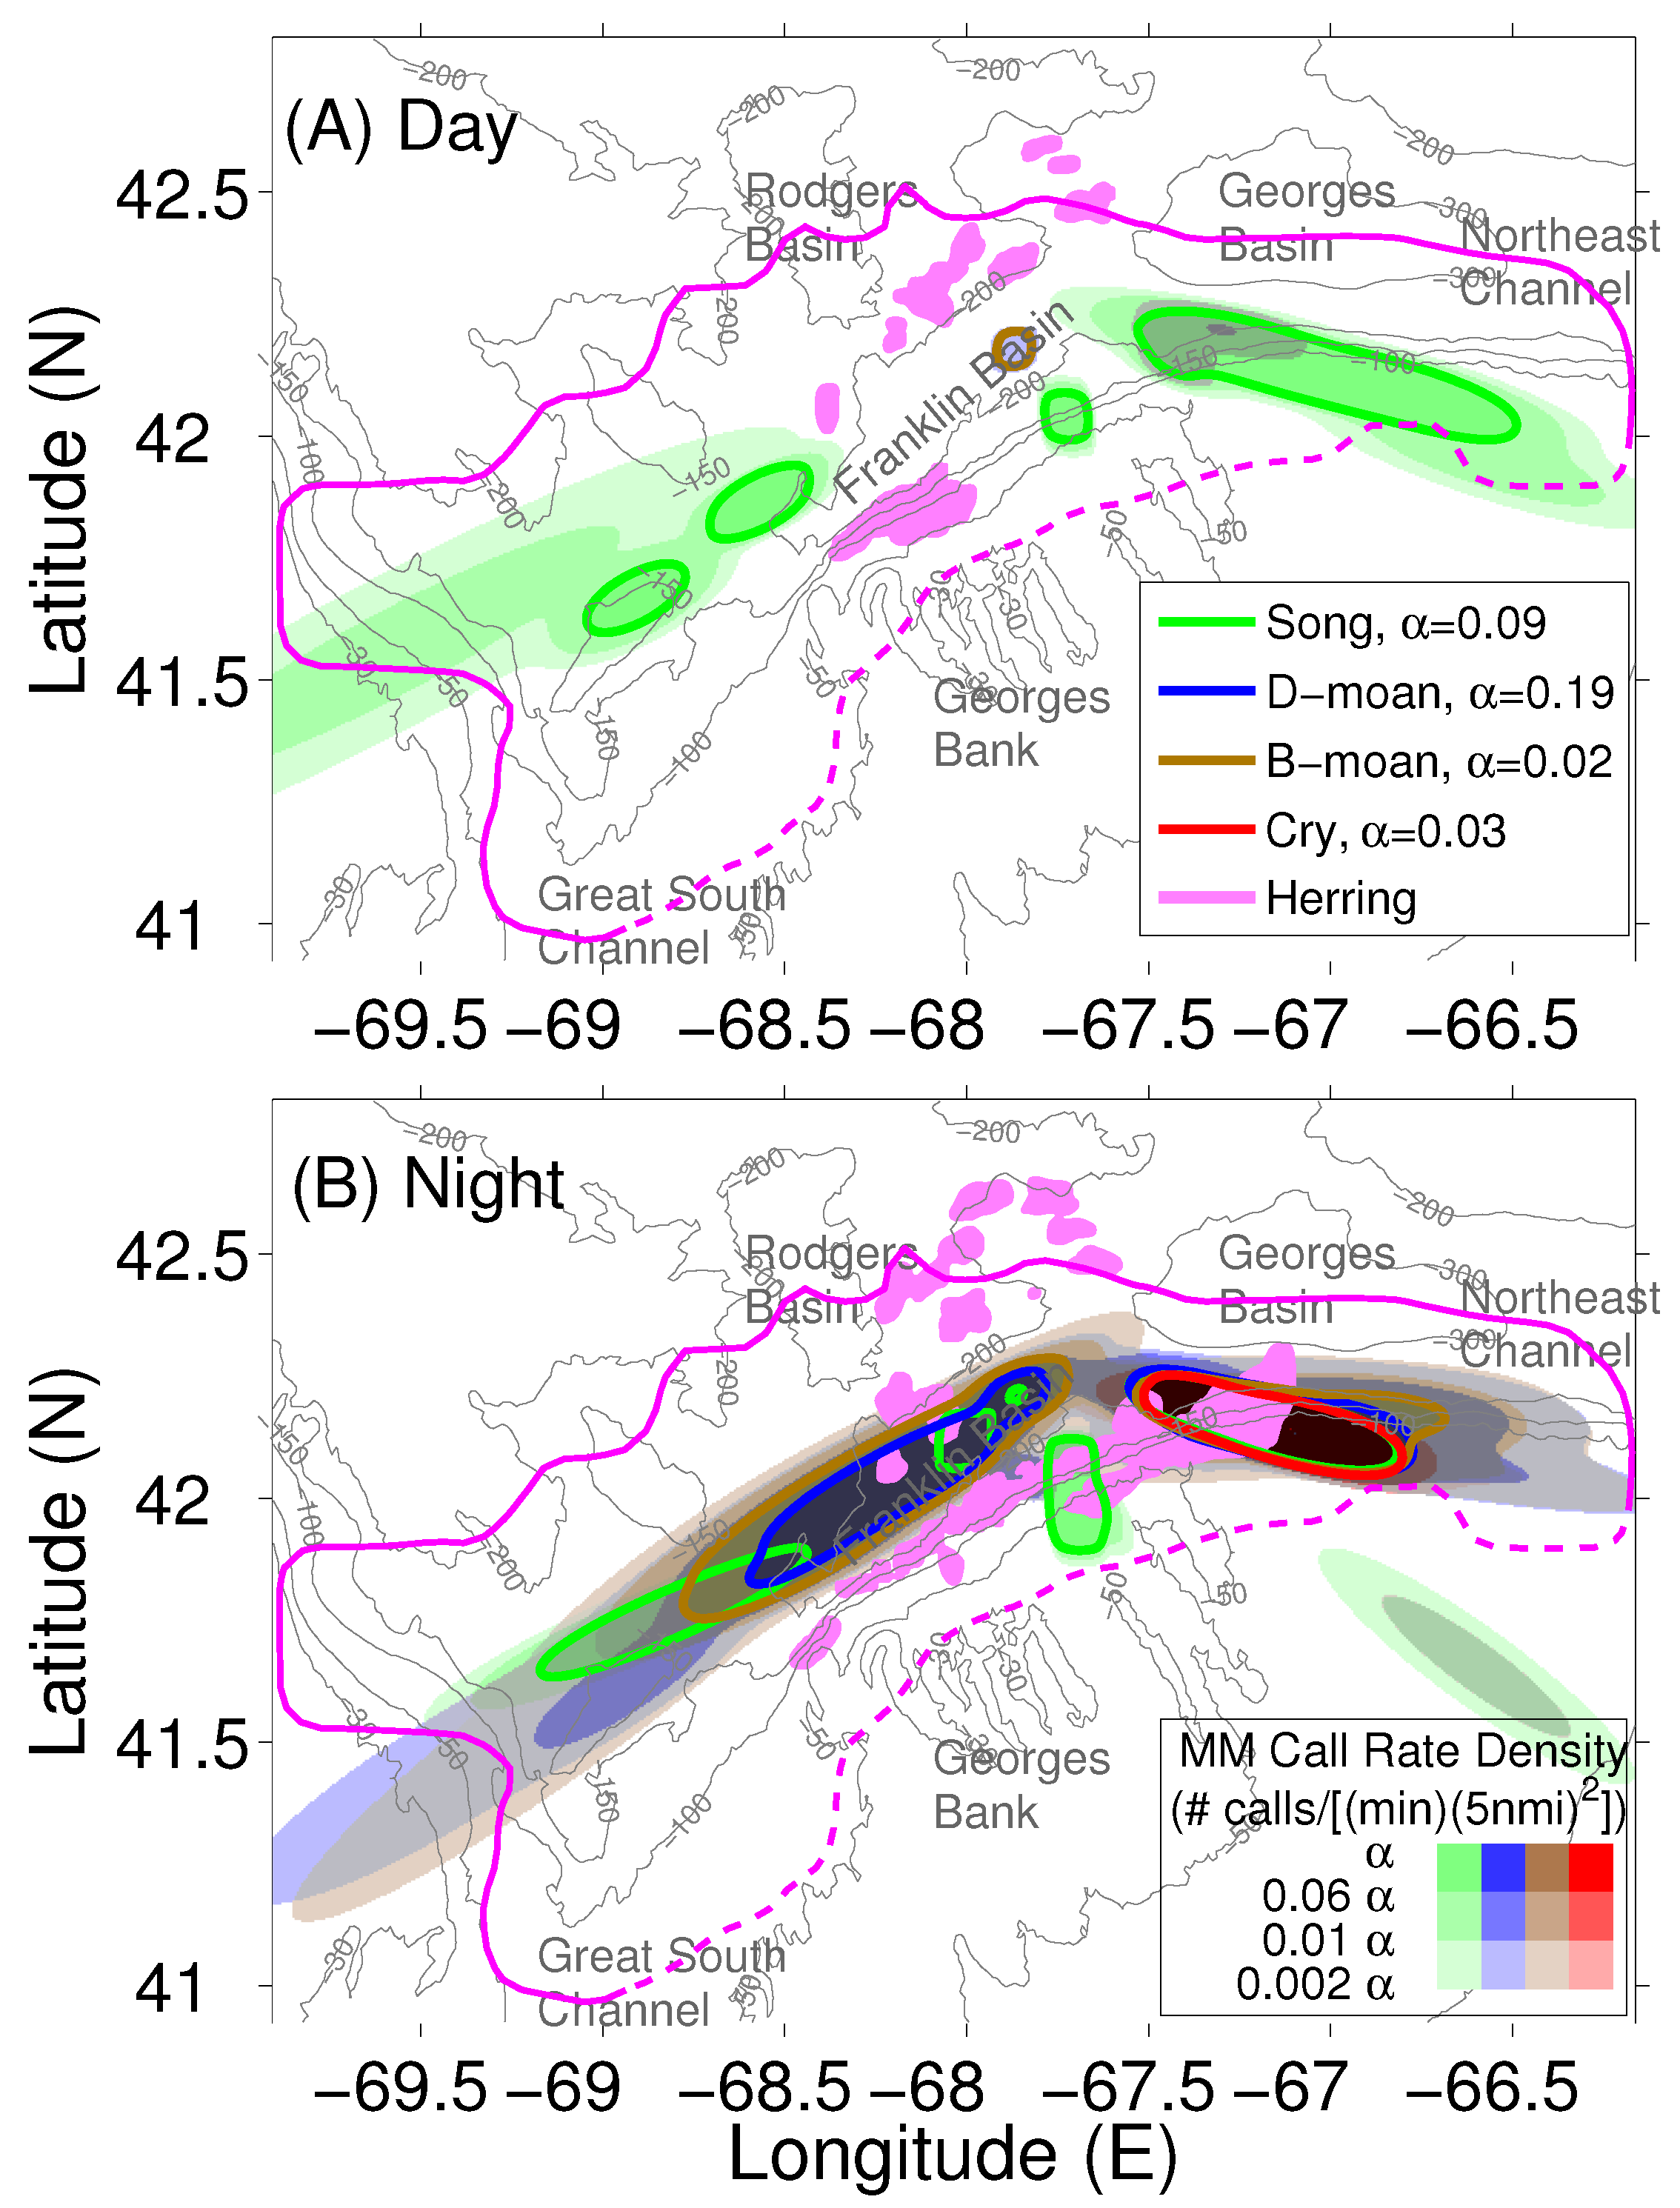
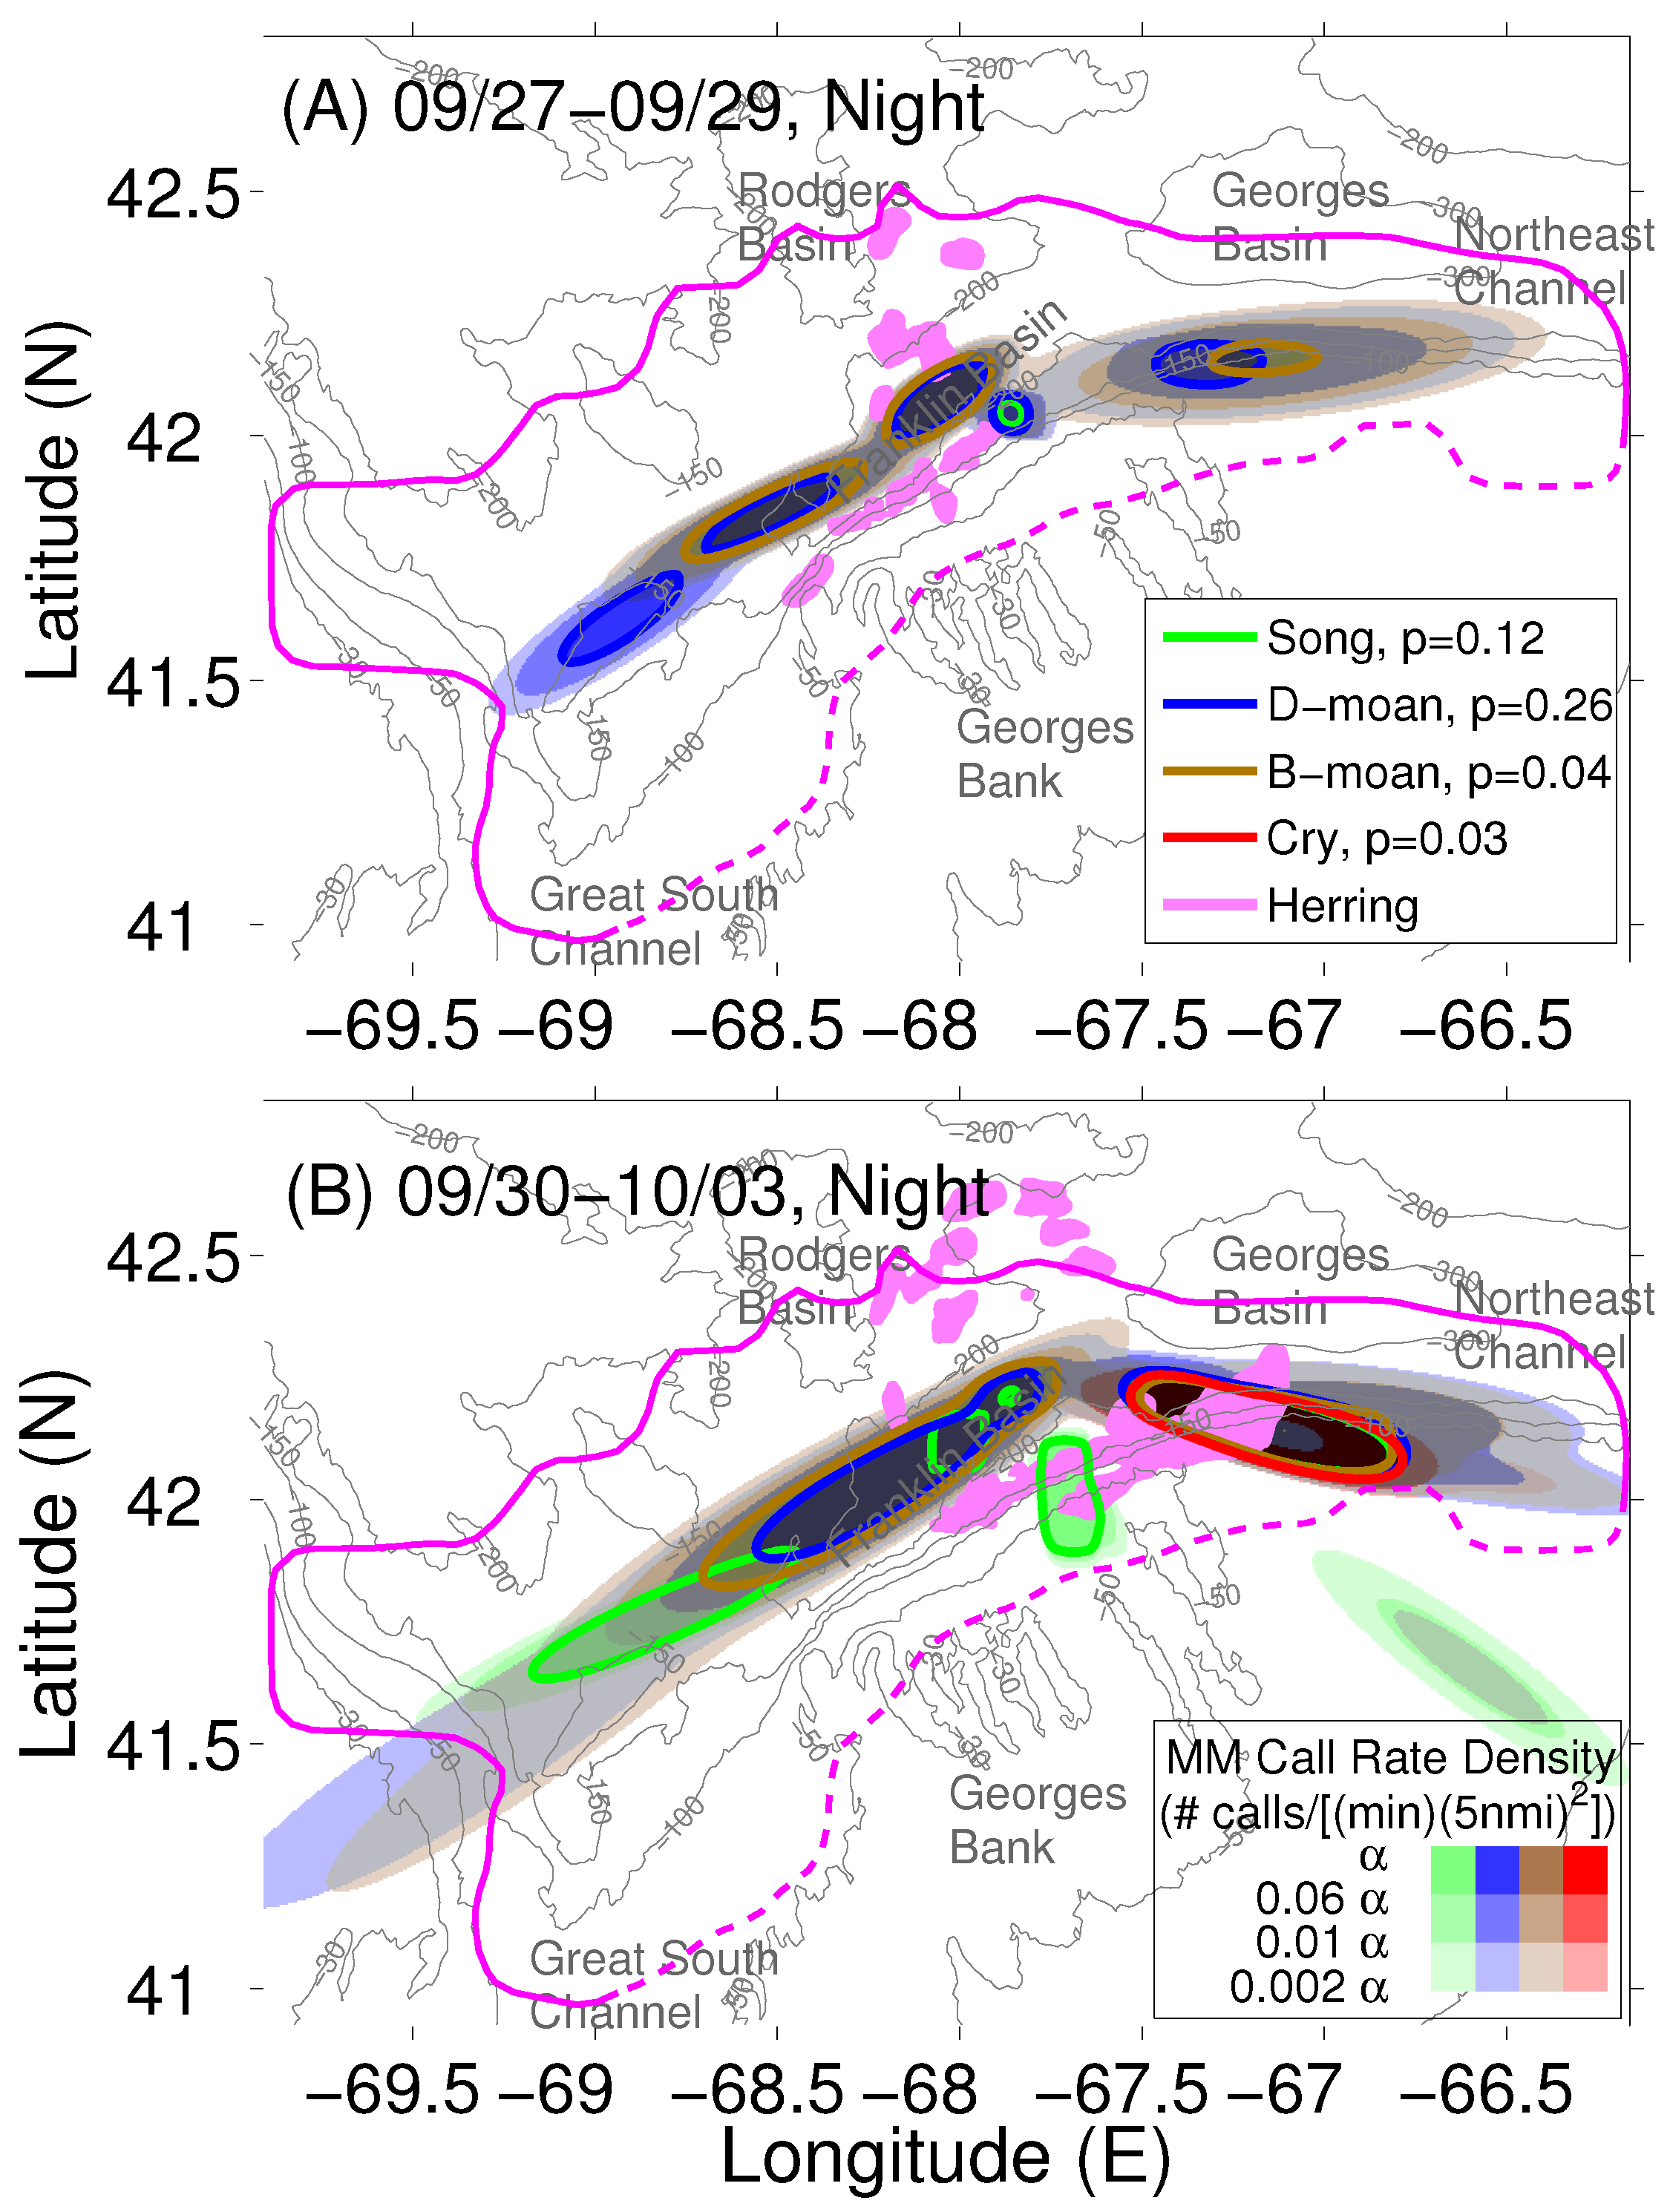
2.3. Localization and Call Rate Spatial Distributions of Humpback Song and Non-Song Vocalization Types

We provide the spatial distributions of the humpback song and non-song D-moan, B-moan and cry vocalizations separately in Figure 7 and Figure 8. The horizontal location of each marine mammal vocalization consists of range and bearing estimates. The moving array triangulation (MAT) [2,9,10] and the array invariant (AI) [2,9,10,11] methods are applied to determine the range of the vocalizations from the horizontal receiver array centre. Position estimation error, or the root mean squared (RMS) distance between the actual and estimated location, is a combination of range and bearing errors quantified for this array in [2,9,10,11]. Range estimation error, expressed as the percentage of the range from the source location to the horizontal receiver array centre, for the MAT technique is roughly 2% at array broadside and gradually increases to 10% at 65 from broadside and 25% at 90 from broadside, that is, near or at endfire [9]. Range estimation error for the AI method is roughly 4% to 8% over all azimuthal directions [2,9]. Bearing estimation error of the time domain beamformer is roughly 0.5 at broadside and gradually increases to 6.0 at endfire [9]. The bearing and range estimation errors of the AI and MAT techniques are determined at the same experimental site and time period as the marine mammal position estimates presented here. They are determined from thousands of controlled source signals transmitted by the same source array used to locate the herring shoals presented here and are based on absolute global positioning system (GPS) ground truth measurements of the source array’s position [9]. The GPS measurements of the source array’s position are accurate to within 3 m to 10 m. More than 80% of humpback vocalizations are found to be located between 0 to 65 from the broadside direction of the horizontal receiver array. Position estimation error [2,9] is less than 2 km for the majority of humpback call localizations shown in Figure 7 and Figure 8 since they are found within roughly 50 km of the horizontal receiver array centre. This error is over an order of magnitude smaller than the spatial scales of the humpback concentrations shown in Figure 7 and Figure 8, and consequently has negligible influence on the analyses and results.
The estimated locations for all humpback song and non-song vocalizations from 27 September to 3 October 2006 (see Figure 1) are used to generate the call rate density map for each vocalization type shown in Figure 7 and Figure 8 following the approach described in [1,2]. The location of each call is characterized by a 2D Gaussian probability density function with mean equal to the measured mean position from MAT or AI method and standard deviations determined by the measured range and bearing standard deviations. The humpback call rate density map for each call category is determined by superposition of the 2D spatial probability densities for the location of each call from that category, normalized by the total measurement time.

2.4. Atlantic Herring Areal Population Density Distribution

The Atlantic herring instantaneous areal population densities over wide areas shown in Figure 7 and Figure 8 were obtained from active OAWRS imaging after extensive calibration with tens of thousand instantaneous coincident conventional ultrasonic fisheries echosounding measurements [12,13,15] with fish species identification and physiological parameters extracted from trawl samples collected over the course of the experiment [16,49]. The Atlantic herring shoals were consistently observed to form when the population density reached a critical value of 0.2 fish per m 2 s [12]. Following simple physical theories [12], shoaling is a correlated behaviour that begins when the population is sufficiently dense. This critical density was also consistently found to be the boundary where the dense shoal ended and diffuse populations that did not engage in correlated behaviour began [12,13,15]. Populations within the dense shoals were variable from 0.2 to over 10 fish per m 2 . These shoals extended roughly 20–60 m vertically in water-column depths of 80–200 m. In contrast, the diffuse fish populations approximately 0.053 fish per m 2 were found close to (within 3–5 m of) the seafloor. The shoals formed near sunset and persisted until near sunrise, starting on the northern flank of Georges Bank and migrating southward to shallower waters on the bank. This diurnal behavioural pattern was consistently observed during our roughly two week measurement time period [12,13,15]. More detailed herring areal population density distribution from our experiment is shown in Extended Data Figure 6 of [1].

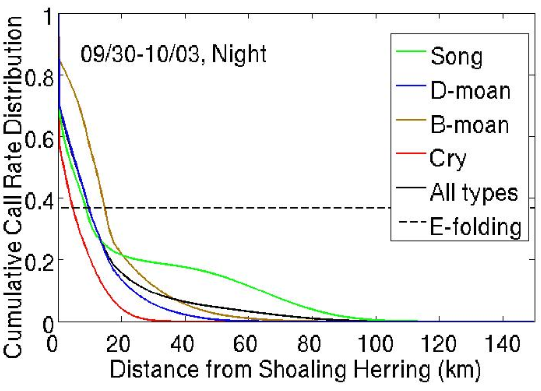
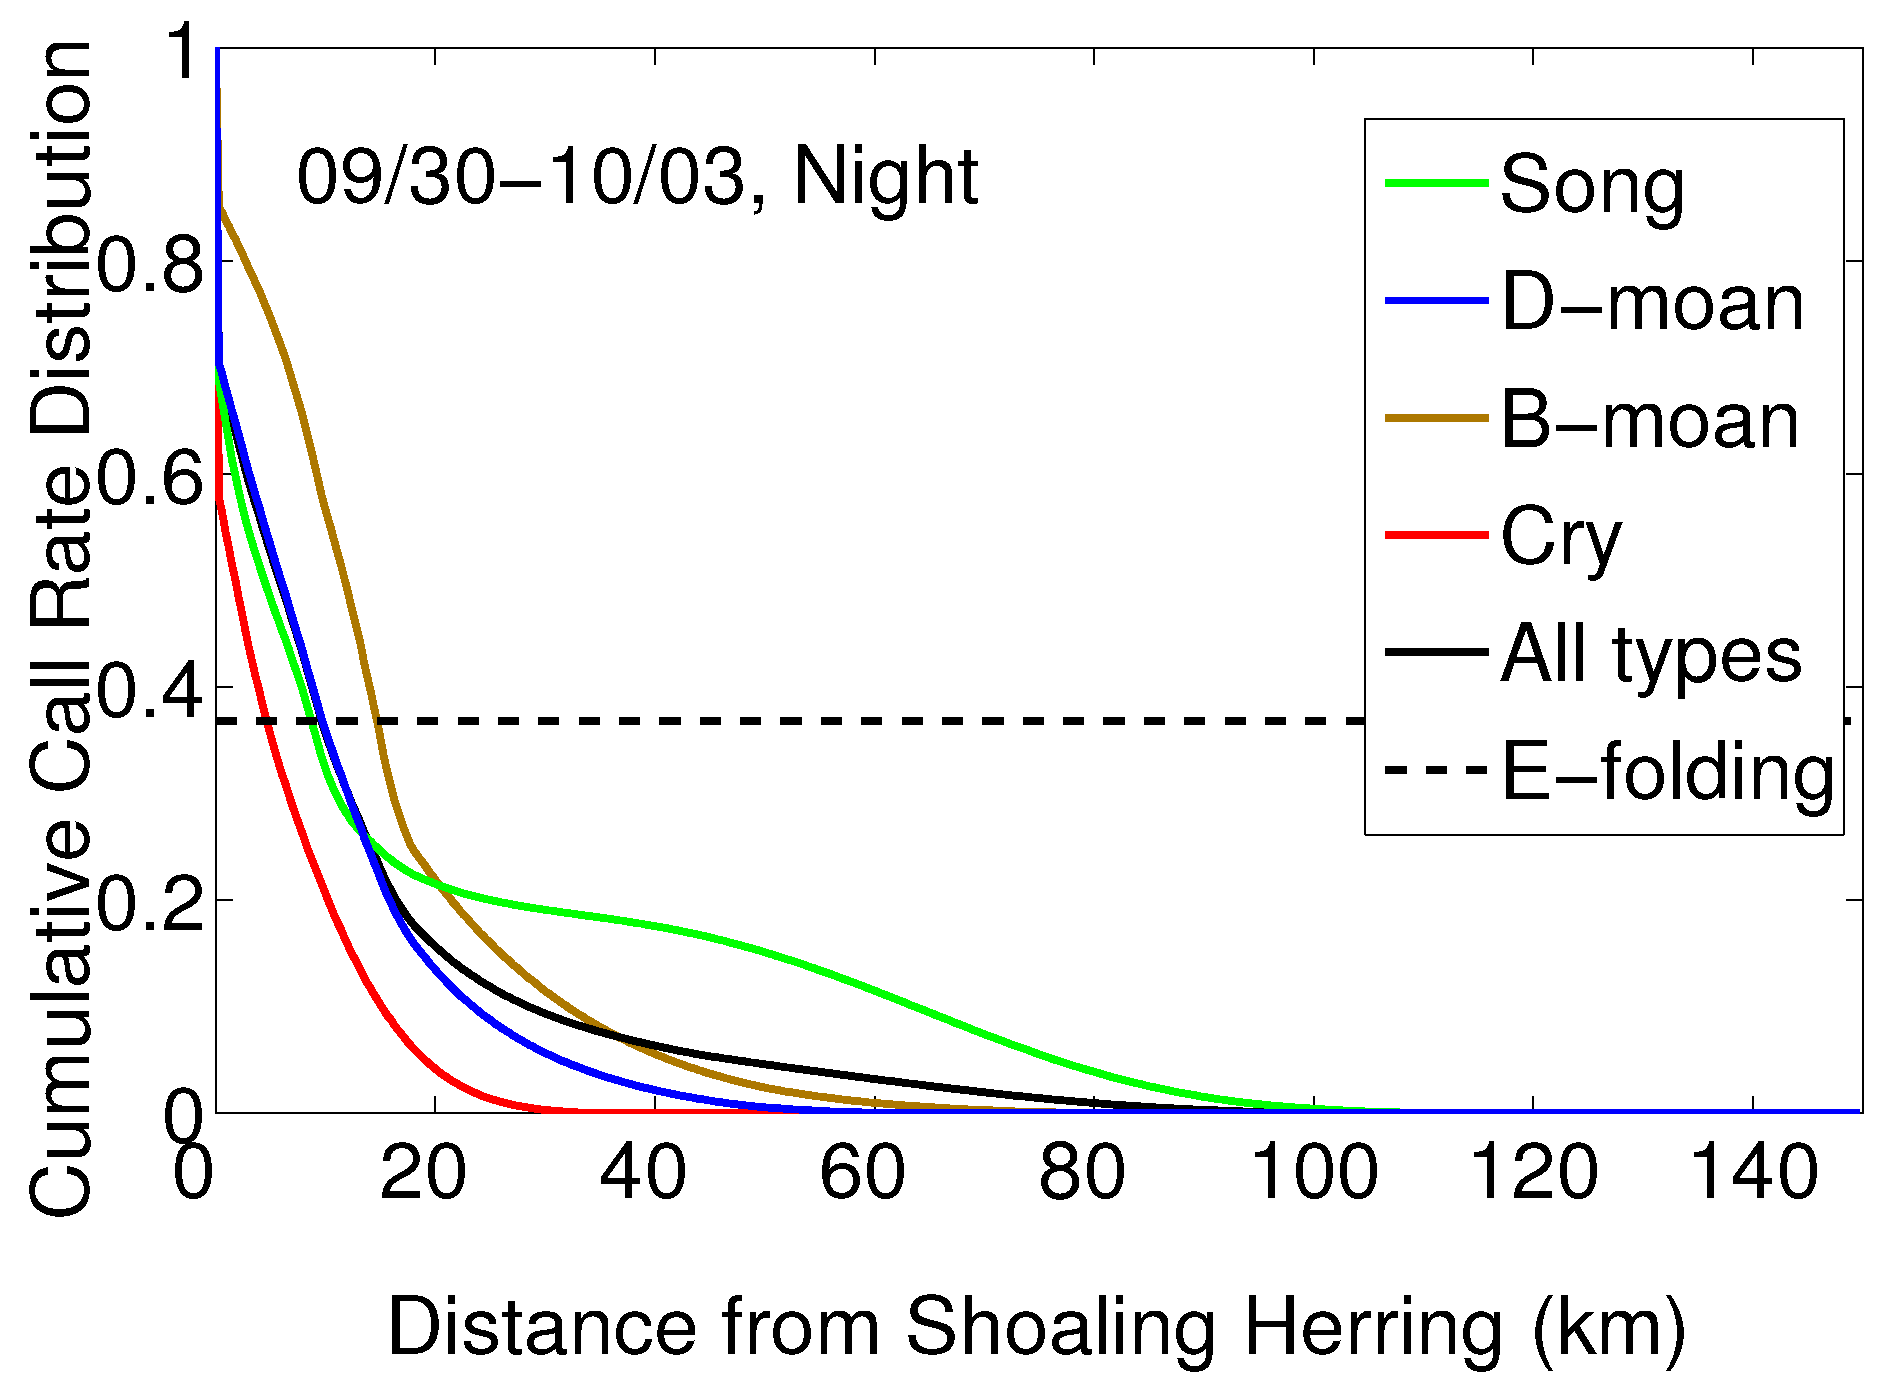
2.5. Determination of Humpback Cummulative Call Rate Spatial Distributions for Different Vocalization Types

The humpback cumulative call rate spatial distributions for different vocalization types in Figure 9 are plotted as functions of decreasing distance from shoaling herring and so take the value 0 at long ranges from herring shoaling locations and monotonically increase to 1 at herring shoaling locations. The e-folding decay range of the cumulative call rate distribution for each humpback call type is the distance from herring shoals where the cumulative call rate distribution decays to 1/e = 0.37, so that 63% of vocalizations of each type are contained within the e-folding decay range.

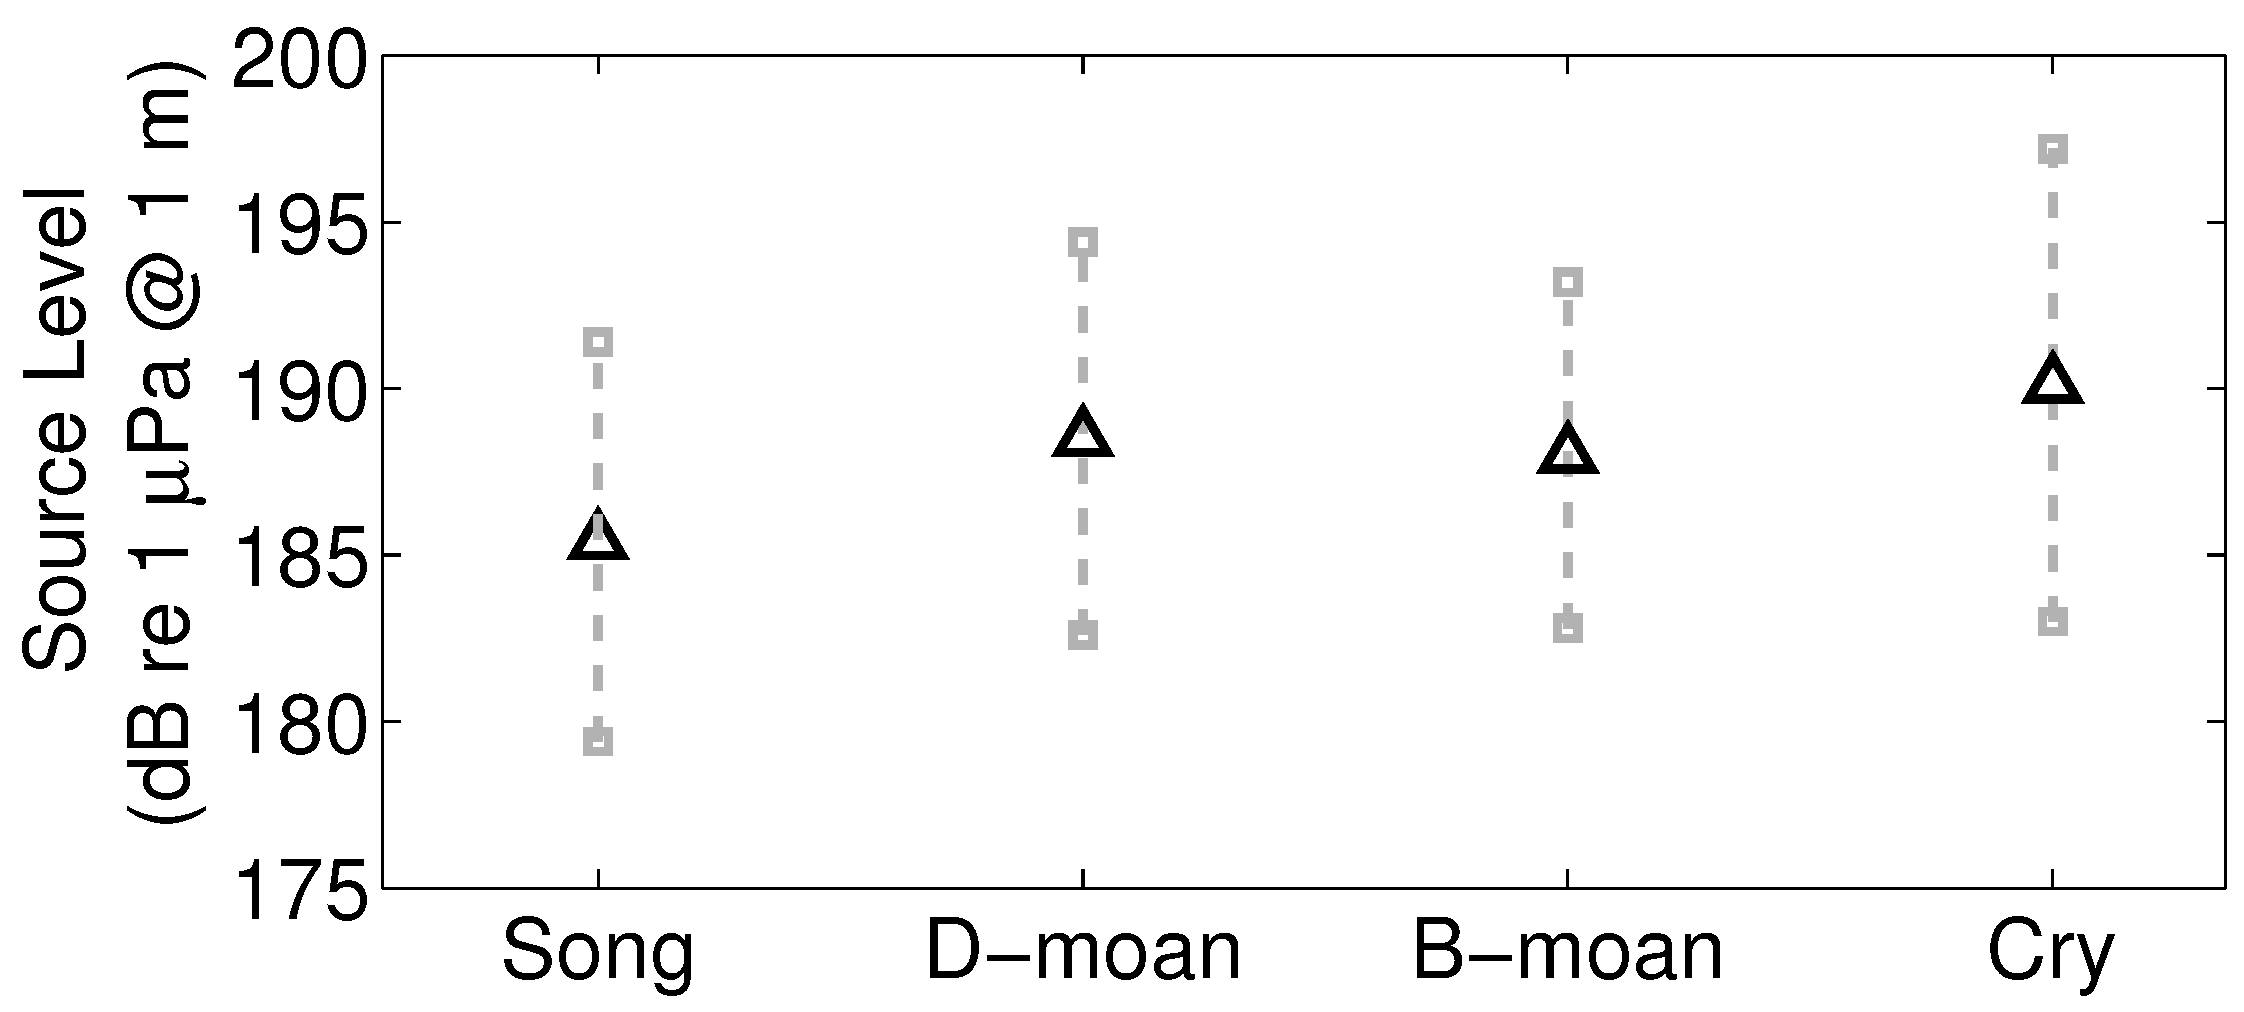
2.6. Source Levels of Humpback Song and Non-Song Vocalization Types

The source levels of the humpback song and non-song vocalization types are determined following the approach described in pages 19-20 of [2]. The source level S L ( r 0 ) of each humpback vocalization signal is estimated from its received pressure level R L ( r ) via the passive sonar equation [2,50,51],
S L ( r 0 ) = R L ( r ) + T L ( | r - r 0 | ) .
The received whale vocalization pressure level is estimated as the peak value of the instantaneous time-domain signal bandpass-filtered within the signal bandwidth. The corresponding one-way broadband acoustic transmission loss T L ( | r - r 0 | ) from the estimated location of each whale vocalization to the center of the POAWRS receiver array was calculated following the approach described in Section I of the Supplementary Information of [1]. A calibrated [13,44] parabolic equation based Range-dependent Acoustic propagation Model (RAM) [52] was employed to calculate the broadband transmission loss via [13,44,53,54]
TL ( | r - r 0 | ) = 10 log 10 ( f L f U Q ( f ) | G ( r | r 0 , f ) | 2 d f ) ,
where G ( r | r 0 , f ) is the waveguide Green function at frequency f for whale located at r 0 and receiver at r , Q ( f ) is the normalized vocalization spectra, and f U and f L are the upper and lower frequencies used for the bandpass filter. The model takes into account the environmental parameters such as the range-dependent water depth and sound speed profiles to stochastically compute the propagated acoustic intensities via Monte-Carlo simulations following the approach of [13,53,54]. The mean magnitude-squared waveguide Green function is obtained by averaging over multiple whale depths from the sea surface to the sea floor and over multiple Monte-Carlo simulations to account for the unknown whale depth and waveguide fluctuations.

3. Results

The humpback vocalizations measured by the POAWRS receiver array from 27 September to 3 October 2006 are plotted in Figure 1 as a function of measured bearing and time. The vast majority of humpback vocalizations consistently originate from two main bearing ranges over the course of our experiment (Figure 1). Roughly 70% of humpback vocalizations arise from bearing ranges 90 –130 corresponding to the northeastern Georges Bank (NEGB) direction, and most of the remaining 30% of humpback vocalizations arise from bearing ranges 220 –250 corresponding to directions spanning Franklin Basin to the Great South Channel (FB-GSC). The rest of the paper provides an analysis of the humpback vocalizations measured in the week-long time period from 27 Septemberto 3 October 2006, where greater than 8 hours per day of near-continuous acoustic recording covering both day and night time periods are available.
Example of spectrograms of repeated humpback song themes are shown in Figure 2 and Figure 3 for the NEGB and FB-GSC directions respectively, where the phrases A, B and C occur repetitively. Example of spectrograms of humpback non-song call sequences are shown in Figure 4 for the NEGB and FB-GSC directions.
The received humpback vocalizations over the 27 September to 3 October 2006 observation time period color-coded according to call type as song or non-song D-moan, B-moan and cry are indicated in Figure 1. The humpback vocalizations arising from the NEGB direction are roughly 43% song and 57% non-song. The NEGB non-song include D-moans, B-moans and cries in the proportion 83.5%, 6.7% and 9.8% respectively. The humpback vocalizations arising from the FB-GSC direction are roughly 27% song and 73% non-song. The FB-GSC non-song are dominated by D-moans (71.3%) and B-moans (28.4%) with negligible cries (0.3%).
Humpback songs are present throughout the diel cycle with approximately 40% occurrence during day and approximately 60% at night (Figure 5B). The humpback non-song D-moan, B-moan and cries occur during nighttime hours with negligible or no occurrence during daytime hours (see Figure 5B). The non-song vocalizations lead to an overall call rate for humpbacks that is roughly a factor of 10 times larger at night than during the day [1,2].
Comparing Figure 2 and Figure 3 for humpback song sequences with Figure 4 for humpback non-song sequences, it can be noted that song sequences have significantly smaller inter-pulse intervals than the non-song sequences. The histogram of inter-pulse intervals for humpback song sequences is tightly distributed, characterized by a mean of 3.5 s and standard deviation of 1.8 s (Figure 5A). The histogram of inter-pulse intervals for humpback non-song sequences is more broadly distributed, characterized by significantly larger mean of 14.2 s and broader standard deviation of 11 s.
The ensemble of pitch tracks and the mean pitch-track are plotted and compared in Figure 6 for various non-song vocalizations originating from the NEGB and FB-GSC directions. There were negligible cries originating from the FB-GSC direction, as can be noted from Figure 1 and Table 1 and Table 2, so pitch-tracks for cries are not shown for the FB-GSC direction in Figure 6.
The D-moans are the most abundant humpback vocalization type received at night (Figure 5B). The D-moans are downsweep chirp signals in the 300–600 Hz frequency range with roughly 1–2 s duration (Figure 4 and Figure 6A,B). The B-moans (bow-shaped calls) have frequencies ranging from 400 to 550 Hz. The B-moans from the FB-GSC direction (∼3.16 s) have slightly longer durations than those arising from the NEGB direction (∼2.23 s) (Figure 4 and Figure 6C,D). The B-moans have a downsweep followed by an upsweep making them distinct from the D-moans which are purely downsweep signals. The humpback cries (∼5 s) have longer durations than the D-moans and B-moans. The NEGB cries are further categorized into two sub-types. Subtype 1 consists of cries with almost unmodulated middle sections around 500 Hz lasting for more than two seconds and with endings that sweep downwards to 400 Hz over another 2 to 3 s interval (Figure 4 and Figure 6E). Subtype II consists of cries with continuously modulating frequencies in the 500 to 600 Hz frequency range (Figure 4 and Figure 6F).
The call rate spatial distributions for humpback song and non-song D-moan, B-moan and cry vocalizations averaged over 27 September to 3 October 2006 are shown in Figure 7A,B for day and night time periods respectively. Song vocalizations occur during both day and night, originating from areas on NEGB, northcentral Georges Bank, and FB-GSC. The day and night time humpback song vocalizations are both well contained (>95%) within the region of diffuse herring (∼0.053 fish/m 2 ). The daytime humpback song vocalizations have no overlap with daytime dense herring shoals (>0.2 fish/m 2 ). The nighttime humpback song vocalizations have substantial overlap with nighttime dense herring shoals (>0.2 fish/m 2 ) on NEGB, but less significant overlap on FB-GSC. The non-song D-moan, B-moan and cry vocalizations occur at night with negligible or no occurrence during the day. Non-song D-moan and B-moan vocalizations originate from areas on both NEGB and FB-GSC at night. These vocalizations have substantial overlap with nighttime dense herring shoals (>0.2 fish/m 2 ) on NEGB, and have less overlap on FB-GSC. The humpback non-song cry vocalizations originate exclusively from NEGB at night (Figure 7B) where they overlap with dense herring shoals.
Humpback cry vocalizations were detected during nighttime hours on a daily basis on and after 30 September 2006 of our measurement time period. No cry vocalizations were detected on or before 29 September of our measurement time period (see Figure 1). We next plot and compare the nighttime call rate spatial distributions for humpback song and non-song D-moan, B-moan and cry vocalizations, with the fish areal population density distributions for the two time periods: on or before 29 September, and on or after 30 September. In the time period on or before 29 September, the humpback song, and non-song D-moan and B-moan vocalizations occur on both NEGB and FB-GSC, and have negligible or no overlap with dense Atlantic herring shoals. No humpback cries were detected during this time period. In the time period on or after 30 September, the humpback song, and non-song D-moan and B-moan vocalizations occur on both NEGB and FB-GSC, and have significant overlap with dense Atlantic herring shoals on NEGB where significant humpback cries are detected.
The cumulative call-rate spatial distribution for all humpback vocalization types fall off rapidly with increasing range from the dense herring shoals (Figure 9). Humpback cries have the smallest e-folding decay range, a factor of 2 to 3 times smaller than those of humpback song, D-moans and B-moans. We find 63% of humpback cry vocalizations originate in areas that either completely overlap with or lie within 3 km range of dense herring shoals. This e-folding distance is significantly less than the size of the herring shoals and can be traversed by humpbacks within several minutes, time scales significantly smaller than the roughly 12 h duration of the herring shoal’s nocturnal existence. These results lead to the finding that humpback cries are feeding-related since they only occur at locations and time periods with coincident dense Atlantic herring populations [1,2].
The source level estimates for calls within humpback songs, and non-song D-moans, B-moans and cries are determined from a subset of the measured humpback vocalizations (see Figure 10). The source level for different humpback vocalization types are comparable since the estimated mean source level of the calls within one type lie within one standard deviation of the mean source level for all other call types. The humpback D-moans and B-moans have nearly identical source level means and standard deviations. The humpback cries have roughly 1.5 dB higher mean source level than the moans, while calls within songs have roughly 2.5 dB lower mean source level than those of the moans.

4. Discussion

The song phrases shown in Figure 2 and Figure 3 here for humpbacks located at NEGB and FB-GSC respectively are similar to one or more phrases of humpback songs recorded previously in the Gulf of Maine and other ocean regions [5,7,8,19,21,55,56]. The song call rate of between 11 to 35 calls per minute obtained here is consistent with the call rates for humpback songs shown in spectrograms of Refs. [5,7,8,19,21,55,56].
In addition to song vocalizations, humpbacks produce a wide variety of non-song vocalizations [1,2,21,22,23,24,25,26,27,28,29,30,57,57] that include social sounds, calls for coordinated movement during feeding and migration, as well as nighttime communication. The downsweep D-moans recorded here in the Gulf of Maine are similar in frequency band, duration and frequency-time slope to the “P.moan-moan” previously recorded in the vicinity of two humpback whales in Newfoundland Canada [22], (compare D-moans from Gulf of Maine humpbacks in Figure 6A,B with the P.moan-moan in Figure 1 of [57]). The bow-shaped B-moans (Figure 4E,F) recorded here in the Gulf of Maine with a downsweep followed by an upsweep are similar to other bow-shaped calls recorded from humpbacks in Antarctic coastal waters (compare with Figure 2A of [58]) and in Australian water (compare with Figure 2a of [59]).
The D-moans were consistently present every night and comprise roughly 80% of the humpback nocturnal non-song vocalizations (Figure 5B). The abundance of D-moans in the humpback vocalizations during nighttime hours and their near absence during daylight hours implies that the D-moans probably function as nighttime contact or communication signals. The D-moans may provide a mechanism to enable coordinated activities, such as group feeding or travel, during night-time hours where there is little or no visibility. Since the B-moans are also nocturnal, they probably serve the same purpose as D-moans for humpbacks as nighttime communication or contact signals.
The two types of humpback non-song cry vocalizations recorded here are similar in frequency band and duration to individual cries previously observed in the Alaskan humpback whale cooperative group herring-feeding activity [22] and summer feeding grounds in Alaska [60] (compare cries from Gulf of Maine humpbacks in Figure 6C,D with the feeding cries of Alaskan humpbacks in Figures 1 and 2 of [22] and the vocalizations in Figure 2b of [60]). The humpback cry vocalizations recorded here originate from areas and during time periods with significant spatial overlap or close proximity to nocturnal dense shoaling Atlantic herring populations, with fish densities between 0.2 fish/m 2 to over 10 fish/m 2 [12,13]. This implies the humpback cry vocalizations recorded here are feeding-related. The feeding-related cry vocalizations recorded here may serve the same purpose as the feeding cries of Alaskan humpbacks, in cooperative group herring-feeding activities on northeastern Georges Bank. Our finding of humpback feeding activity on northeastern Georges Bank is consistent with several decades of visual observations of Fall season humpback behavior in the Gulf of Maine [61]. The data presented here shows the humpbacks are present at NEGB at least 3 days prior to the onset of feeding-related cries and the formation of dense Atlantic herring shoals there.
The probability of detection (POD) of marine mammal vocalizations for the POAWRS system has been extensively formulated and modelled for a variety of whale species including humpback whales in Supplementary Information Section I of [1], and in [2]. The formulation and numerical implementation incorporate measured humpback vocalization source level mean and standard deviation, measured ambient noise level mean and standard deviation, variable whale horizontal location and depth, temporally and spatially varying sound speed profile and spatially varying bathymetry, as well as the statistics of scintillating acoustic propagation in the random range-dependent Gulf of Maine environment calculated using a parabolic-equation [52] based waveguide acoustic propagation model [1,2]. The POAWRS system’s 10%, 30%, 50%, 70% and 90% POD regions for humpback whale vocalizations in the Gulf of Maine are shown in Supplementary Information Figure 1C of [1] and are each extended over 100,000 km 2 areas. The 50% POAWRS POD region for humpback whale vocalizations in the Gulf of Maine is also shown Figure 3a and Supplementary Information Figures 2–5 of [1], as well as in Figure 7 of [2]. Fluctuations in ocean ambient noise level with wind speed or other diel-dependent effects over the course of our data collection has negligible effect on the POAWRS detection region for humpback vocalizations in the Gulf of Maine since the POAWRS detection region is a factor of 10 or more times larger than the spatial location of a significant majority of vocalizing humpback whales (see Figure 7A,B of [2] showing negligible effect of changes in background ambient noise level on the POAWRS detection region and on the measured humpback vocalization rate spatial distributions). Since the estimated source level means and standard deviations of different humpback vocalization types obtained here are also comparable, the findings on humpback vocalization behavior reported here are unlikely to be significantly influenced or biased by changes in POAWRS POD region over the duration of the experiment.

5. Conclusions

The vocalizations of humpback whales, monitored over vast areas of the Gulf of Maine using the passive ocean acoustic waveguide remote sensing technique (POAWRS) [1,2] over multiple diel cycles in Fall 2006, have been analyzed. The humpback vocalizations were comprised of both song and non-song. The song vocalizations, composed of highly structured and repeatable set of phrases, are found to be characterized by inter-pulse intervals of 3.5 ± 1.8 s. Songs were detected throughout the diel cyle, occuring roughly 40% during the day and 60% during the night. The humpback non-song vocalizations, dominated by shorter duration D- and B-moans, as well as a small fraction of longer duration cries, are found to have significantly larger mean and more variable inter-pulse intervals of 14.2 ± 11 s. The non-song vocalizations were detected at night with negligible detections during the day, implying they probably function as nighttime communication or contact signals. The humpback song and non-song vocalizations are separately localized using the moving array triangulation [2,9,10] and array invariant techniques [2,9,10,11]. The humpback song and non-song moan calls are found to be consistently localized to a dense area on northeastern Georges Bank and a less dense region extended from Franklin Basin to the Great South Channel. Humpback cry vocalizations are found to occur exclusively on northeastern Georges Bank and during nighttime hours where dense Atlantic herring shoals are coincidentally located or in close proximity, implying the cries are feeding-related.

Acknowledgments

Permission for this National Oceanographic Partnership Program experiment was given in the Office of Naval Research document 5090 Ser 321RF/096/06. This research was supported by the National Science Foundation, the Office of Naval Research (Ocean Acoustics Program), the National Oceanographic Partnership Program, the U.S. Presidential Early Career Award for Scientists and Engineers, the Alfred P. Sloan Foundation, the Census of Marine Life, and Northeastern University.

Author Contributions

Data analysis and interpretation conducted primarily by Wei Huang, with contributions from Delin Wang and Purnima Ratilal; Wei Huang and Purnima Ratilal wrote the paper

Conflicts of Interest

The authors declare no conflict of interest.

Abbreviations

The following abbreviations are used in this manuscript:
POAWRS
Passive Ocean Acoustic Waveguide Remote Sensing
OAWRS
Ocean Acoustic Waveguide Remote Sensing
D-moan
Downsweep moan or meow
B-moan
Bow-shaped moan

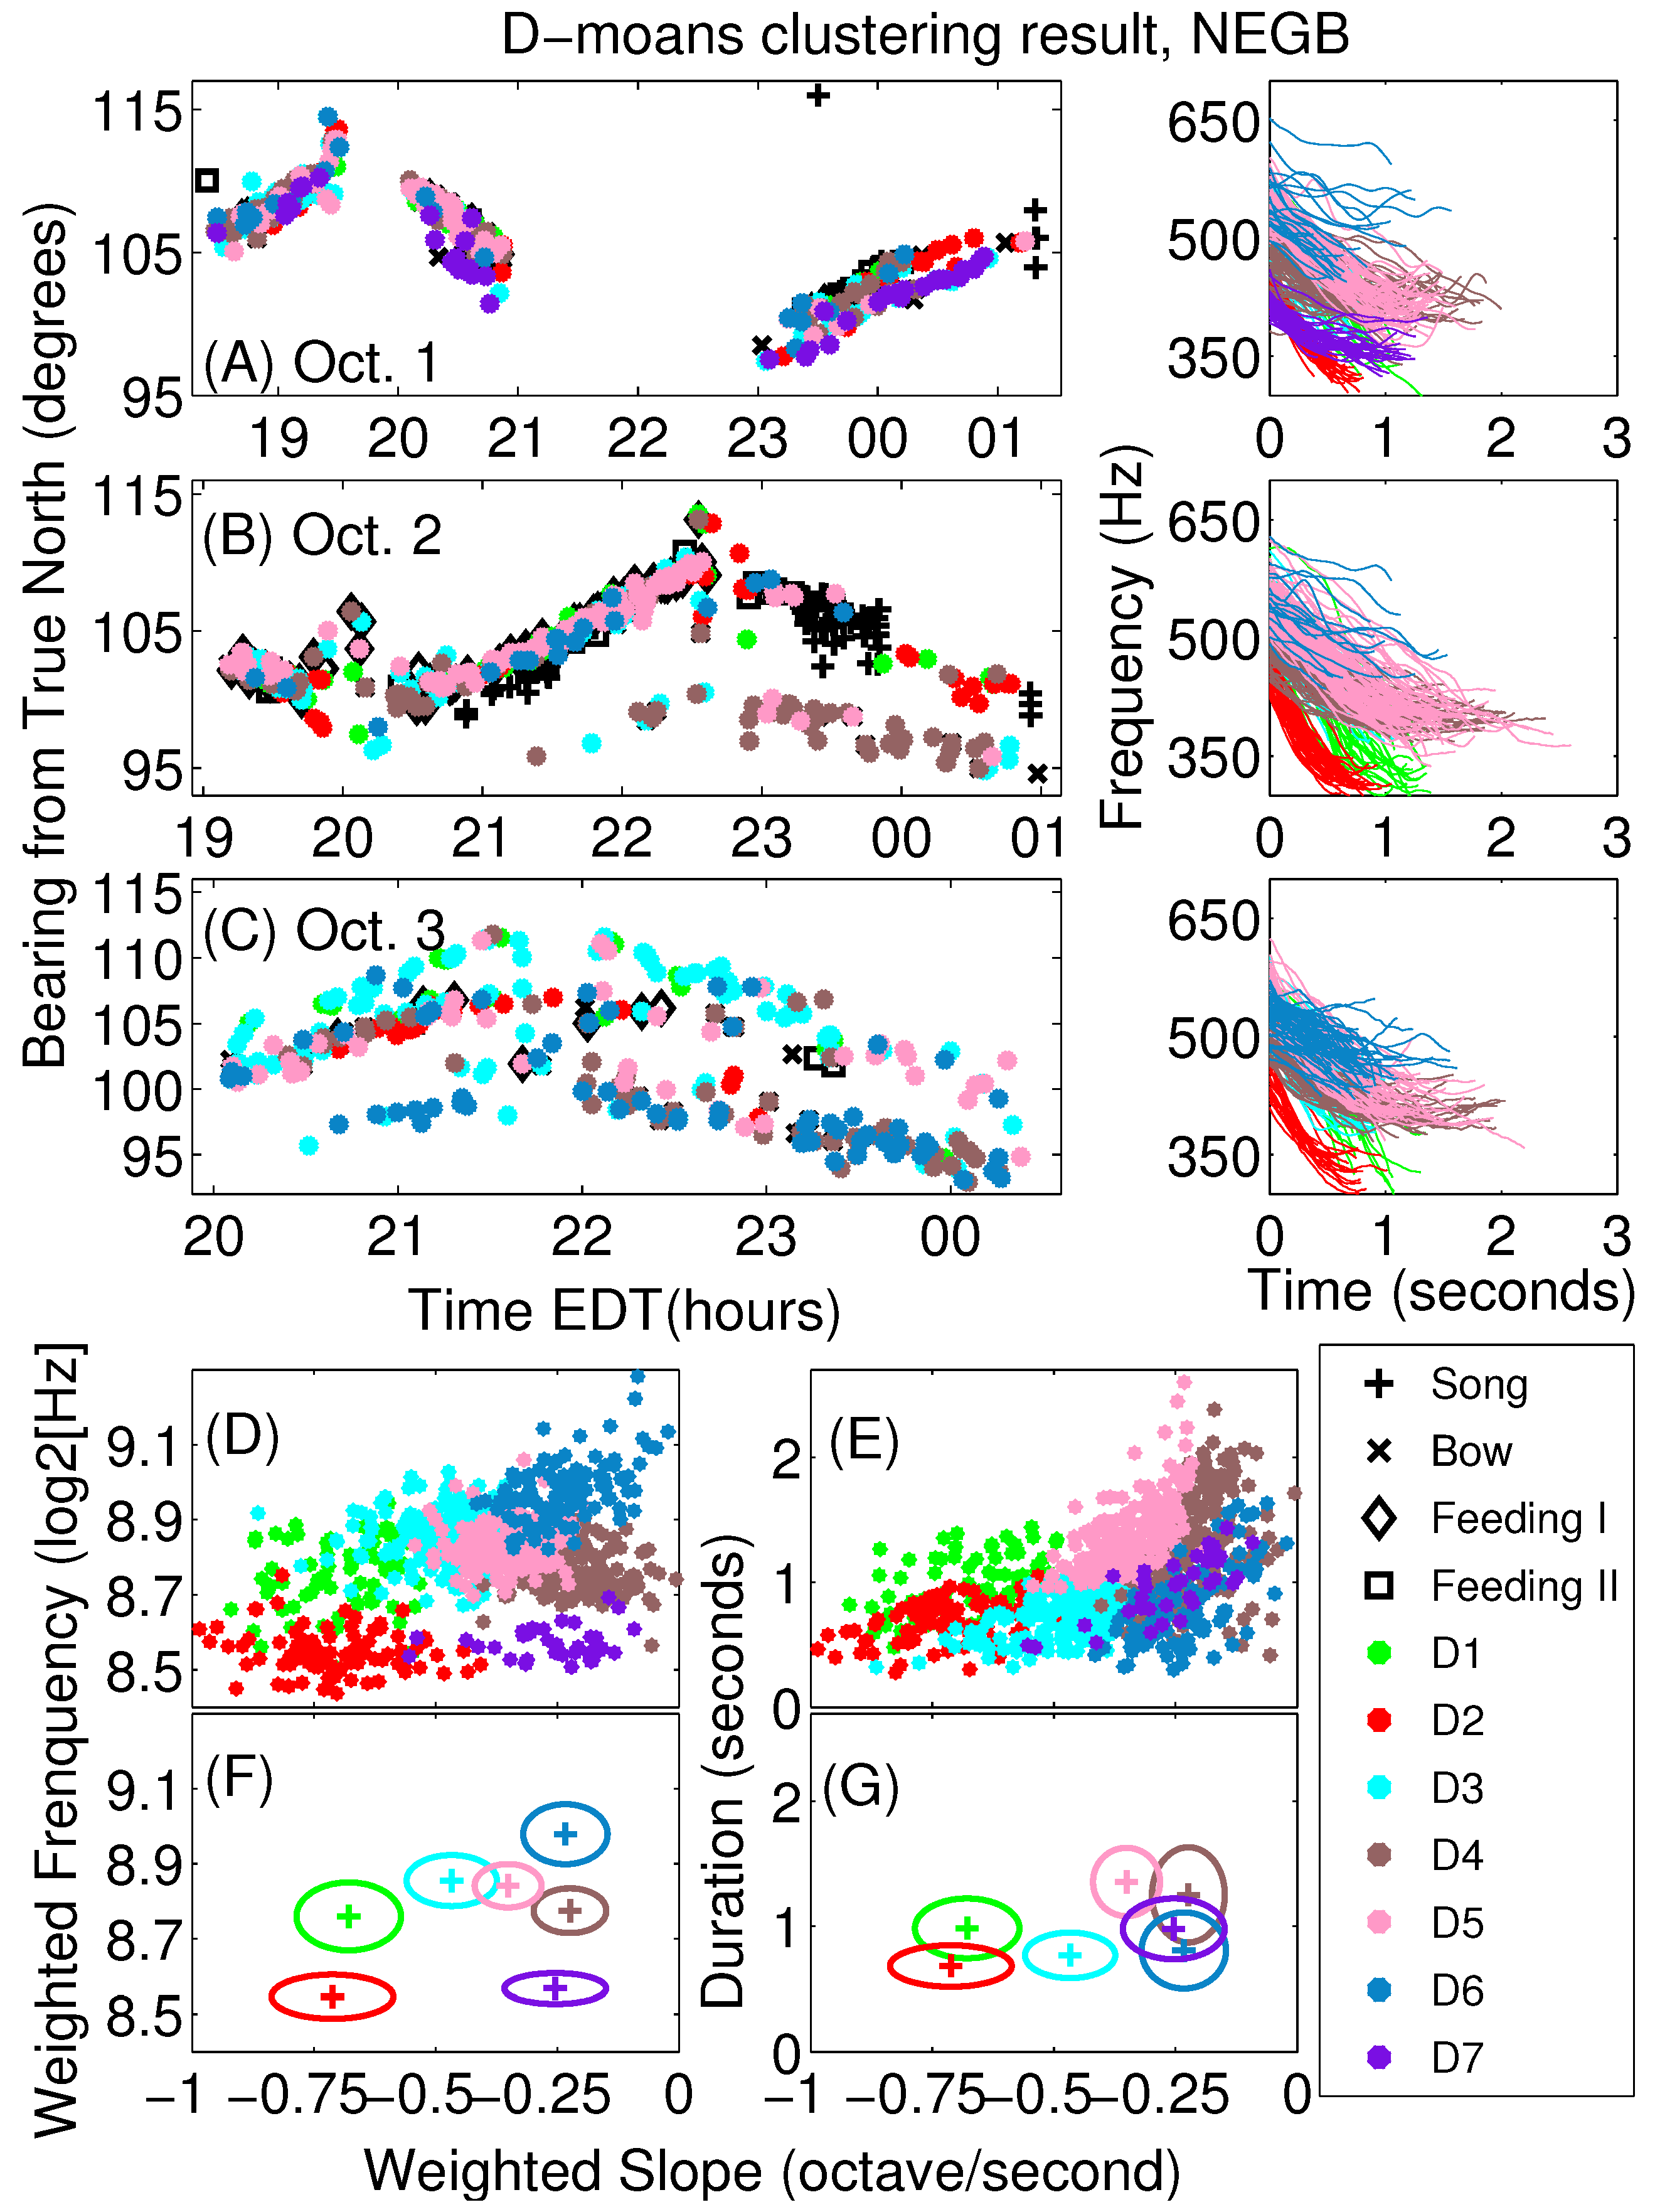
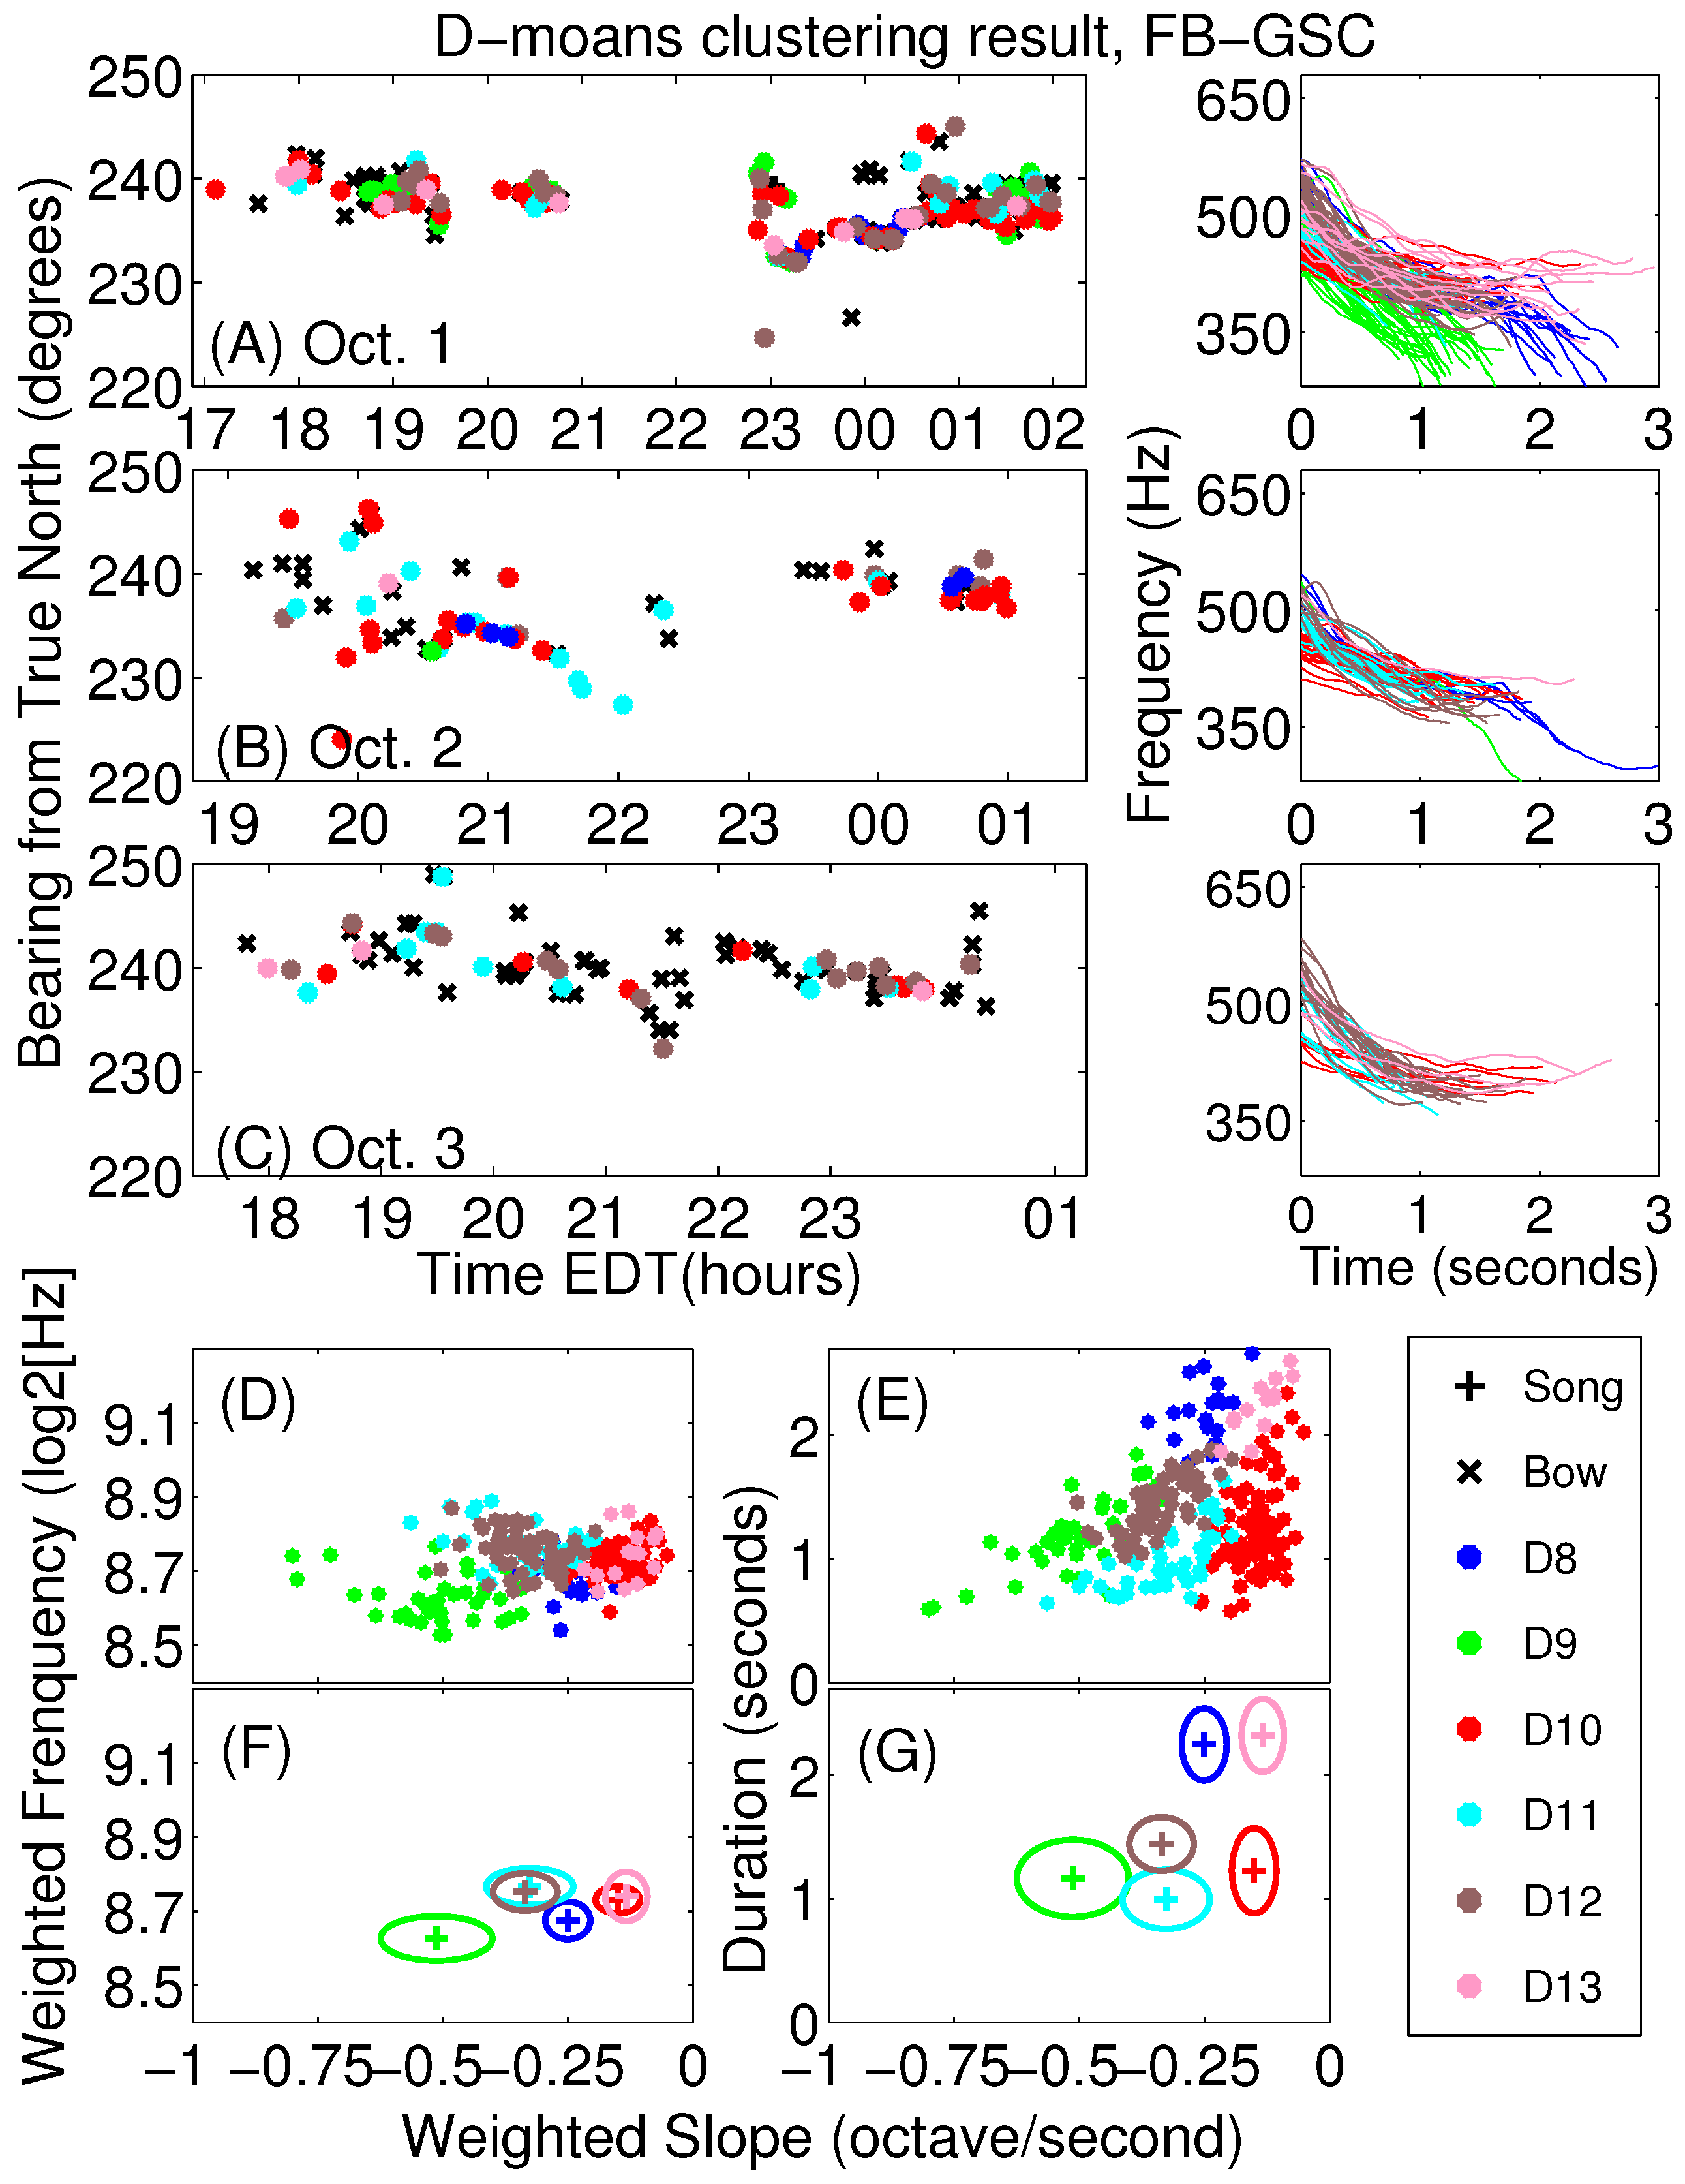
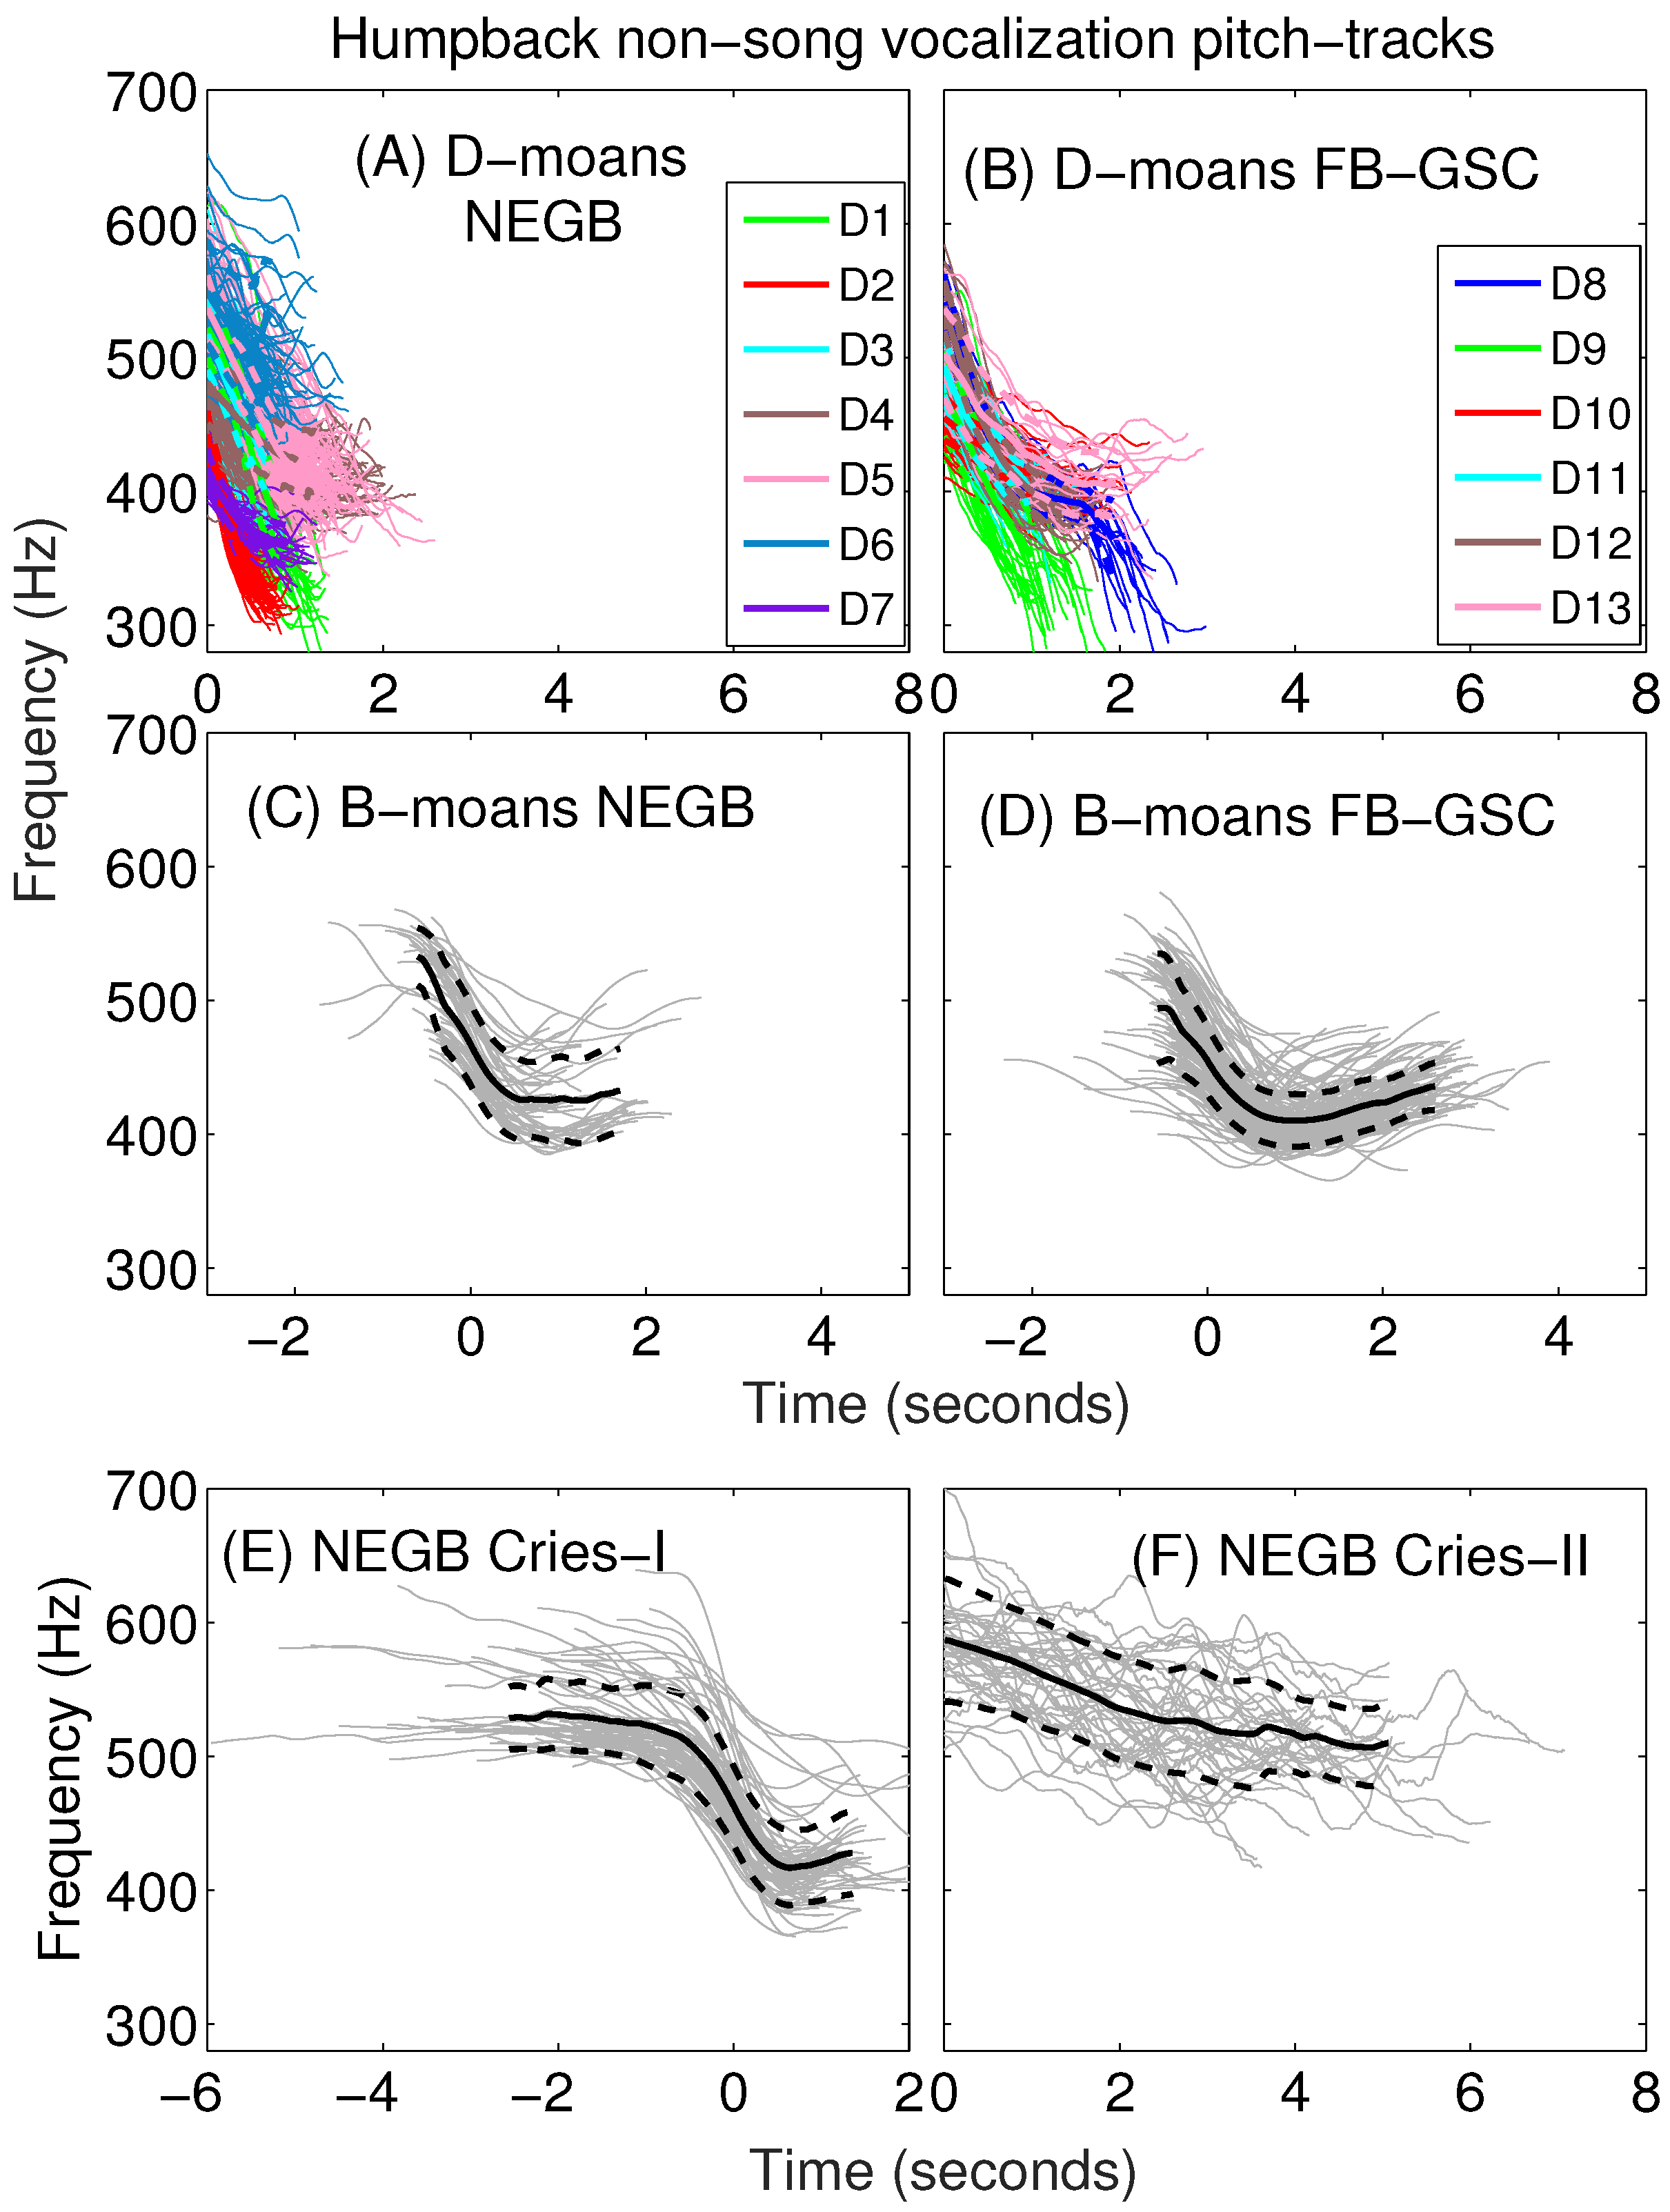
Appendix A. Sub-Classification of Humpback Non-Song D-Moan Vocalizations

Since D-moans are the most abundant humpback vocalization type recorded by the POAWRS receiver array at night (Figure 5B), we further sub-classify the D-moans into several distinct sub-types via vocalization pitch-tracking, feature extraction and clustering.
Various approaches for vocalization classification have been applied to birds, land and marine mammals, including the application to acoustic censusing [62]. In cetaceans, various techniques have been employed in vocalization classification from their cepstral features including dynamic time warping [63], neural network [64], Gaussian mixture models, hidden Markov models [65], multi-class support vector machine model [66], and multivariate discriminant analysis [67]. Here we employ pitch-tracking to extract key features of humpback D-moan vocalizations and apply the centroid-based K-means [68] method to classify them.
Each humpback D-moan signal is first represented as a pitch track which contains a time series t = ( t 1 , t 2 , . . . , t i ) , a frequency series f = ( f 1 , f 2 , . . . , f i ) , and an amplitude series A = ( A 1 , A 2 , . . . , A i ) describing the time-variation of the fundamental frequency in the signal [47,48], determined using a time-frequency peak detector from the beamformed spectrogram obtained by short time Fourier transform of the audio data (sampling frequency = 8000 Hz, frame = 526 samples, overlap = 1/2, Hann window). Ten features are extracted from each D-moan vocalization pitch-track. They are (1) minimum frequency (Hz), f m i n ; (2) maximum frequency (Hz), f m a x ; (3) signal bandwidth (Hz), B ¯ = f m a x - f m i n ; (4) amplitude weighted average slope (octaves per second), β; (5) amplitude weighted average frequency ( log 2 [ H z ] ), f ¯ ; (6) time variation (second), t ; (7) frequency variation ( l o g 2 [ H z ] ), f ; (8) duration (second), τ = t i - t 1 ; (9) slope from first order polynomial fit (degrees), β p o l y ; and (10) curvature from second order polynomial fit, ν. The four amplitude-weighted features (4)–(7) are calculated using the formulation provided in Table I of [47]. As explained in [47], an advantage of characterizing the signals with the amplitude-weighted attributes is that it provides a more consistent representation of a call type and also helps to minimize errors in call classification caused by uncertainty in estimating the non-amplitude weighted signal features such as start and end times, and frequencies in noise-limited data.
Principle component analysis (PCA) [69] is next employed to transform the vector of extracted features from each D-moan vocalization that forms a set of possibly correlated variables into a set of linearly uncorrelated variables. From PCA of humpback D-moans, it was found the frequency-time slope information (original features (4) and (9)), frequency information (original features (1), (3), (5) and (7)) and duration (original feature (8)) provide the greatest differences across the subset of D-moans investigated. By omitting the principle components with very small variance, the dimensionality of the transformed data is reduced and only a comparatively small amount of information is lost. This enables the visualization of the distinct data clusters in a high-dimensional feature basis space.
The dominant components are next used to classify the D-moans via K-means clustering [68], a recursive approach that determines the distinct clusters by minimizing the distance of each feature vector from that of the cluster center. The potential number of clusters is determined by combining the Bayesian information criteria [70] and the elbow method [71]. The bearing-time trajectories of a sequence of D-moan vocalizations is plotted with the clustering result(see Figure A1 and Figure A2 and Table A1 and Table A2).
Sub-classification of the humpback D-moan vocalizations from 1–3 October 2006 led to 7 and 6 sub-types respectively for the D-moans originating from the NEGB and FB-GSC directions. We find changes in the D-moan vocalization sub-type composition across the 3 days analyzed here from the NEGB and FB-GSC directions (see Figure A1 and Figure A2). For instance, the D-moan subtype D7 originates from the NEGB direction on 1 October, but not 2–3 October. The D-moan subtype D9 originates from the FB-GSC direction on October 1, but is negligible or absent on 2–3 October. The changes in the D-moan sub-types may be an indicator of changes in the composition of humpback individuals or sub-groups in the NEGB and FB-GSC directions over the three day period analyzed here.
Figure A1. Clustering of NEGB D-moans from 1–3 October identified 7 distinct sub-types. (AC) Bearing-time trajectories of humpback vocalizations with D-moans color-coded based on sub-type clustering. Corresponding D-moan pitch-tracks are indicated for each day; (D) The ensemble of amplitude weighted slope and frequency features; (E) The ensemble of amplitude weighted slope and duration features; (F) The mean and one standard deviation of amplitude weighted slope and frequency features; (G) The mean and one standard deviation of amplitude weighted slope and duration features for each D-moan sub-type cluster. The D-moan sub-type D7 is present on 1 October, but absent on 2 and 3 October.
Remotesensing 08 00712 g011
Figure A2. (AC) Clustering of FB-GSC D-moans from 1–3 October identified 6 distinct sub-types. (DG)All subplots are identical to Figure A1, except the results here are for the FB-GSC D-moans. The D-moan sub-type D9 is present on 1 October, but absent or negligible for 2 and 3 October.
Remotesensing 08 00712 g012
Table A1. Humpback D-moan sub-classification result for the NEGB direction. The quantity in parenthesis indicates the standard deviation. The D-moans from 1–3 October are analyzed here.
f min f max B ¯ β f ¯ t f τ β poly ν
D1346 (31)534 (30)189 (35)−0.68 (0.11)8.76 (0.09)0.30 (0.07)0.20 (0.04)0.98 (0.24)−203 (31)−22 (148)
D2328 (19)452 (21)124 (30)−0.71 (0.13)8.55 (0.06)0.21 (0.05)0.15 (0.03)0.68 (0.17)−188 (34)192 (122)
D3415 (24)527 (28)112 (24)−0.47 (0.10)8.85 (0.07)0.24 (0.05)0.11 (0.02)0.77 (0.18)−151 (30)60 (137)
D4404 (18)492 (26)88 (25)−0.22 (0.07)8.77 (0.06)0.38 (0.11)0.09 (0.03)1.25 (0.38)−69 (23)50 (82)
D5402 (23)548 (26)146 (22)−0.35 (0.07)8.84 (0.06)0.41 (0.08)0.14 (0.02)1.35 (0.27)−113 (22)58 (55)
D6475 (32)537 (31)63 (22)−0.23 (0.09)8.98 (0.08)0.25 (0.09)0.06 (0.02)0.81 (0.30)−81 (29)−5 (110)
D7354 (14)424 (17)70 (16)−0.25 (0.10)8.57 (0.04)0.29 (0.07)0.08 (0.02)0.98 (0.24)−68 (28)86 (68)
Average400 (45)514 (44)114 (43)−0.39 (0.19)8.80 (0.13)0.31 (0.11)0.12 (0.05)1.02 (0.38)−121 (54)57 (119)
Table A2. Humpback D-moan sub-classification result for the FB-GSC direction. The quantity in parenthesis indicates the standard deviation. The D-moans from 1–3 October are analyzed here.
f min f max B ¯ β f ¯ t f τ β poly ν
D8323 (30)533 (26)210 (43)−0.25 (0.04)8.68 (0.05)0.69 (0.03)0.18 (0.03)2.25 (0.29)−73 (13)25 (17)
D9316 (25)476 (33)160 (35)−0.51 (0.11)8.63 (0.06)0.36 (0.03)0.18 (0.04)1.17 (0.31)−140 (34)7 (96)
D10399 (14)455 (16)56 (16)−0.15 (0.04)8.73 (0.04)0.37 (0.10)0.06 (0.02)1.23 (0.34)−44 (13)1 (26)
D11393 (18)492 (21)99 (21)−0.33 (0.09)8.77 (0.05)0.31 (0.07)0.10 (0.02)1.00 (0.24)−99 (28)31 (78)
D12381 (16)535 (21)155 (21)−0.34 (0.06)8.75 (0.05)0.44 (0.07)0.15 (0.02)1.44 (0.22)−103 (20)83 (37)
D13393 (25)505 (30)112 (21)−0.13 (0.04)8.74 (0.07)0.70 (0.08)0.10 (0.02)2.32 (0.30)−42 (12)28 (15)
Average376 (37)491 (40)115 (56)−0.28 (0.14)8.72 (0.07)0.42 (0.15)0.11 (0.05)1.38 (0.49)−82 (41)28 (62)

References

  1. Wang, D.; Garcia, H.; Huang, W.; Tran, D.D.; Jain, A.D.; Yi, D.H.; Gong, Z.; Jech, J.M.; Godoe, O.R.; Makris, N.C.; Ratilal, P. Vast assembly of vocal marine mammals from diverse species on fish spawning ground. Nature 2016, 531, 366–370. [Google Scholar] [CrossRef] [PubMed]
  2. Gong, Z.; Jain, A.D.; Tran, D.D.; Yi, D.H.; Wu, F.; Zorn, A.; Ratilal, P.; Makris, N.C. Ecosystem scale acoustic sensing reveals humpback whale behavior synchronous with herring spawning processes and re-evaluation finds no effect of sonar on humpback song occurrence in the Gulf of Maine in Fall 2006. PLoS ONE 2014, 9, e104733. [Google Scholar] [CrossRef] [PubMed]
  3. Tran, D.D.; Huang, W.; Bohn, A.C.; Wang, D.; Gong, Z.; Makris, N.C.; Ratilal, P. Using a coherent hydrophone array for observing sperm whale range, classification, and shallow-water dive profiles. J. Acoust. Soc. Am. 2014, 135, 3352–3363. [Google Scholar] [CrossRef] [PubMed]
  4. Kay, S.M. Fundamentals of statistical signal processing, Vol. II: Detection Theory. In Signal Processing; Prentice-Hall: Upper Saddle River, NJ, USA, 1998; Volume 7. [Google Scholar]
  5. Payne, R.S.; McVay, S. Songs of Humpback Whales. Science 1971, 173, 585–597. [Google Scholar] [CrossRef] [PubMed]
  6. Noad, M.J.; Cato, D.H.; Bryden, M.M.; Jenner, M.N.; Jenner, K.C.S. Cultural revolution in whale songs. Nature 2000, 408, 537–537. [Google Scholar] [CrossRef] [PubMed]
  7. Winn, H.E.; Thompson, T.J.; Cummings, W.C.; Hain, J.; Hudnall, J.; Hays, H.; Steiner, W.W. Song of the humpback whale—Population comparisons. Behav. Ecol. Sociobiol. 1981, 8, 41–46. [Google Scholar] [CrossRef]
  8. Mattila, D.K.; Guinee, L.N.; Mayo, C.A. Humpback whale songs on a North Atlantic feeding ground. J. Mammal. 1987, 68, 880–883. [Google Scholar] [CrossRef]
  9. Gong, Z.; Tran, D.D.; Ratilal, P. Comparing passive source localization and tracking approaches with a towed horizontal receiver array in an ocean waveguide. J. Acoust. Soc. Am. 2013, 134, 3705–3720. [Google Scholar] [CrossRef] [PubMed]
  10. Gong, Z.; Ratilal, P.; Makris, N.C. Simultaneous localization of multiple broadband non-impulsive acoustic sources in an ocean waveguide using the array invariant. J. Acoust. Soc. Am. 2015, 138, 2649–2667. [Google Scholar] [CrossRef] [PubMed]
  11. Lee, S.; Makris, N.C. The array invariant. J. Acoust. Soc. Am. 2006, 119, 336–351. [Google Scholar] [CrossRef] [PubMed]
  12. Makris, N.C.; Ratilal, P.; Jagannathan, S.; Gong, Z.; Andrews, M.; Bertsatos, I.; Godø, O.R.; Nero, R.W.; Jech, J.M. Critical Population Density Triggers Rapid Formation of Vast Oceanic Fish Shoals. Science 2009, 323, 1734–1737. [Google Scholar] [CrossRef] [PubMed]
  13. Gong, Z.; Andrews, M.; Jagannathan, S.; Patel, R.; Jech, J.M.; Makris, N.C.; Ratilal, P. Low-frequency target strength and abundance of shoaling Atlantic herring (Clupea harengus) in the Gulf of Maine during the Ocean Acoustic Waveguide Remote Sensing 2006 Experiment. J. Acoust. Soc. Am. 2010, 127, 104–123. [Google Scholar] [CrossRef] [PubMed]
  14. Makris, N.C.; Ratilal, P.; Symonds, D.T.; Jagannathan, S.; Lee, S.; Nero, R.W. Fish population and behavior revealed by instantaneous continental shelf-scale imaging. Science 2006, 311, 151–160. [Google Scholar] [CrossRef] [PubMed]
  15. Jagannathan, S.; Bertsatos, I.; Symonds, D.; Chen, T.; Nia, H.T.; Jain, A.D.; Jech, M. Ocean acoustic waveguide remote sensing (OAWRS) of marine ecosystems. MEPS 2009, 395, 137–160. [Google Scholar] [CrossRef]
  16. Jech, J.M.; Stroman, F. Aggregative patterns of pre-spawning Atlantic herring on Georges Bank from 1999–2010. Aquat. Living Resour. 2012, 25, 1–14. [Google Scholar] [CrossRef]
  17. Klaer, N. CIE Reviewer’s Independent on 54th Northeast Regional Stock Assessment Workshop; Center for Independent Experts: Wood’s Hole, MA, USA, 2012. [Google Scholar]
  18. Garland, E.C.; Goldizen, A.W.; Rekdahl, M.L.; Constantine, R.; Garrigue, C.; Hauser, N.D.; Poole, M.M.; Robbins, J.; Noad, M.J. Dynamic horizontal cultural transmission of humpback whale song at the ocean basin scale. Curr. Biol. 2011, 21, 687–691. [Google Scholar] [CrossRef] [PubMed]
  19. Cerchio, S.; Jacobsen, J.K.; Norris, T.F. Temporal and geographical variation in songs of humpback whales, Megaptera novaeangliae: synchronous change in Hawaiian and Mexican breeding assemblages. Anim. Behav. 2001, 62, 313–329. [Google Scholar] [CrossRef]
  20. McSweeney, D.J.; Chu, K.C.; Dolphin, W.F.; Guinee, L.N. North Pacific humpback whale songs: A comparison of southeast Alaskan feeding ground songs with Hawaiian wintering ground songs. Mar. Mam. Sci. 1989, 5, 139–148. [Google Scholar] [CrossRef]
  21. Magnúsdóttir, E.E.; Rasmussen, M.H.; Lammers, M.O.; Svavarsson, J. Humpback whale songs during winter in subarctic waters. Polar Biol. 2014, 37, 427–433. [Google Scholar] [CrossRef]
  22. Cerchio, S.; Dahlheim, M. Variation in feeding vocalizations of humpback whales Megaptera novaeangliae from southeast Alaska. Bioacoustics 2001, 11, 277–295. [Google Scholar] [CrossRef]
  23. Dunlop, R.A.; Cato, D.H.; Noad, M.J. Non-song acoustic communication in migrating humpback whales (Megaptera novaeangliae). Mar. Mam. Sci. 2008, 24, 613–629. [Google Scholar] [CrossRef]
  24. Dunlop, R.A.; Noad, M.J.; Cato, D.H.; Stokes, D. The social vocalization repertoire of east Australian migrating humpback whales (Megaptera novaeangliae). J. Acoust. Soc. Am. 2007, 122, 2893–2905. [Google Scholar] [CrossRef] [PubMed] [Green Version]
  25. Thompson, P.O.; Cummings, W.C.; Ha, S.J. Sounds, source levels, and associated behavior of humpback whales, Southeast Alaska. J. Acoust. Soc. Am. 1986, 80, 735–740. [Google Scholar] [CrossRef] [PubMed]
  26. Parks, S.E.; Cusano, D.A.; Stimpert, A.K.; Weinrich, M.T.; Friedlaender, A.S.; Wiley, D.N. Evidence for acoustic communication among bottom foraging humpback whales. Sci. Rep. 2014, 4, 1–7. [Google Scholar] [CrossRef] [PubMed]
  27. Zoidis, A.M.; Smultea, M.A.; Frankel, A.S.; Hopkins, J.L.; Day, A.; McFarland, A.S.; Whitt, A.D.; Fertl, D. Vocalizations produced by humpback whale (Megaptera novaeangliae) calves recorded in Hawaii. J. Acoust. Soc. Am. 2008, 123, 1737–1746. [Google Scholar] [CrossRef] [PubMed]
  28. Rekdahl, M.L.; Dunlop, R.A.; Goldizen, A.W.; Garland, E.C.; Biassoni, N.; Miller, P.; Noad, M.J. Non-song social call bouts of migrating humpback whales. J. Acoust. Soc. Am. 2015, 137, 3042–3053. [Google Scholar] [CrossRef] [PubMed] [Green Version]
  29. Fournet, M.E.; Szabo, A.; Mellinger, D.K. Repertoire and classification of non-song calls in Southeast Alaskan humpback whales (Megaptera novaeangliae). J. Acoust. Soc. Am. 2015, 137, 1–10. [Google Scholar] [CrossRef] [PubMed]
  30. Stimpert, A.K.; Au, W.W.L.; Parks, S.E.; Hurst, T.; Wiley, D.N. Common humpback whale (Megaptera novaeangliae) sound types for passive acoustic monitoring. J. Acoust. Soc. Am. 2011, 129, 476–482. [Google Scholar] [CrossRef] [PubMed]
  31. Baumgartner, M.F.; Fratantoni, D.M. Diel periodicity in both sei whale vocalization rates and the vertical migration of their copepod prey observed from ocean gliders. Limnol. Oceanogr. 2008, 353, 2197–2209. [Google Scholar] [CrossRef]
  32. Mayo, C.A.; Marx, M.K. Surface foraging behaviour of the North Atlantic right whale, Eubalaena glacialis, and associated zooplankton characteristics. Can. J. Zool. 1990, 68, 2214–2220. [Google Scholar] [CrossRef]
  33. Sims, D.W.; Quayle, V.A. Selective foraging behaviour of basking sharks on zooplankton in a small-scale front. Nature 1998, 393, 460–464. [Google Scholar] [CrossRef]
  34. Jain, A.D.; Ignisca, A.; Yi, D.H.; Ratilal, P.; Makris, N.C. Feasibility of Ocean Acoustic Waveguide Remote Sensing (OAWRS) of Atlantic Cod with Seafloor Scattering Limitations. Remote Sens. 2013, 6, 180–208. [Google Scholar] [CrossRef]
  35. Haedrich, R.L. Bigelow and Schroeder’s Fishes of the Gulf of Maine. Copeia 2003, 2, 422–423. [Google Scholar] [CrossRef]
  36. Nelson, G.A.; Ross, M.R. Biology and population changes of northern sand lance (Ammodytes dubius) from the Gulf of Maine to the Middle Atlantic Bight. J. Northwest Atl. Fish. Sci. 1991, 11, 11–27. [Google Scholar] [CrossRef]
  37. Payne, P.M.; Wiley, D.N.; Young, S.B.; Pittman, S.; Clapham, P.J.; Jossi, J.W. Recent fluctuations in the abundance of baleen whales in the southern Gulf of Maine in relation to changes in selected prey. Fish. Bull. 1990, 88, 687–696. [Google Scholar]
  38. Overholtz, W.J.; Link, J.S. Consumption impacts by marine mammals, fish, and seabirds on the Gulf of Maine Georges Bank Atlantic herring (Clupea Harengus) complex during the years 1977–2002. ICES J. Mar. Sci. 2007, 64, 83–96. [Google Scholar]
  39. Overholtz, W.J.; Jacobson, L.D.; Melvin, G.D.; Cieri, M.; Power, M.; Libby, D.; Clark, K. Stock assessment of the Gulf of Maine-Georges Bank Atlantic herring complex, 2003. Northeast Fish. Sci. Center Ref. Doc. 2004, 4, 1–290. [Google Scholar]
  40. Melvin, G.D.; Stephenson, R.L. The dynamics of a recovering fish stock: Georges Bank herring. ICES J. Mar. Sci. 2007, 64, 6982. [Google Scholar]
  41. Read, A.J.; Brownstein, C.R. Considering other consumers: fisheries, predators, and Atlantic herring in the Gulf of Maine. Conserv. Ecol. 2003, 7, 2. [Google Scholar]
  42. Overholtz, W.J. The Gulf of Maine-Georges Bank Atlantic herring (Clupea Harengus): Spatial pattern analysis of the collapse and recovery of a large marine fish complex. Fish. Res. 2002, 57, 237–254. [Google Scholar] [CrossRef]
  43. Jagannathan, S.; Kusel, E.T.; Ratilal, P.; Makris, N.C. Scattering from extended targets in range-dependent fluctuating ocean-waveguides with clutter from theory and experiments. J. Acoust. Soc. Am. 2012, 132, 680–693. [Google Scholar] [CrossRef] [PubMed]
  44. Tran, D.; Andrews, M.; Ratilal, P. Probability distribution for energy of saturated broadband ocean acoustic transmission: Results from Gulf of Maine 2006 experiment. J. Acoust. Soc. Am. 2012, 132, 3659–3672. [Google Scholar] [CrossRef] [PubMed]
  45. Ratilal, P.; Lai, Y.S.; Symonds, D.T.; Ruhlmann, L.A.; Preston, J.R.; Scheer, E.K.; Garr, M.T.; Holland, C.W.; Goff, J.A.; Makris, N.C. Long range acoustic imaging of the continental shelf environment: The Acoustic Clutter Reconnaissance Experiment 2001. J. Acoust. Soc. Am. 2005, 1117, 1977–1998. [Google Scholar] [CrossRef]
  46. Johnson, D.H.; Dudgeon, D.E. Array Signal Processing: Concepts and Techniques; Simon & Schuster: New York, NY, USA, 1992; pp. 1–512. [Google Scholar]
  47. Baumgartner, M.F.; Mussoline, S.E. A generalized baleen whale call detection and classification system. J. Acoust. Soc. Am. 2011, 129, 2889–2902. [Google Scholar] [CrossRef] [PubMed]
  48. Shapiro, A.D.; Wang, C. A versatile pitch tracking algorithm: From human speech to killer whale vocalizations. J. Acoust. Soc. Am. 2009, 126, 451–459. [Google Scholar] [CrossRef] [PubMed]
  49. Jech, J.M.; Price, V.; Chavez-Rosales, S.; Michaels, W. Atlantic herring (Clupea Harengus) demographics in the Gulf of Maine from 1998 to 2012. J. Northwest Atl. Fish. Sci. 2015, 47, 57–74. [Google Scholar] [CrossRef]
  50. Kinsler, L.E.; Frey, A.R.; Coppens, A.B.; Sanders, J.V. Fundamentals of Acoustics, 4th ed.; Wiley-VCH: New York, NY, USA, 1999; p. 448. [Google Scholar]
  51. Urick, R.J. Principles of Underwater Sound, 3th ed.; McGraw Hill: New York, NY, USA, 1983; pp. 29–65, 343–366. [Google Scholar]
  52. Collins, M.D. A split-step Padé solution for the parabolic equation method. J. Acoust. Soc. Am. 1993, 93, 1736–1742. [Google Scholar] [CrossRef]
  53. Andrews, M.; Chen, T.; Ratilal, P. Empirical dependence of acoustic transmission scintillation statistics on bandwidth, frequency and range in New Jersey continental shelf. J. Acoust. Soc. Am. 2009, 125, 111–124. [Google Scholar] [CrossRef] [PubMed]
  54. Andrews, M.; Gong, Z.; Ratilal, P. Effects of multiple scattering, attenuation and dispersion in waveguide sensing of fish. J. Acoust. Soc. Am. 2011, 130, 1253–1272. [Google Scholar] [CrossRef] [PubMed]
  55. Clark, C.W.; Clapham, P.J. Acoustic monitoring on a humpback whale (Megaptera novaeangliae) feeding ground shows continual singing into late spring. Proc. R. Soc. Lond. B 2004, 271, 1051–1058. [Google Scholar] [CrossRef] [PubMed]
  56. Vu, E.T.; Risch, D.; Clark, C.W.; Gaylord, S.; Hatch, L.T.; Thompson, M.A.; Van Parijs, S.M. Humpback whale song occurs extensively on feeding grounds in the western North Atlantic Ocean. Aquat. Biol. 2011, 14, 175–183. [Google Scholar] [CrossRef]
  57. Winn, H.E.; Beamish, P.; Perkins, P.J. Sounds of two entrapped humpback whales (Megaptera novaeangliae) in Newfoundland. Mar. Biol. 1979, 55, 151–155. [Google Scholar] [CrossRef]
  58. Van Opzeeland, I.; Van Parijs, S.; Kindermann, L.; Burkhardt, E.; Boebel, O. Calling in the cold: Pervasive acoustic presence of humpback whales (Megaptera novaeangliae) in Antarctic coastal waters. PLoS ONE 2013, 8, e73007. [Google Scholar] [CrossRef] [PubMed]
  59. Cato, D.H. Songs of Humpback Whales: The Australian Perspective. Mem Queensl Mus 1991, 23, 277–290. [Google Scholar]
  60. Mobley, J.R., Jr.; Herman, L.M.; Frankel, A.S. Responses of wintering humpback whales (Megaptera novaeangliae) to playback of recordings of winter and summer vocalizations and of synthetic sound. Behav. Ecol. Soc. 1988, 23, 211–223. [Google Scholar] [CrossRef]
  61. Waring, G.T.; Josephson, E.; Maze-Foley, K.; Rosel, P.E. U.S. Atlantic and Gulf of Mexico Marine Mammal Stock Assessments 2014. NOAA Tech. Memo. NMFS NE 231 2014, 228, 02543–1026. [Google Scholar]
  62. Adi, K.; Johnson, M.T.; Osiejuk, T.S. Acoustic censusing using automatic vocalization classification and identity recognition. J. Acoust. Soc. Am. 2010, 127, 874–883. [Google Scholar] [CrossRef] [PubMed]
  63. Buck, J.R.; Tyack, P.L. A quantitative measure of similarity for tursiopstruncatus signature whistles. J. Acoust. Soc. Am. 1993, 94, 2497–2506. [Google Scholar] [CrossRef] [PubMed]
  64. Deecke, V.B.; Ford, J.K.B.; Spong, P. Quantifying complex patterns of bioacoustic variation: Use of a neural network to compare killer whale (Orcinus orca) dialects. J. Acoust. Soc. Am. 1999, 105, 2499–2507. [Google Scholar] [CrossRef] [PubMed]
  65. Oppenheim, A.V.; Schafer, R.W.; Buck, J.R. Discrete-Time Signal Processing; Prentice-hall Englewood Cliffs: Upper Saddle River, NJ, USA, 1989; pp. 1–879. [Google Scholar]
  66. Mazhar, S.; Ura, T.; Bahl, R. Vocalization based Individual Classification of Humpback Whales using Support Vector Machine. Proc. IEEE 2007. [Google Scholar] [CrossRef]
  67. Dahlheim, M.E.; Awbrey, F. A classification and comparison of vocalizations of captive killer whales (Orcinusorca). J. Acoust. Soc. Am. 1982, 72, 661–670. [Google Scholar] [CrossRef]
  68. Kanungo, T.; Mount, D.M.; Netanyahu, N.S.; Piatko, C.D.; Silverman, R.; Wu, A.Y. An efficient k-means clustering algorithm: Analysis and implementation. IEEE Trans. Pattern Anal. Mach. Intell. 2002, 24, 881–892. [Google Scholar] [CrossRef]
  69. Jolliffe, I.T. Principle Component Analysis, 2nd ed.; Wiley Online Library: New York, NY, USA, 2002; pp. 11–31. [Google Scholar]
  70. Hirose, K.; Kawano, S.; Konishi, S.; Ichikawa, M. Bayesian Information Criterion and Selection of the Number of Factors in Factor Analysis Models. J. Data Sci. 2011, 9, 243–259. [Google Scholar]
  71. Bholowalia, P.; Kumar, A. EBK-Means: A Clustering Technique based on Elbow Method and K-Means in WSN. Int. J. Comput. Appl. 2014, 105, 17–24. [Google Scholar]
Figure 1. Humpback vocalization bearings measured by POAWRS receiver array in the Gulf of Maine on (A) 27 September 2006; (B) 28 September 2006; (C) 29 September 2006; (D) 30 September 2006; (E) 1 October 2006; (F) 2 October 2006 and (G) 3 October 2006. The bearings are measured from true North in clockwise direction with respect to the instantaneous spatial locations of the receiver array center. The vast majority of humpback vocalizations originate from two distinct bearing ranges: 90–130 degrees corresponding to Northeastern Georges Bank (NEGB) and 220–250 degrees extending from Franklin Basin to the Great South Channel (FB-GSC). The shaded bars on the x-axis indicate the operation time periods of the receiver array. The humpback whale vocalizations include songs, D-moans, B-moans, and cries of type-I and type-II.
Remotesensing 08 00712 g001
Figure 2. Examples of beamformed spectrograms containing humpback song vocalizations originating from the NEGB direction drawn from both day and nighttime recordings in the 27 September to 3 October 2006 observation period in the Gulf of Maine, starting at (A) 13:21:15 EDT on 30 September 2006; (B) 01:18:45 EDT on 2 October 2006; (C) 01:46:15 EDT on 2 October 2006; (D) 01:53:45 EDT on 2 October 2006; (E) 13:13:45 EDT on 1 October 2006; (F) 13:41:15 EDT on 1 October 2006; (G) 14:58:45 EDT on 1 October 2006 and (H) 23:48:45 EDT on 2 October 2006 and each lasting roughly 70 s. The humpback song vocalizations are composed of repetitive phrases A, B and C. The spectrograms in Figure 2, Figure 3 and Figure 4 are created from short time Fourier transforms of the audio data (sampling frequency = 8000 Hz, frame = 1024 samples, overlap = 15/16, Hann window). The times indicated are Eastern Daylight Time (EDT).
Remotesensing 08 00712 g002
Figure 3. Examples of beamformed spectrograms containing humpback song vocalizations originating from the FB-GSC direction drawn from both day and nighttime recordings in the 27 September to 3 October 2006 observation period in the Gulf of Maine, starting at (A) 08:01:15 EDT on 29 September 2006; (B) 20:53:45 EDT on 30 September 2006; (C) 17:21:15 EDT on 28 September 2006 and (D) 16:53:45 EDT on 28 September 2006 and each lasting roughly 70 seconds. The humpback song vocalizations are composed of repetitive phrases A, B and C.
Remotesensing 08 00712 g003
Figure 4. Examples of beamformed spectrograms containing humpback non-song vocalizations recorded during nighttime hours from 27 September to 3 October 2006 in the Gulf of Maine. Moans and cries originating from the NEGB direction are shown in (AD). Moans originating from the FB-GSC direction are shown in (EG).
Remotesensing 08 00712 g004
Figure 5. (A) Normalized histogram of inter-pulse intervals for humpback song and non-song vocalizations. The mean inter-pulse interval for songs is 3.5 s with standard deviation of 1.8 s. The mean inter-pulse interval for non-song vocalizations is 14.2 s with standard deviation of 11 s; (B) Percentage occurrence of humpback song and non-song D-moan, B-moan and cry vocalizations. Songs were detected roughly 40% during the day and 60% during the night. The humpback non-song vocalizations were detected at night with negligibly small detections during the day.
Remotesensing 08 00712 g005
Figure 6. Ensemble of pitch-tracks extracted from received humpback vocalizations for (A) NEGB D-moans; (B) FB-GSC D-moans; (C) NEGB B-moans; (D) FB-GSC B-moans; (E) NEGB cries-I and (F) NEGB cries-II. The thick solid and dotted curves are the mean and standard deviation of each ensemble of pitch-tracks shown. The pitch-tracks for the D-moans and cries-II are aligned in time based on the start time. The pitch-tracks for the B-moans and cries-I are aligned in time based on their maximum gradients. The pitch-tracks for the D-moans are color-coded based on the clustering result for NEGB (7 sub-types) and FB-GSC (6 sub-types) (see Appendix).
Remotesensing 08 00712 g006
Figure 7. (A) Day, and (B) night spatial distributions of call rates for different humpback vocalization types and Atlantic herring population. All data are averaged between 27 September and 3 October 2006 for (A) daytime hours between sunrise and sunset (06:00 to 18:00 EDT) and (B) nighttime hours between sunset and sunrise (18:00 to next day 06:00 EDT). Dense Atlantic herring shoals (>0.2 fish/m 2 , magenta shaded areas) imaged using OAWRS system [12,13,15] and diffuse herring populations (approximately 0.053 fish/m 2 , bounded by magenta line) obtained from conventional fish finding sonar [16,49] line-transect data from NMFS Annual Fall Herring Surveys. The dashed magenta line represents the southern bound of the NMFS survey tracks. The humpback call rate densities in units of number of calls per minute per 25 nmi 2 (or units of calls/((min)(5 nmi) 2 )) measured by POAWRS have peak values α for the different call types as indicated.
Remotesensing 08 00712 g007
Figure 8. Nighttime spatial distributions of call rates for different humpback vocalization types and Atlantic herring population. The data are averaged over nighttime hours for (A) from 27–29 September 2006 and (B) from 30 September to 3 October 2006. All other contours are similar to Figure 7.
Remotesensing 08 00712 g008
Figure 9. Cumulative nighttime humpback vocalization rate distribution for different call types as a function of minimum distance from nighttime herring shoaling areas. The results are averaged over nighttime hours from 30 September to 3 October 2006. The humpback cry vocalizations have the smallest e-folding distance and are most tightly distributed in and around dense herring shoaling areas.
Remotesensing 08 00712 g009
Figure 10. Source level mean and standard deviation of different humpback vocalization types estimated from a subset of received humpback vocalizations consisting of 200 calls within songs, 600 D-moans, 120 B-moans, and 100 cries. The vocalization source level estimates (in units of dB re 1 μPa at 1 m) are 185.4 ± 6.0 for song, 188.5 ± 5.9 for D-moans, 188.0 ± 5.2 for B-moans and 190.1 ± 7.1 for cries. These source level estimates are based on the received humpback vocalization time-domain peak pressure levels after correcting for broadband transmission losses.
Remotesensing 08 00712 g010
Table 1. Recorded diel humpback vocalization rates originating from the northeastern Georges Bank (NEGB) direction and Franklin Basin to Great South Channel (FB-GSC) direction.
TypesNEGB(90–130 ) FB-GSC (220–250 )
Call rate (calls/day)1200 ± 900540 ± 240
Song43.2%26.5%
Non-song56.8%73.5%
Table 2. Composition of humpback non-song vocalizations from the NEGB and FB-GSC directions.
TypesNEGB (90–130 ) FB-GSC (220–250 )
Cry I6.7%0.3%
Cry II3.1%0%
B-moan6.7%28.4%
D-moan83.5%71.3%

