Article

Using VIIRS Day/Night Band to Measure Electricity Supply Reliability: Preliminary Results from Maharashtra, India

1
The Department of Geography, The George Washington University, Washington, DC 20052, USA
2
The Department of Earth & Environment, Boston University, Boston, MA 02215, USA
3
The Department of Economics, The George Washington University, Washington, DC 20052, USA
1
Prayas Energy Group, Maharashtra, India
*
Author to whom correspondence should be addressed.
Remote Sens. 2016, 8(9), 711; https://doi.org/10.3390/rs8090711
Submission received: 24 May 2016 / Revised: 28 July 2016 / Accepted: 15 August 2016 / Published: 29 August 2016

Abstract

:
Unreliable electricity supplies are common in developing countries and impose large socio-economic costs, yet precise information on electricity reliability is typically unavailable. This paper presents preliminary results from a machine-learning approach for using satellite imagery of nighttime lights to develop estimates of electricity reliability for western India at a finer spatial scale. We use data from the Visible Infrared Imaging Radiometer Suite (VIIRS) onboard the Suomi National Polar Partnership (SNPP) satellite together with newly-available data from networked household voltage meters. Our results point to the possibilities of this approach as well as areas for refinement. With currently available training data, we find a limited ability to detect individual outages identified by household-level measurements of electricity voltage. This is likely due to the relatively small number of individual outages observed in our preliminary data. However, we find that the approach can estimate electricity reliability rates for individual locations fairly well, with the predicted versus actual regression yielding an R2 > 0.5. We also find that, despite the after midnight overpass time of the SNPP satellite, the reliability estimates derived are representative of daytime reliability.

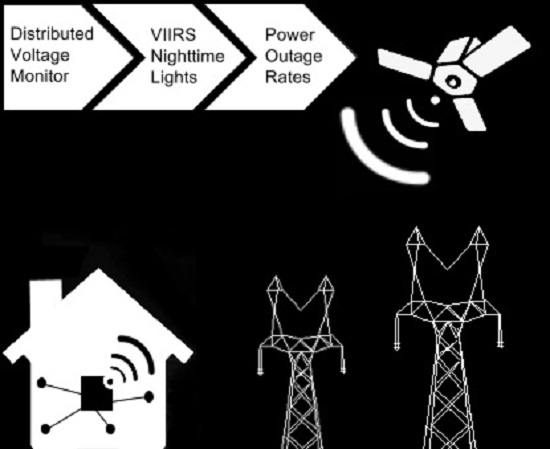
Graphical Abstract

1. Introduction

Unreliable electricity supplies can impose a variety of socio-economic costs. Recent studies indicate that unreliable electricity can reduce firm productivity [1], with effects differing across industries [2,3], distort the distribution of firm sizes [4], increase mortality [5], impair birth outcomes [6], reduce household welfare [7,8], motivate purchases of backup power equipment [9,10], and impair air quality [11].
The socio-economic costs of unreliable electricity are likely to be wide-ranging and substantial in India, where power outages are frequent and widespread. A major obstacle to measuring the costs of unreliable electricity in India, and in other developing countries, is the absence of data on electricity reliability at a fine temporal and spatial scale. Unlike the case in developed countries, electricity providers in developing countries are often not required to collect or disseminate data on service reliability. As a result, estimates of reliability need to be derived indirectly. For instance, a recent study by Allcott et al. [3] of the effect of unreliable electricity on manufacturing productivity in India uses state-level estimates of annual energy shortages as a measure of reliability.
Remotely sensed data offer the potential to conduct large-scale and spatially-explicit studies of electricity reliability. Electricity usage can be detected from space from images of outdoor lighting at night. Data from two satellite systems can be used: the older U.S. Air Force Defense Meteorological Satellite Program Operational Linescan System (DMSP-OLS) system, and the newer NASA-NOAA Suomi National Polar Partnership (SNPP) satellite, which carries the Visible Infrared Imaging Radiometer Suite (VIIRS). The VIIRS data are better suited to detecting power outages and electricity reliability given the VIIRS sensor’s higher spatial resolution and better low-light detection, among other advantages [12,13].
To date, the only study that has used satellite night lights data to estimate electricity reliability is a study by Alam [2] on the relationship between electricity reliability and firm productivity in India. Alam uses off-the-shelf, annual DMSP-OLS night lights composites prepared by NOAA to develop estimates of electricity reliability for India at the district level. NOAA’s annual composites were not designed with the intent of measuring electricity reliability.
The objective of this study is to assess the viability of using daily VIIRS night lights data to develop purpose-built estimates of electricity reliability for India at fine temporal and spatial scales. In particular, our method allows for estimates to be generated for time periods smaller than a year and for an area much smaller than a state or district. We do so using a random forest model that is trained using VIIRS data combined with recently available electricity monitoring data collected by the Indian NGO Prayas (City). As such, this study is the first to use VIIRS data to develop purpose-built estimates of electricity reliability, and it is the first to validate reliability estimates using high-resolution data on actual power outages. In the following sections, we outline our initial findings, designed as a test case, for a region encompassing the state of Maharashtra, India.

2. Materials and Methods

2.1. Study Area

Our study area is the state of Maharashtra and portions of adjacent states that fall within the 5-min image swaths we use. Raw daily VIIRS data was interpolated to a uniform grid of 7.84 × 10⁻³ decimal degrees for Western India from 1 January 2015 to 10 September 2015. A sample date of the raw data is presented in Figure 1. Presence of clouds and shadows, visible in Figure 1, interfere with accurate measurements of night lights.

2.2. Representativeness

The after midnight (0–2 a.m.) timing of the SNPP satellite overpass casts doubt on whether electricity reliability estimated during the overpass time is representative of reliability at other times of the day when power outages can be more disruptive. To address this concern, we analyzed hourly individual feeder-line voltage data for the state of Maharashtra obtained from the Maharashtra State Electricity Distribution Company (MahaDiscom, Mumbai, India) for the seven-year period 2007–2013 [14] (Maharashtra was chosen as our study area because of the unusual availability of the feeder-line voltage data. The feeder-line data are not geocoded, hence they cannot be used to develop electricity reliability estimates at fine spatial scales). MahaDiscom provides electricity to nearly all of Maharashtra, with the exception of Mumbai. Data for this period were aggregated for all years to the division level. A MahaDiscom division corresponds to an area smaller than an administrative district; there are 137 MahaDiscom divisions in Maharashtra but only 36 districts.
For each division, the percentage of zero voltage readings on its feeder lines was calculated for three different periods during the day and compared: daytime hours (6 a.m.–6 p.m.), overpass time of the SNPP satellite (midnight–2 a.m.), and overpass time of the DMSP satellite (7–10 p.m.). We interpret a zero voltage reading as representing a power outage.

2.3. Remote Sensing

The Visible Infrared Imaging Radiometer Suite (VIIRS) is a scanning radiometer onboard the SNPP satellite. The VIIRS collects visible and infrared imagery and radiometric measurements of the land, atmosphere, and oceans. It is sensitive to 22 wavelength bands, including a “Day/Night band” (DNB) with 750-m resolution. The DNB is sensitive to visible and near-infrared wavelengths ranging from daylight down to low levels of nighttime radiance. The ability of the DNB to detect the low levels of visible light present at night makes it well suited to studying night lights. We downloaded all available VIIRS DNB 5-min swath data from the Level 1 and Atmosphere Archive and Distribution System for our study region [15]. These data are corrected for stray solar light contamination, and pixel geolocations are corrected for changes in elevation. Clouds and shadows were masked using the VIIRS Cloud Mask Intermediate Product. DNB data were then filtered for clouds by removing all pixels with cloud mask values greater than zero.
A series of statistics were calculated for each DNB stack, including the (global) mean, median, and standard deviation. Since DNB radiance values are influenced by lunar illumination and phase (DNB values can vary by several orders of magnitude between a new and a full moon), the radiance values were linked to data on lunar illumination and phase for each image date and time.

2.4. Voltage Monitors

The known data used to train the random forest model (described below) include voltage monitoring data from the Electricity Supply Monitoring Initiative (ESMI) established by the Indian NGO Prayas in late 2014 [16]. The ESMI data are obtained from battery-backed-up voltage monitoring devices plugged into electricity outlets in a few hundred homes and enterprises across India. Voltage readings are taken at one-minute intervals and transmitted to a central database via the local cellular network.

2.5. Power Outage Classifier

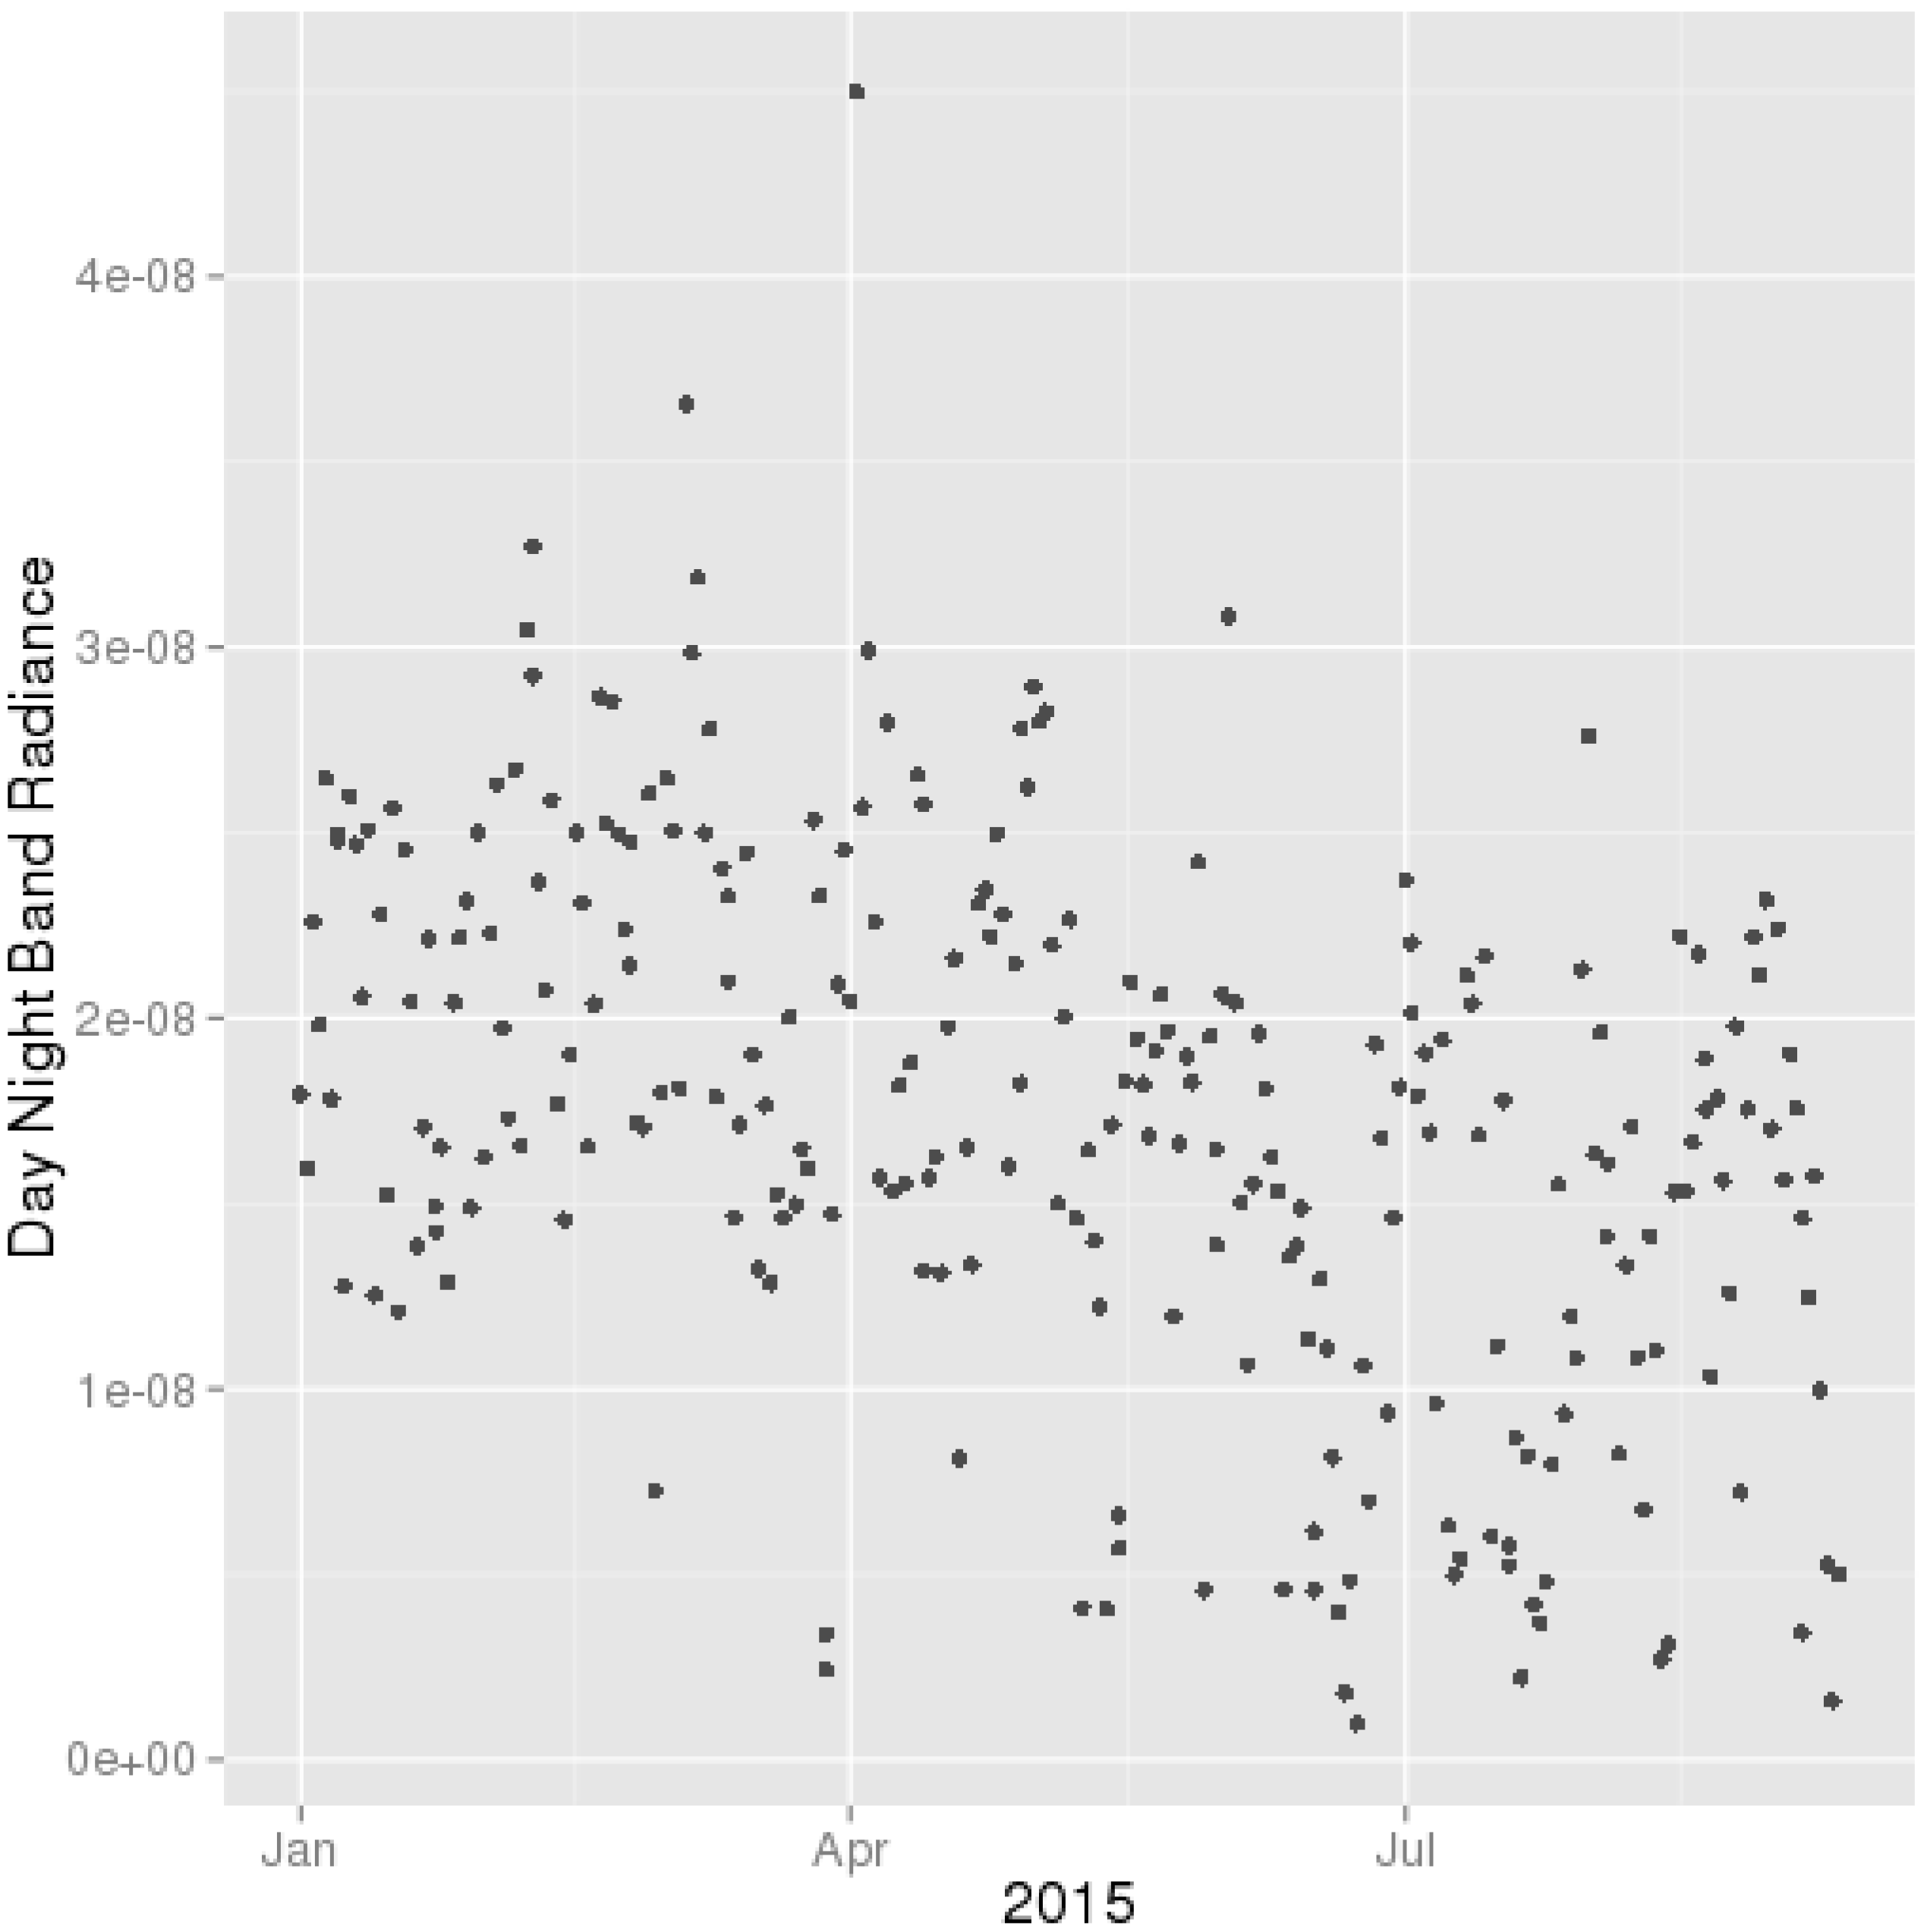
Ideally, power outages could be detected by simply examining the time series of DNB values for a given location and identifying outages using traditional thresholding methods. However, the time series are often noisy, rendering such methods inappropriate. This is illustrated in Figure 2, which shows the time series of DNB values for a location in Saharkar Nagar, a suburb of Pune. Note that there is one DNB value for each cloud-free day, measured at the satellite overpass time.
Our approach to using the DNB values to estimate power reliability treats the problem as one in statistical classification. Each pixel of an image, which corresponds to a square of length 750 m, must be classified as showing: (i) normal electricity supply conditions; (ii) a power outage; or (iii) an area with no electricity, or undetectably low, nighttime lights. Machine-learning techniques are well suited to such classification problems when data sets can be large and the objective is to obtain good out-of-sample predictions, as is true here [17].
The machine-learning approach we employ is a random forest [18]. This approach makes use of a set of known, correctly classified observations (i.e., satellite images of a particular location for which it is known from ground-level observation whether or not there was a power outage at the time the image was taken). This known data set is used to train a model (or classifier), which can then be applied to observations whose classification is unknown. The random forest approach employed here randomly partitions the known data set into a training data set used to train the model, and a validation data set that is used to test the model. This process is repeated k times. The advantage of this k-fold cross-validation technique is that all observations are used for both training and validation, and each observation is used for validation only once.
To assemble a set of known, correctly classified observations, we used ESMI data from 39 voltage monitoring locations in Maharashtra, across the districts of Nagpur, Akola, Pune, Solapur, Mumbai, and Nashik. The geographic coordinates of the 39 monitoring locations were determined from high-resolution maps of the monitoring locations available from Prayas. Three locations with outage rates above 25% were considered outliers and dropped from the sample.
VIIRS DNB data were extracted for the pixel coincident with each voltage monitoring location. The voltage reading closest in time to the satellite overpass generating an image was associated with each pixel. Following consultation with Prayas, voltage readings below 100 volts were classified as outages, whereas voltage readings above 100 volts were classified as normal supply conditions (the voltage monitoring devices did not record voltages below 100 volts. Instead, any voltage below 100 volts is assigned a value of 99 [19]. (Electricity in India is supplied at 220 volts.)
In addition to the 39 locations above at which electricity is supplied and voltage monitored, 26 additional locations with no electricity that are in, or adjacent to, Maharashtra were included in the known data set. These locations correspond to ocean, lakes, forests and other naturally-occurring vegetation. In all, the known data set consisted of 15,393 observations across 65 training sites for the period 1 January 2015 to 10 September 2015. This data is broken into training and testing samples, with 75% of observations reserved for training.
The known data set was used to train a random forest classifier using one of two loss functions (described in the next section) with five-fold cross-validation, using R’s e1071 package (version, Manufacturer, City, US State if applicable, Country) [20]. The model is of the following form:
lights_out = F(dnb, illum, phase, md_dnb, (dnb − md_dnb)).
Whether an image pixel reflects a power outage, normal electricity supply, or an area with no electricity (lights_out) depends on its DNB radiance value (dnb), lunar illumination (illum) and phase (phase), the (global) median DNB value (md_dnb) for that pixel, and the difference between the DNB value at the time the image was taken and the median DNB value for that pixel (dnbmd_dnb). The random forest approach implicitly determines the form of the relationship (F(∙)) between the predictors and the outcome. The relationship is not constrained to being linear, or even smooth. The approach also allows for interactions among the predictors.
As noted earlier, lunar illumination and phase have a strong influence on DNB values, particularly in rural communities, hence the inclusion of these variables as predictors. The median DNB value is derived from the time series of DNB values for a given pixel. The inclusion of this variable as a predictor facilitates identification of areas with no electricity. The difference between a DNB value for a pixel and the median DNB value for that pixel facilitates identification of outages.

2.6. Individual Power Outages and Power Outage Rates

The objectives of this study are to assess whether VIIRS DNB data can be used to: (1) detect individual power outages; and (2) estimate power outage rates. Power outage rates represent our estimates of electricity reliability. The second objective is our primary one.
To assess the ability of the random forest classifier in Equation (1) to predict individual power outages, we trained the classifier using a loss function that targeted the discrepancy between individual predicted and actual outages, and then assessed the classifier’s predictive accuracy. When using the classifier to estimate outage rates, we used a loss function that targeted the difference between predicted and actual outage rates for each location. Outage rates for a given pixel are derived by determining the number of (cloud-free) days for which the pixel has a predicted outage and dividing this number by the total number of cloud-free images available for that pixel. Both models are tested on out-of-sample data amounting to 25% of the total sample.

2.7. Sensitivity Analysis

We run a sensitivity analysis to estimate the influence of additional observations from existing training sites on predictive accuracy. Starting with the middle of the monsoon season (estimated to be day of the year 170 for 2015), we add additional observations in increments of 20 days before and after this midpoint. Hence, the sample size increases with a greater proportion of days outside of the monsoon season, until the entire sample is included. Sensitivity of the model is estimated as the percentage of individual outages correctly classified using the out-of-sample testing data.

2.8. Validation

Our predicted outage rate estimates can be validated by comparing them with actual outage rates derived from the ESMI voltage readings. Ideally, predicted and actual outage rates would be perfectly correlated. To test the relationship between predicted and actual outage rates, we regress predicted rates on actual rates, and perform a Student’s t-test to test the hypothesis that the best-fit line coincides with the one-to-one line.

3. Results

3.1. Representativeness

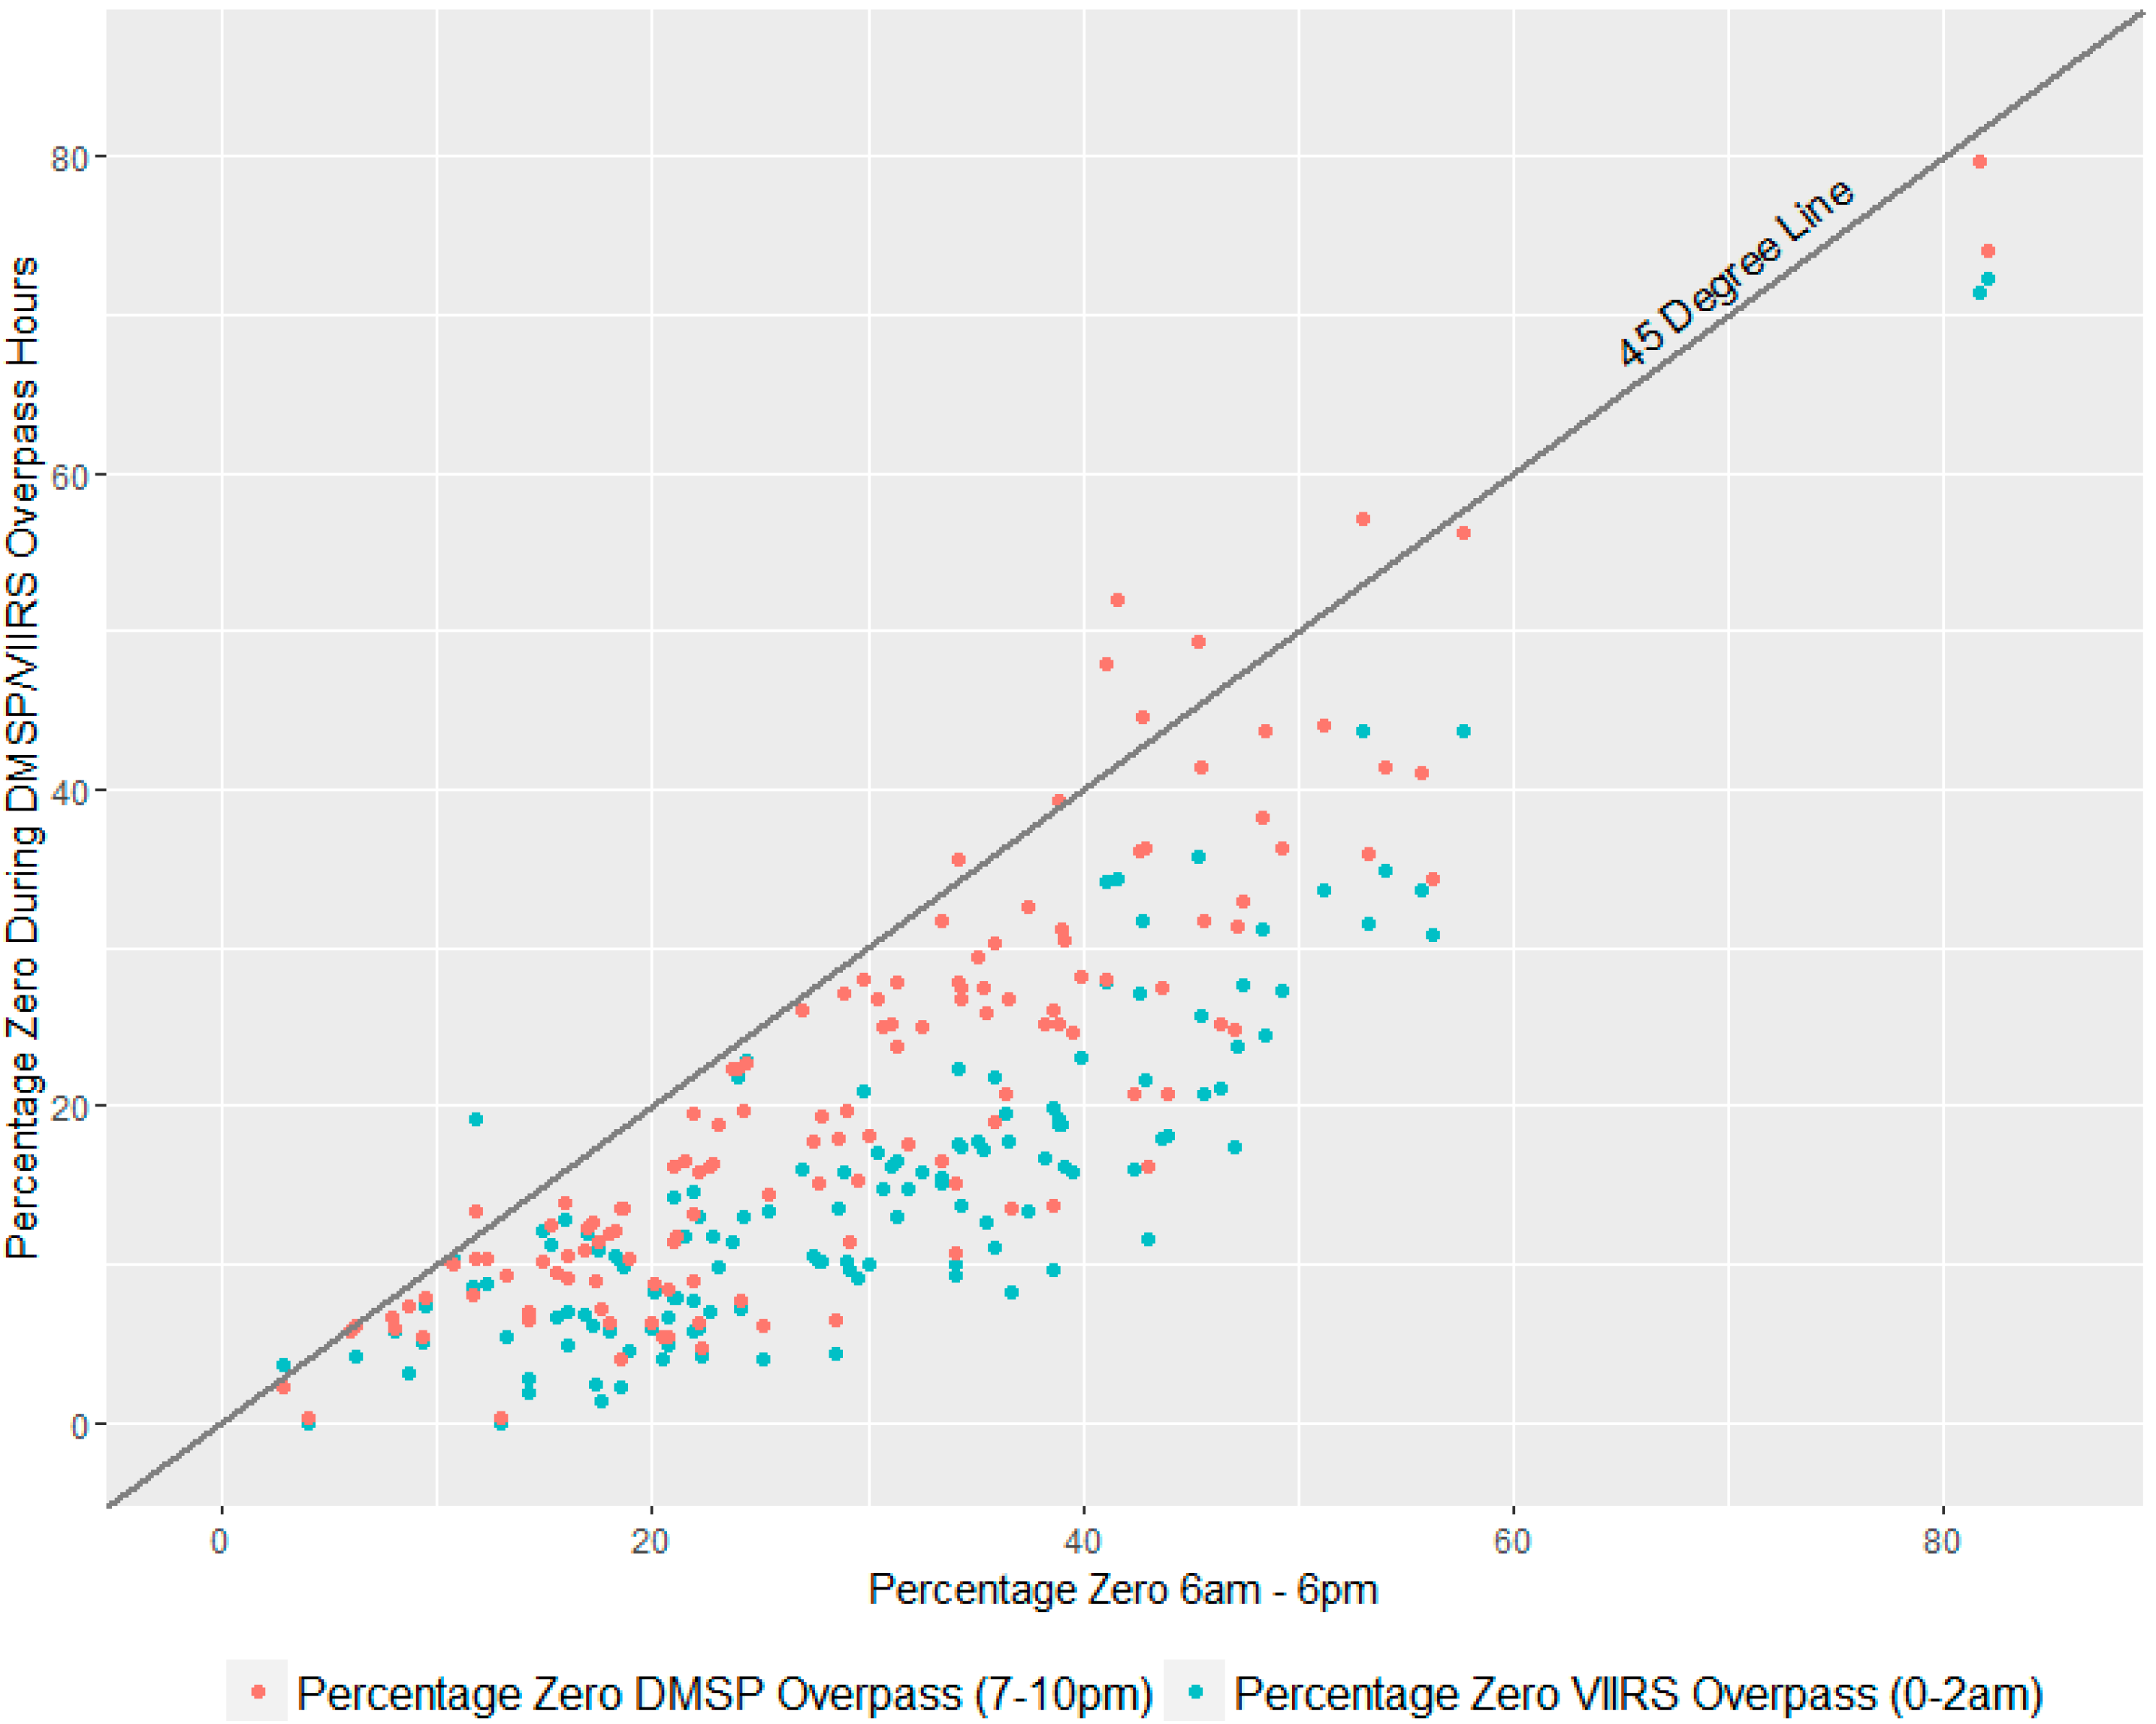
The percentage of zero feeder-line voltage readings during daytime hours (6 a.m.–6 p.m.), SNPP (i.e., VIIRS) overpass times (midnight–2 a.m.) and DMSP overpass times (7–10 p.m.) is plotted in Figure 3. Note that these readings are derived solely from MahaDiscom feeder-line voltage data for time periods that coincide with satellite overpass; we compare these readings to zero voltage readings derived from feeder-line voltage data for daytime hours. As can be seen, there is a high correlation between frequency of power outages during daytime hours and the frequency of outages during the satellite overpass times. This is true for both the SNPP and DMSP satellites.
The correlation between percentage zero voltages during daytime hours and during VIIRS overpass times is 0.85, and the correlation between daytime hours and DMSP overpass times is 0.88. These high correlations support the viability of using VIIRS night lights data to estimate overall electricity reliability. However, the location of nearly all the observations below the 45-degree line implies that night-lights-based estimates of reliability will likely overstate daytime reliability.

3.2. Individual Power Outages

The ability of our random forest classifier to identify individual, household-level electricity outages for our known data set is captured by the confusion matrix in Table 1. The overall rate of misclassification of the out-of-sample testing data (or error rate) is a very low 2.69%. The entries in the “No Lights” row indicate that for this dataset the classifier can perfectly identify locations with no electricity. The entries in the “Lights On” row indicate that instances of normal electricity supply conditions were misclassified as outages in less than 3% of all cases. The entries in the “Outage” row imply a much higher classification error rate for outages of 62%. This high error rate likely stems from the small number of actual outages in the data set used to train the random forest classifier (383 outages in a total of 11,162 observations), rendering it difficult to train the classifier to detect outages.
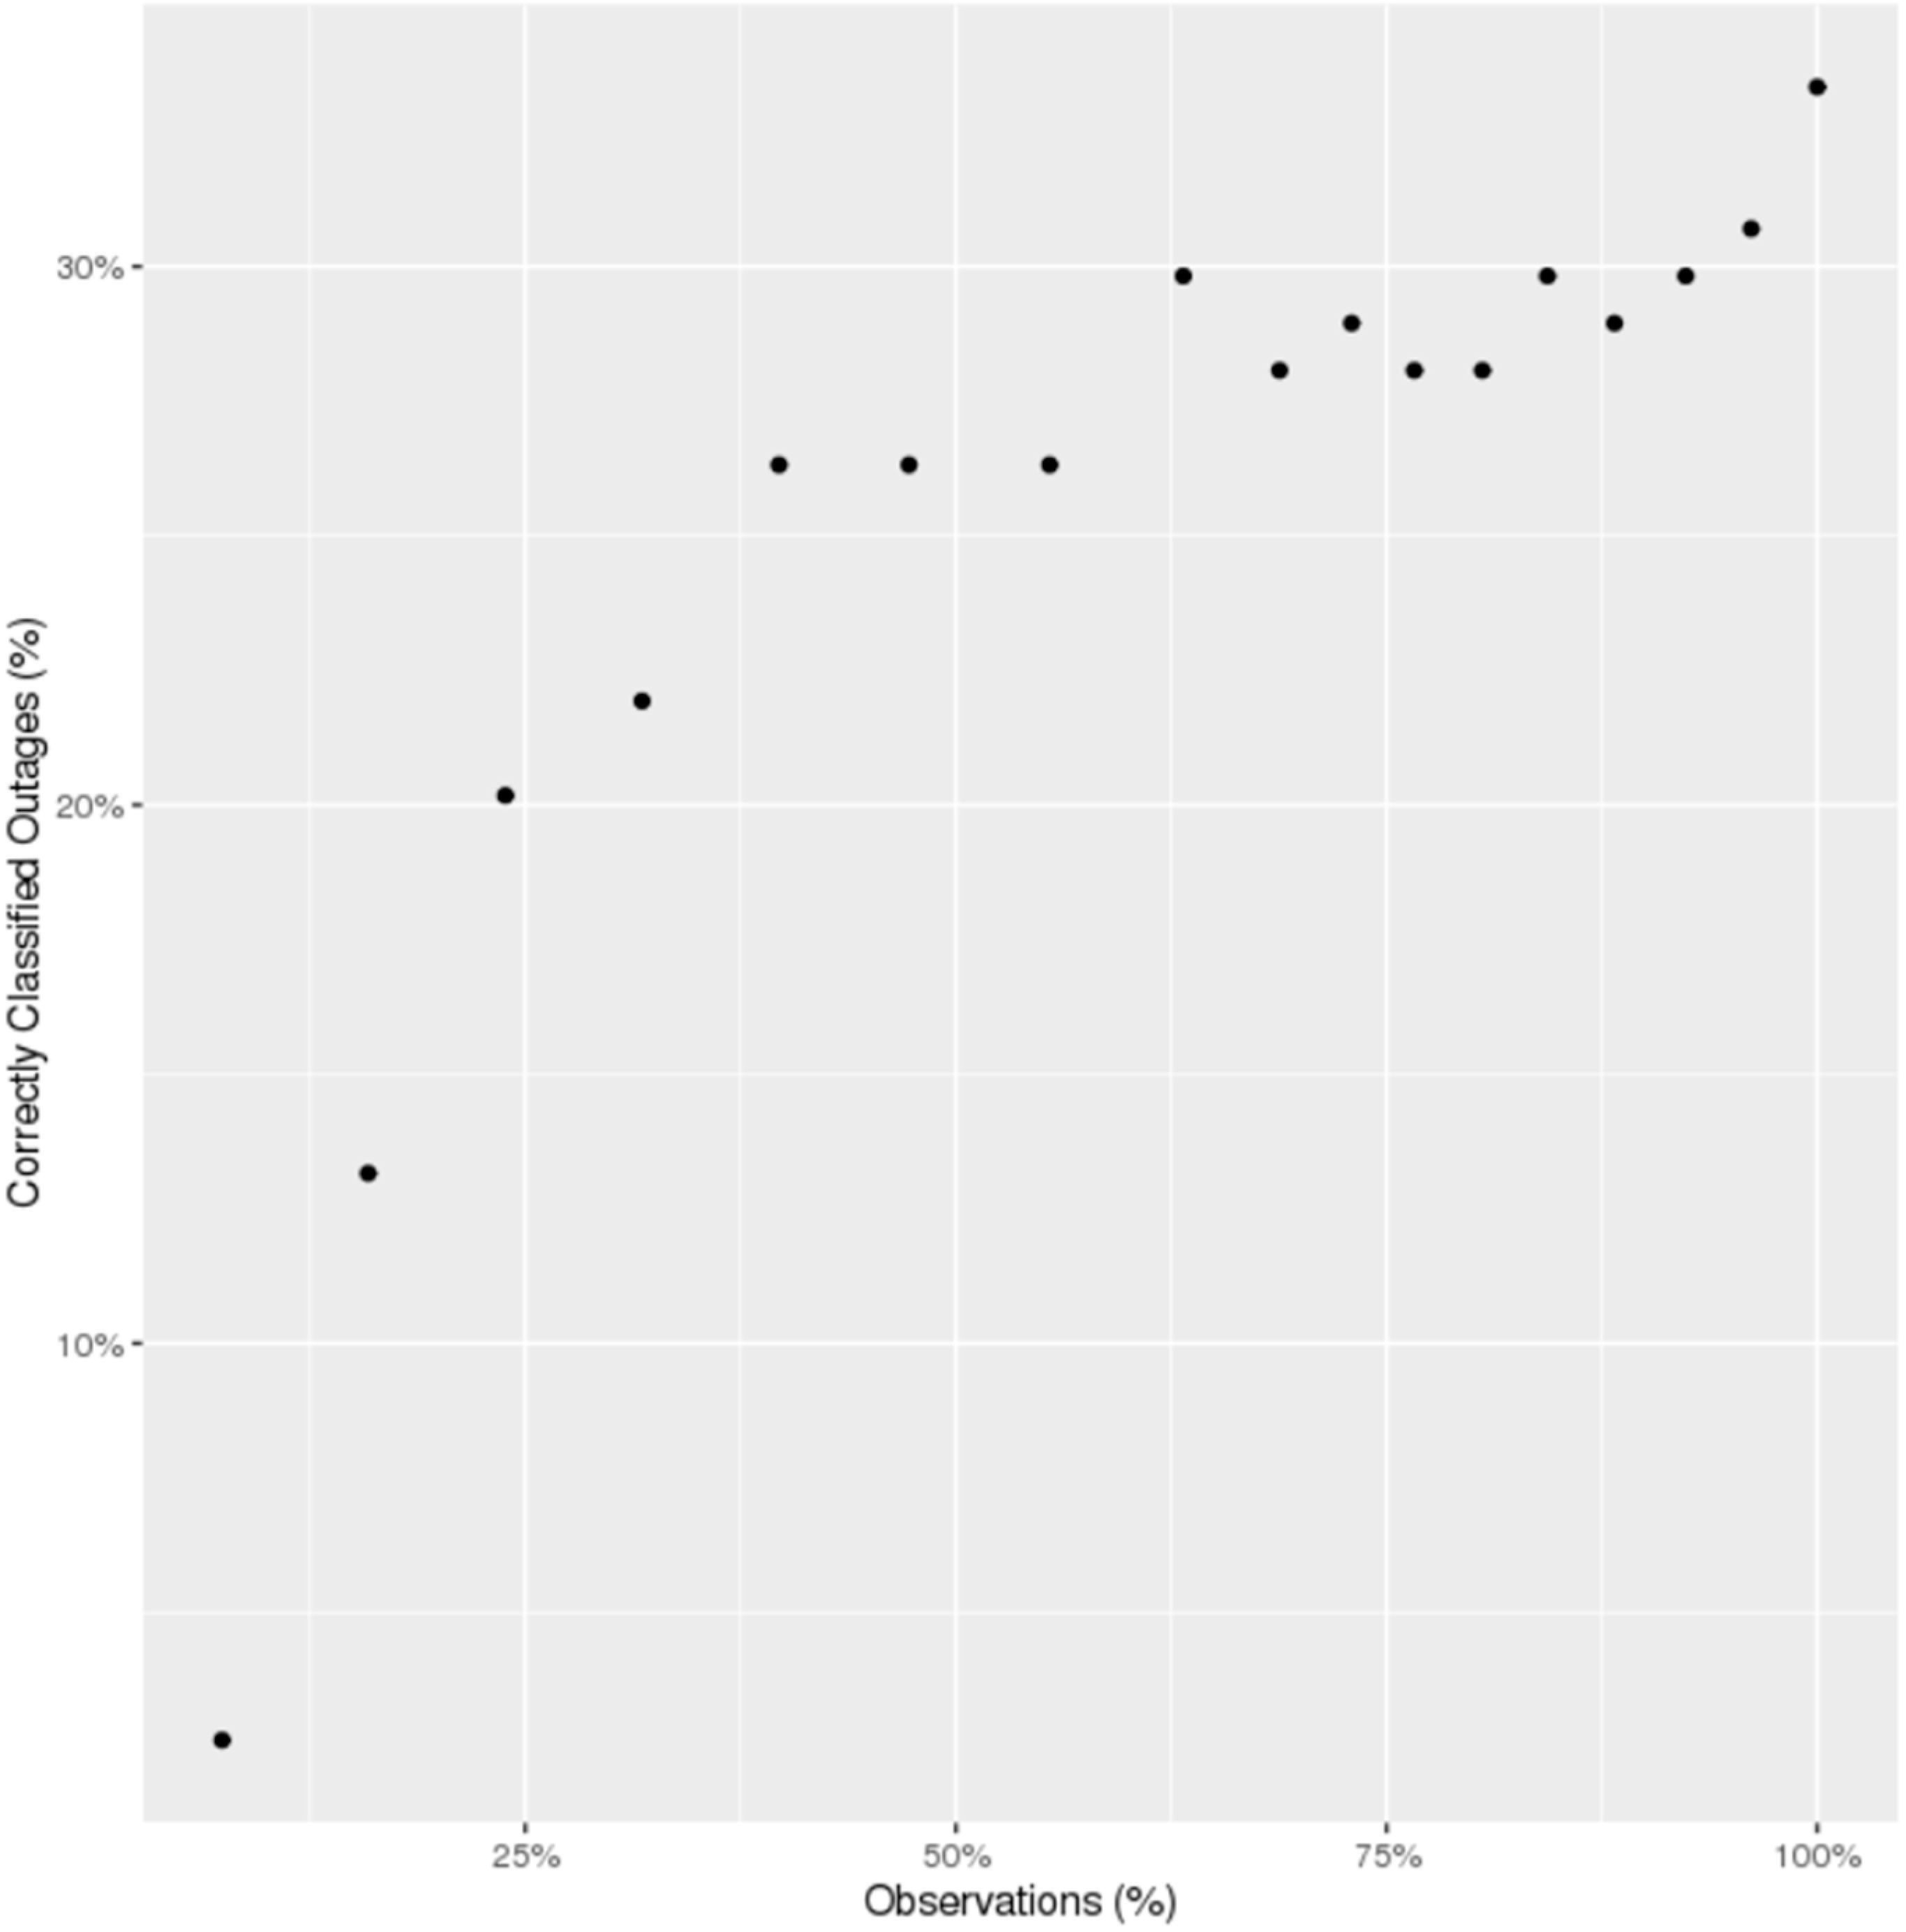
To test if additional observations improve the ability of the random forest to classify individual outages, we examine the effect of adding high quality observations for existing training sites. Figure 4 shows that starting in the middle of the monsoon season, increasing the number of observations in 20-day increments on either side of this midpoint, until all training data is included, improves the classification of individual outages.

3.3. Power Outage Rates

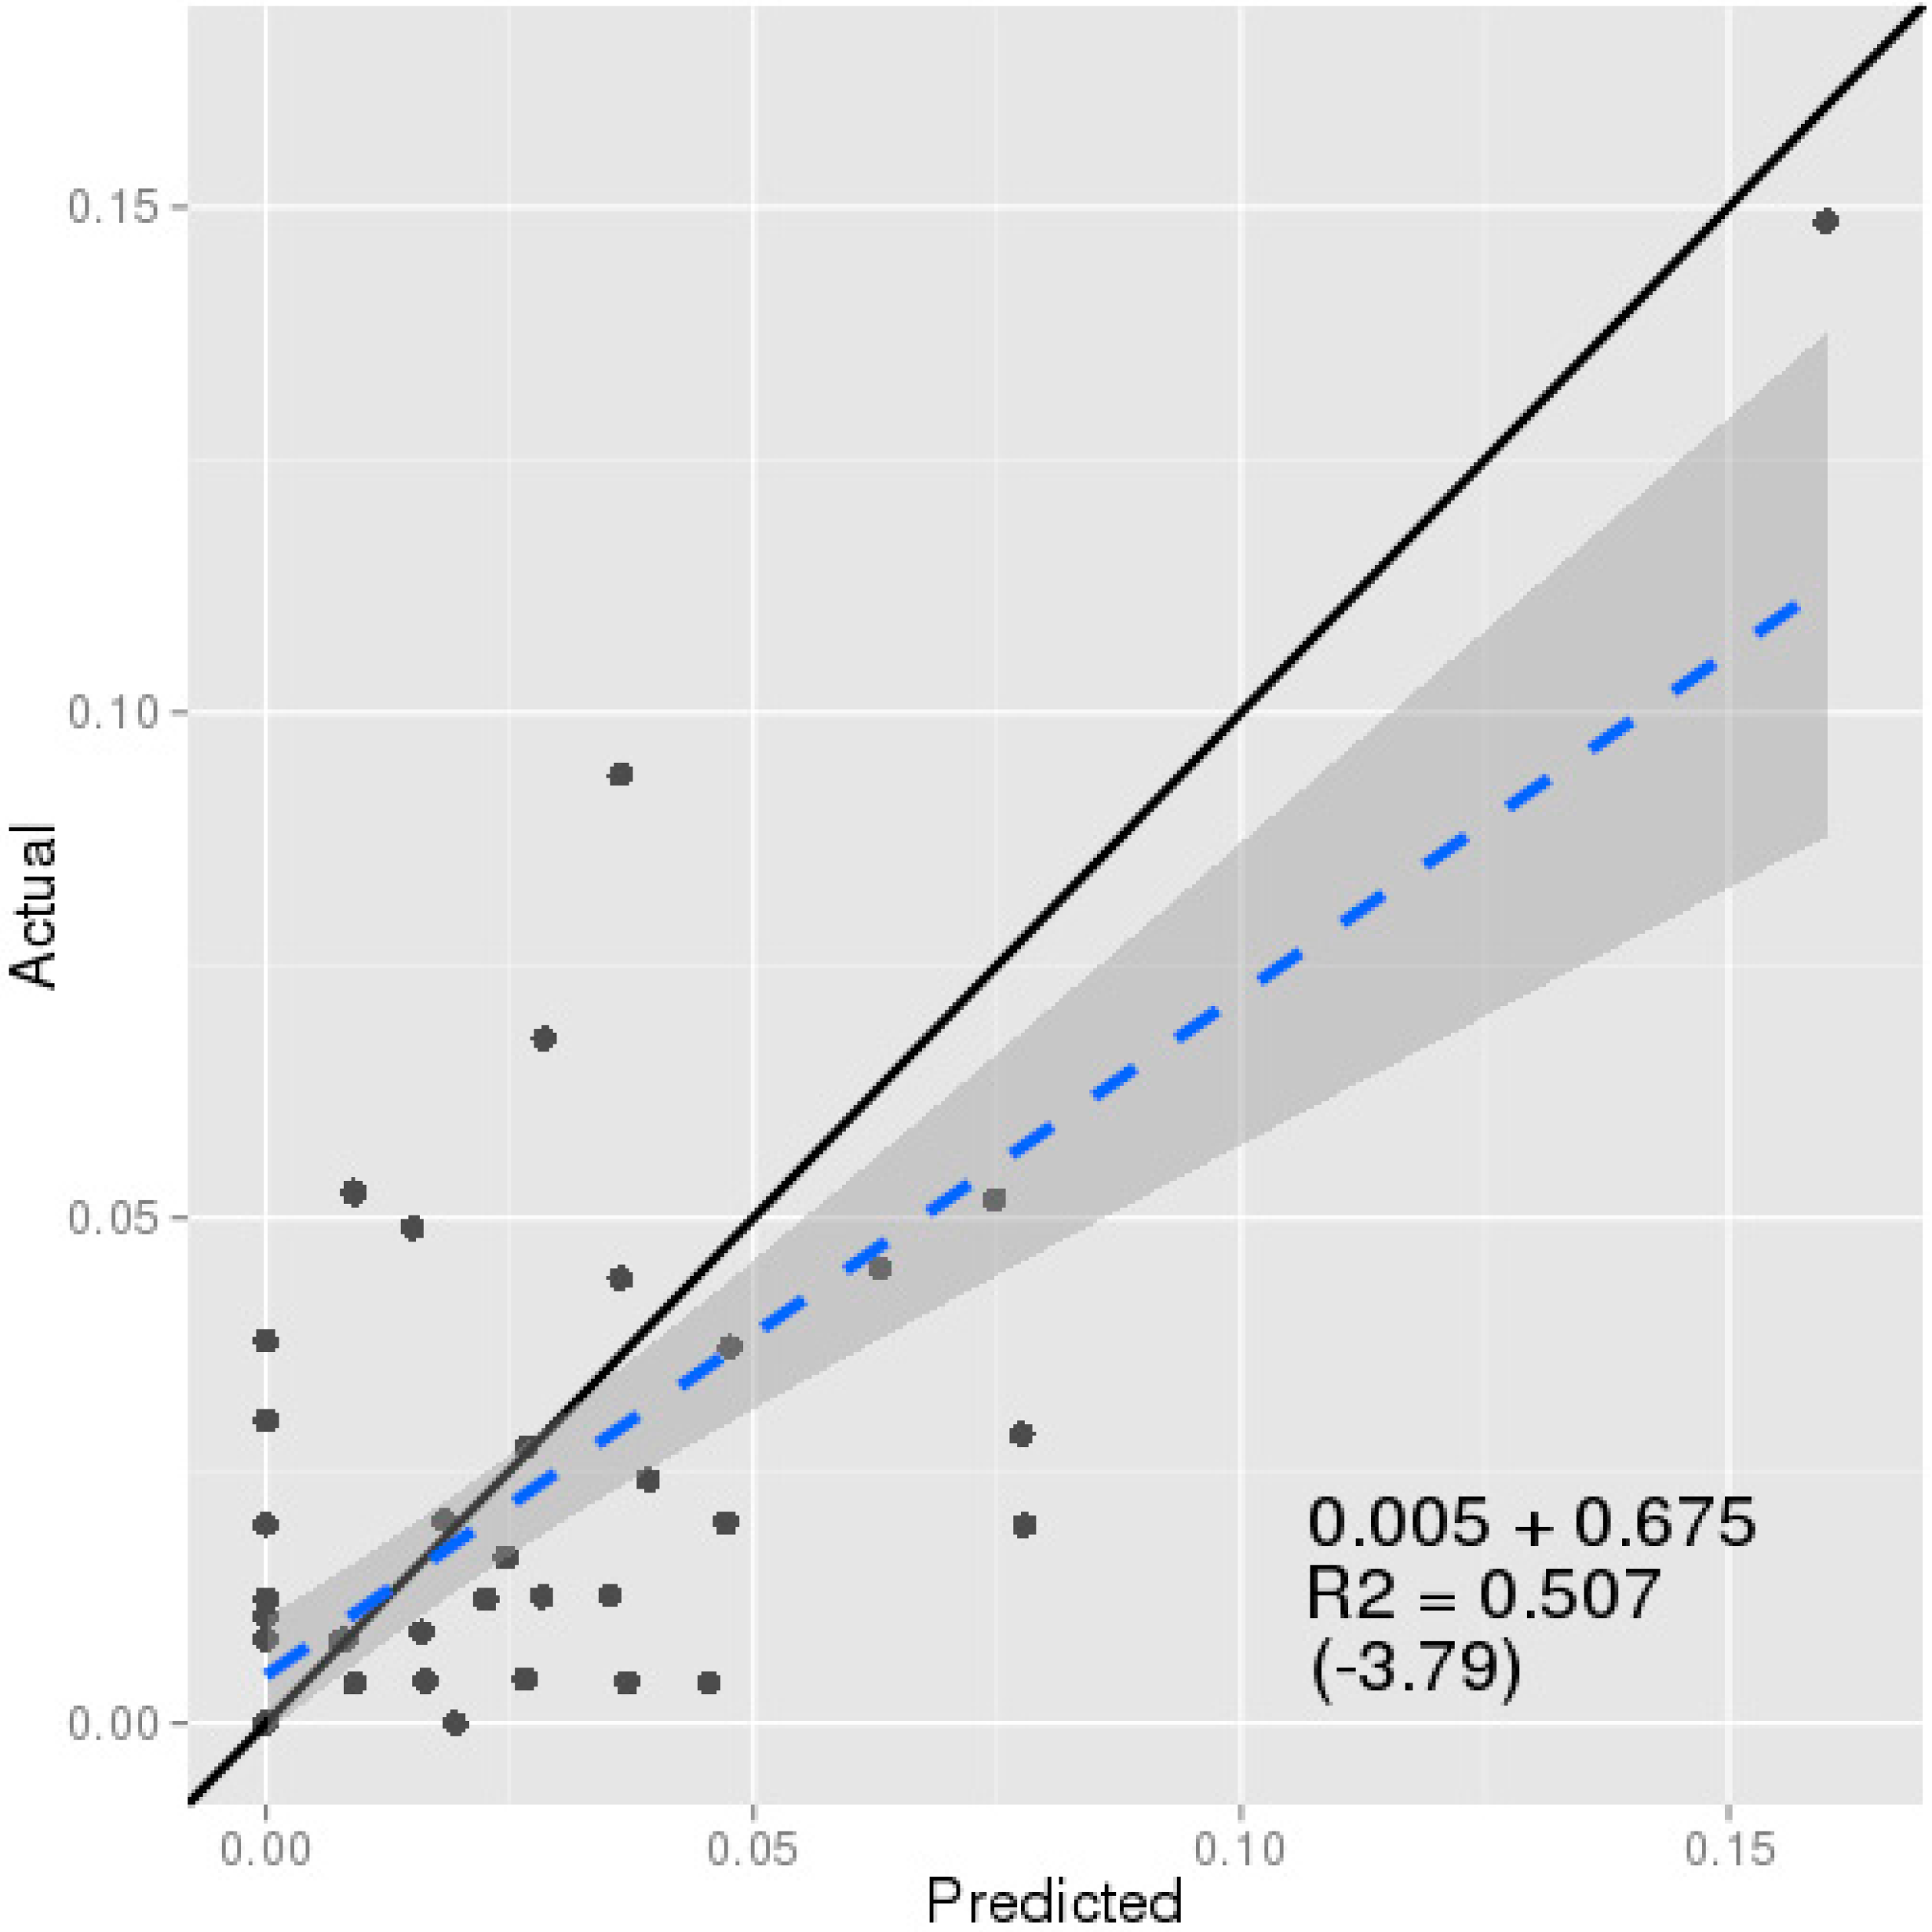
Our primary objective is to predict power reliability rather than individual power outages. Though our ability to predict individual outages is limited given the data at hand, our ability to predict power reliability with the same data is fairly good. Predicted power outage rates on cloud-free days during the period 1 January 2015 to 10 September 2015 at the time of satellite overpass were calculated using the random forest classifier in Equation (1) for the 39 locations in our known data set at which voltage is monitored. In Figure 5, these predicted rates are compared to actual outage rates (based on ESMI voltage readings at the time of satellite overpass). There is a reasonable correspondence between actual and predicted outage rates: the adjusted R2 for the best-fit line is 0.51. However, the slope of the estimated line is significantly different from 1 at the 1 percent level.
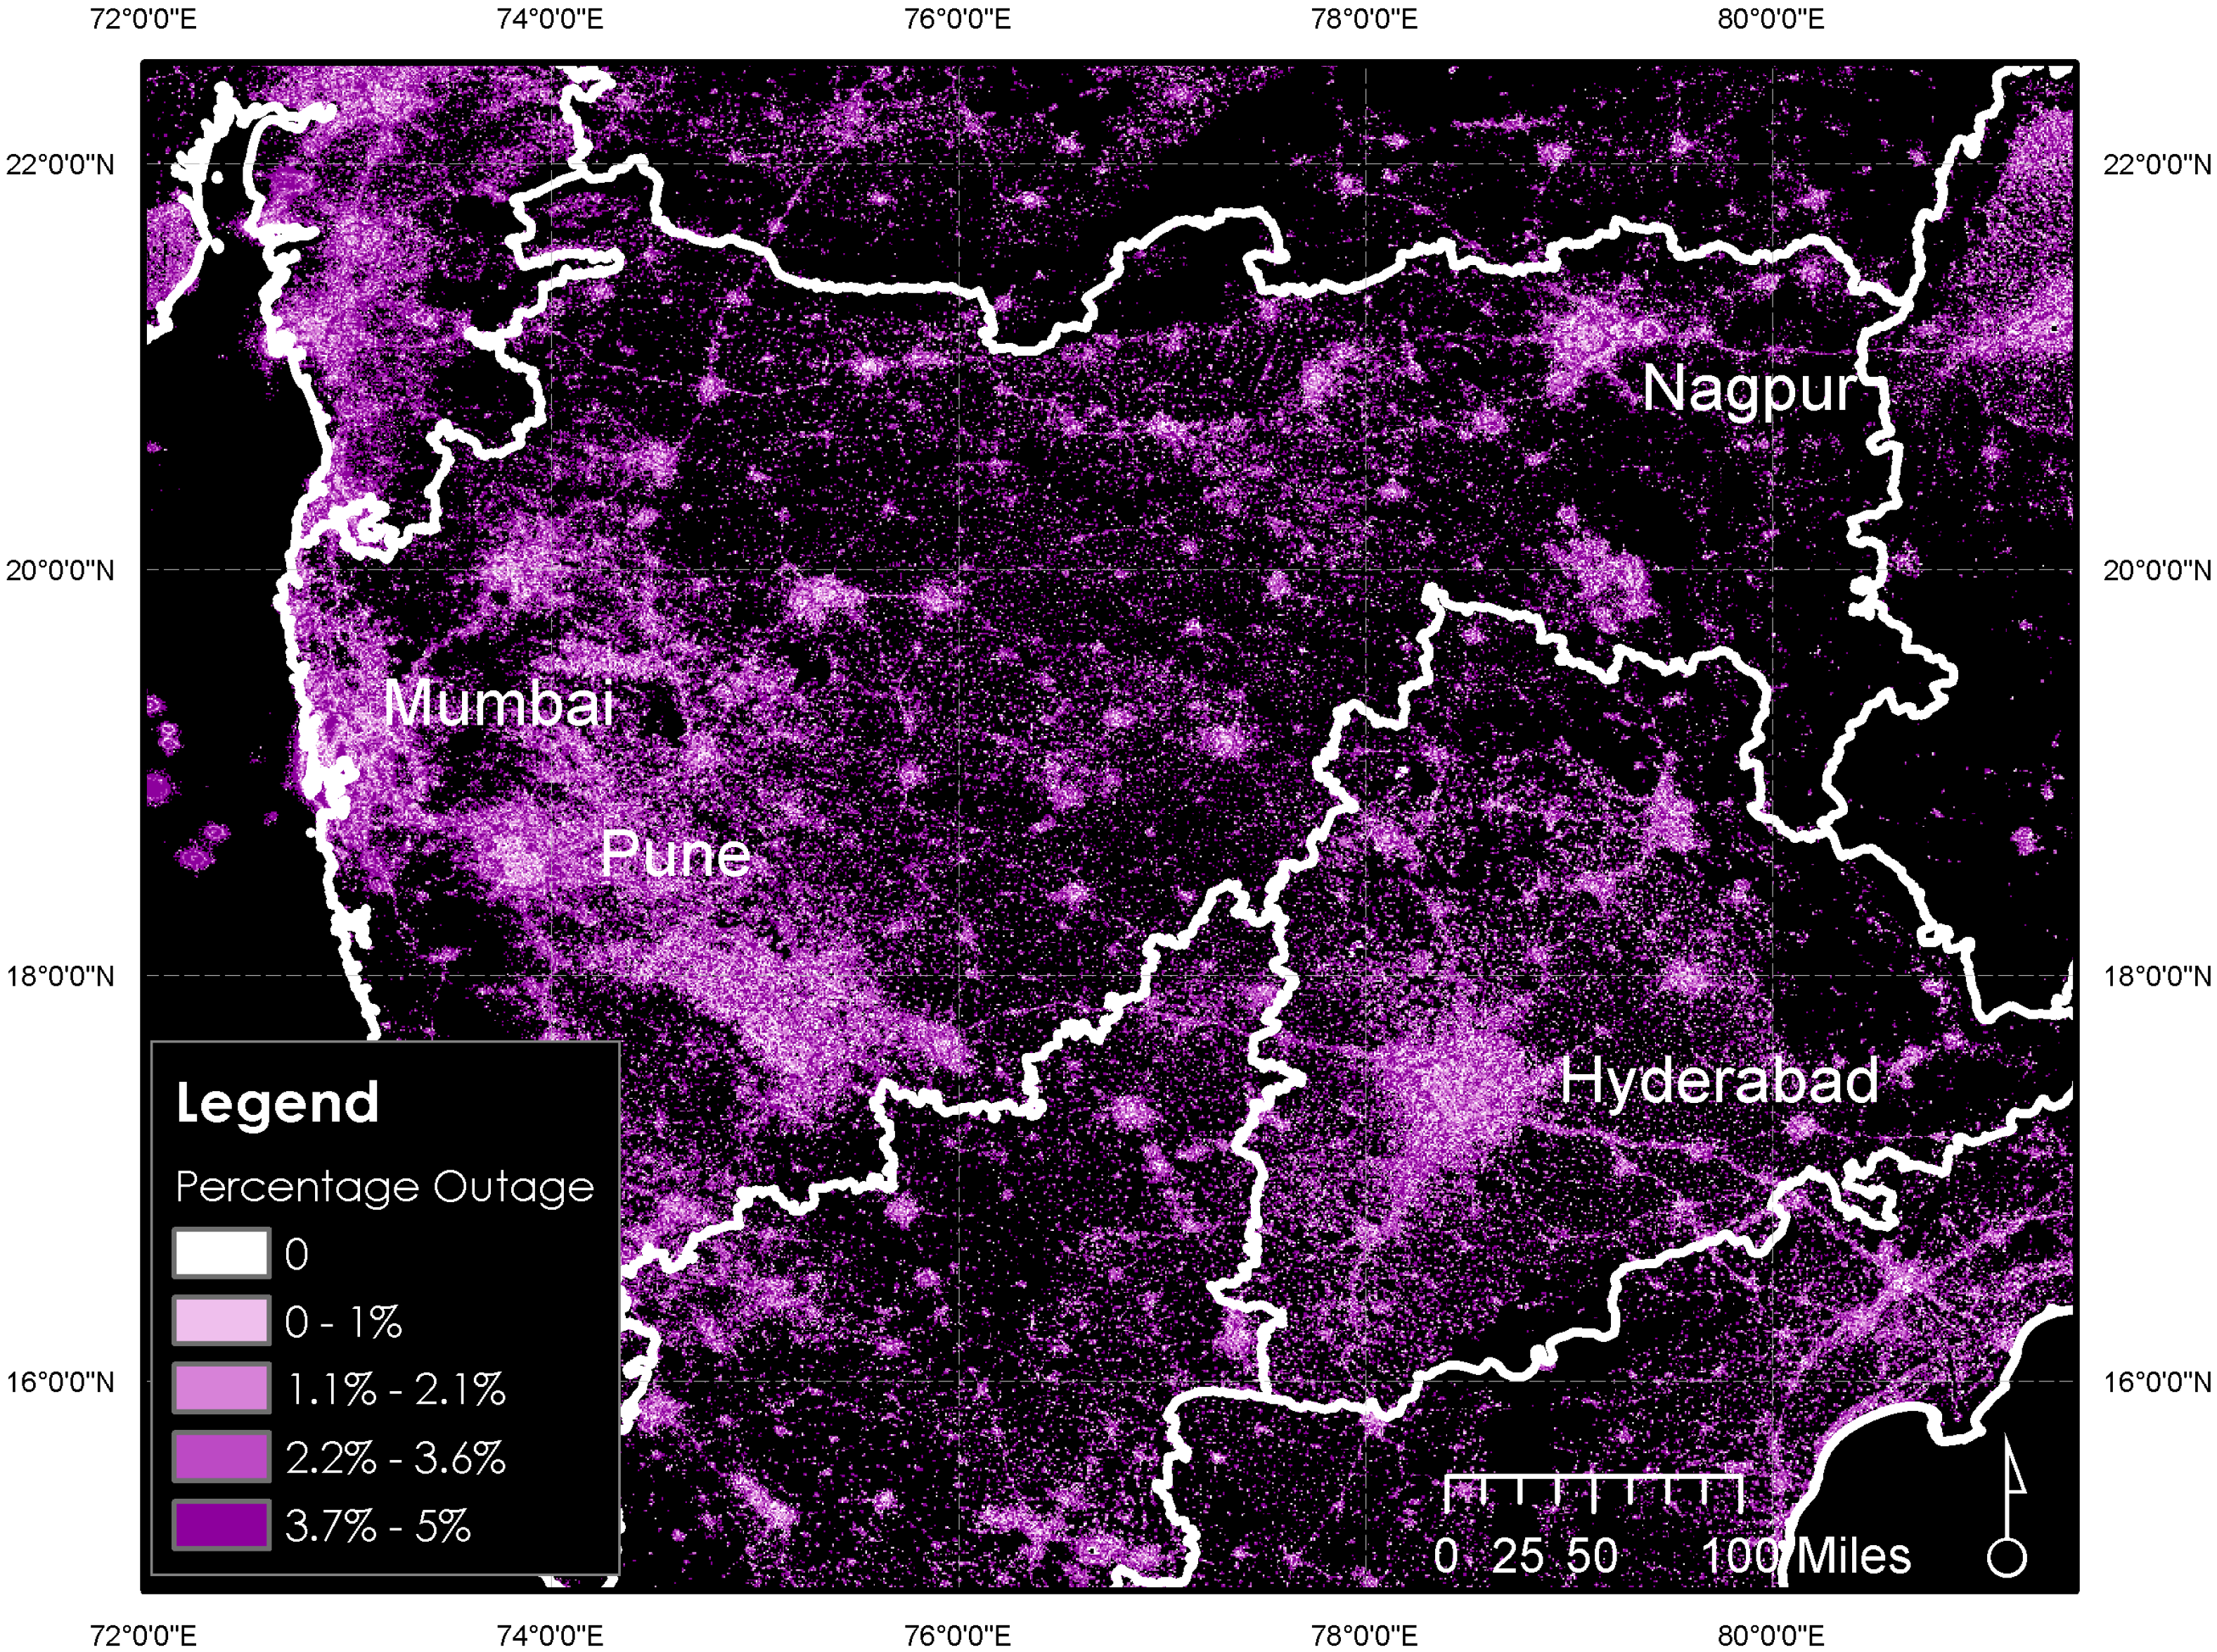
The random forest classifier is then used to estimate outage rates for each pixel of 750 m resolution for our entire study region based on the values of the predictors in Equation (1) for that pixel. The estimated outage rates on cloud-free days are presented in Figure 6. Pixels that are classified as having no electricity (or undetectably low levels of nighttime lights) are colored black. Given the very small size of the known data set used to train our classifier, the predictions in Figure 6 are best viewed as illustrative of the potential of our approach.

4. Discussion

The after midnight overpass time of the SNPP satellite can call into question the suitability of the VIIRS data to estimate electricity reliability. Although lighting peaks in the evening before 10 pm, recent studies using VIIRS DNB data reveal that a considerable amount of lighting is present even after midnight [12,13]. This is not surprising given that satellite images primarily capture streetlights and other forms of outdoor lighting that are likely to be present even after midnight.
The ability of the early-morning VIIRS data to provide representative estimates of electricity reliability is corroborated by our analysis of seven years’ worth of hourly feeder-line voltage data for Maharashtra. These data reveal a correlation of 0.85 between the frequency of outages during daytime hours (6 a.m.–6 p.m.) and the frequency during VIIRS overpass times (midnight–2 a.m.). Although this high correlation between daytime reliability and reliability during the VIIRS overpass times may not hold true everywhere, that it holds true in one of India’s largest states is encouraging (Maharashtra has a population of 112 million and an area of 308,000 km2). However, the downward bias of observations in Figure 3 indicates that the nighttime outage rates estimated here would understate the frequency of outages during daytime hours.
A further concern is that our estimates of reliability are derived solely from images on cloud-free days. Thus, these estimates may not be representative of reliability on non-cloud-free days. This concern is especially pointed if the fraction of cloud-free days for the time period of interest is small. In Maharashtra, as well as in much of India, the proportion of cloud-free days is low during the monsoon season, which runs from June through September, roughly. This affects our sample period, as a large portion of it coincides with the monsoon season of 2015. At the median, the proportion of cloud-free pixels for our study area is 42.70%, with a range extending from 0.33% in extremely small pockets along inland waterways and protected coastal inlets, up to 66.40% along the north eastern portion of the study area. An obvious question is whether reliability estimates derived from data for cloud-free days during other seasons would over- or under-estimate reliability during the monsoon season. Available evidence [21] indicates that power reliability during the monsoon season is typically higher than it is during other seasons, for two reasons: (1) increased availability of hydroelectric power due to rainfall; and (2) reduced demand for electric cooling given lower temperatures during the monsoon season. This implies that our cloud-free-day-based estimates of power reliability would under-estimate reliability during the monsoon season.
Studies of night lights to date have relied almost entirely on DMSP-OLS data. These data have been used in a wide variety of applications (see [22] for a survey). However, for estimating electricity reliability, the newer VIIRS DNB data are demonstrably superior. The VIIRS sensor has: better low light detection; higher spatial resolution (750 m vs. 5 km); greater radiometric sensitivity (in this context, radiometric sensitivity refers to the ability of a satellite sensor to discriminate between different amounts of light emitted or reflected from the earth’s surface.); in-flight calibration that renders image data comparable over time; easier identification of burning and gas flares; and it does not suffer from saturation over brightly lit urban areas [12,13]. The sole advantage of the DMSP-OLS data is that there is a longer time series available. DMSP-OLS data are available from 1992; VIIRS data are available from November 2011.
The voltage monitoring data being collected by the Indian NGO Prayas as part of its Electricity Supply Monitoring Initiative introduced in late 2014 provides novel national-level data that can be used to validate estimates of electricity reliability derived from satellite data. Voltage is currently monitored at 205 locations in 17 states. A few hundred more locations will be added in the coming year. This rapidly growing set of voltage monitoring data will allow for a much larger training dataset in the coming years.
The findings of our preliminary efforts to estimate electricity reliability using VIIRS data are encouraging on the whole. In terms of our secondary objective of using the VIIRS data to identify household-level outages, our random forest classifier yields an overall misclassification error of 2.69%. This low out-of-sample error rate reflects the perfect classification of pixels without electricity (1741 of 1741) and the near-perfect classification of cells with normally operating electricity (1689 of 1737) (see Table 1). This points to the ability to apply the approach used here to address issues such as rural electrification and urban land use classification [23]. This said, the classification error rate for electricity outages was 62%. This high error rate stems, at least in part, from the small number of outages in the known data set used to train the random forest classifier (383 outages in a total of 11,162 observations). Dramatically increasing the number of observations used for training is an ongoing objective of our research. A larger known data set, particularly with more observations of outages outside the monsoon season, would almost certainly improve the error rates of the classifier (see Figure 4). This speaks to the importance of increasing not just the quantity of data, but also its quality.
Even with a much larger data set, there are a number of factors that could artificially increase intra-pixel daily variation in DNB radiance and result in misclassification of individual power outages. These factors include: (1) geolocation uncertainty of VIIRS DNB, which may range from 249 m (nadir) to 1141 m (edge of swath) [24]; (2) uncertainty in DNB radiometric error (8.9%) [24]; (3) atmospheric effects, such as scattering loss from aerosols, and other sources of airglow [25]; and (4) undetected thin cirrus and other clouds. This may be particularly true in dense urban areas where smaller scale outages may be masked by saturation of the sensor and/or air glow.
In terms of our primary objective of estimating electricity reliability, our approach shows promise, despite the small temporal and spatial extent of this preliminary study. We find a correlation between predicted and actual outage rates of over 0.5. The less than unit slope of the fitted line indicates that power outage rates are, on average, underestimated. Once again, use of a much larger training data set should improve the ability of our approach to estimate outage rates. The power of our approach is illustrated by Figure 6, which presents estimates of outages rates derived from our classifier for an entire state.

5. Conclusions

Despite the importance of reliable electricity for households, firms and public health, information on electricity reliability is not available for much of the developing world. We explore the use of VIIRS nighttime lights data, together with data from household voltage meters, to estimate electricity reliability in Western India. We employ a machine learning approach to identify power outages at the pixel level and to estimate the frequency of power outages, using data from the first nine months of 2015.
One concern is that the frequency of power outages during the after midnight satellite overpass time might not reflect their frequency during the day, when outages are disruptive to many economic activities. To evaluate this concern, we obtained seven years of hourly feeder line voltage data for the state of Maharashtra and compared the frequency of power outages for different periods during a day. We found a high correlation (R2 = 0.85) between the frequency of outages during the satellite overpass time and during the day.
Our machine learning algorithm successfully identified pixels without electricity, pixels with normal electricity supply, and to a lesser degree, pixels with known outages. The overall classification error rate was quite low (<3%), but the error rate for detecting individual outages was much higher (62%). This is likely due to the very short period of training data available and the limited number of outages observed at the household level (383 outages in a total of 11,162 observations). Our machine learning algorithm was able to estimate the frequency of power outages reasonably well: we obtained an R2 of 0.51 between observed and predicted outage rates. The results of this study should be viewed as preliminary and suggestive, but we also find them encouraging for further study. Future efforts might focus on expanding the training data set, better preprocessing, improved labeling of stray lunar light, and refinement of the classification algorithm.

Acknowledgments

We thank the Development Research Group of the World Bank for supporting this research, and Prayas for providing access to the Electricity Supply Monitoring Initiative data. Aaditya Dar was instrumental in enabling us to make use of the MahaDiscom feeder-line voltage data. We are also grateful to Amjad Khan, Chuanhao Lin, Songlin Li, Cheng Xu, and Ranvir Malik for their research assistance.

Author Contributions

M.L.M., E.M. and A.M. conceived and designed the experiments; M.L.M., E.M. and A.M. performed the experiments; M.L.M., E.M. and A.M. analyzed the data; and M.L.M., E.M. and A.M. wrote the paper.

Conflicts of Interest

The authors declare no conflict of interest.

References

  1. Fisher-Vanden, K.; Mansur, E.T.; Wang, Q.J. Electricity shortages and firm productivity: Evidence from China’s industrial firms. J. Dev. Econ. 2015, 114, 172–188. [Google Scholar] [CrossRef]
  2. Alam, M. Coping with Blackouts: Power Outages and Firm Choices. Ph.D. Thesis, Yale University, New Haven, CT, USA, 2014. [Google Scholar]
  3. Allcott, H.; Collard-Wexler, A.; O’Connell, S.D. How do electricity shortages affect productivity? Evidence from India. Am. Econ. Rev. 2016, 106, 587–624. [Google Scholar] [CrossRef]
  4. Zuberi, J. Estimating the Cost of Power Outages for Large Scale Manufacturing Firms. University of California: Berkeley, CA, USA, Unpublished work. 2012. [Google Scholar]
  5. Anderson, G.B.; Bell, M.L. Lights out: Impact of the August 2003 power outage on mortality in New York, NY. Epidemiology 2012, 23, 189. [Google Scholar] [CrossRef] [PubMed]
  6. Burlando, A. Transitory shocks and birth weights: Evidence from a blackout in Zanzibar. J. Dev. Econ. 2014, 108, 154–168. [Google Scholar] [CrossRef]
  7. Chakravorty, U.; Pelli, M.; Marchand, B.U. Does the quality of electricity matter? Evidence from rural India. J. Econ. Behav. Organ. 2014, 107, 228–247. [Google Scholar] [CrossRef]
  8. Fetzer, T.; Pardo, O.; Shanghavi, A. An Urban Legend?! Power Rationing, Fertility and Its Effects on Mothers. Available online: http://cep.lse.ac.uk/pubs/download/dp1247.pdf (accessed on 24 May 2016).
  9. Seetharam, D.P.; Agrawal, A.; Ganu, T.; Hazra, J.; Rajaraman, V.; Kunnath, R. Hidden costs of power cuts and battery backups. In Proceedings of the Fourth International Conference on Future Energy Systems, ACM, Berkeley, CA, USA, 22–24 May 2013; pp. 39–50.
  10. Steinbuks, J.; Foster, V. When do firms generate? Evidence on in-house electricity supply in Africa. Energy Econ. 2010, 32, 505–514. [Google Scholar] [CrossRef]
  11. Guttikunda, S.K.; Jawahar, P. Application of SIM-air modeling tools to assess air quality in Indian cities. Atmos. Environ. 2012, 62, 551–561. [Google Scholar] [CrossRef]
  12. Elvidge, C.D.; Baugh, K.E.; Zhizhin, M.; Hsu, F.-C. Why VIIRS data are superior to DMSP for mapping nighttime lights. Proc. Asia-Pac. Adv. Netw. 2013, 35, 62–69. [Google Scholar] [CrossRef]
  13. Kyba, C.; Garz, S.; Kuechly, H.; de Miguel, A.S.; Zamorano, J.; Fischer, J.; Hölker, F. High-resolution imagery of Earth at night: New sources, opportunities and challenges. Remote Sens. 2014, 7, 1–23. [Google Scholar] [CrossRef]
  14. MahaDiscom Hourly Feeder Load Information. Available online: http://www.mahadiscom.com/feeder-hourly-data/hourly-feeder-load-information.shtm (accessed on 24 May 2016).
  15. Web LAADS Level Land Atmosphere Archive and Distribution System. Available online: https://earthdata.nasa.gov/about/daacs/daac-laads (accessed on 24 May 2016).
  16. Prayas Electricity Monitoring Initiative. Available online: http://www.watchyourpower.org/the_initiative.php (accessed on 24 May 2016).
  17. Varian, H.R. Big data: New tricks for econometrics. J. Econ. Perspect. 2014, 28, 3–27. [Google Scholar] [CrossRef]
  18. Breiman, L. Random forests. Mach. Learn. 2001, 45, 5–32. [Google Scholar] [CrossRef]
  19. Kulkarni, S.; Prayas Energy Group, Maharashtra, India. Personal communication, 2015.
  20. Meyer, D.; Hornik, K.; Weingessel, A.; Chang, C.; Lin, C. Package e1071. Available online: https://cran.r-project.org/web/packages/e1071/e1071.pdf (accessed on 24 May 2016).
  21. Central Electricity Authority of India. Load Generation Balance Report 2014–2015; Central Electricity Authority: New Delhi, India, 2015.
  22. Huang, Q.; Yang, X.; Gao, B.; Yang, Y.; Zhao, Y. Application of DMSP/OLS nighttime light images: A meta-analysis and a systematic literature review. Remote Sens. 2014, 6, 6844–6866. [Google Scholar] [CrossRef]
  23. Zhang, Q.; Seto, K.C. Can night-time light data identify typologies of urbanization? A global assessment of successes and failures. Remote Sens. 2013, 5, 3476–3494. [Google Scholar] [CrossRef]
  24. Liao, L.B.; Weiss, S.; Mills, S.; Hauss, B. Suomi NPP VIIRS day-night band on-orbit performance. J. Geophys. Res. Atmos. 2013, 118, 12705–12718. [Google Scholar] [CrossRef]
  25. Wang, J.; Aegerter, C.; Xu, X.; Szykman, J.J. Potential application of VIIRS Day/Night Band for monitoring nighttime surface PM 2.5 air quality from space. Atmos. Environ. 2016, 124, 55–63. [Google Scholar] [CrossRef]
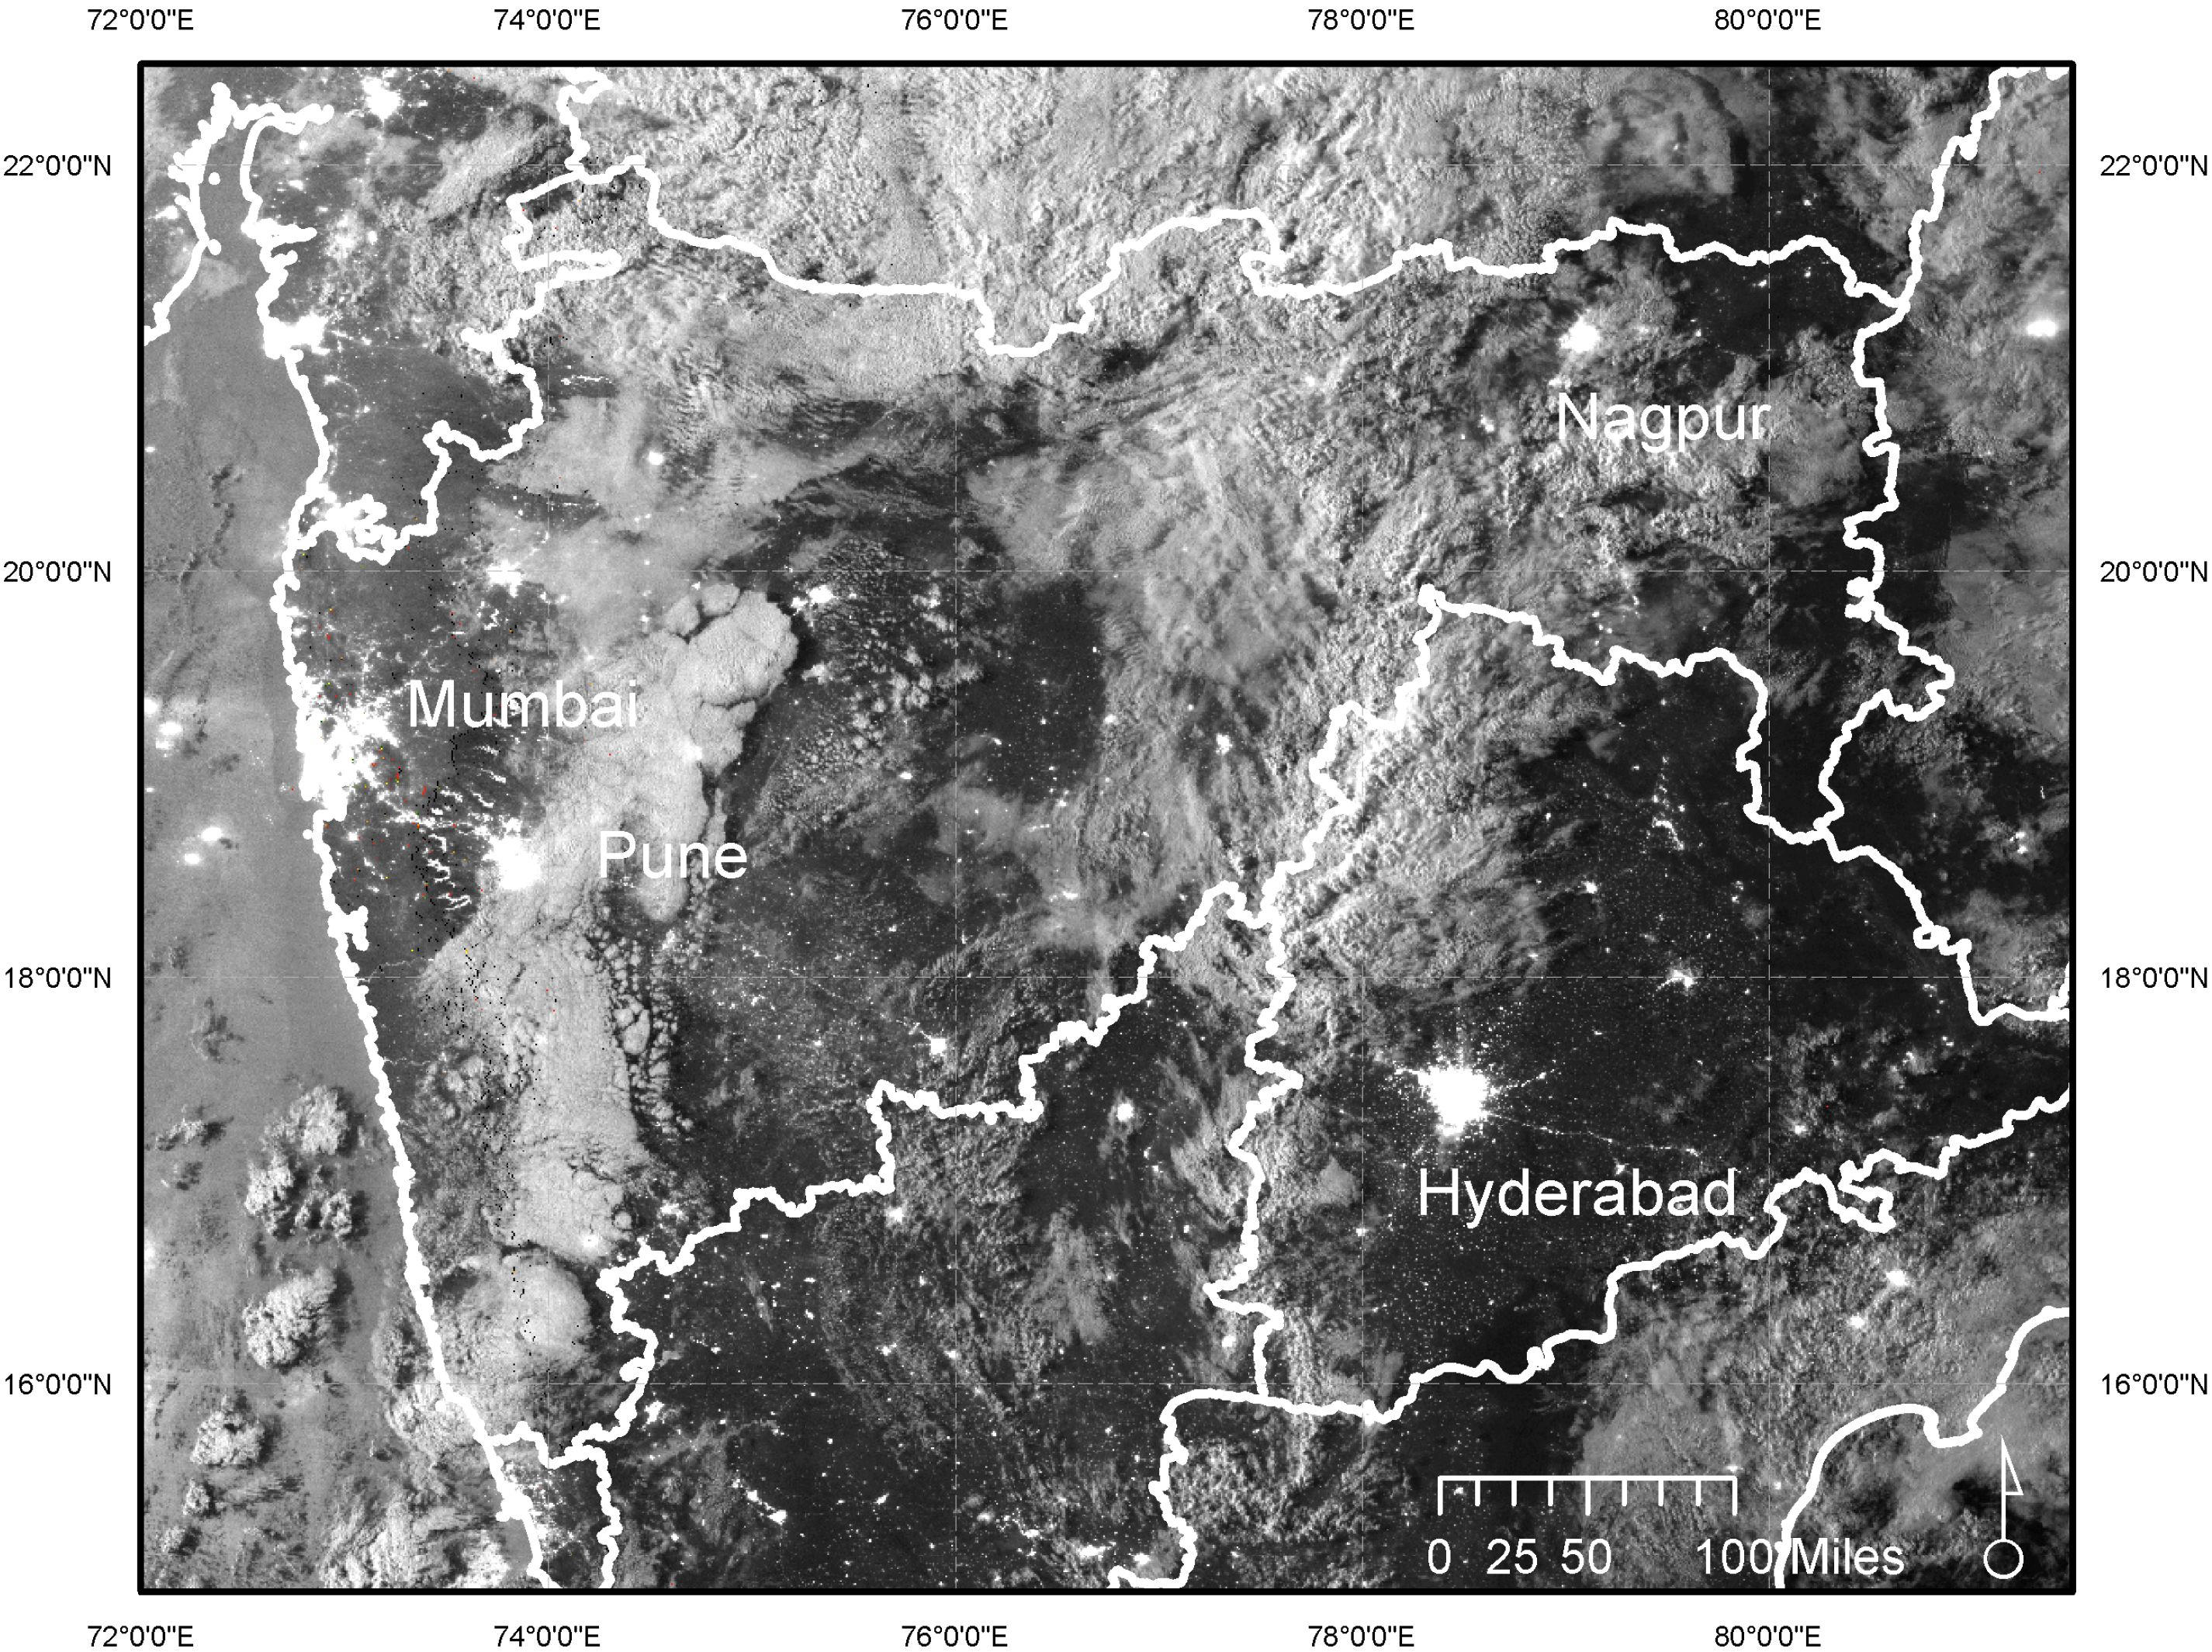
Figure 1. Example of raw day/night band (DNB) radiance values for Maharashtra and adjacent states. Levels of reflected and emitted light detected by the DNB (greyscale), with state boundaries highlighted (white lines), image taken 1 January 2015.
Remotesensing 08 00711 g001
Figure 2. Daily DNB radiance values for Saharkar Nagar for the period 1 January 2015 to 9 September 2015. Time series plot of observed radiance values (black dots) for the study period.
Remotesensing 08 00711 g002
Figure 3. Relationship between daytime and nighttime zero voltage frequency on feeder lines for 137 Divisions in Maharashtra, 2007–2013. Observations of day and nighttime outage rates presented for the DMSP overpass time (red), and the VIIRS sensor overpass time (blue), with a 45-degree line (black line).
Remotesensing 08 00711 g003
Figure 4. Model sensitivity to increased number of observations from all sites. The percentage of correctly classified individual outages as a function of the number of observations used for classification, starting with observations at the peak of monsoon season.
Remotesensing 08 00711 g004
Figure 5. Predicted versus actual outage rates for inhabited locations. Observations of predicted and actual outage rates (black dots), with 45-degree line (solid), best-fit regression line (dashed blue), 95% confidence interval (grey shade), regression results, and Student’s t-test statistic for equality of slope to 1 in parentheses.
Remotesensing 08 00711 g005
Figure 6. Estimates of electricity outage rates for Maharashtra and surrounding states. Outage rates for cloud-free days are presented on a low to high scale (white to purple), with state boundaries highlighted (white lines).
Remotesensing 08 00711 g006
Table 1. Confusion matrix for out-of-sample testing data, actual and predicted outages.
Predicted
No LightsLights OnOutage
ActualNo Lights174100
Lights On0173748
Outage08331
Overall Error Rate: 2.69%