Article

Individual Building Extraction from TerraSAR-X Images Based on Ontological Semantic Analysis

1
School of Electronic Information, Wuhan University, Wuhan 430072, China
2
Collaborative Innovation Center of Geospatial Technology, Wuhan University, Wuhan 430079, China
*
Author to whom correspondence should be addressed.
Remote Sens. 2016, 8(9), 708; https://doi.org/10.3390/rs8090708
Submission received: 24 April 2016 / Revised: 20 August 2016 / Accepted: 23 August 2016 / Published: 27 August 2016

Abstract

:
Accurate building information plays a crucial role for urban planning, human settlements and environmental management. Synthetic aperture radar (SAR) images, which deliver images with metric resolution, allow for analyzing and extracting detailed information on urban areas. In this paper, we consider the problem of extracting individual buildings from SAR images based on domain ontology. By analyzing a building scattering model with different orientations and structures, the building ontology model is set up to express multiple characteristics of individual buildings. Under this semantic expression framework, an object-based SAR image segmentation method is adopted to provide homogeneous image objects, and three categories of image object features are extracted. Semantic rules are implemented by organizing image object features, and the individual building objects expression based on an ontological semantic description is formed. Finally, the building primitives are used to detect buildings among the available image objects. Experiments on TerraSAR-X images of Foshan city, China, with a spatial resolution of 1.25 m × 1.25 m, have shown the total extraction rates are above 84%. The results indicate the ontological semantic method can exactly extract flat-roof and gable-roof buildings larger than 250 pixels with different orientations.

Graphical Abstract

1. Introduction

With a significant amount of data available from the new very high resolution (VHR) SAR sensors, for example Cosmo-SkyMed and TerraSAR-X [1], more detailed urban information can be employed for various important application scenarios, such as the monitoring of changes in urban areas and assessing natural disasters [2,3]. Building extraction is a key step in urban information analysis from VHR SAR images. Since SAR sensors can scan the Earth’s surface irrespective of weather and sunlight conditions, SAR plays an important role in the field of urban observation [4]. Moreover, SAR images contain important information that is complementary to other sensor data [5]. Therefore, extracting spatial and geometric structure information of buildings from VHR SAR images is a highly attractive problem [2,6]. However, complex environmental factors [4,7], different building orientations [4,8] and their heterogeneity [9], speckle [10], and acquisition geometry, made building extraction from SAR data an open challenge [2,11].
Most studies published in recent years about building extraction from SAR images mainly rely on the availability of the interferometric SAR (InSAR) data [12,13], multi-aspect SAR data [14], stereoscopic data or some other ancillary data like GIS or optical images [11]. For example, Soergel et al. [12] presented an InSAR approach for building detection, which is based on detection of strong scattering lines and shadowing of elevated buildings. Thiele et al. [14] proposed an approach for building detection in orthogonal multi-aspect InSAR images, based on edge and foot-print detection. An automatic method for extracting buildings from multi-aspect polarimetric SAR images was presented by Xu and Jin [15]. Sportouche et al. [11] proposed techniques for 2-D building footprint reconstruction from high-resolution optical and SAR spaceborne images. A method for extracting buildings from stereoscopic spotlight SAR images was presented by Simonetto et al. [16]. Because of the complexity of data acquisition and usage, these methods obviously cause limitations in some application scenarios such as emergency response or locations with restricted data [17].
Since more information can be utilized in VHR SAR images [2], building extraction from a single SAR image has started to receive attention in recent years. Quartulli et al. [18] proposed a stochastic geometrical model and applied maximum a posteriori inference for building detection. A method for L-shape building footprint extraction from single SAR images was proposed in [19]. However, this method fails in some cases where there are no L-shaped returns. Soergel et al. [20] used principles from perceptual grouping to detect building features such as long, thin roof edge lines, groups of salient point scatters, and symmetric configurations from SAR images with decimeter resolution. Ferro et al. [21] proposed a method which first extracts of a set of low-level features from SAR images and then combines these features to form more structured primitives for building detection and radar footprint reconstruction. Zhao et al. [17] proposed a general approach using the marker-controlled watershed transform by combining both building characteristics and contextual information. Chen et al. [6] proposed a 1-D detector, referred to as the “range detector” to detect the footprints of the illuminated wall of cuboid buildings.
Among the aforementioned studies on individual building extraction from single SAR images, many of them mentioned the scattering model of individual building or the layover, double-bounce, shadowing effects of buildings in VHR SAR images [18,20]. These works show that the particular scattering model is an essential and effective identifier for the existence of individual buildings [2]. However, most of the aforementioned methods focus on detecting low-level features and using these low-level features to determine the existence of buildings [6,18,21]. Consequently, these methods can only achieve good results for linear or L-shaped buildings with specific orientations [6,19]. Tuning parameters are usually needed in the low-level feature-based methods, hence these methods may not be robust for images with complex scenes or different appearances of buildings [2,6,21].
The main challenge in building extraction from single SAR imagery comes from the complex building orientations and structures. Xu et al. [15] pointed out that the complexity and heterogeneity of building objects emerged in the meter or decimeter resolution SAR images. On the other hand, Franceschetti et al. [4] indicated that the radar return was very sensitive to the building orientation. To solve this problem from a high semantic level, we introduce a novel method that applies domain ontology to express the semantic heterogeneity of different building orientations and structures. The building primitives, such as layover, roof and shadow, can be recognized in VHR SAR images. Moreover, there are specific spatial position relationships between different building primitives. Based on these characteristics, the individual buildings can be extracted from image objects through the semantic knowledge of building primitives. In this framework, two main problems must be considered: (і) how to form the universal and robust semantic properties of individual buildings and building primitives; (іі) how to obtain meaningful image objects from SAR images [22,23,24]. Because ontology addresses the semantic heterogeneity problems [25,26], it is increasingly used in remote sensing image interpretation, especially for the management, aggregation, and sharing of expert knowledge [27,28,29]. We use ontology to solve the first problem in the semantic knowledge of buildings. For the second, we apply the object-based image analysis (OBIA) [30,31], which aims at extracting and classifying objects from remote sensing images.
A detailed description of the proposed method is as follows: Firstly, by analyzing the building scattering model with different orientations and structures, the building ontology model is set up to express multiple characteristics of individual buildings, including knowledge about the scattering model, building orientations, structures and some environmental factors. Under this semantic expression framework, an object-based SAR image segmentation method is adopted to provide the homogeneous image objects, and three categories of image object features are extracted, including the scattering characteristics, image object shape geometry characteristics and topology characteristics. Then, we implement the semantic rules by organizing image object features, and the individual building object expression based on ontological semantic description can be formed. Thus, the building primitives and buildings can be identified from image objects. The proposed method has the following main novelties and advantages:
  • The method extracts individual buildings with different orientations and different structures from a semantic knowledge level by employing the ontology model.
  • The meaningful image objects are obtained by a segmentation method that considers characteristics of SAR images, the topology and geometry characteristics of objects have special advantages for characterizing the building primitives.
  • It is able to accurately extract the individual buildings using a single SAR image without any ancillary data.
The remainder of the paper is structured as follows: In Section 2, we review the characteristics of individual building objects in VHR SAR imagery and introduce the ontological semantic analysis. In Section 3, we present the workflow and the implementation of the proposed method in detail. In Section 4, we present the results obtained by applying the proposed method for extracting individual buildings in single TerraSAR-X imagery, and evaluate the results with a variety of indicators. The capabilities and limitations are discussed in Section 5. Finally, the conclusions are presented in Section 6.

2. Modeling the Individual Buildings in SAR Images

In this section, we first analyze the characteristics of individual building objects in VHR SAR images. Then, the ontological semantic analysis is introduced, and we briefly state the possibilities and suitability of employing the ontology model to extract buildings from VHR SAR images.

2.1. Characteristic Analysis of Large Individual Building

Due to the side-looking and ranging properties of SAR sensors, buildings have distinctive appearances in VHR SAR images. The building area typically consists of four zones: the layover area, corner reflection, roof area, and shadow area [32]. The layover is a significant characteristic of buildings in VHR SAR images. It indicates the presence of a building and appears in correspondence with the building front wall. However, the layover effect depends on the building aspect angle φ (the angle between the front wall of the building and the azimuth direction as shown in Figure 1). Table 1 illustrates the variation of the magnitude signature due to illumination direction and building geometry. In the third column of Table 1, some typical building samples acquired from the TerraSAR-X images are displayed, and corresponding optical images of the scene are shown in the fourth column.
For flat-roof buildings in the first and second rows of the Table 1, a shows return from the ground; b indicates the double bounce caused by the rough dihedral corner reflector that arises from the intersection of the buildings vertical wall and the surrounding ground; c denotes single backscattering from the front wall; d points out the returns from the building roof; e represents the shadow area in ground range; and acd indicates the layover area, where contributions from the ground, the front wall, and the roof are superimposed [2,3,32]. The scattering profile of φ = 0° flat-roof building differs from the φ = 90° flat-roof building, which reflects in two aspects: the scattering of the building roof and the double bounce. For gable-roof buildings in the third and fourth rows, the theoretic scattering signature is slightly different. As shown in Table 1, the signature has a second bright scattering feature acd on the sensor side resulting from direct backscattering from the roof.
The scattering model of buildings in SAR image is particularly significant and differentiable [32,33]. However, since the buildings have great diversity in orientations and structures, the building scattering models may exhibit differences in VHR SAR images. These make the scattering amplitudes display complex characteristics. Brunner et al. [34] showed that the scattering amplitude feature has a significant dependency on the building aspect angle. The proposed method makes full use of the scattering model of buildings in a SAR image, and takes into account the most typical roof types and the influence of the aspect angle.
Except for the scattering characteristic, for the samples in Table 1, the edges and shapes of building samples are obvious, and the layover, roof and shadow have certain position relationships. Hence, the relatively regular geometry features, and the topological features between adjacent primitives, are also important characteristics of buildings in VHR SAR imagery. The topological and geometric characteristics of image objects have special advantages for the spatial characteristics of building primitives.

2.2. Ontological Semantic Analysis

As the widespread availability of meter-resolution remote sensing images, it is necessary to develop a method to explore and understand the contents of large and highly complex images [35,36]. In the last decade, considerable research has been devoted to introducing human knowledge into the interpretation of remote sensing data [35,36,37]. The knowledge representation system is promising to organize multiple information of remote sensing image [37] and import some high-level semantics into the process of interpretation. However, the semantic gap between low-level features and high-level image semantics hinders the development of knowledge expression model.
The ontology defines a set of concepts and their relationship; each concept is defined by some low-level descriptors associated to intervals of accepted values [29]. Thus, ontology became a widely accepted solution to address the semantic heterogeneity problems that prevent information discovery and integration in a distributed way [38]. The GIS community uses ontology to explicitly specify and formalize the meaning of the domain concepts into a machine-readable language that enables spatial information retrieval on a semantic level [39]. Ontology has also been used to guide and automate the image analysis and interpretation procedures [25,40,41]. Belgiu et al. [25] applied OBIA methods to extract buildings from Airborne Laser Scanner (ALS) data and investigate the possibility of classifying detected buildings into “Residential/Small Buildings”, “Apartment Buildings” and “Industrial and Factory Building” classes by means of domain ontology and machine learning techniques. Forestier et al. [40] proposed a method for obtaining a knowledge-base of urban objects, which was applied to high-resolution satellite image analysis. The knowledge-base, which is built by means of ontology, is used to assign segmented regions (i.e., extracted from the images) into semantic objects (i.e., concepts of the knowledge-base). Dumitru et al. [42] defined a set of ontologies for high-resolution SAR images based on CORINE Land Cover and Urban Atlas ontologies, they discussed the semantic categories that can be retrieved from TerraSAR-X data and generated a semantic catalog for satellite images. Therefore, the role of ontology in remote sensing image interpretation is to capture domain knowledge in a generic way and to provide a common understanding of a geographic domain [43].
Defining an ontology for any domain essentially consists of the following steps: knowledge acquisition, conceptualization, ontology formalization, and the implementation of the developed ontology into computational model [44,45]. The knowledge is usually held by experts and/or available in various text corpora. The conceptualization is an abstract, simplified view of the world that we want to represent for a specific purpose [46]. A shared conceptualization means that the ontology captures consensual knowledge. The ontology is often formalized by means of standard representation languages such as RDF (Resource Description Framework [47]), RDFS (RDF Schema [48]), OWL (Web Ontology Language [49]) or SKOS (Simple Knowledge Organization System [50]). The process of implementation may be done by a machine only or by a machine intelligence-aided procedure depending on the availability of appropriate image and sensory information-processing tools [45].
Since the characteristics of buildings in VHR SAR images are abundant and complex, including the characteristics for scattering, texture, spatial, shape and topology, it is necessary to make full use of these features and knowledge in the process of extracting buildings. A domain ontology has the potential to organize knowledge in a formal, understandable and sharable way. In this work, we propose to exploit the power of ontology in modeling the individual buildings from VHR SAR image, the ontology is used for reducing the semantic gap between image features and the semantic knowledge of buildings. Besides, our ontology represents the building scattering model and building primitives in VHR SAR images.

2.3. Some Restrictions

In order to define semantic knowledge about the large individual buildings clearly, we first establish certain restrictions for SAR data and individual buildings:
(1)
The resolution of the SAR data ranges from 0.5 to 2 m;
(2)
The types of the large individual buildings mainly include large factory buildings and public buildings;
(3)
Buildings are assumed to have flat roofs and gable roofs. The minimum size of building is about 250 pixels in the meter-resolution SAR images;
(4)
Considering the particular scattering model of individual buildings in VHR SAR images, we hold that the individual building is made up of building primitives (layover area, corner reflection, roof area, and shadow area).

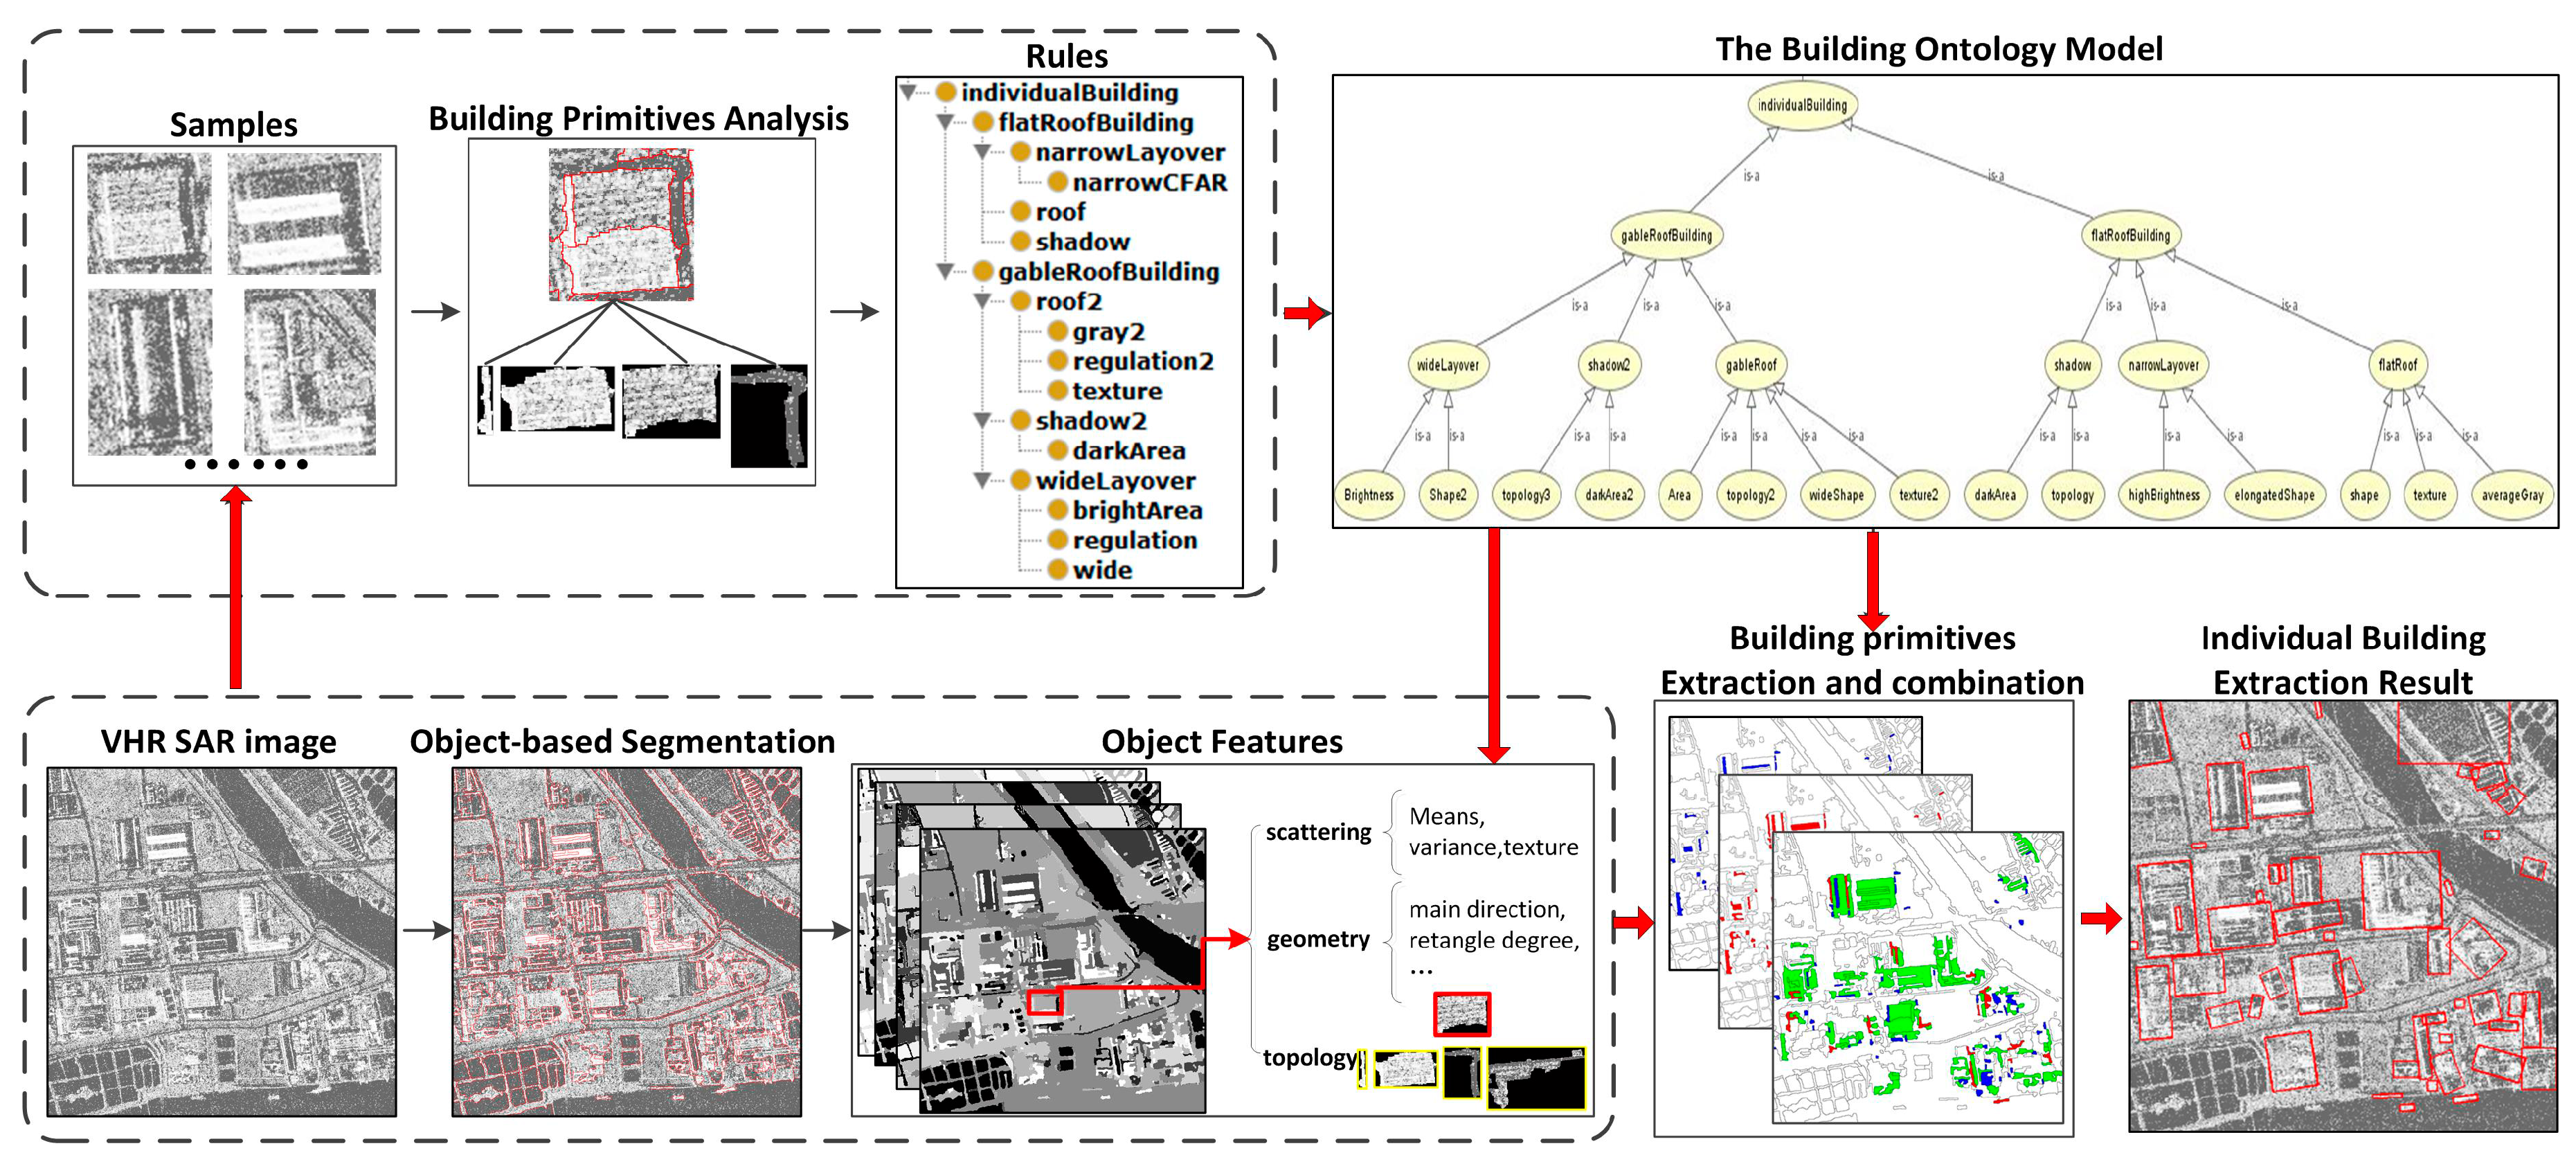
3. Proposed Method for Individual Building Extraction

The applied workflow (Figure 2) of individual building extraction is organized as follows: In semantic analysis (the upper part of Figure 2), an ontology model is developed to express the semantic knowledge of individual buildings and building primitives. Corresponding, in image processing (the lower part of Figure 2), the meaningful image objects are provided by an object-based SAR image segmentation method. Then, the scattering characteristics, object shape geometry characteristics and topology characteristic of the image objects are extracted and selected by the guidance of ontology. In the last step, the building primitives and individual buildings are extracted based on the features identified by the decision trees which are formalized in the ontology.

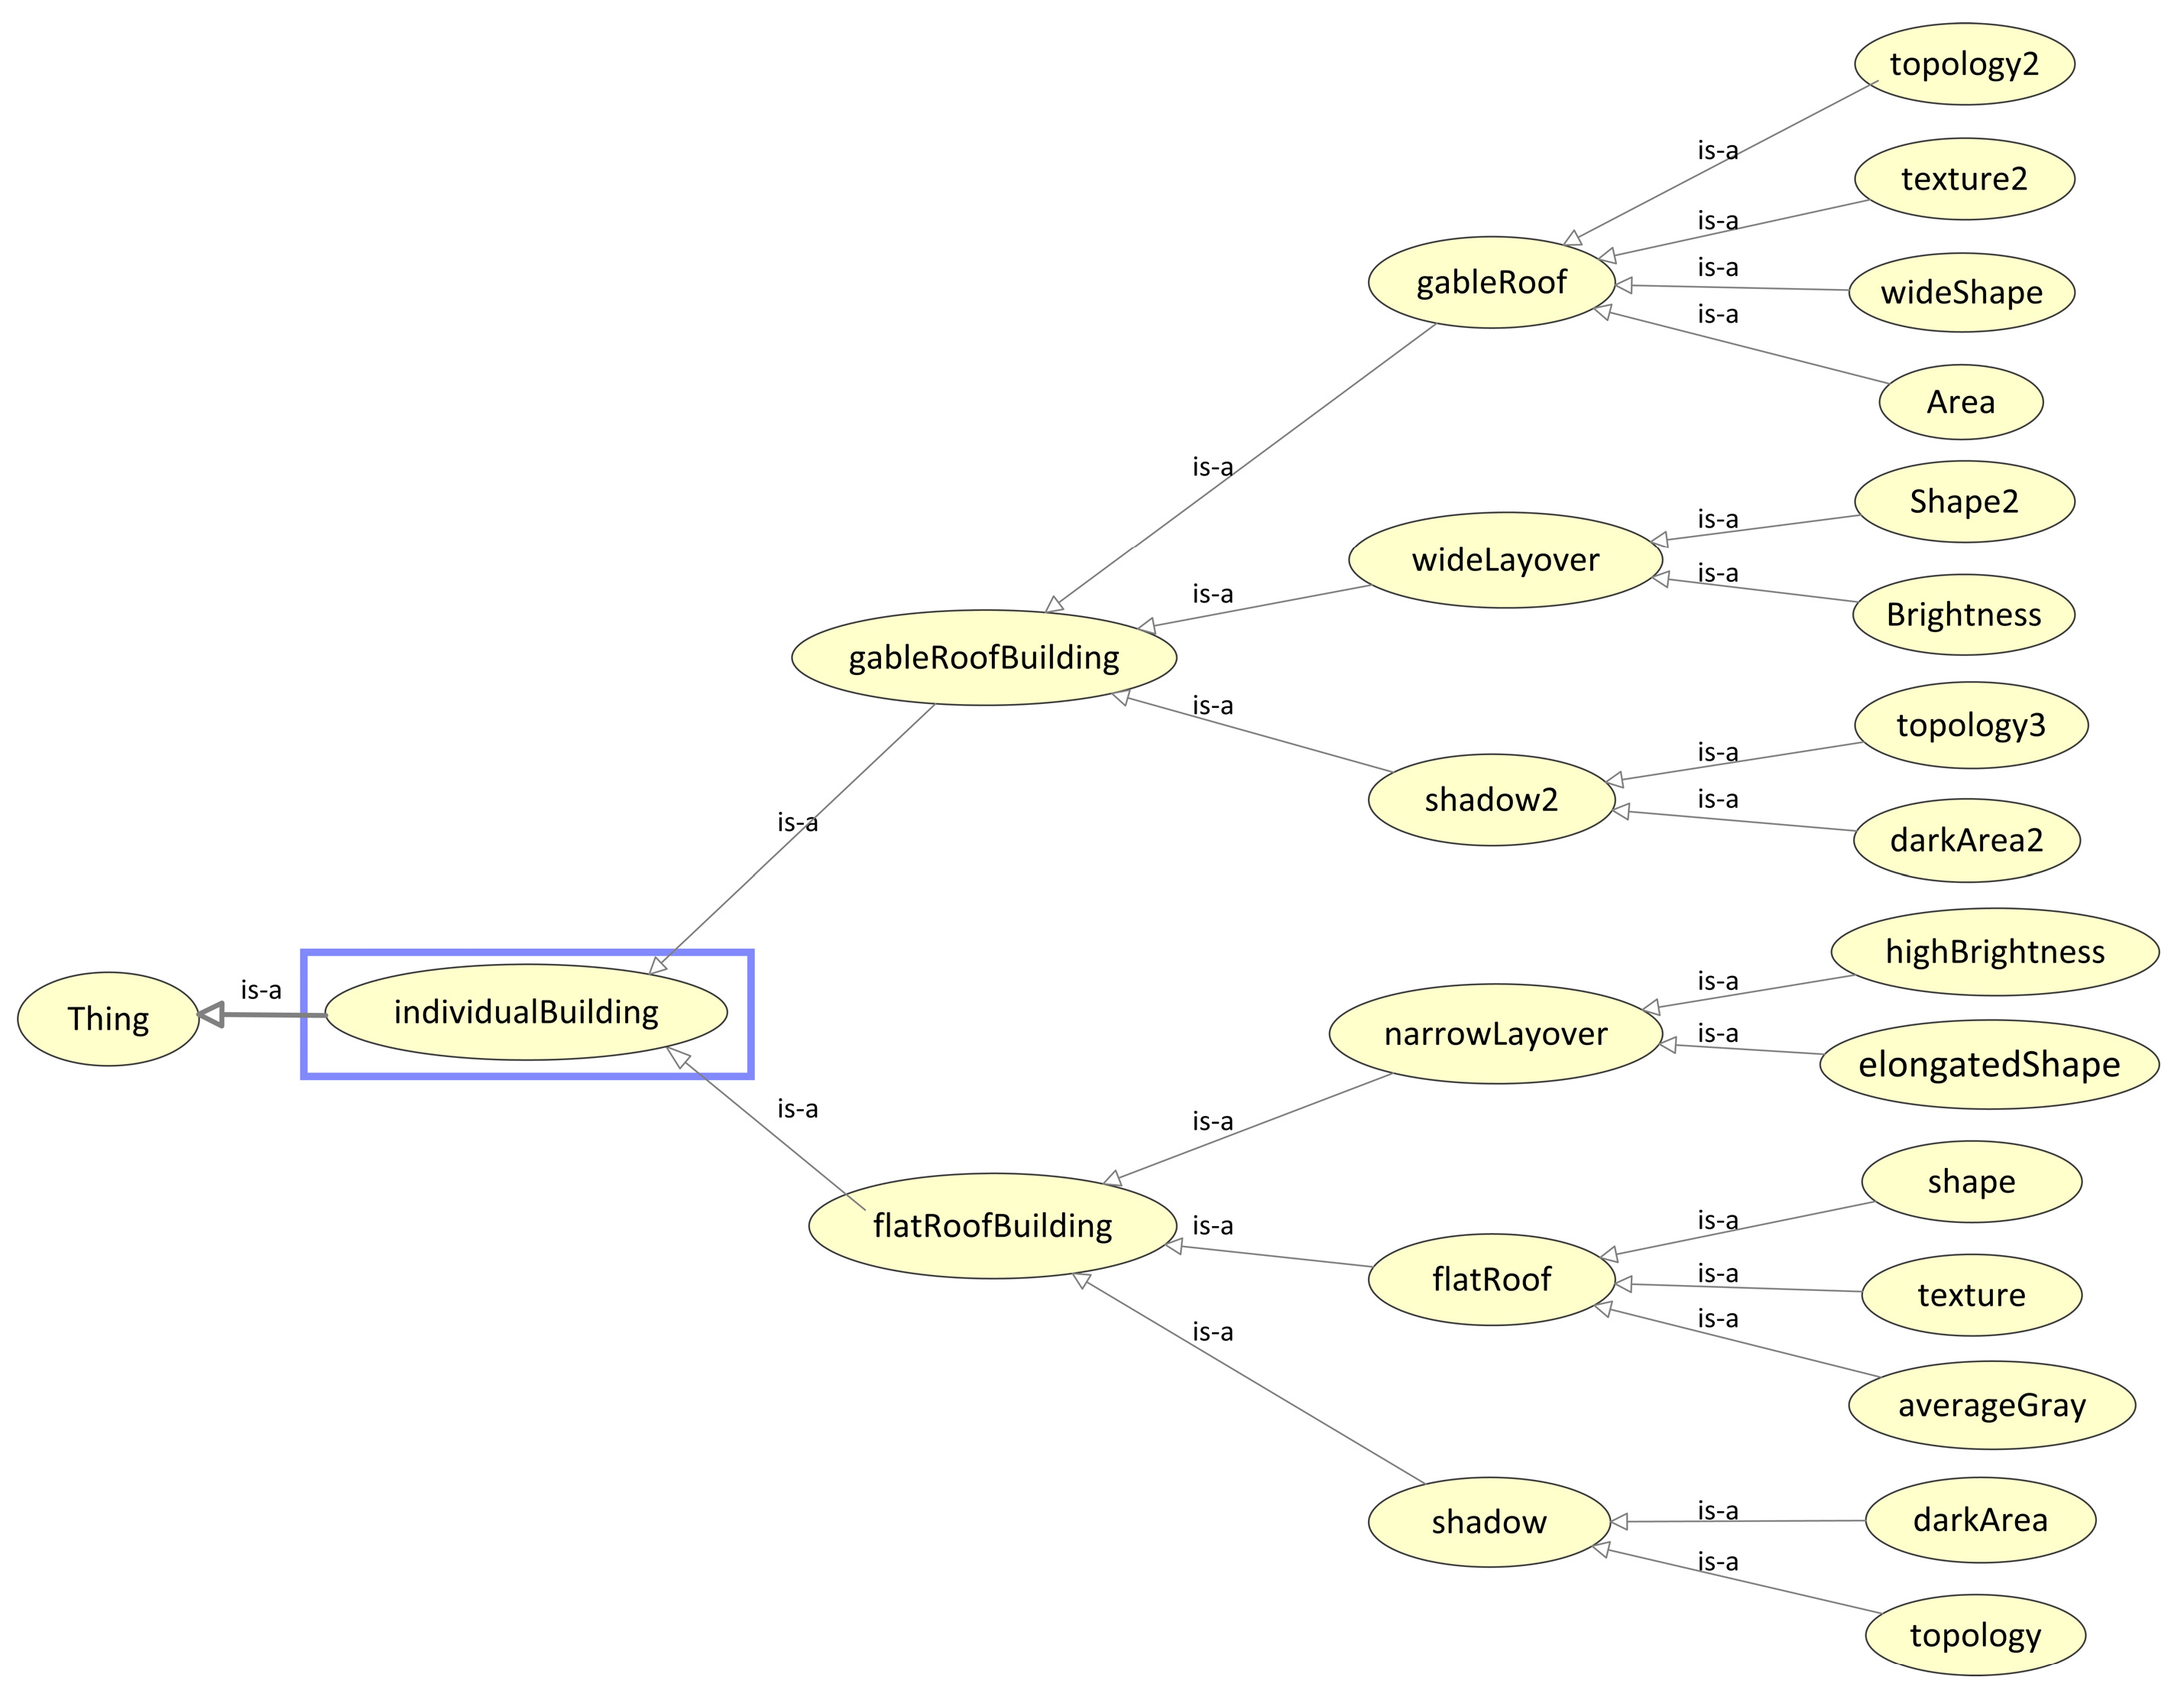
3.1. Ontology Model of Individual Buildings and Building Primitives

Combined with characteristic analysis of large individual buildings in Section 2.1, we set the following semantic rules for individual buildings and building primitives, laying the foundation for defining semantic knowledge about the large individual buildings in VHR SAR images.
(1)
An individual building is made up of building primitives (layover area, corner reflection, roof area, and shadow area). The layover area and corner reflection need to identify in the bright area of SAR image. The shadow area belongs to dark area.
(2)
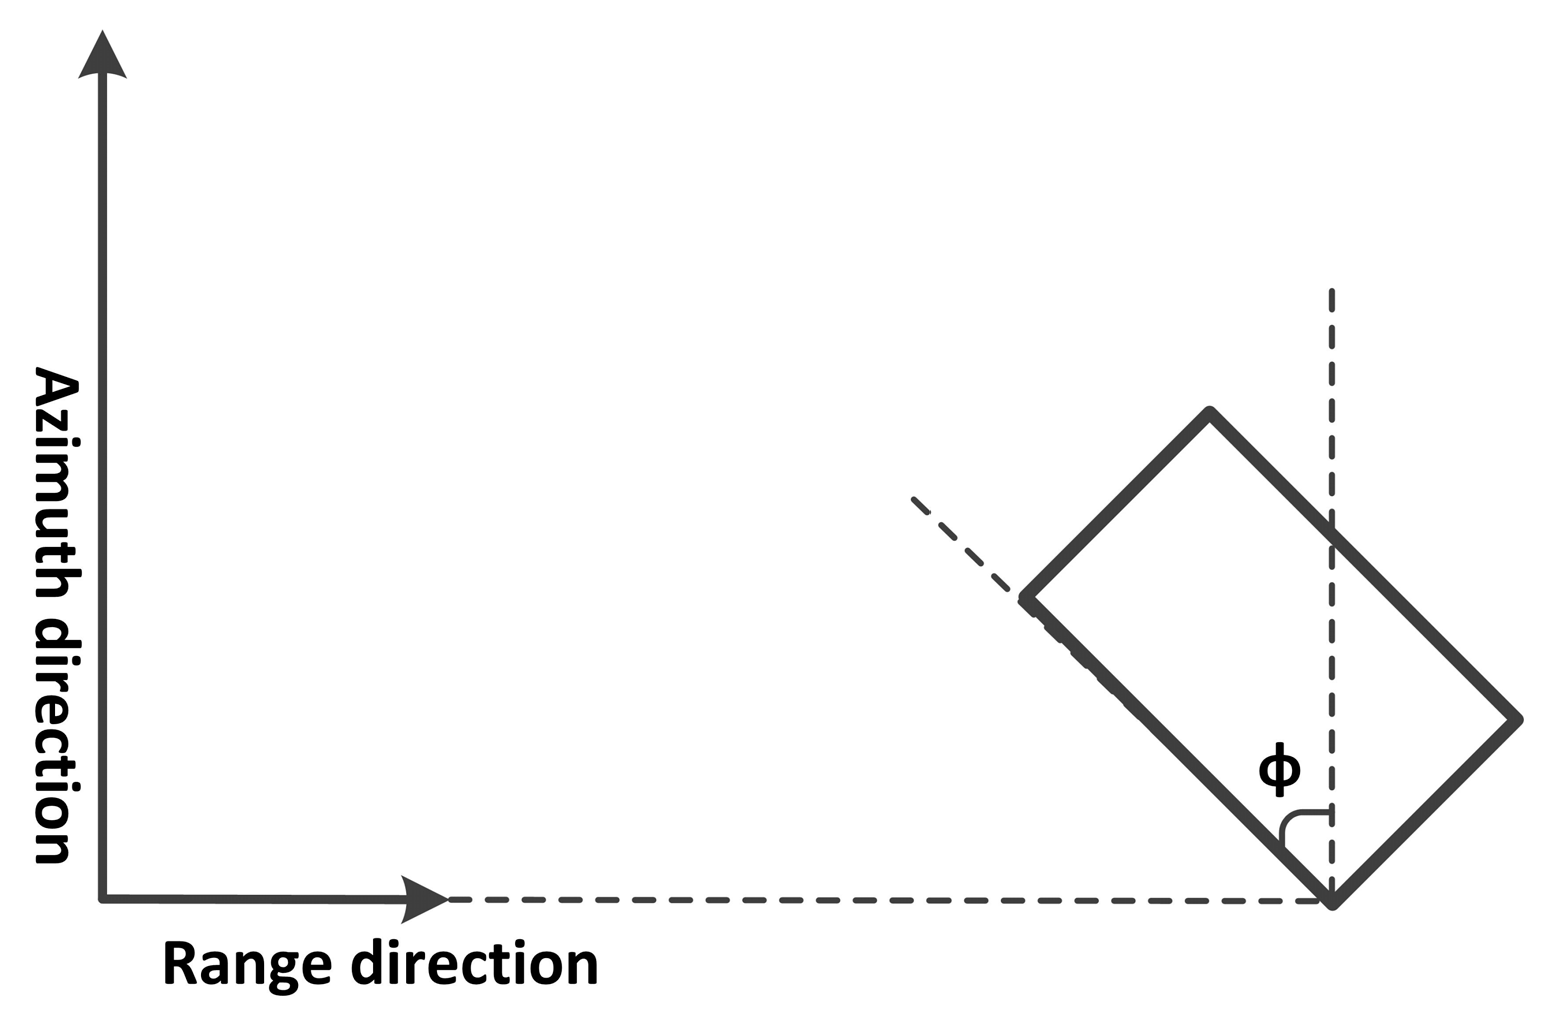
The building orientation is determined by the direction of the layover area. It can be divided into three main directions: parallel to SAR flight direction, vertical and inclined.
(3)
Associated with the SAR incidence angle, the roof and dark area are in the specific side of the bright area.
(4)
The individual building types can be divided into flat-roof and gable-roof building, mainly determined by the width of bright areas.
(5)
After obtaining the building primitives, the object topology information and imagery parameter information are used to aggregate the primitives into individual buildings.
(6)
Buildings are considered to be large if their planar area is greater than or equal to 250 pixels in the meter-resolution SAR images.
The semantic rules presented above are prior knowledge. In the conceptualization phase, the acquired knowledge is organized hierarchically in a semi-formal way (Figure 2). This semi-formal representation of the domain knowledge guides the ontology engineers in their attempt to model the ontology using the OWL specifications. The primitives displayed in Figure 2 are formalized as follows:
  • Bright area: Direction ∩ High brightness ∩ Rectangularity ∩ Area size;
  • Roof: Specific side of the bright area ∩ Texture ∩ Area size ∩ Shape;
  • Dark area: Low brightness ∩ Shape ∩ Specific side of the roof ∩ Area size.
Once the building primitives have been detected, the individual buildings can be determined by the following properties:
  • Flat-roof building: Narrow layover area ∩ Roof ∩ Total area ∩ Shadow position (Auxiliary);
  • Gable-roof building: Wide layover area ∩ Roof ∩ Total area ∩ Shadow position (Auxiliary).
Protégé 5.0 software has been used for ontology development. Three levels of ontology (Figure 3) were needed in this work: the image objects level (object features level), the building primitive level and the individual building level.

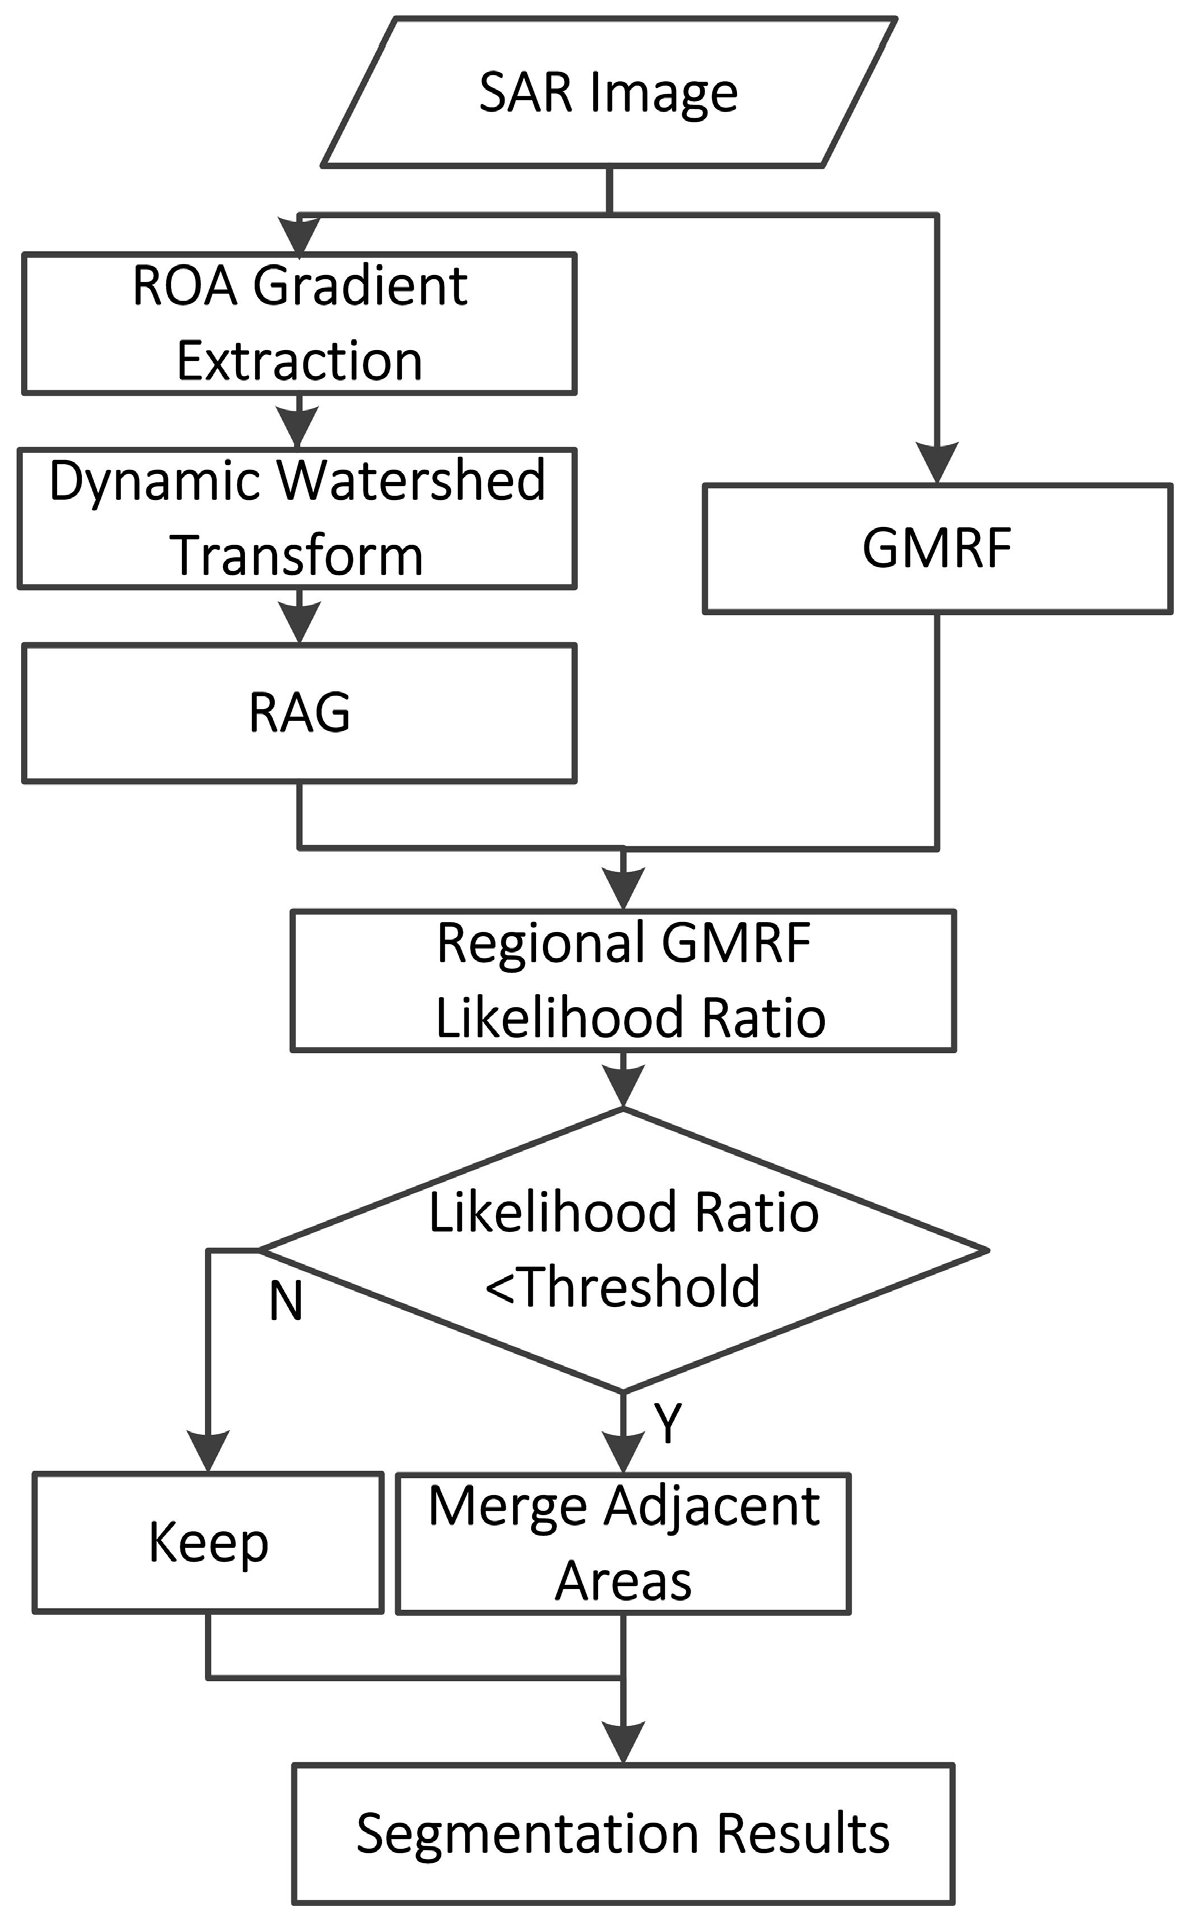
3.2. Object-Based Analysis of High Resolution SAR Image

Object-Based Image Analysis (OBIA) is proposed as a sub-discipline of GIScience devoted to partitioning remote sensing imagery into meaningful image objects and assessing their characteristics through spatial, spectral and temporal scale [31,51]. OBIA claims to overcome problems of traditional pixel-based techniques of high spatial resolution image data, by defining segments rather than pixels to classify, and allowing spectral reflectance variability to be used as an attribute for discriminating features in the segmentation approach [22,30].
It is possible to recognize details of a building in spatial and geometric structures in the VHR SAR images. Based on these characteristics, it is promising to analyze the building primitives in SAR imagery by combining OBIA method and the semantic knowledge. However, because of the heterogeneity of the urban landscape and its spatial variability, the segmentation of urban scenes is a challenging task [31,52], especially in SAR images, which are affected by speckle inevitably. In this subsection, we first introduce an object-based segmentation for SAR images. Then, we focus on the analysis of the image object characteristics which are needed in the domain ontology model.

3.2.1. SAR Image Segmentation

The applied workflow of object-based segmentation is demonstrated as Figure 4. Firstly, an improved watershed transform is used to obtain the initial image objects. In this process, the ROA (Ratio of Averages) operator is used to extract the gradient of the SAR image; this operator helps to reduce the effect of speckle [53,54]. The basin dynamic threshold [55] is applied in the initial watershed transform; this step can restrain over-segmentation problem, and it can also control the size of image objects. Then, the RAG (region adjacency graph) is established on the level of the initial image objects. At the same time, by adopting the GMRF (Gauss Markov random field) model [56], the first and second order statistics as well as spatial texture characteristics of the image objects can be introduced. The GMRF model has been proven to be well suited to model the building areas in SAR images [57]. Moreover, we use these statistical characteristics to form region similarity measure to conduct the adjacent region merging. The applied segmentation method can reduce the influence of speckle, and quickly obtain homogeneous regions with clear boundaries.

3.2.2. Characteristics of Objects

The image objects in OBIA have various features that are unavailable in pixel-based image analysis. In the proposed method, we take into account the actual needs of the domain ontology model, and three categories of image object features has been adopted: scattering characteristics—the mean, variance, texture (Gray Level Co-occurrence Matrix, GLCM, homogeneity, energy, diversity and entropy); object shape geometry characteristics—main direction of the object, area, mass center, minimum circumscribed rectangle, rectangle, (shape) filling, compact degrees (dispersion of the object); topology—adjacent object label. The definition and significance of the adopted object features have been displayed in Table 2. Particularly, the topological and geometric characteristics of objects have advantages for characterizing the building primitives.

3.3. Individual Building Extraction Based on Ontological Semantic Analysis

Based on the ontological model of individual buildings, we first get the meaningful image objects and object features related to building primitives. Then, we need to extract the building primitives from image objects using the ontology rules. In this process, the bright areas are detected first by the corresponding rules, and the roof and dark areas are detected subsequently. After the building primitives have been established, the building primitives are combined by using corresponding ontology rules and the object topology features, and the final individual building objects should meet the constraints of rules about size and shape.
During this process of extracting building primitives and building objects from image objects, lots of object features need to be adopted; the features have been introduced in Table 2. We use the decision tree and some samples to train the feature thresholds. Every decision tree can be understood as an implementation of a rule in the ontology model. By conducting the ontology analysis process in Figure 3, the image objects can be recognized as building primitives or not, and then some specific building primitives can be combined into individual buildings.

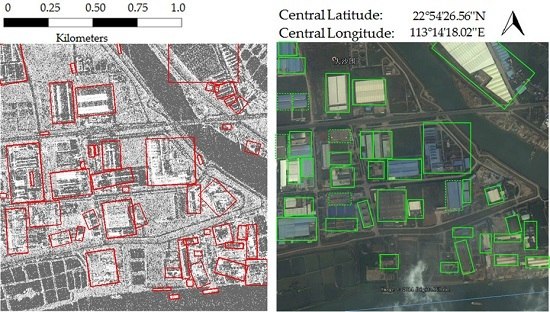
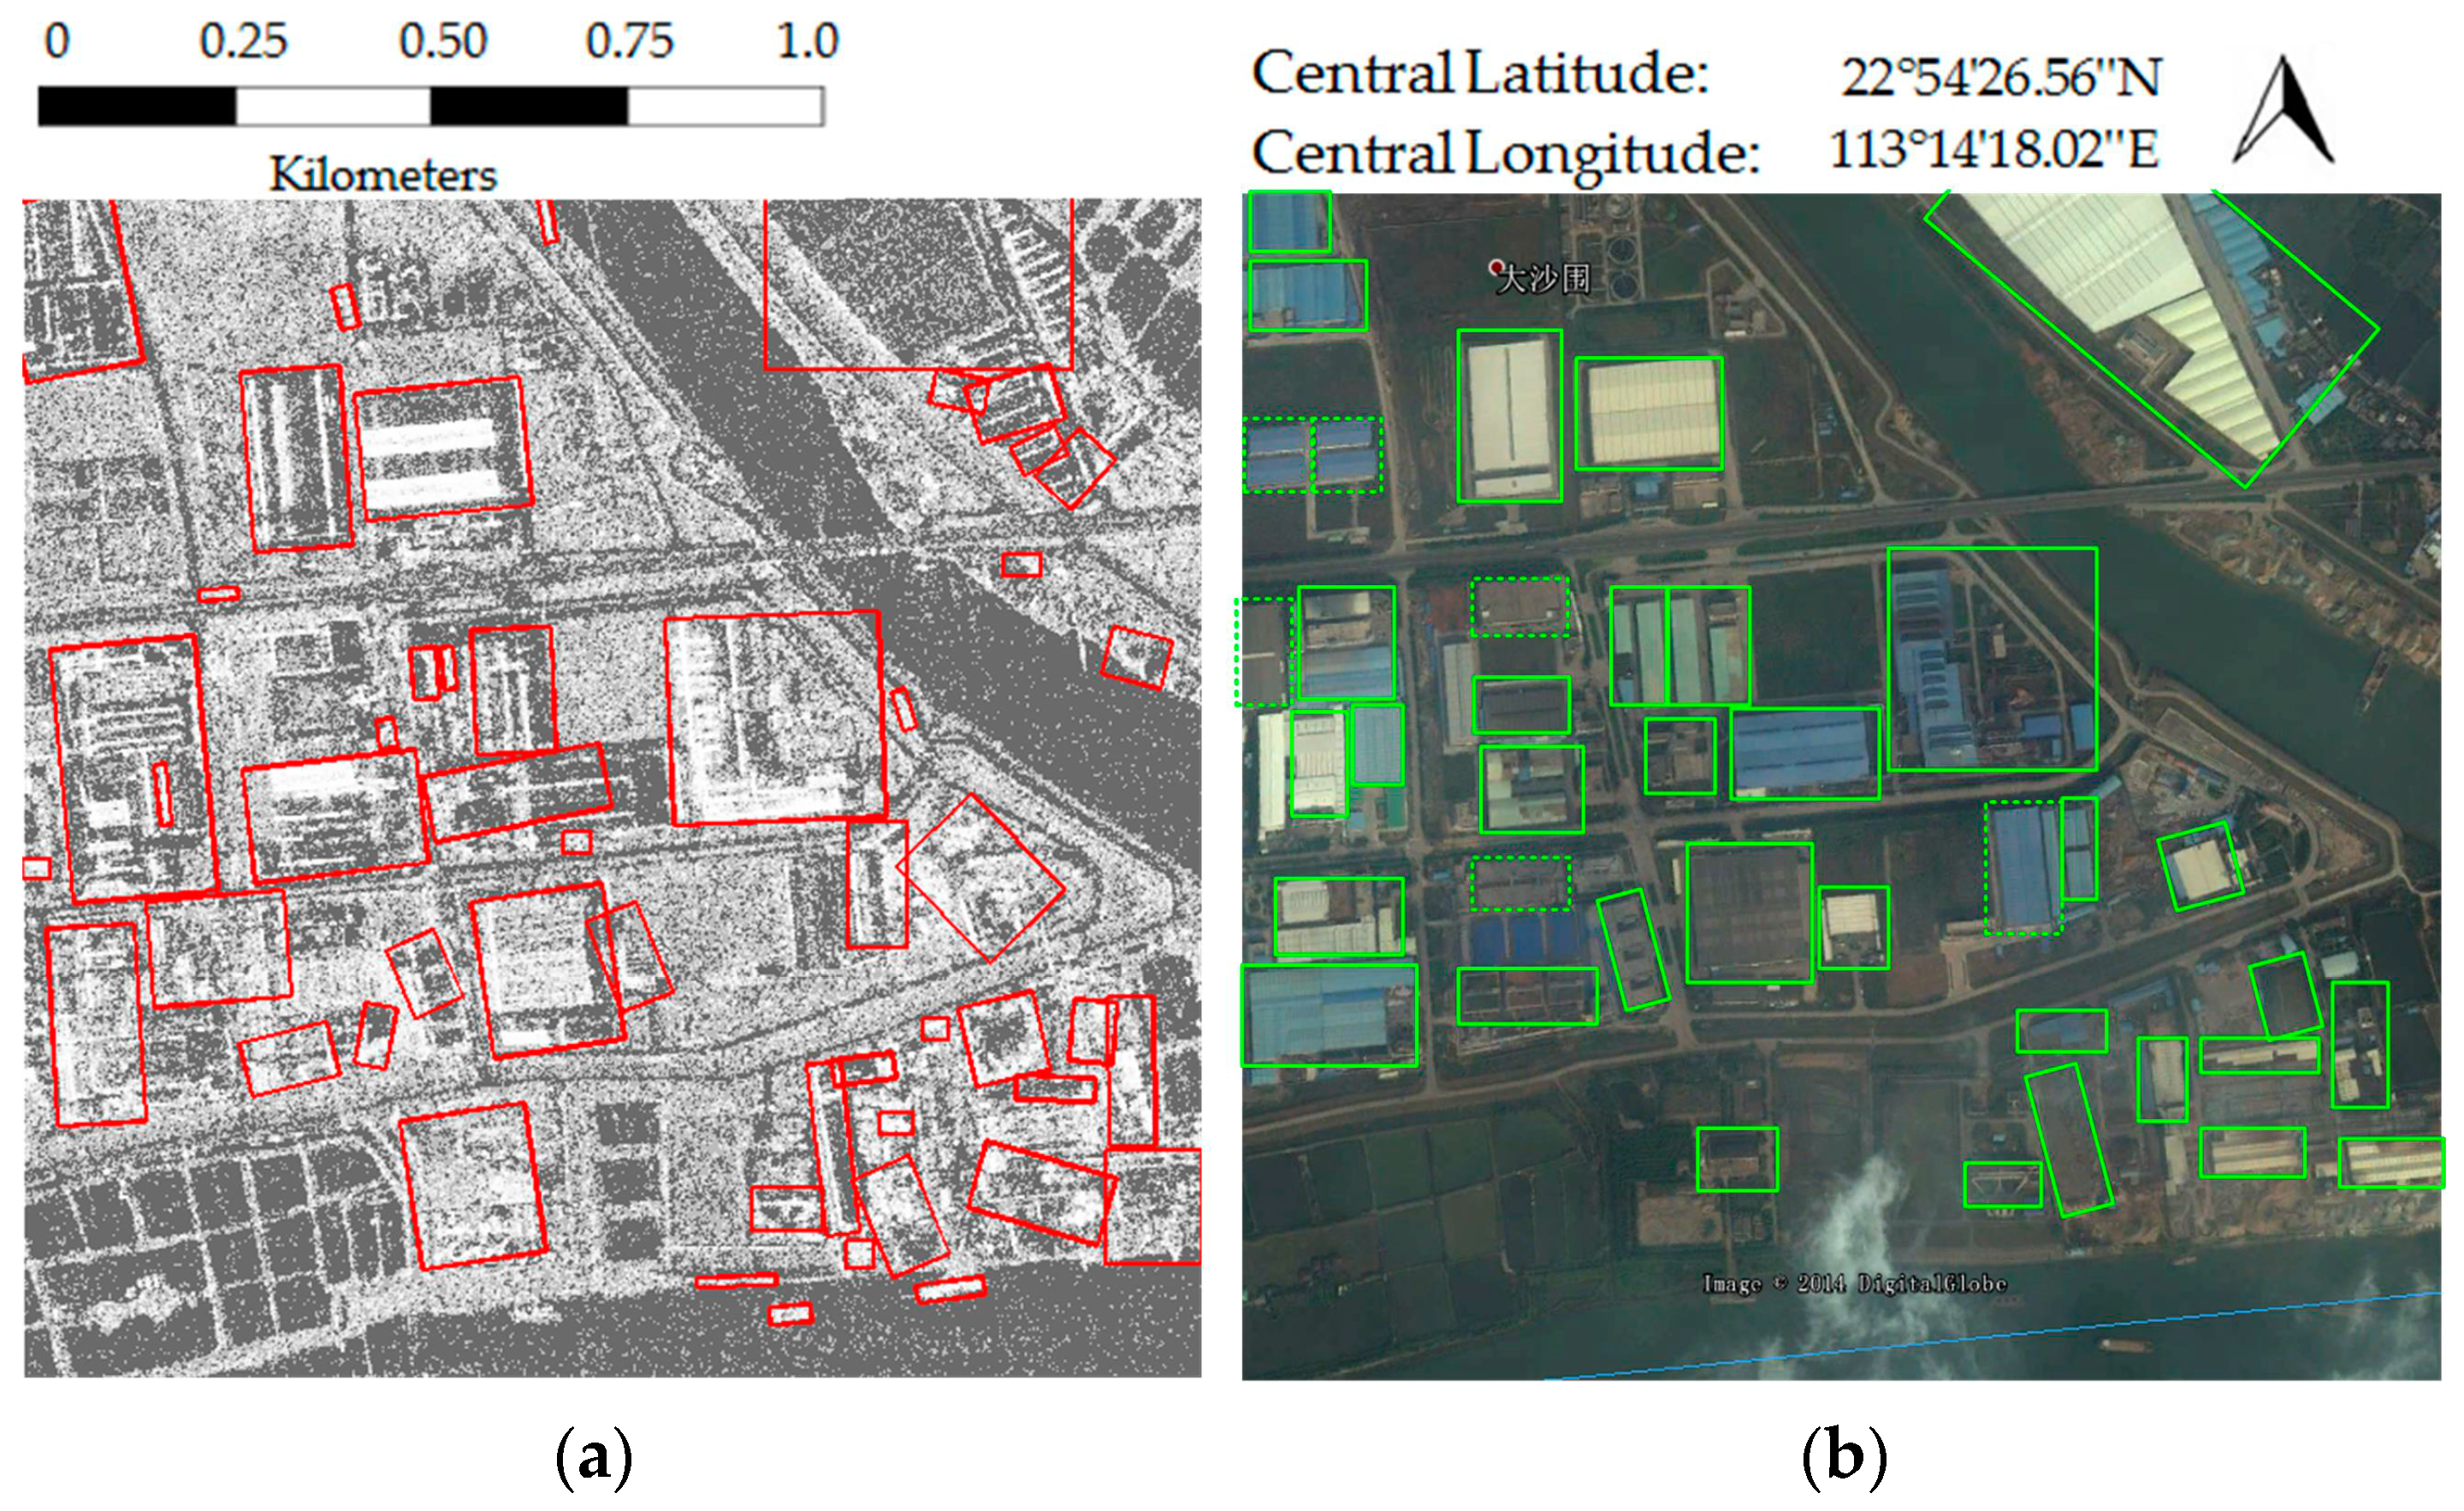
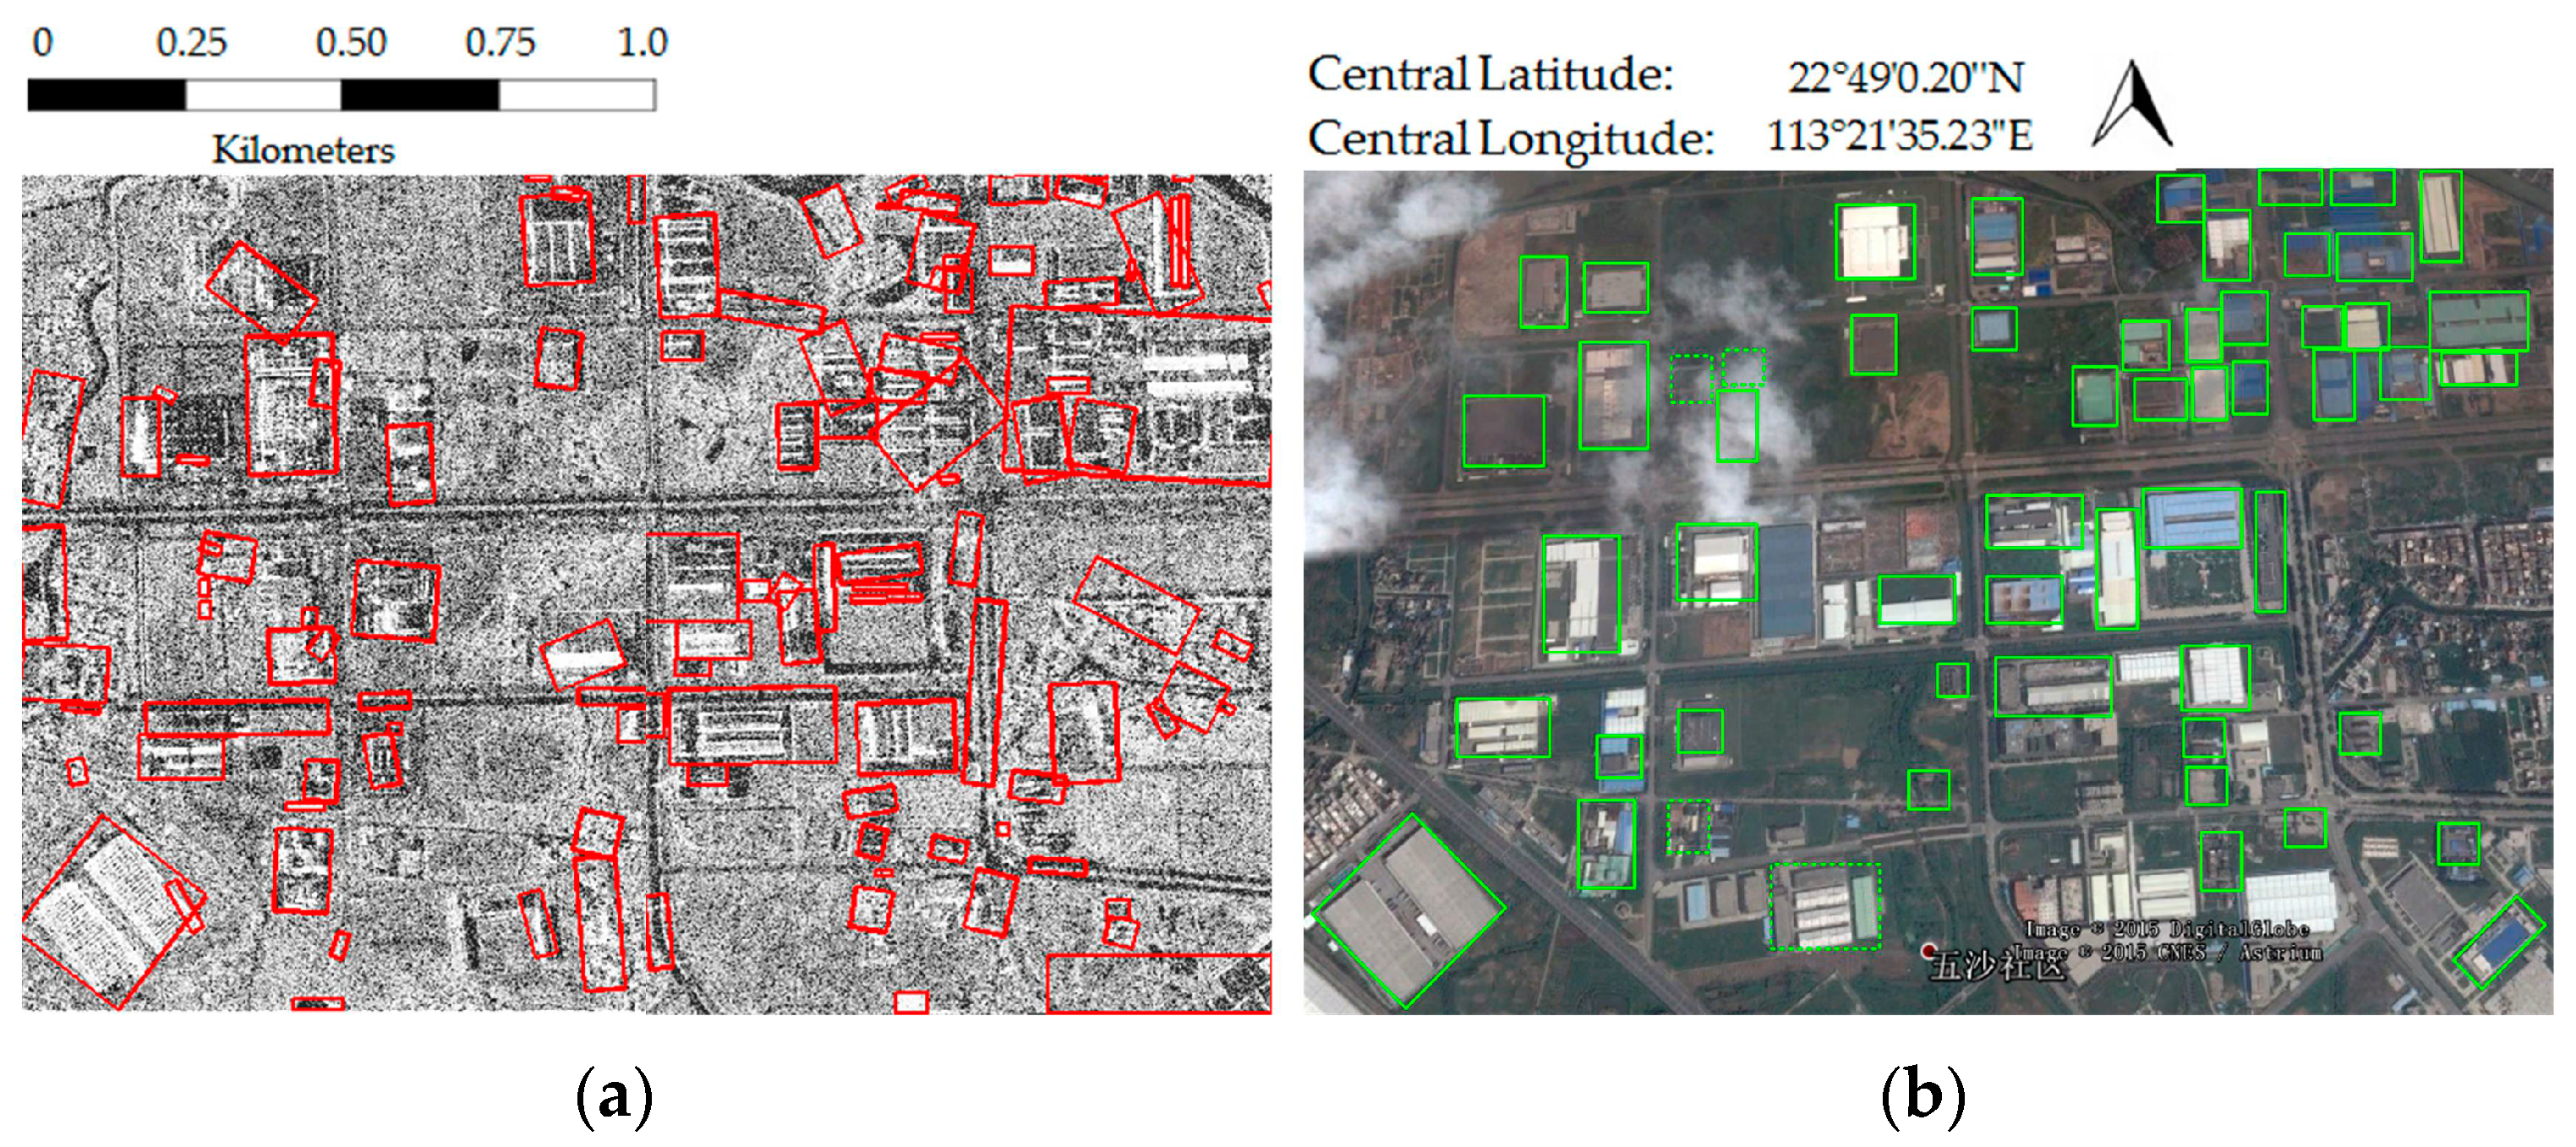
4. Experimental Results

In this section, we first present the extracted building results obtained by applying the proposed method from single VHR SAR imagery. Then, the evaluation of the experimental results has been shown.

4.1. Properties of Data Sets and Experimental Setting

The effectiveness of the proposed method has been tested on a TerraSAR-X image of the Foshan city, China. The image is acquired in VV polarization in stripmap mode, with pixel spacing of 1.25 m. The experimental data contain large public buildings and factory buildings, the roof types including simple flat-roof, the gable-roof and composite roof. The building orientations in the selected data are complex, and the planar sizes and shapes of the buildings are different. Basic information and characteristics of the selected experimental data are shown in Table 3. We use the words “basically the same”, ”quite different”, ”different” to briefly describe the degree of building orientations diversity in each datum. In addition, for some other features of buildings in each datum, we describe them via the following aspects: the appearance characteristics of buildings, including sizes and roofs; and the aggregation of adjacent buildings, including the density and the clusters of buildings.

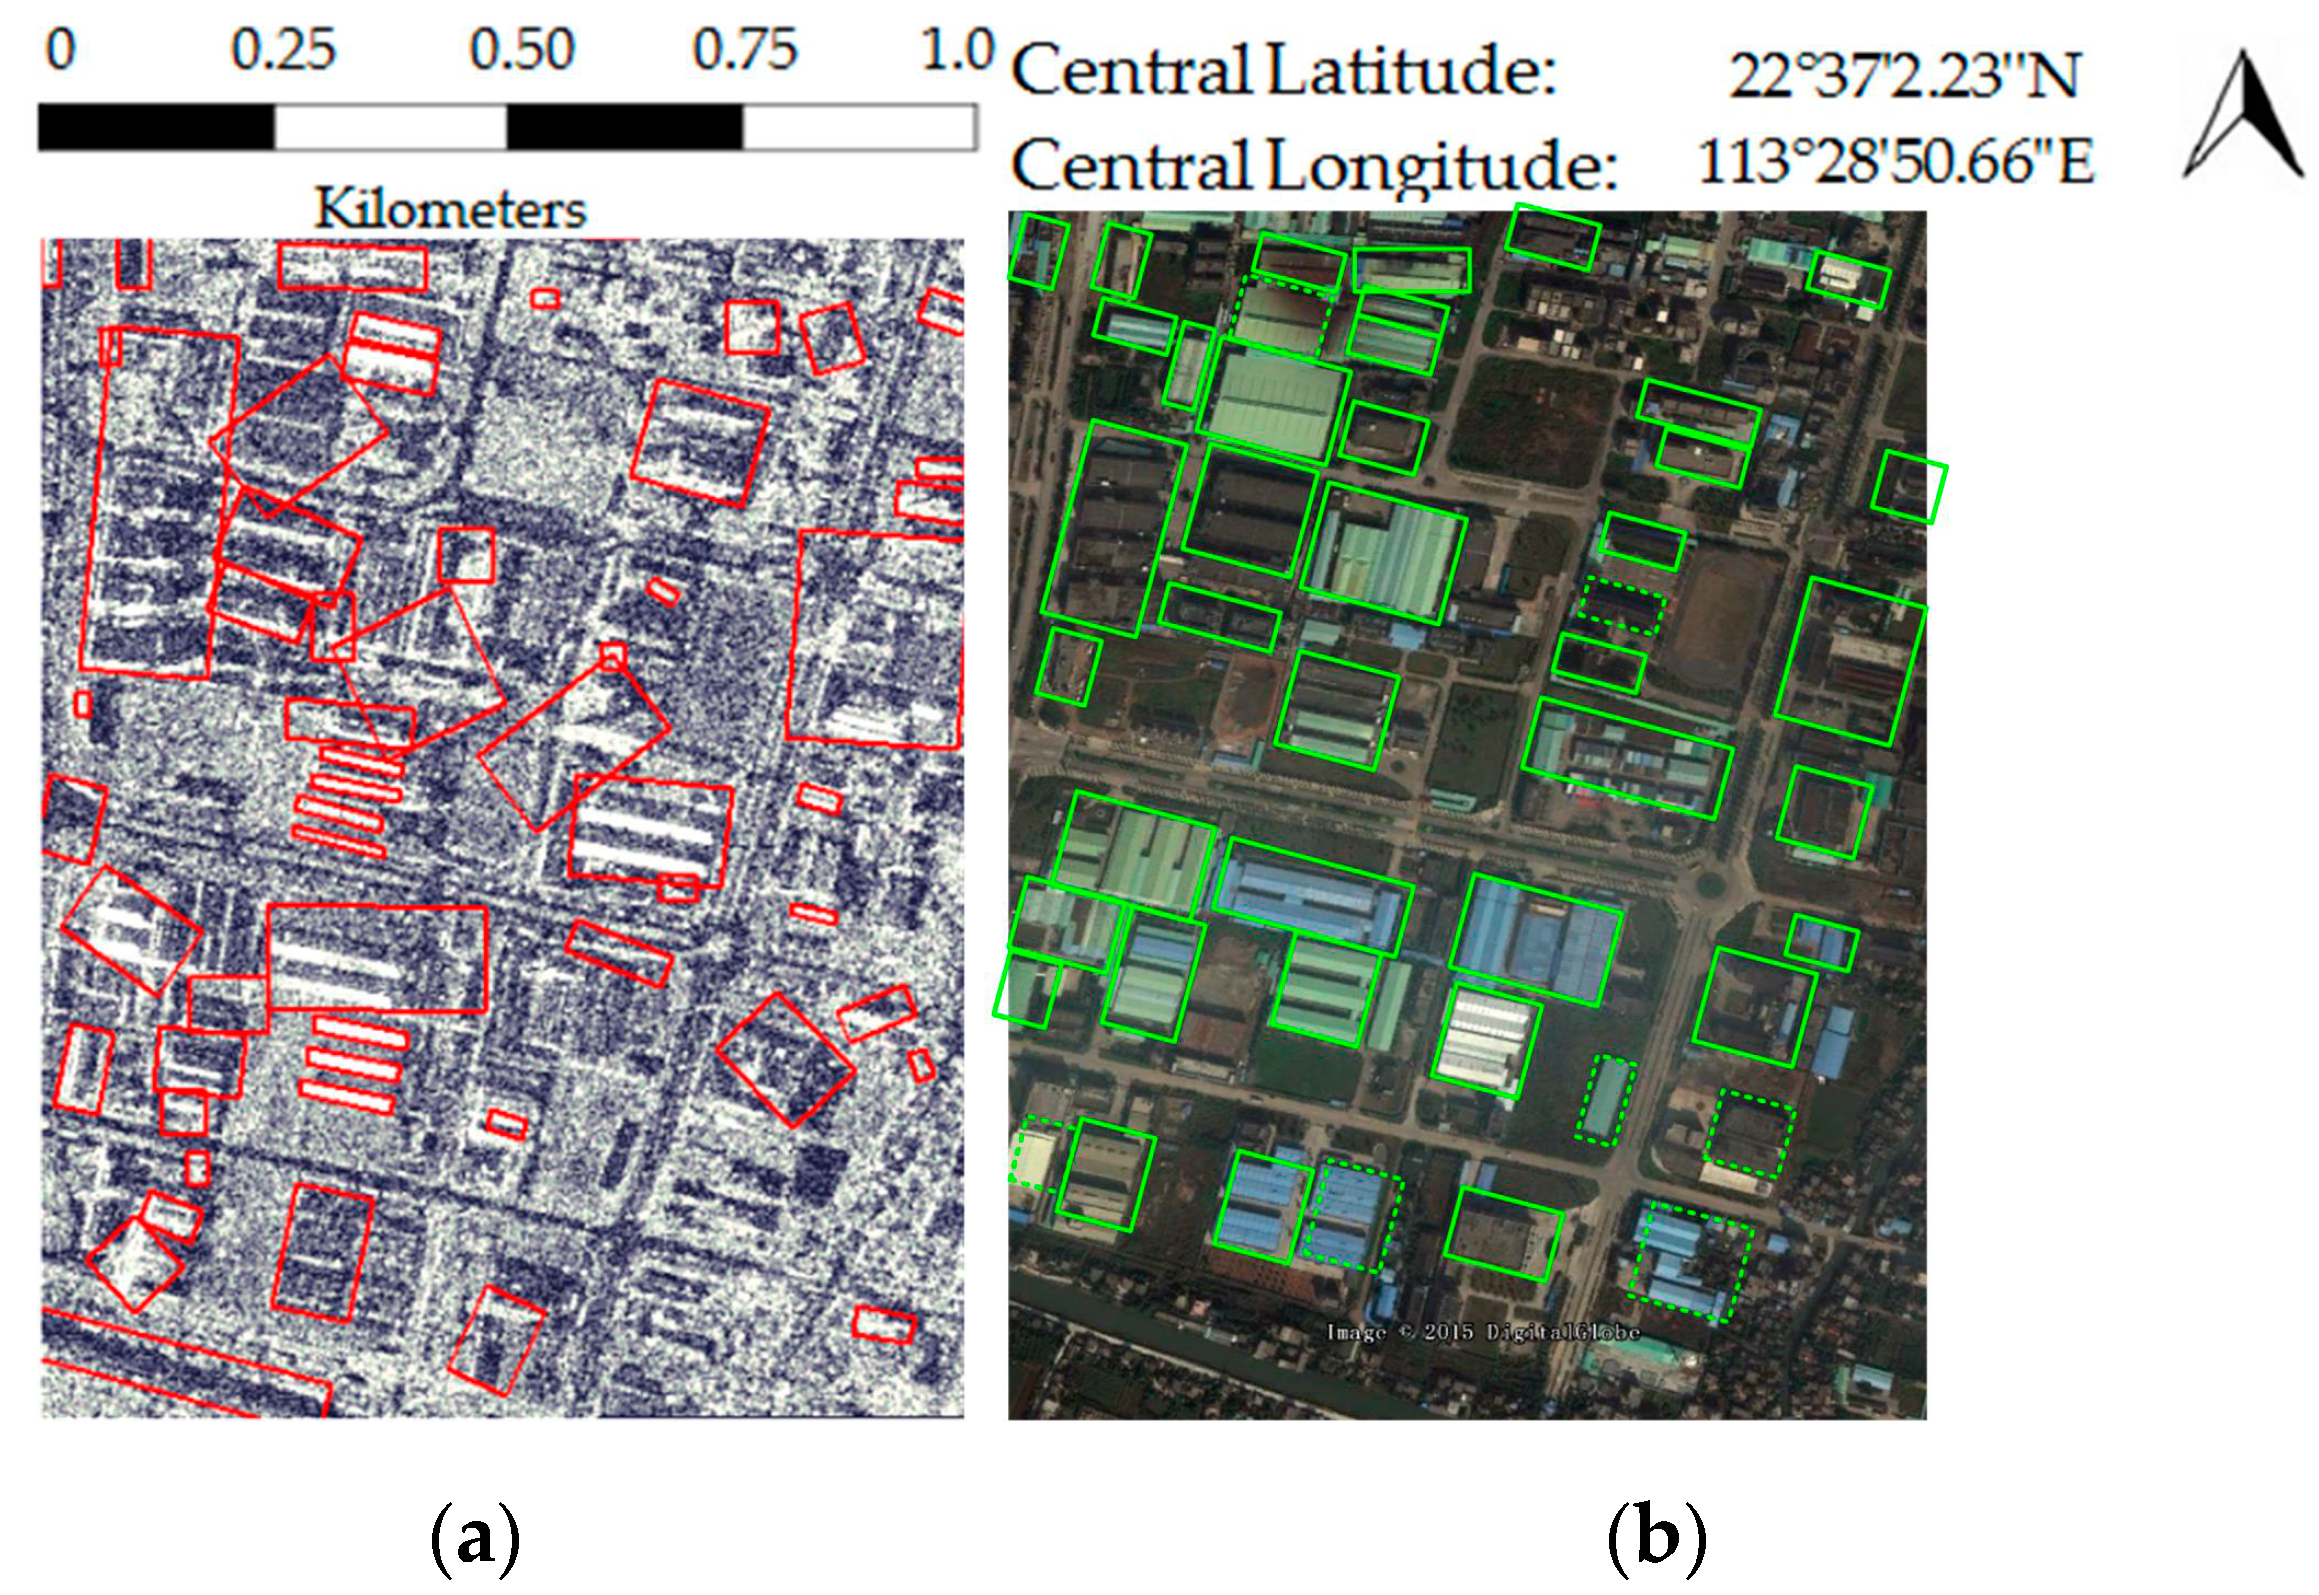
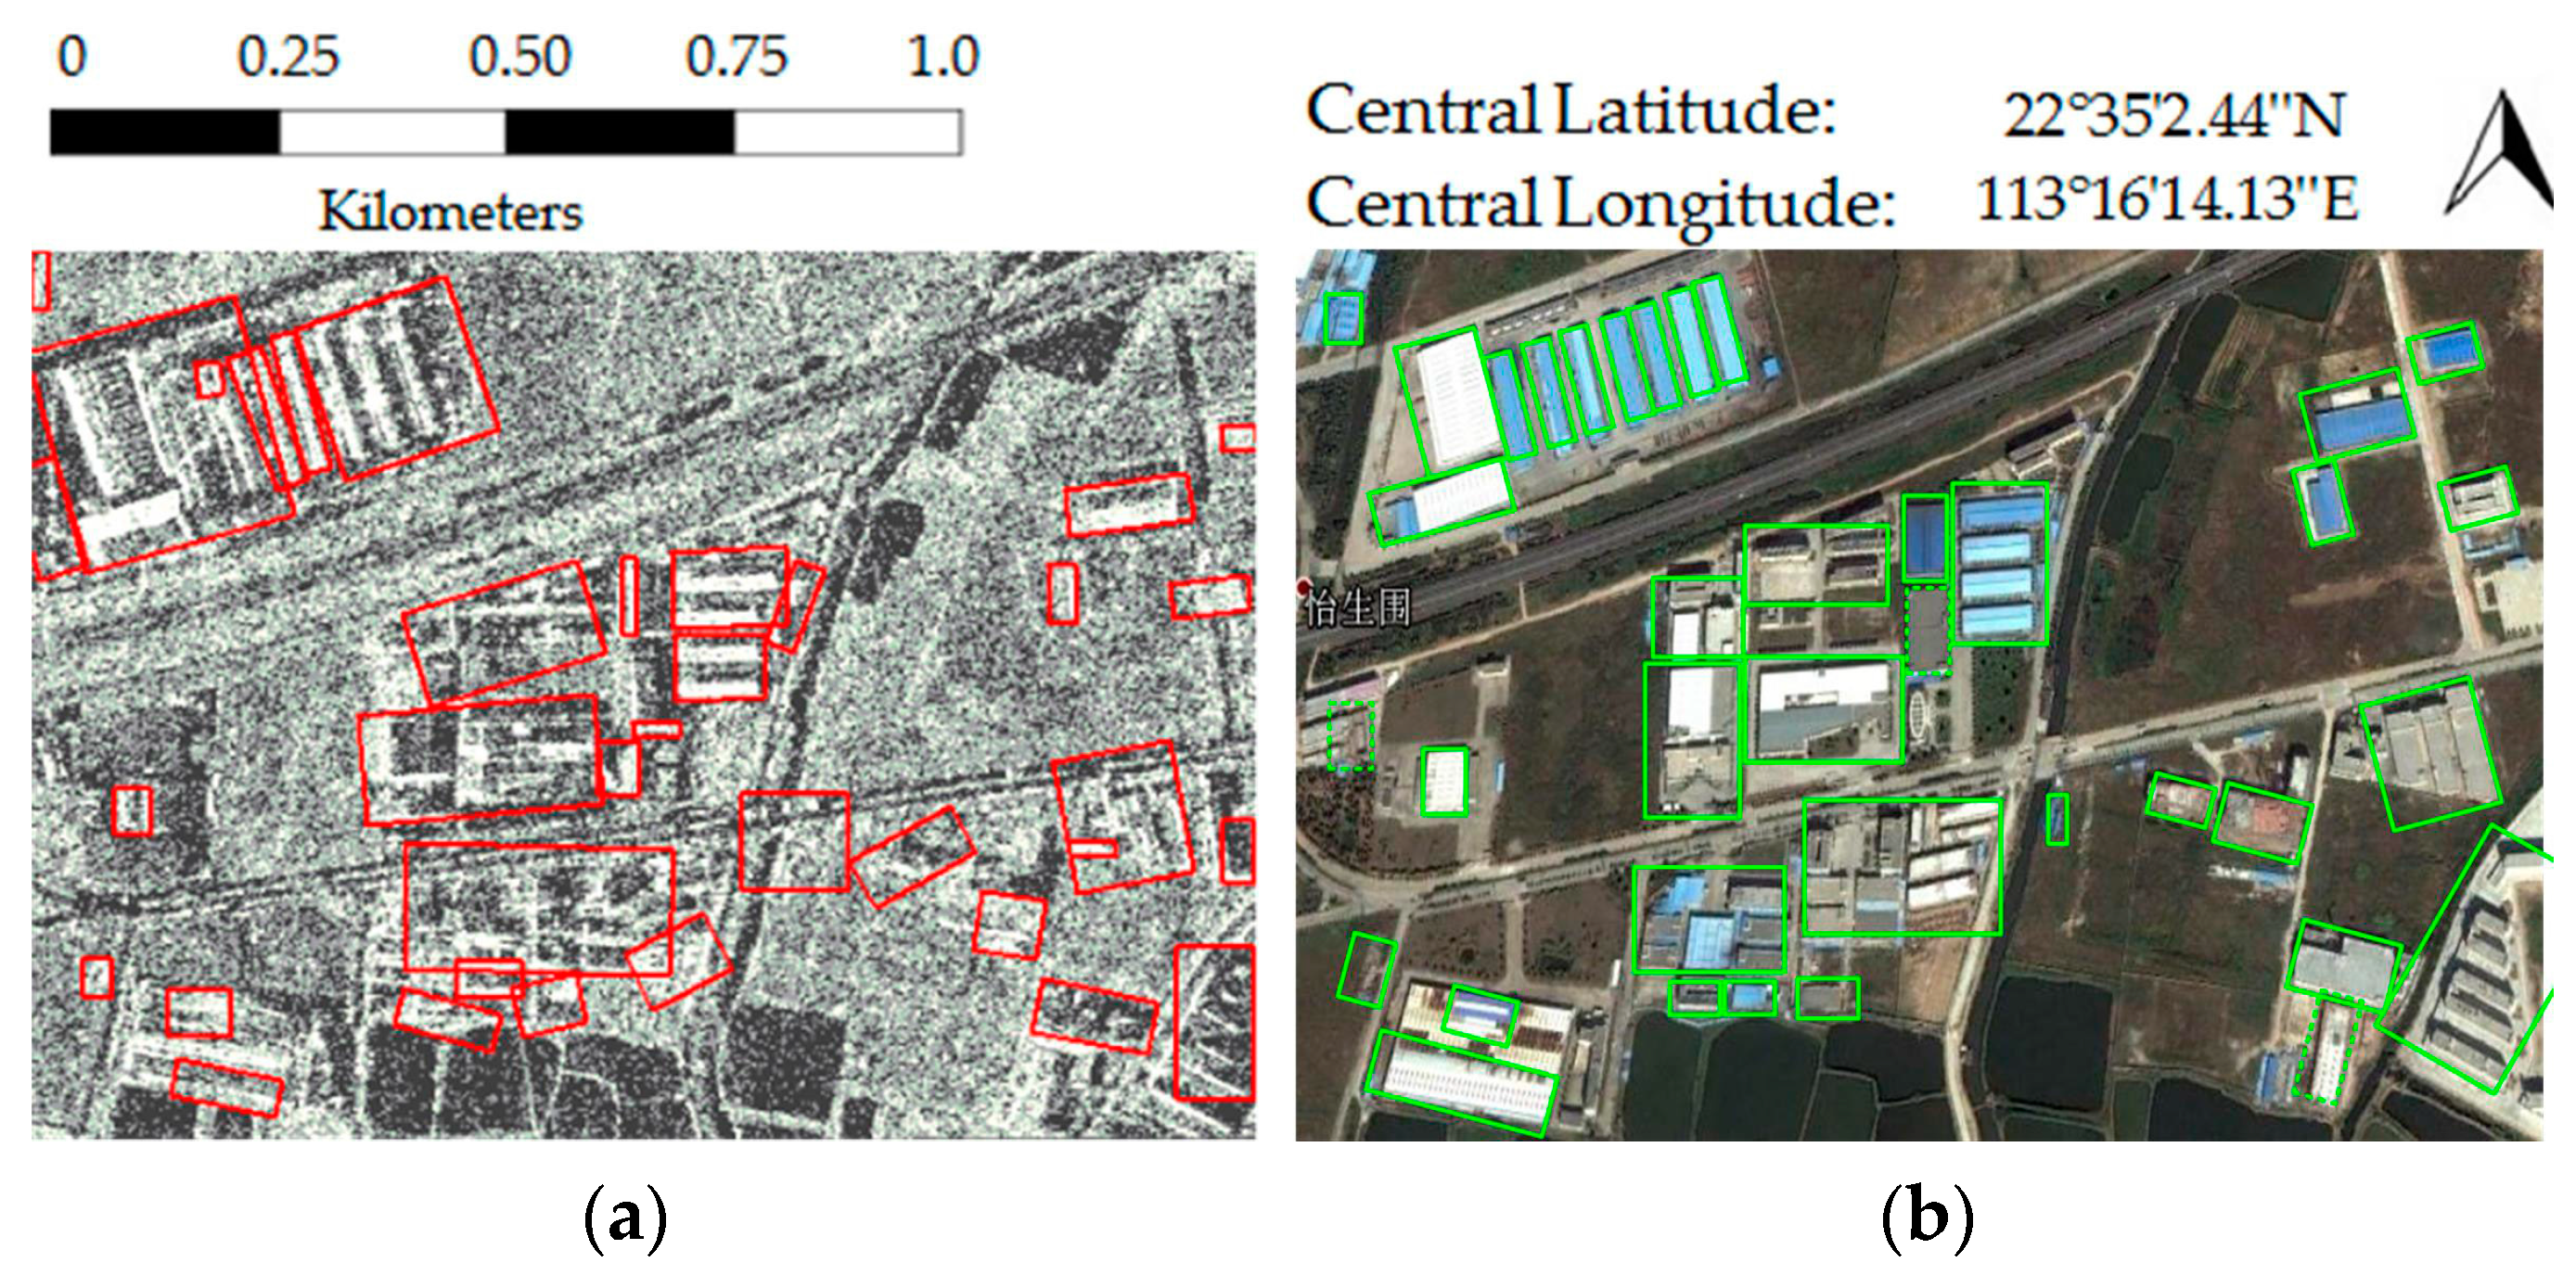
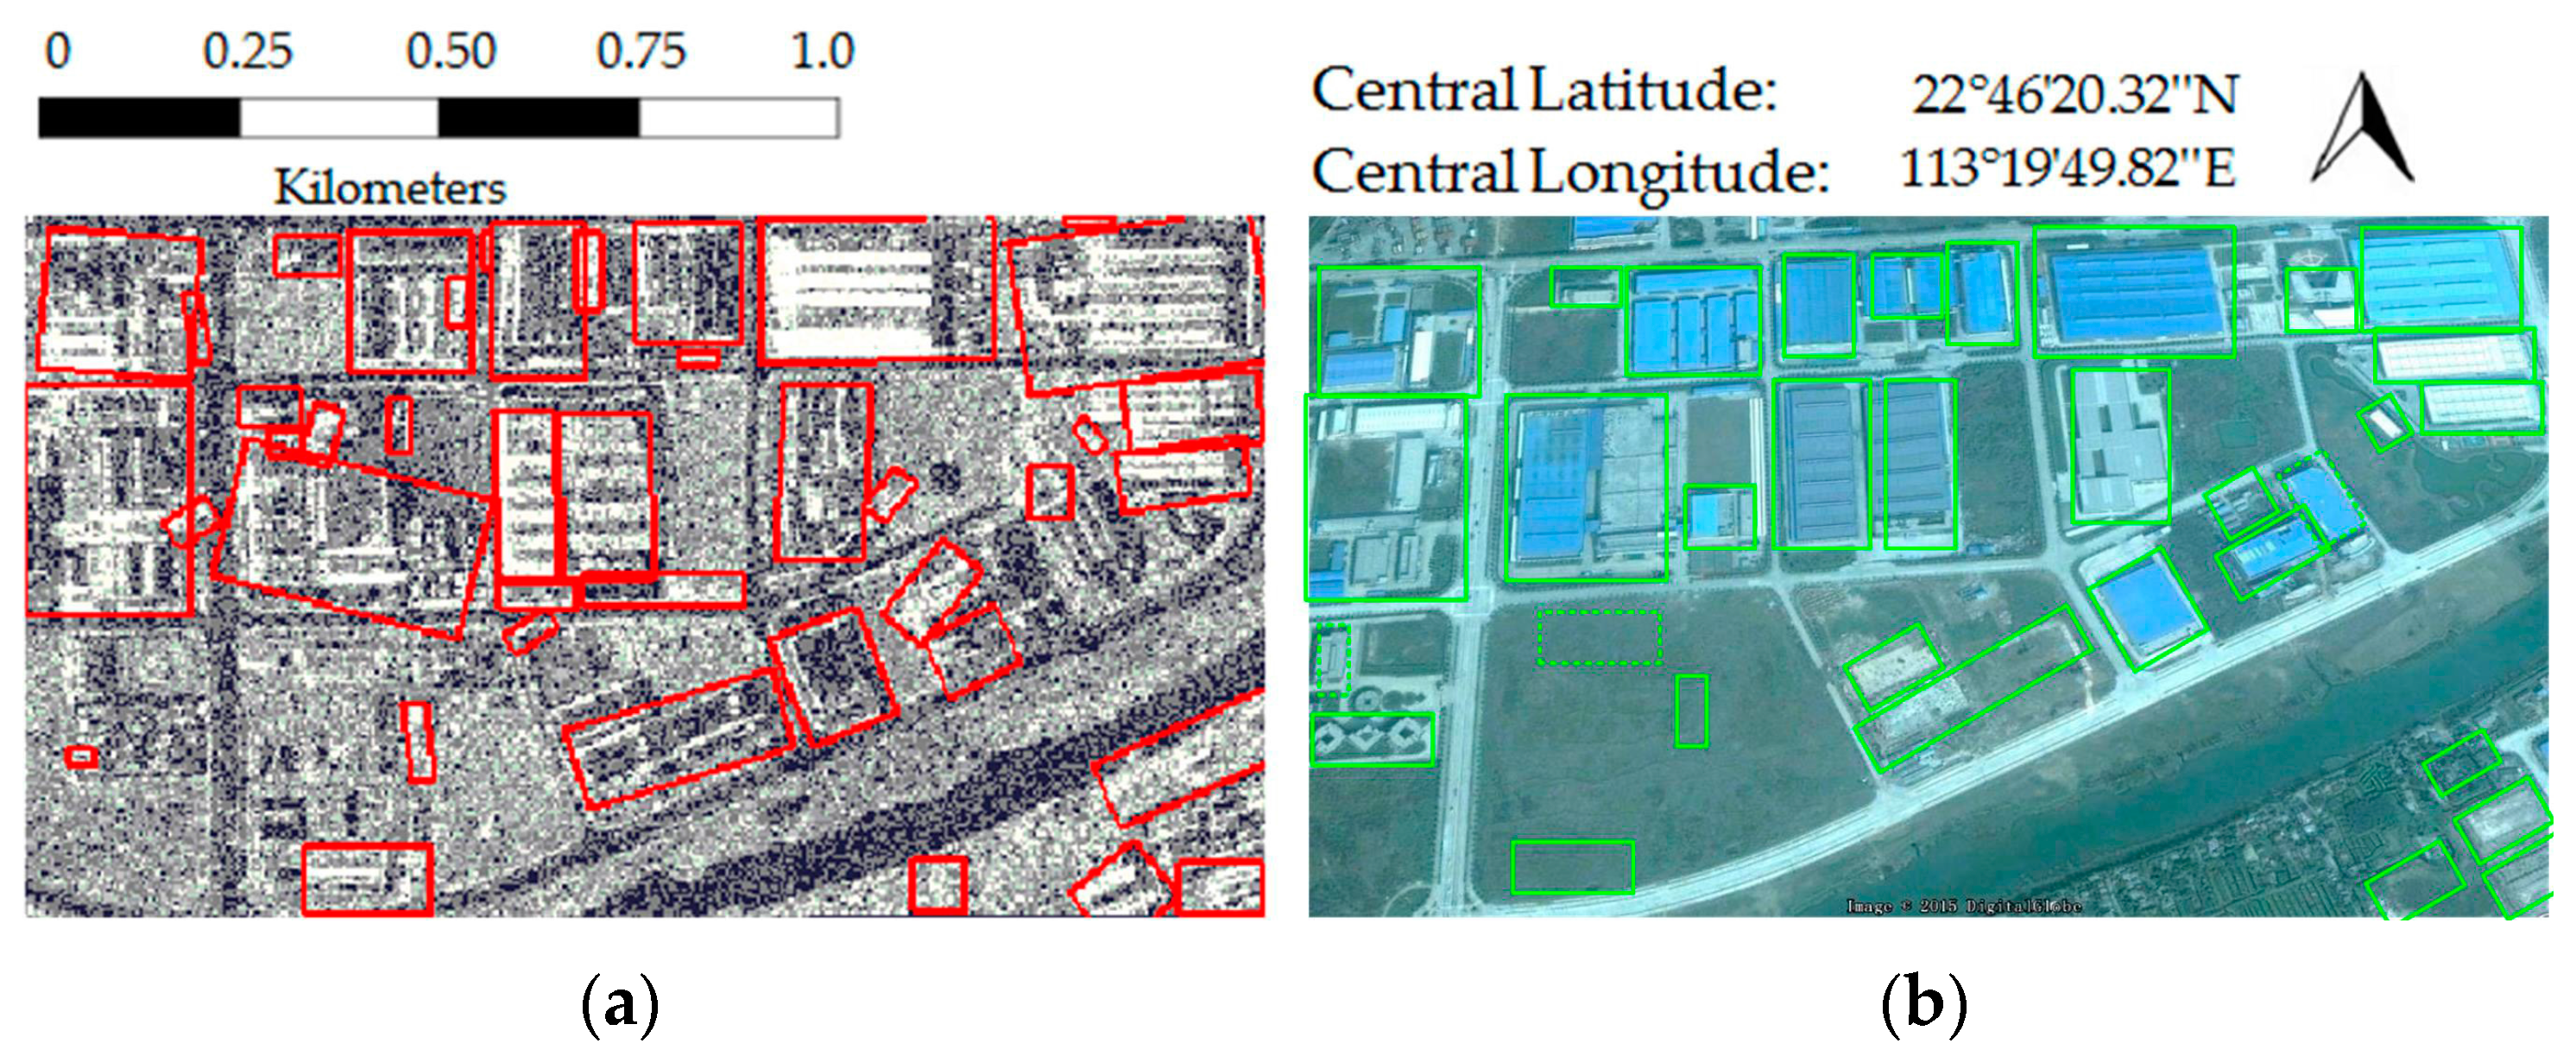
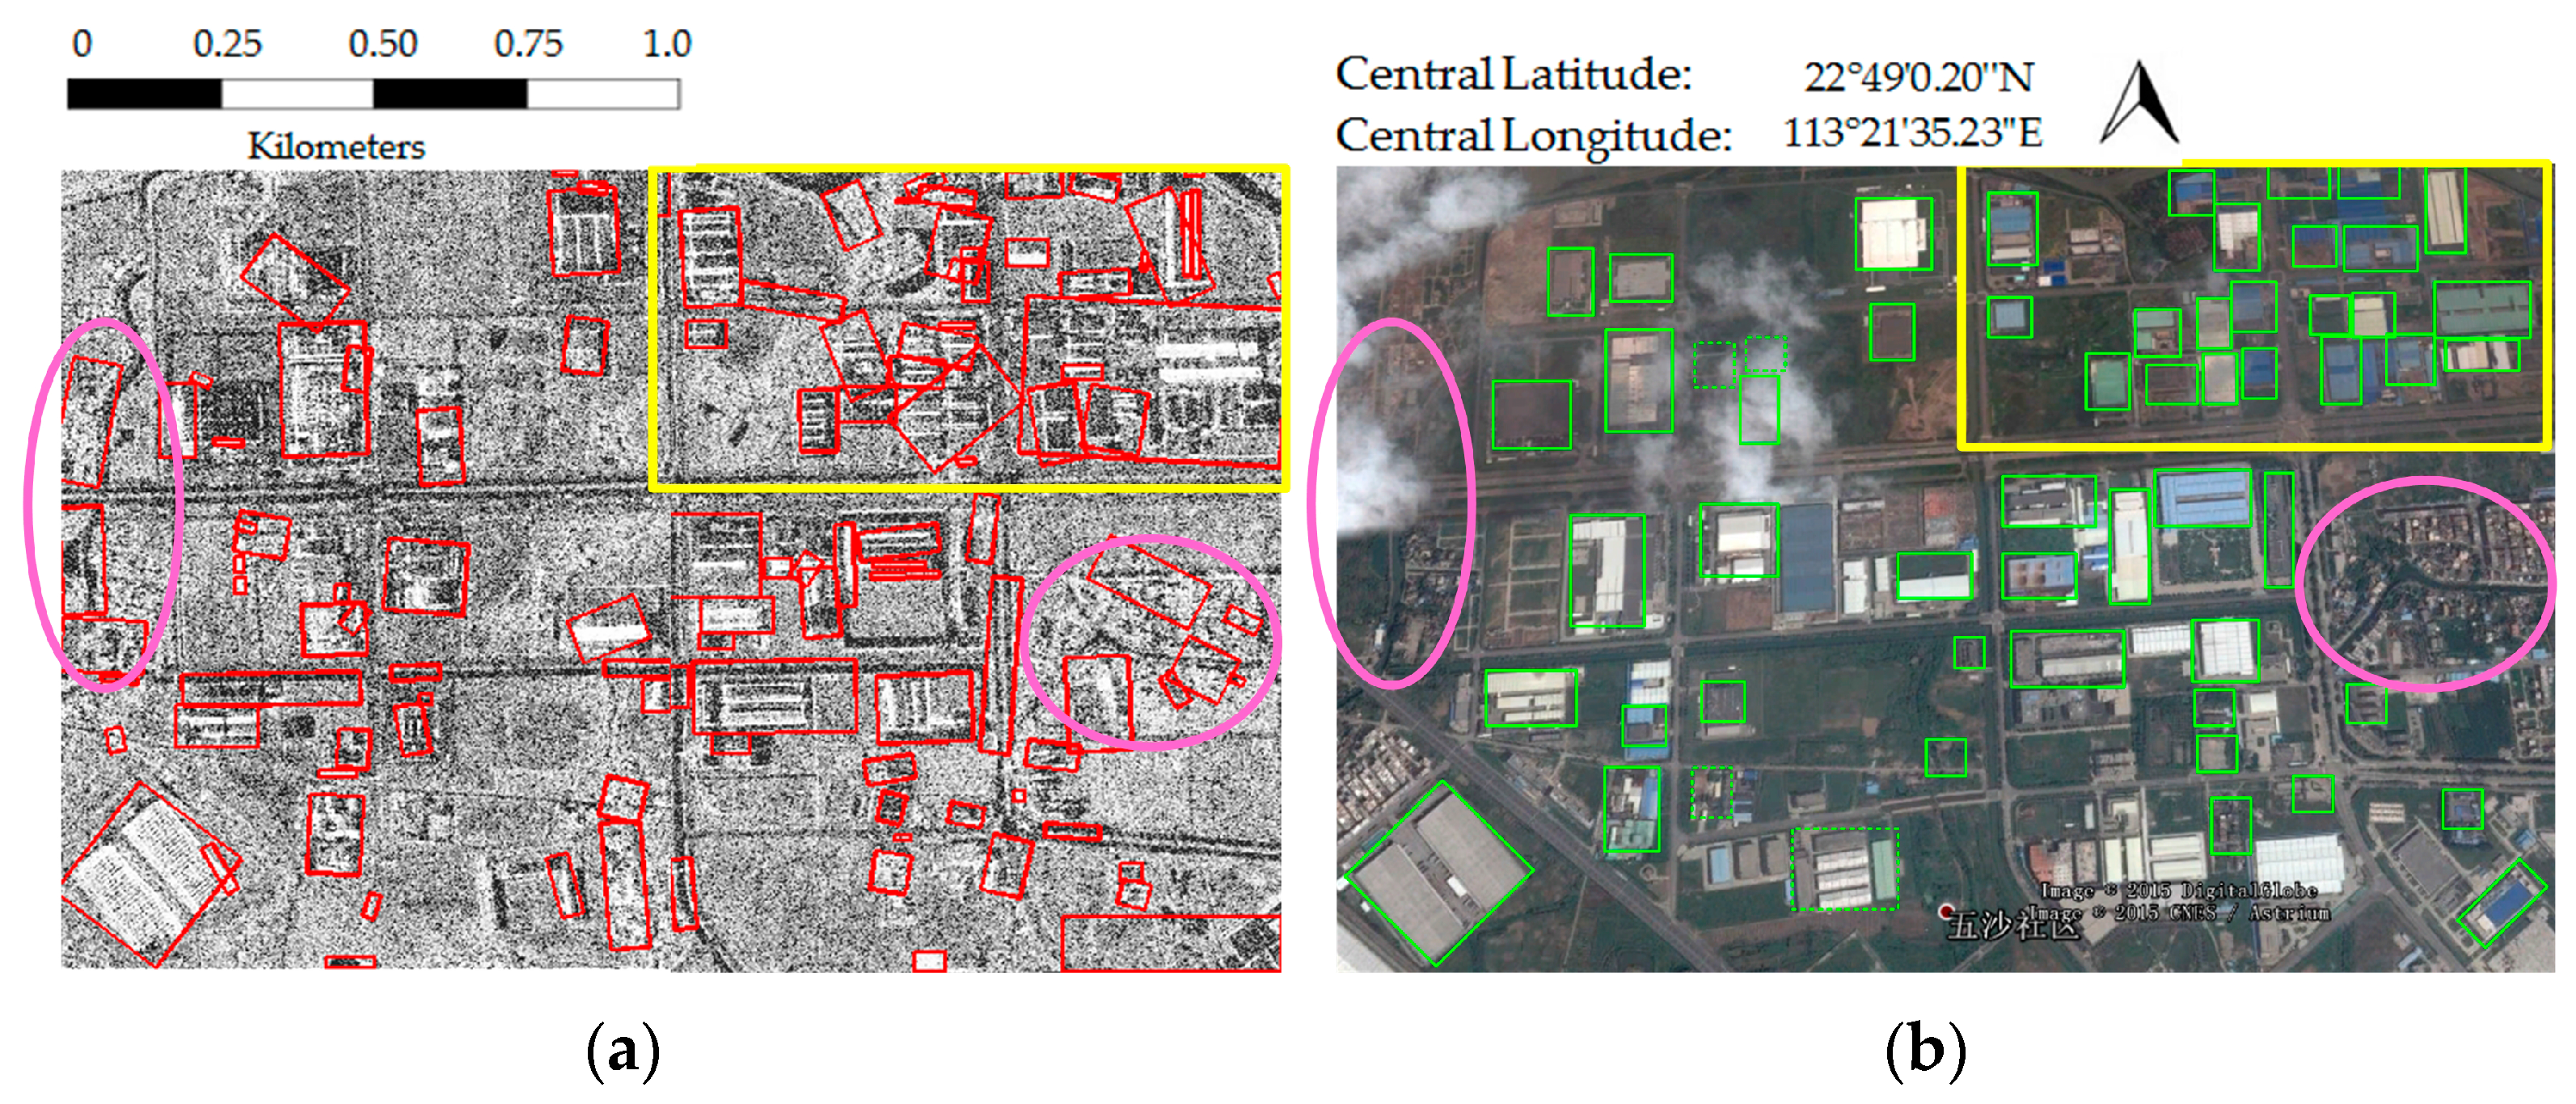
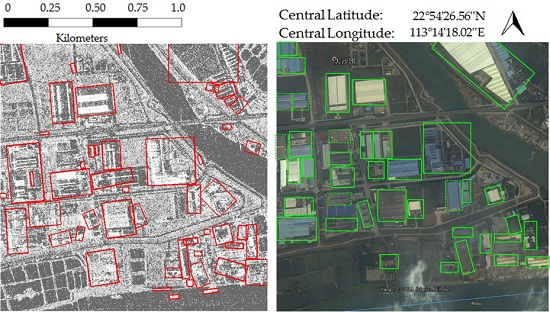
4.2. Results and Evaluations

Figure 5, Figure 6, Figure 7, Figure 8 and Figure 9 show the individual buildings extraction results from the selected data by the proposed method. For Figure 5, Figure 6, Figure 7, Figure 8 and Figure 9, the left shows extraction results (within the red boxes) from SAR data, and the right shows footprints of the buildings (within the green boxes) in corresponding optical images.
Table 4 reports the number of buildings in each selected data and the number of buildings correctly extracted by the proposed method. Moreover, some other assessment indicators have been employed to assess the performance of the proposed method. The split means that the one building radar footprints has been split in more parts. Corresponding, the number of merged buildings indicates that the two neighboring buildings have been identified as one building. Then, the extraction rate is defined as the ratio of the correctly identified buildings to identifiable buildings in SAR images. The false alarm rate is defined as the ratio of false results to the total identified buildings by the method proposed in this paper.
It should be noted here that there are some differences between the labeled buildings and the actual buildings in the lower left corner of Figure 8b, three green boxes without buildings inside them in this optical image. The reason is that the corresponding period data are unavailable from the Google earth. Despite this, we labeled the buildings in Figure 8b according to the actual situation.
For the individual buildings in the experimental dataset, there are significant differences in the building orientations, sizes and shapes. The results show that extraction rates are all over 84%, indicating the effectiveness of the method. For the data with large differences in the size of buildings, like data 3 and 5, the false alarm rates are relatively higher than the other data. In addition, the numbers of split buildings are less than the merged buildings for the total dataset, illustrating that the method is beneficial to obtain the intact and accurate building radar footprints.

5. Discussion

The analyses performed highlight how to adopt semantic properties into building extraction from VHR SAR images, aiming to overcome the heterogeneity and complexity of various building appearances. The experiment results on real TerraSAR-X images show that the proposed method can overcome the diversities of building orientations, building sizes and shapes, reaching relatively high extraction rate for the individual buildings from the test dataset. Especially in Figure 7 and Figure 9, the building sizes and shapes are strikingly different, and moreover, the square fields and ponds in Figure 7 and many pavements in Figure 9 are serious disturbances in building extraction from SAR images. However, the extraction rates of those two data reached 86.8% and 92.9%, and the results are quite intact and distinctive. Since the method is proposed based on the sufficient semantic analysis of building primitives in VHR SAR images, it can effectively differentiate between the individual buildings and the non-building objects which have similar shapes (e.g., the square fields and ponds) or scattering components (e.g., the pavements). In fact, some studies [6,17,19] can achieve good detection rates for linear or L-shaped buildings with specific orientation and similar size. By employing the ontology model, our method can get satisfactory results even for the buildings with different orientations and different structures.
The range of extracted building shapes and sizes are quiet considerable; the building sizes ranged from 250 to 16,000 pixels in our experiments, and correspondingly, the true area was about 400 to 25,000 m2. Considering the applicable requirements to the method and the limitation of the data resolution, we developed this method and restricted the minimum size of the individual buildings. It does occur that in some areas, several compact small houses have extremely similar characteristic on the scattering components with the defined individual buildings. Some compact small houses also include the layover, double-bounce, and shadowing effects, and this is the main reason of the false alarm rates of the results. Furthermore, the size and shape of some compact small houses are similar to the individual buildings that we defined. This phenomenon is particularly evident in data 5 (the magenta elliptical frame of Figure 10), causing a high false alarm rate in this data result. The false alarm is also relatively high in data 3, and by the same token, there are some ships and ports in Figure 7, causing similar scattering components with the buildings.
It is obvious that the number of split buildings is less than the merged buildings in all experiment results, and the proposed method is suitable to extract building with complicated roofs, especially from the results in Figure 8. These show that the ontology method is good for keeping the integrity of buildings, due to the adjacency relations of building primitives that have been applied as important rules in the model. However, it is undesirable that this rule causes some mergers and interferences of the extracted buildings in some dense building areas, especially for the result of data 5 (corresponding to Figure 9 and Figure 10), which has most number of merged buildings. It is obvious that some buildings are quite dense in the yellow box of Figure 10, resulting in some mergers. To prevent the phenomena of merged buildings and false alarms, it is necessary to further strengthen rules about the form of individual buildings. Meanwhile, more precise rules about detecting building primitives are needed.
On the other hand, since the rules or concepts used in the ontology are defined by some low-level descriptors associated with intervals of accepted values, the implementation of the developed ontology into the computational model is indeed a specific task. During this implementation processing, we use the decision tree and the some samples to train the feature thresholds. In the future research, we will work to acquire more accurate ontology implementation approaches.
It should be point out that the influence of object-based segmentation is quite important to the methodology; in detail, the building primitives originate from the image objects that are obtained from the segmentation algorithm. The applied segmentation method is suitable for acquiring meaningful image objects from VHR SAR image. Moreover, it is beneficial for keeping the boundary characteristics of the building primitives. Further experimental validation about the relation between the despeckling and the segmentation should be a relevant extension of the present work. The problem of how to introduce more specific semantic information into the segmentation should also be further studied.

6. Conclusions

In this article, we highlight the problem of extracting individual buildings from SAR images under a semantic expression framework. Unlike most related methods, which focus on detecting low-level features to determine the existence of linear or L-shaped buildings with specific orientations, this paper proposes a novel method that can extract individual buildings with different orientations and sizes from TerraSAR-X images by employing ontological semantic analysis. By combining semantic knowledge with image object characteristics in the ontology model, the method can overcome the heterogeneity of various building appearances in SAR images. A set of experiments for TerraSAR-X images have demonstrated the efficiency of the proposed method: all the extraction rates are above 84%, and the false alarms and merged buildings and split buildings in the results have been analyzed. The results showed that the method can accurately extract buildings with different orientations and different structures using only a single SAR image.
Ontology is a promising solution to address the semantic heterogeneity in VHR remote sensing images, and the proposed method has great expansibility. In the future, we expect to continue refining and validating our research on ontology modeling about other typical artificial objects in VHR SAR images, such as bridges and airports, aiming at interpreting the artificial objects using high-level semantic knowledge and the special scattering characteristics of SAR images.

Acknowledgments

Technology Research and Development of the Major Project of High Resolution Earth Observation System under Grant 03-Y20A10-9001-15/16. Additionally, we would like to thank the reviewers who provided valuable suggestions for this article.

Author Contributions

All authors contributed to forming the general idea of the paper, and helped conceive and design the experiments. Rong Gui created the research design, performed the experiments, analyzed the data, and wrote the draft; Xin Xu conducted the coordination of the research activities and provided critical comments to improve the paper; Hao Dong helped edit the draft and contributed to develop the SAR image segmentation algorithm; Chao Song contributed to the accuracy assessment and manuscript writing; Fangling Pu helped propose and develop the ontology model.

Conflicts of Interest

The authors declare no conflict of interest.

References

  1. Liu, W.; Suzuki, K.; Yamazaki, F. Height estimation for high-rise buildings based on InSAR analysis. In Proceedings of the 2015 Joint Urban Remote Sensing Event (JURSE), Lausanne, French, 30 March–1 April 2015; pp. 1–4.
  2. Ferro, A.; Brunner, D.; Bruzzone, L. Automatic detection and reconstruction of building radar footprints from single VHR SAR images. IEEE Trans. Geosci. Remote Sens. 2013, 51, 935–952. [Google Scholar] [CrossRef]
  3. Soergel, U.; Schulz, K.; Thoennessen, U.; Stilla, U. Integration of 3D data in SAR mission planning and image interpretation in urban areas. Inf. Fusion 2005, 6, 301–310. [Google Scholar] [CrossRef]
  4. Franceschetti, G.; Iodice, A.; Riccio, D. A canonical problem in electromagnetic backscattering from buildings. IEEE Trans. Geosci. Remote Sens. 2002, 40, 1787–1801. [Google Scholar] [CrossRef]
  5. Auer, S.; Donaubauer, A. Buildings in high resolution SAR images—Identification based on CityGML data. ISPRS Ann. Photogramm. Remote Sens. Spat. Inf. Sci. 2015, 3, 9–16. [Google Scholar] [CrossRef]
  6. Chen, S.S.; Wang, H.P.; Xu, F.; Jin, Y.Q. Automatic recognition of isolated buildings on single-aspect SAR image using range detector. IEEE Geosci. Remote Sens. Lett. 2015, 12, 219–223. [Google Scholar] [CrossRef]
  7. Franceschetti, G.; Iodice, A.; Riccio, D.; Ruello, G. SAR raw signal simulation for urban structures. IEEE Trans. Geosci. Remote Sens. 2003, 41, 1986–1995. [Google Scholar] [CrossRef]
  8. Wang, J.; Qin, Q.; Chen, L.; Ye, X.; Qin, X.; Wang, J.; Chen, C. Automatic building extraction from very high resolution satellite imagery using line segment detector. In Proceedings of the IEEE International Geoscience and Remote Sensing Symposium (IGRASS), Melbourne, Vic, Australia, 21–26 July 2013; pp. 212–215.
  9. Wang, J.; Yang, X.; Qin, X.; Ye, X.; Qin, Q. An efficient approach for automatic rectangular building extraction from very high resolution optical satellite imagery. IEEE Geosci. Remote Sens. Lett. 2015, 12, 487–491. [Google Scholar] [CrossRef]
  10. Uslu, E.; Albayrak, S. Synthetic aperture radar image clustering with curvelet subband Gauss distribution parameters. Remote Sens. 2014, 6, 5497–5519. [Google Scholar] [CrossRef]
  11. Sportouche, H.; Tupin, F.; Denise, L. Extraction and three-dimensional reconstruction of isolated buildings in urban scenes from high-resolution optical and SAR spaceborne images. IEEE Trans. Geosci. Remote Sens. 2011, 49, 3932–3946. [Google Scholar] [CrossRef]
  12. Soergel, U.; Thoennessen, U.; Stilla, U. Reconstruction of buildings from interferometric SAR data of built-up areas. In Proceedings of the ISPRS Conference Photogrammetric Image Analysis, Munich, Germany, 17–19 September 2003; pp. 59–64.
  13. Cellier, F.; Oriot, H.; Nicolas, J.M. Hypothesis management for building reconstruction from high resolution InSAR imagery. In Proceedings the IEEE International Geoscience and Remote Sensing Symposium (IGRASS), Denver, CO, USA, 31 July–4 August 2003; pp. 3639–3642.
  14. Thiele, A.; Cadario, E.; Schulz, K.; Thoennessen, U.; Soergel, U. Building recognition from multi-aspect high-resolution InSAR data in urban areas. IEEE Trans. Geosci. Remote Sens. 2007, 45, 3583–3593. [Google Scholar] [CrossRef]
  15. Xu, F.; Jin, Y.Q. Automatic Reconstruction of building objects from multi-aspect meter-resolution SAR images. IEEE Trans. Geosci. Remote Sens. 2007, 45, 2336–2353. [Google Scholar] [CrossRef]
  16. Simonetto, E.; Oriot, H.; Garello, R. Rectangular building extraction from stereoscopic airborne radar images. IEEE Trans. Geosci. Remote Sens. 2005, 43, 2386–2395. [Google Scholar] [CrossRef]
  17. Zhao, L.J.; Zhou, X.G.; Kuang, G.Y. Building detection from urban SAR image using building characteristics and contextual information. EURASIP J. Adv. Signal Proc. 2013, 1, 1–16. [Google Scholar] [CrossRef]
  18. Quartulli, M.; Datcu, M. Stochastic geometrical modeling for built-up area understanding from a single SAR intensity image with meter resolution. IEEE Trans. Geosci. Remote Sens. 2004, 42, 1996–2003. [Google Scholar] [CrossRef]
  19. Zhang, F.L.; Shao, Y.; Zhang, X.; Balz, T. Building L-shape footprint extraction from high resolution SAR image. In Proceedings of the IEEE Joint Urban Remote Sensing Event, Munich, Germany, 11–13 April 2011; pp. 273–276.
  20. Soergel, U.; Thoennessen, U.; Brenner, A.; Stilla, U. High-resolution SAR data: New opportunities and challenges for the analysis of urban areas. IEE Proc. Radar Sonar Navig. 2006, 153, 294–300. [Google Scholar] [CrossRef]
  21. Ferro, A.; Brunner, D.; Bruzzone, L. Building detection and radar footprint reconstruction from single VHR SAR images. In Proceedings of the IEEE International Geoscience and Remote Sensing Symposium (IGRASS), Honolulu, HI, USA, 25–30 July 2010; pp. 292–295.
  22. Blaschke, T. Object based image analysis: A new paradigm in remote sensing? In Proceedings of the American Society for Photogrammetry and Remote Sensing Conference, Baltimore, MD, USA, 24–28 March 2013; pp. 36–43.
  23. Morandeira, N.S.; Grimson, R.; Kandus, P. Assessment of SAR speckle filters in the context of object-based image analysis. Remote Sens. Lett. 2016, 7, 150–159. [Google Scholar] [CrossRef]
  24. D'Elia, C.; Ruscino, S.; Abbate, M.; Aiazzi, B.; Baronti, S.; Alparone, L. SAR image classification through information-theoretic textural features, MRF segmentation, and object-oriented learning vector quantization. IEEE J. Sel. Top. Appl. Earth Obs. Remote Sens. 2014, 7, 1116–1126. [Google Scholar] [CrossRef]
  25. Belgiu, M.; Tomljenovic, I.; Lampoltshammer, T.J.; Blaschke, T.; Hofle, B. Ontology-based classification of building types detected from airborne laser scanning data. Remote Sens. 2014, 6, 1347–1366. [Google Scholar] [CrossRef]
  26. Arvor, D.; Durieux, L.; Andrés, S.; Laporte, M.A. Advances in geographic object-based image analysis with ontologies: A review of main contributions and limitations from a remote sensing perspective. ISPRS J. Photogramm. Remote Sens. 2013, 82, 125–137. [Google Scholar] [CrossRef]
  27. Durand, N.; Derivaux, S.; Forestier, G.; Wemmert, C.; Gancarski, P.; Boussaid, O.; Puissant, A. Ontology-based object recognition for remote sensing image interpretation. In Proceedings of the 19th IEEE International Conference on Tools with Artificial Intelligence (ICTAI), Patras, Greece, 29–31 October 2007; pp. 472–479.
  28. Bouyerbou, H.; Bechkoum, K.; Benblidia, N.; Lepage, R. Ontology-based semantic classification of satellite images: Case of major disaster. In Proceedings of the IEEE International Geoscience and Remote Sensing Symposium, Quebec, QC, Canada, 13–18 July 2014; pp. 2347–2350.
  29. Derivaux, S.; Durand, N.; Wemmert, C. On the complementarity of an ontology and a nearest neighbour classifier for remotely sensed image interpretation. In Proceedings of the IEEE International Geoscience and Remote Sensing Symposium, Barcelona, Spain, 23–27 July, 2007; pp. 3983–3986.
  30. Yang, J.; Jones, T.; Caspersen, J.; He, Y. Object-Based Canopy Gap Segmentation and classification: Quantifying the pros and cons of integrating optical and LiDAR data. Remote Sens. 2015, 7, 15917–15932. [Google Scholar] [CrossRef]
  31. Nebiker, S.; Lack, N.; Deuber, M. Building change detection from historical aerial photographs using dense image matching and object-based image analysis. Remote Sens. 2014, 6, 8310–8336. [Google Scholar] [CrossRef]
  32. Soergel, U. Radar Remote Sensing of Urban Areas; Springer Dordrecht Heidelberg: Heidelberg, Germany, 2010; pp. 191–194. [Google Scholar]
  33. Thiele, A.; Cadario, E.; Schulz, K.; Thoennessen, U.; Soergel, U. Feature extraction of gable-roofed buildings from multi-aspect high-resolution InSAR data. In Proceedings of the IEEE International Geoscience and Remote Sensing Symposium, Barcelona, Spain, 23–27 July 2007; pp. 262–265.
  34. Brunner, D.; Bruzzone, L.; Ferro, A.; Lemoine, G. Analysis of the reliability of the double bounce scattering mechanism for detecting buildings in VHR SAR images. In Proceedings of the IEEE Radar Conference, Pasadena, CA, USA, 4–8 May 2009; pp. 1–6.
  35. Amitrano, D.; Martino, G.D.; Iodice, A.; Riccio, D.; Ruello, G. A new framework for SAR multitemporal data RGB representation: Rationale and products. IEEE Trans. Geosci. Remote Sens. 2015, 53, 117–133. [Google Scholar] [CrossRef]
  36. Datcu, M.; Seidel, K. Human-centered concepts for exploration and understanding of Earth Observation images. IEEE Trans. Geosci. Remote Sens. 2005, 43, 601–609. [Google Scholar] [CrossRef]
  37. Madhok, V.; Landgrebe, A. A process model for remote sensing data analysis. IEEE Trans. Geosci. Remote Sens. 2002, 40, 680–686. [Google Scholar] [CrossRef]
  38. Agarwal, P. Ontological considerations in GIScience. Int. J. Geogr. Inf. Sci. 2005, 19, 501–536. [Google Scholar] [CrossRef]
  39. Lutz, M.; Klien, E. Ontology-based retrieval of geographic information. Int. J. Geogr. Inf. Sci. 2006, 20, 233–260. [Google Scholar] [CrossRef]
  40. Forestier, G.; Puissant, A.; Wemmert, C.; Gançarski, P. Knowledge-based region labeling for remote sensing image interpretation. Comput. Environ. Urban Syst. 2012, 36, 470–480. [Google Scholar] [CrossRef]
  41. De Bertrand de Beuvron, F.; Marc-Zwecker, S.; Puissant, A.; Zanni-Merk, C. From expert knowledge to formal ontologies for semantic interpretation of the urban environment from satellite images. Int. J. Knowl. Based Intell. Eng. Syst. 2013, 17, 55–65. [Google Scholar] [CrossRef]
  42. Dumitru, C.O.; Cui, S.; Schwarz, G.; Datcu, M. Information content of very-high-resolution SAR images: Semantics, geospatial context, and ontologies. IEEE J. Sel. Top. Appl. Earth Obs. Remote Sens. 2014, 8, 1635–1650. [Google Scholar] [CrossRef]
  43. Messaoudi, W.; Farah, I.R.; Solaiman, B. A new ontology for semantic annotation of remotely sensed images. In Proceedings of the 1st International Conference on Advanced Technologies for Signal and Image Processing, Sousse, Tunisia, 17–19 March 2014; pp. 36–41.
  44. Guarino, N. Formal ontology and information systems. In Proceedings of the International Conference on Formal Ontology in Information Systems, Trento, Italy, 6–8 June 1998; pp. 3–15.
  45. Chatterjee, R.; Matsuno, F. Robot description ontology and disaster scene description ontology: Analysis of necessity and scope in rescue infrastructure context. Adv. Robot. 2005, 19, 839–859. [Google Scholar] [CrossRef]
  46. Gruber, T.R. Toward principles for the design of ontologies used for knowledge sharing? Int. J. Hum. Comput. Stud. 1995, 43, 907–928. [Google Scholar] [CrossRef]
  47. Manola, F.; Miller, E. RDF Primer, W3C Recommendation. World Wide Web Consortium. Available online: https://www.w3.org/TR/rdf-primer/ (accessed on 20 August 2016).
  48. Brickley, D.; Guha, R.V. RDF Vocabulary Description Language 1.0: RDF Schema, W3C Recommendation. World Wide Web Consortium. Available online: https://www.w3.org/TR/2004/REC-rdf-schema-20040210/ (accessed on 20 August 2016).
  49. Grau, B.C.; Horrocks, I.; Motik, B.; Parsia, B.; Patel-Schneider, P.; Sattler, U. OWL 2: The next step for OWL. Web Semant. Sci. Serv. Agents World Wide Web 2008, 6, 309–322. [Google Scholar] [CrossRef]
  50. Isaac, A.; Summers, E. SKOS Simple Knowledge Organization System Primer, W3C Recommendation. World Wide Web Consortium. Available online: https://www.w3.org/TR/skos-primer/ (accessed on 20 August 2016).
  51. Jyothi, B.N.; Babu, G.R.; Krishna, I.V.M. Object oriented and multi-scale image analysis: Strengths, weaknesses, opportunities and threats-a review. J. Comput. Sci. 2008, 4, 706–712. [Google Scholar] [CrossRef]
  52. Pesaresi, M.; Bianchin, A. Recognizing settlement structure using mathematical morphology and image texture. In Remote Sensing and Urban Analysis; Donnay, J.P., Barnsley, M.J., Longley, P.A., Eds.; Taylor and Francis: New York, NY, USA, 2001; pp. 55–67. [Google Scholar]
  53. Li, W.; Benie, G.B.; He, D.C.; Wang, S.R.; Ziou, D.; Gwyn, Q.H.J. Watershed-based hierarchical SAR image segmentation. Int. J. Remote Sens. 1999, 20, 3377–3390. [Google Scholar] [CrossRef]
  54. Sun, H.; Su, F.; Zhang, Y. Modified ROA algorithm applied to extract linear features in SAR images. In Proceedings of the IEEE 1st International Symposium on Systems and Control in Aerospace and Astronautics, Harbin, China, 19–21 January 2006; pp. 1209–1213.
  55. Grimaud, M. New measure of contrast: The dynamics. Image Algebra Morphol. Image Proc. III 1992, 1769, 292–305. [Google Scholar]
  56. Chellappa, R.; Chatterjee, S. Classification of textures using Gaussian Markov random fields. IEEE Trans. Acoust. Speech Signal Proc. 1985, 33, 959–963. [Google Scholar] [CrossRef]
  57. Christina, C.; Jean-François, F.; Nicolas, B.; Nicolas, V.; Michel, P. Rapid urban mapping using SAR/optical imagery synergy. Sensors 2008, 8, 7125–7143. [Google Scholar]
Figure 1. The building aspect angle φ.
Remotesensing 08 00708 g001
Figure 2. Flowchart of the proposed method.
Remotesensing 08 00708 g002
Figure 3. The building ontology developed by Protégé 5.0.
Remotesensing 08 00708 g003
Figure 4. The applied workflow of object-based segmentation.
Remotesensing 08 00708 g004
Figure 5. The experimental result of data 1. (a) Extracted buildings (within the red boxes) on SAR image; (b) Footprints of the buildings (within the green boxes) in corresponding optical image.
Remotesensing 08 00708 g005
Figure 6. The experimental result of data 2. (a) Extracted buildings (within the red boxes) on SAR image; (b) Footprints of the buildings (within the green boxes) in corresponding optical image.
Remotesensing 08 00708 g006
Figure 7. The experimental result of data 3. (a) Extracted buildings (within the red boxes) on SAR image; (b) Footprints of the buildings (within the green boxes) in corresponding optical image.
Remotesensing 08 00708 g007
Figure 8. The experimental result of data 4. (a) Extracted buildings (within the red boxes) on SAR image; (b) Footprints of the buildings (within the green boxes) in corresponding optical image.
Remotesensing 08 00708 g008
Figure 9. The experimental result of data 5. (a) Extracted buildings (within the red boxes) on SAR image; (b) Footprints of the buildings (within the green boxes) in corresponding optical image.
Remotesensing 08 00708 g009
Figure 10. Additional illustrations of the results. (a) Extracted buildings (within the red boxes) on SAR image; (b) Footprints of the buildings (within the green boxes) in corresponding optical image.
Remotesensing 08 00708 g010
Table 1. The building scattering model and samples.
Aspect AngleScattering ModelBuilding SampleCorresponding Optical Image
φ = 90° Remotesensing 08 00708 i001 Remotesensing 08 00708 i002 Remotesensing 08 00708 i003
φ = 90° Remotesensing 08 00708 i004 Remotesensing 08 00708 i005 Remotesensing 08 00708 i006
φ = 0° Remotesensing 08 00708 i007 Remotesensing 08 00708 i008 Remotesensing 08 00708 i009
φ = 0° Remotesensing 08 00708 i010 Remotesensing 08 00708 i011 Remotesensing 08 00708 i012
Table 2. The object features and their meanings.
CategoryNameThe Formula of FeaturesThe Significance of Features
LabelObject label--Used to identify objects
Gray featureMean μ = 1 n i = 0 n P i The average gray value of objects
Standard deviation σ = 1 n 1 i = 0 n ( P i μ ) 2 Used to represent gray level distribution of objects
Texture featureHomogeneity h o m = i = 0 L 1 j = 0 L 1 p ^ ( i , j ) 1 + | i j | Degree of object uniformity
Entropy e n t = i = 0 L 1 j = 0 L 1 p ^ ( i , j ) log ( p ^ ( i , j ) ) The amount of information
Dissimilarity d i s = i = 0 L 1 j = 0 L 1 | i j | p ^ ( i , j ) Reflect the image sharpness and texture groove depth level
Energy e n e = i = 0 L 1 j = 0 L 1 p ^ 2 ( i , j ) Reflect the image gray distribution and texture fineness
Shape featureArea A = i = 1 M j = 1 N P i , j × Δ 2 Total pixel number of an object
Wide--Width of the object minimum bounding rectangle
Rectangle degree A B Ratio of object area and the object minimum bounding rectangle area
Solidity A C Ratio of object area and the object minimum bounding polygon area
Density d = n 1 + V a r ( X ) + V a r ( Y ) It describes the extent of the object. The larger the value, the closer the object is square
Imagery parameter featureMain direction--The angle between SAR range direction and the major axis of object external ellipse
Orientation relationship of objects--Determine the specific position relationship between objects according SAR range direction
Topological featureadjacent objects--The labels of all adjacent objects with object A
Note: In above table, symbols are explained as below, Pi: pixel gray value; n: pixels number in object; B is area of the minimum bounding rectangle; C is area of the minimum bounding polygon area; X, Y are the vectors containing all the pixel coordinates within an object; Var (X) is variance of X. Moreover, the explanation of texture features is as follows. In an image, any pixel (x, y) and pixel (x + a, y + b) can form a combination, expressed as (i, j), i is the gray value of (x, y), j is the gray value of (x + a, y + b). We set the gray value level to L, and the (i, j) have L2 kinds of values. In the statistical area, the values of a and b are constants, we first count the occurrences of each kind of (i, j), and then they are normalized as probability p ^ ( i , j ) , then, the [P (i, j)]L×L is GLCM.
Table 3. Basic information and characteristics of the selected experimental data.
Experimental Dataset NumberImage Sizes (Pixels)Degree of Building Orientation Diversity Other Features of the Buildings
1800 × 1050basically the samerelatively dense
21100 × 800quite differentseveral clusters
31200 × 1200quite differentdifferent sizes
41240 × 700differentcomplicated roof
52040 × 1360differentmixed with small houses
Table 4. Accuracy assessment.
Experimental Dataset NumberBuilding NumberExtractionFalse AlarmsSplitMergedExtraction Rate (%)False Alarm Rate (%)
1463942384.88.7
2373510694.62.7
3383372686.818.4
4332811287.93.0
55753123892.921.1

