
A Method for Downscaling FengYun-3B Soil Moisture Based on Apparent Thermal Inertia

Abstract
:
1. Introduction
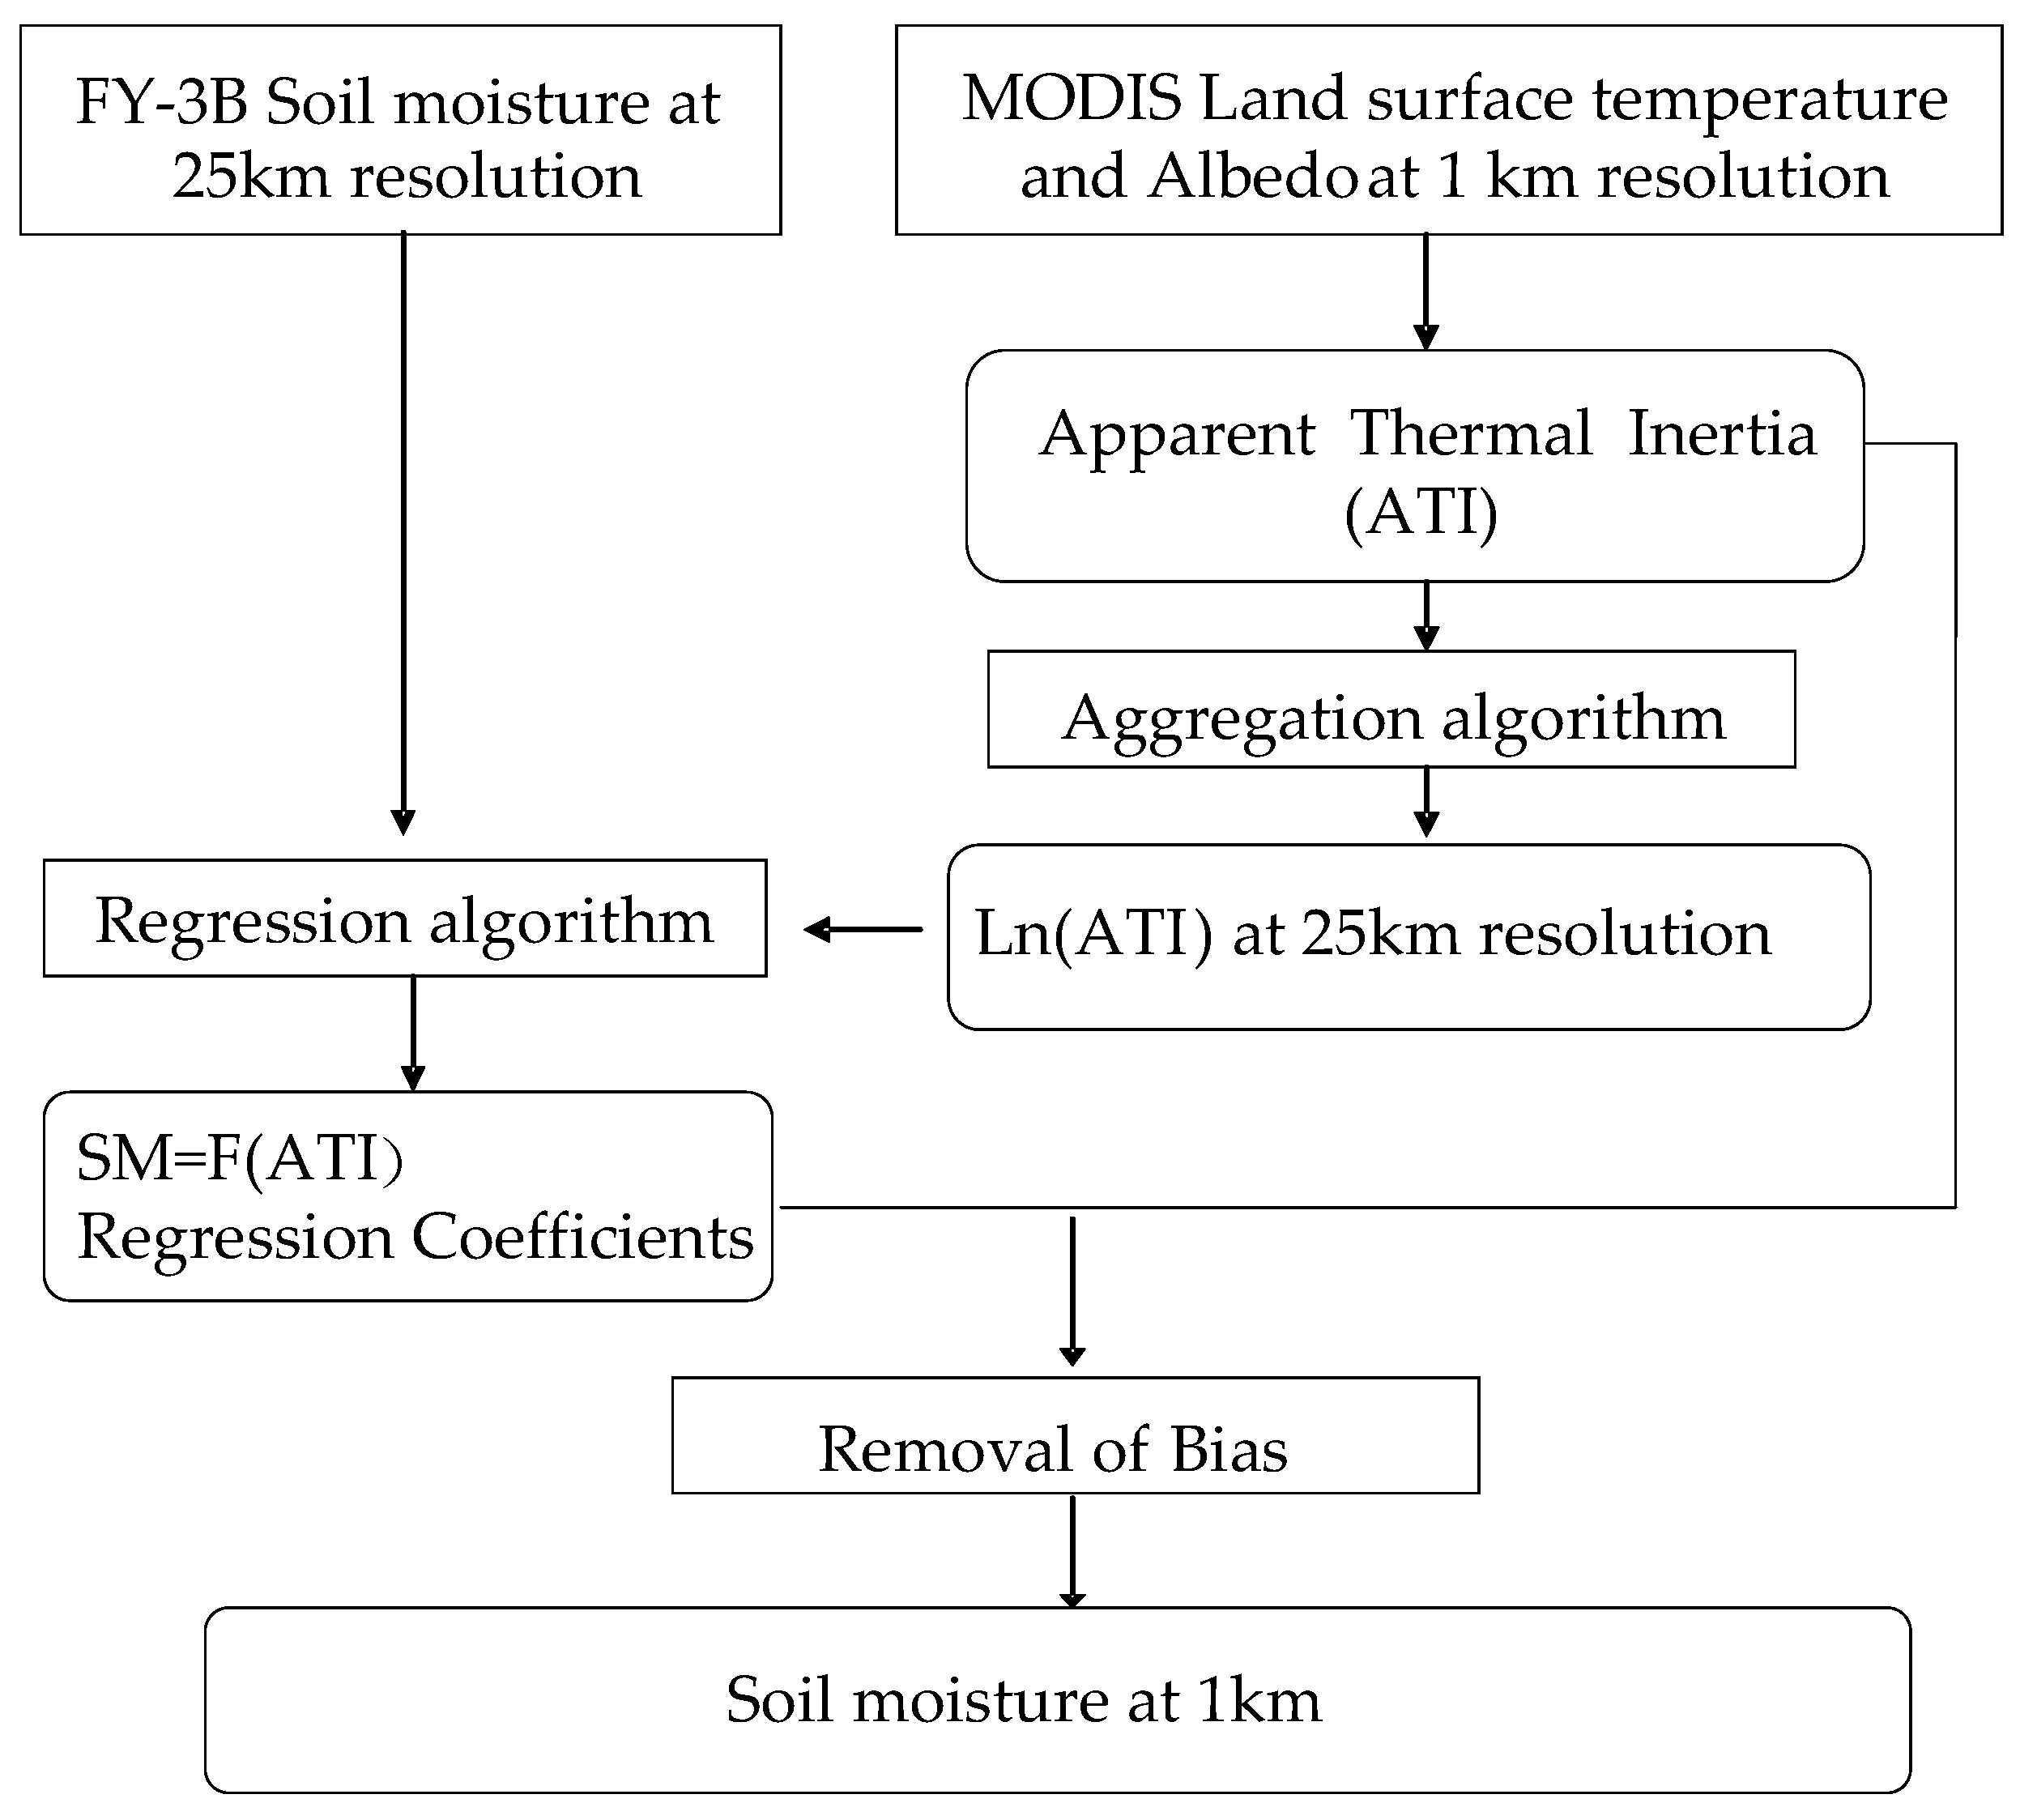
2. Method
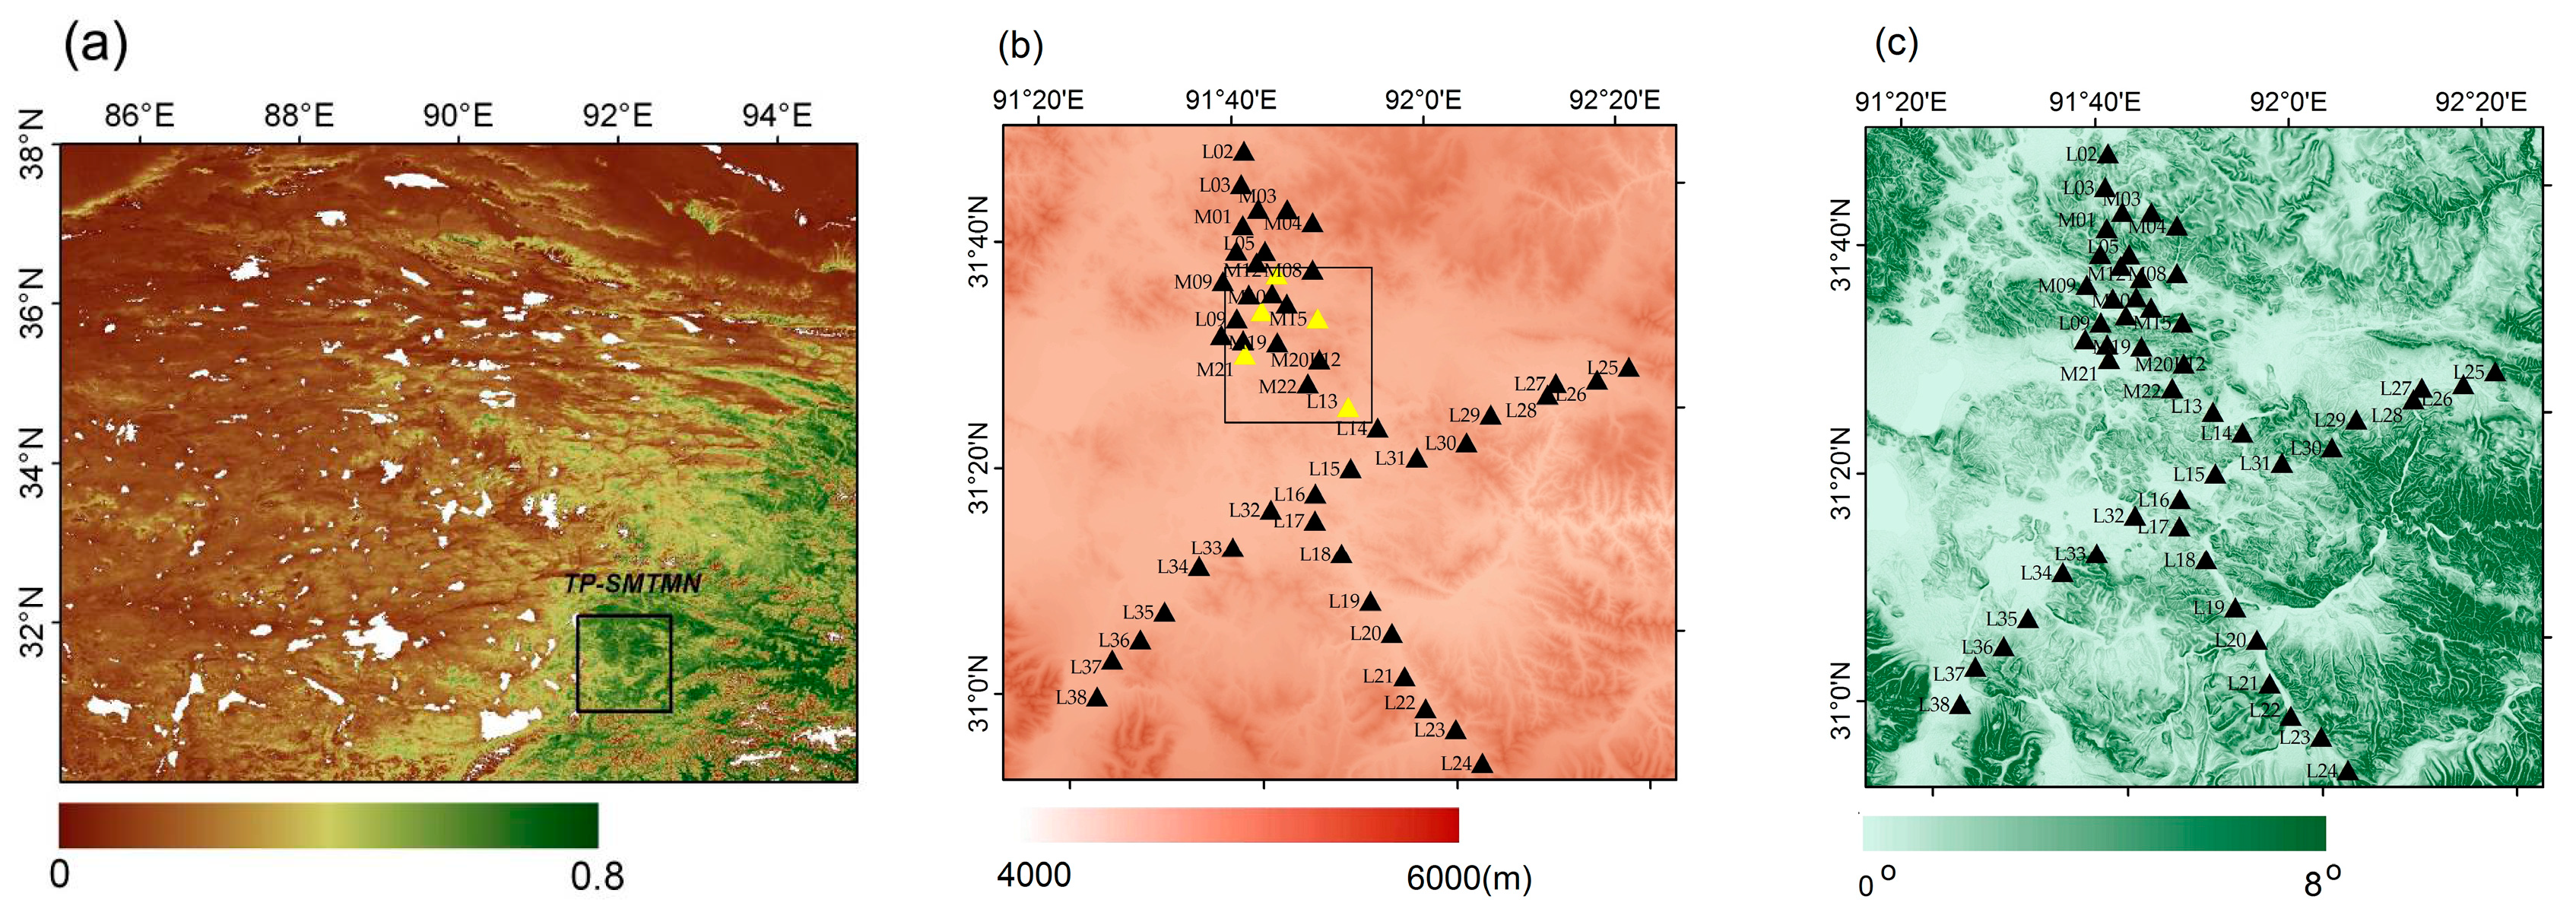
3. Study Area and Data
4. Results and Discussion
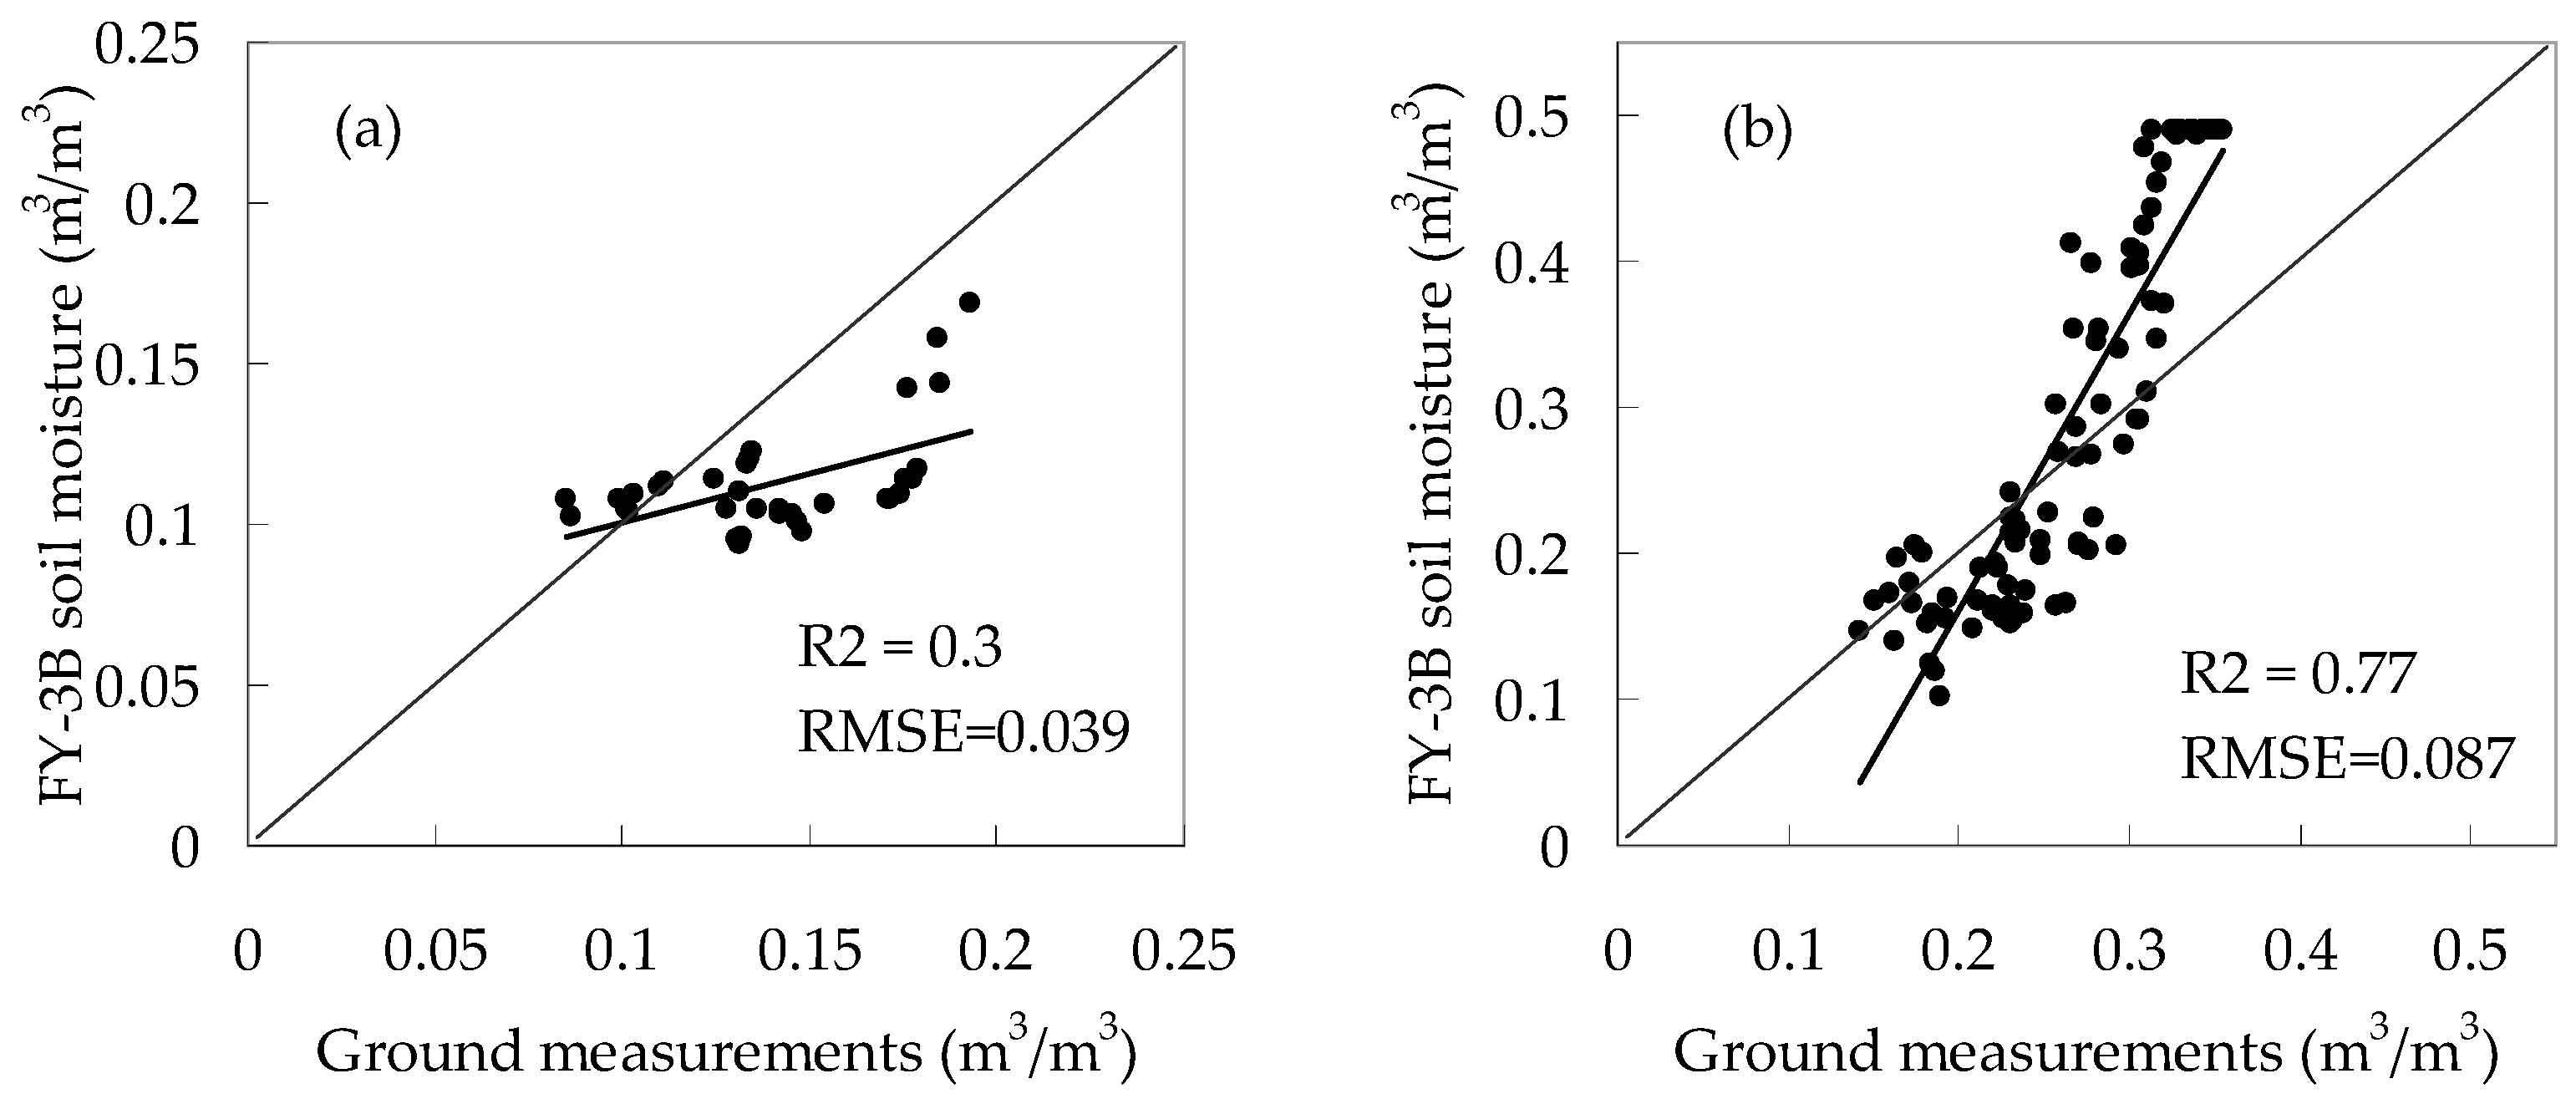
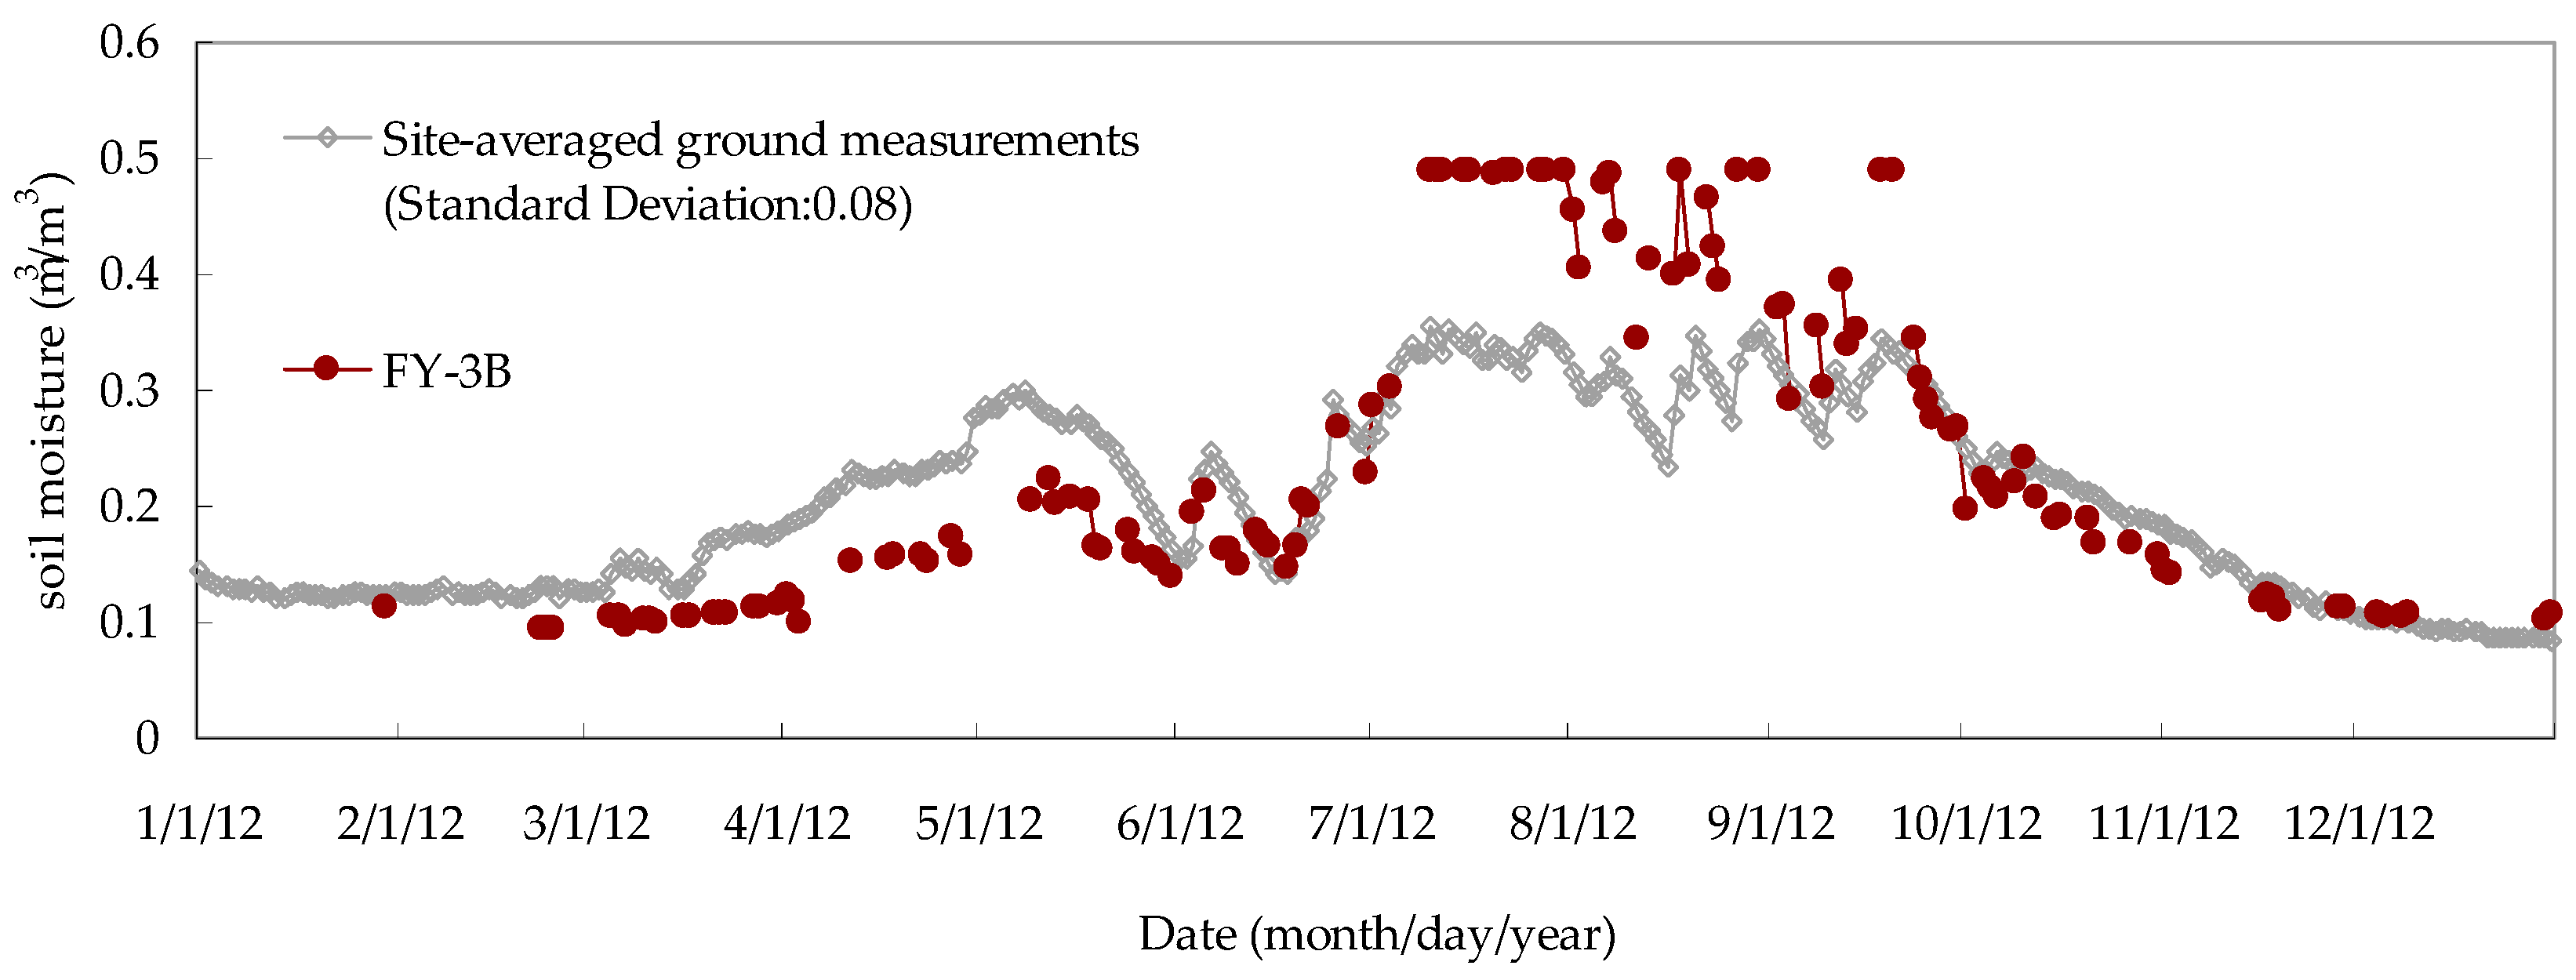
4.1. Validation of 25-km Spatial Resolution FY-3B Soil Moisture Product
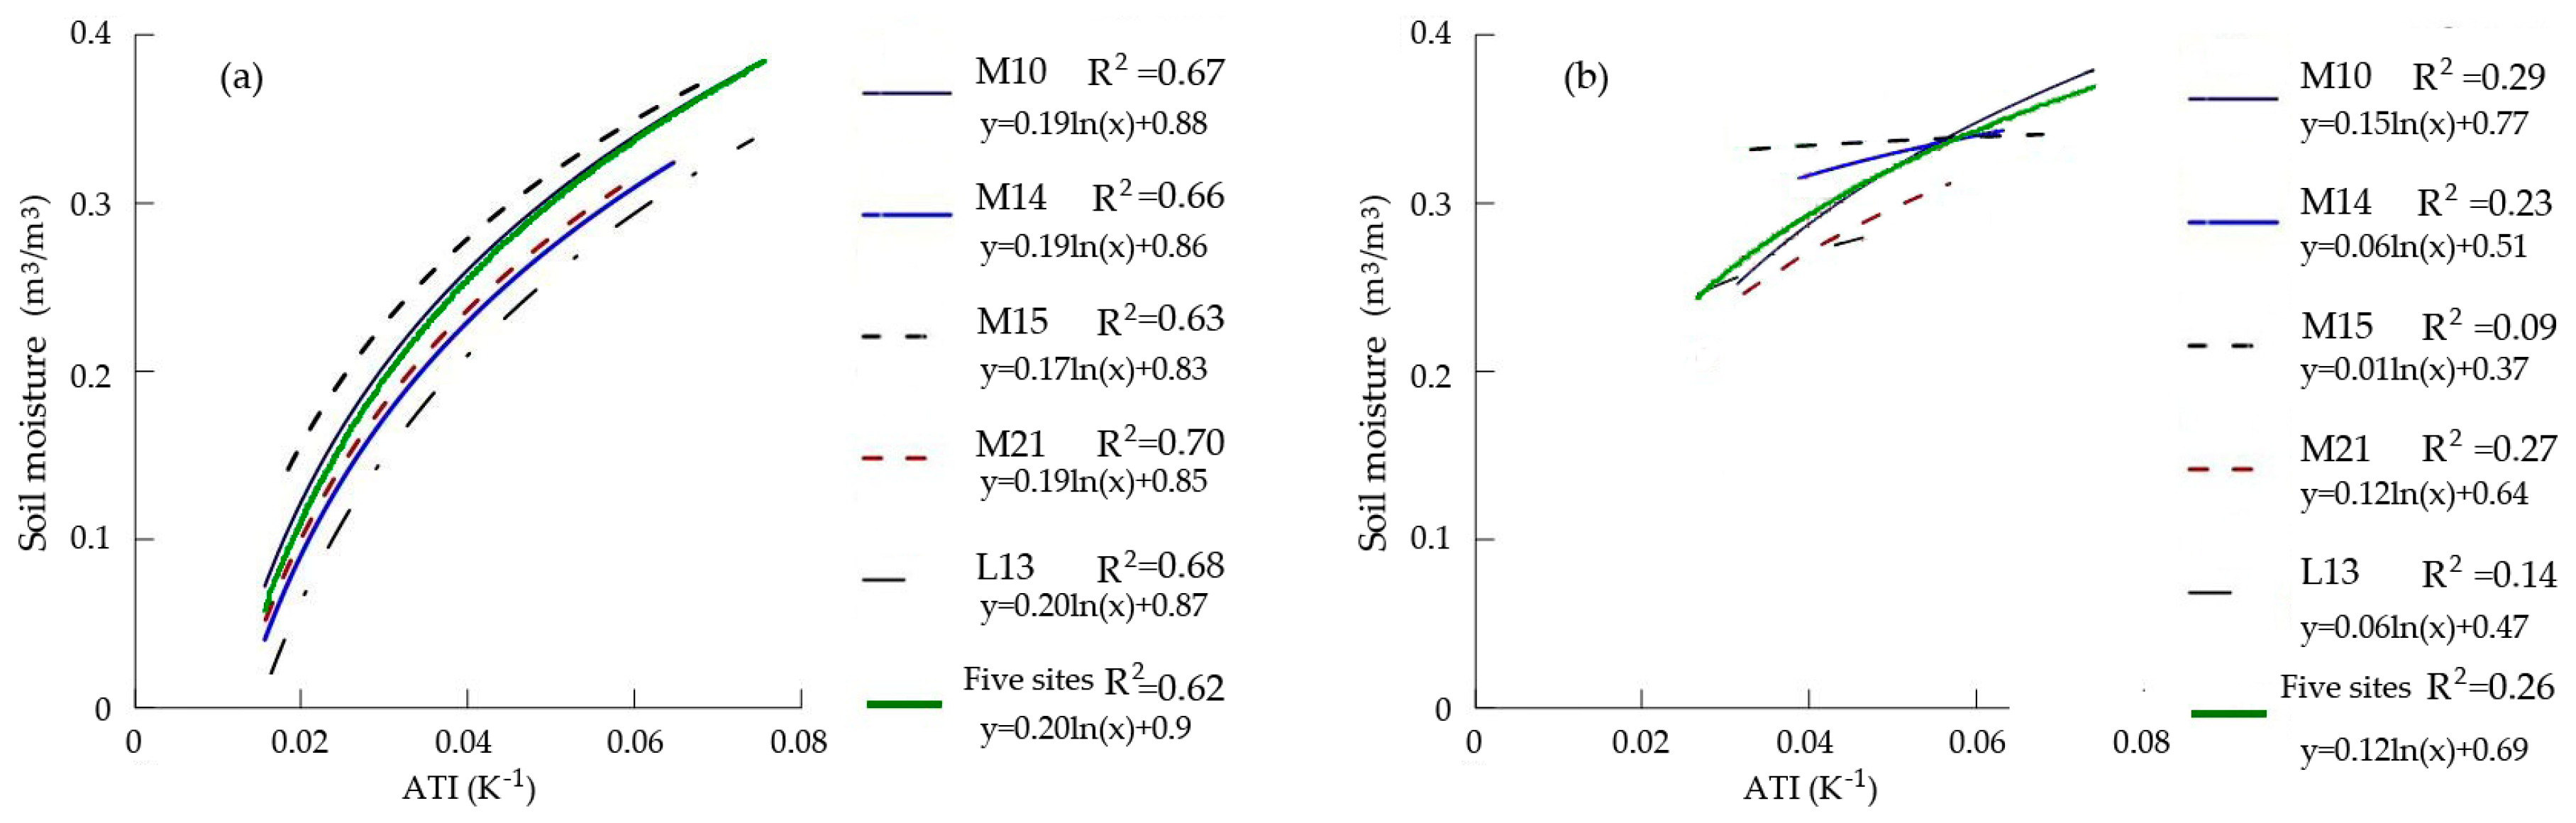
4.2. The Relationship between Soil Moisture and ATI
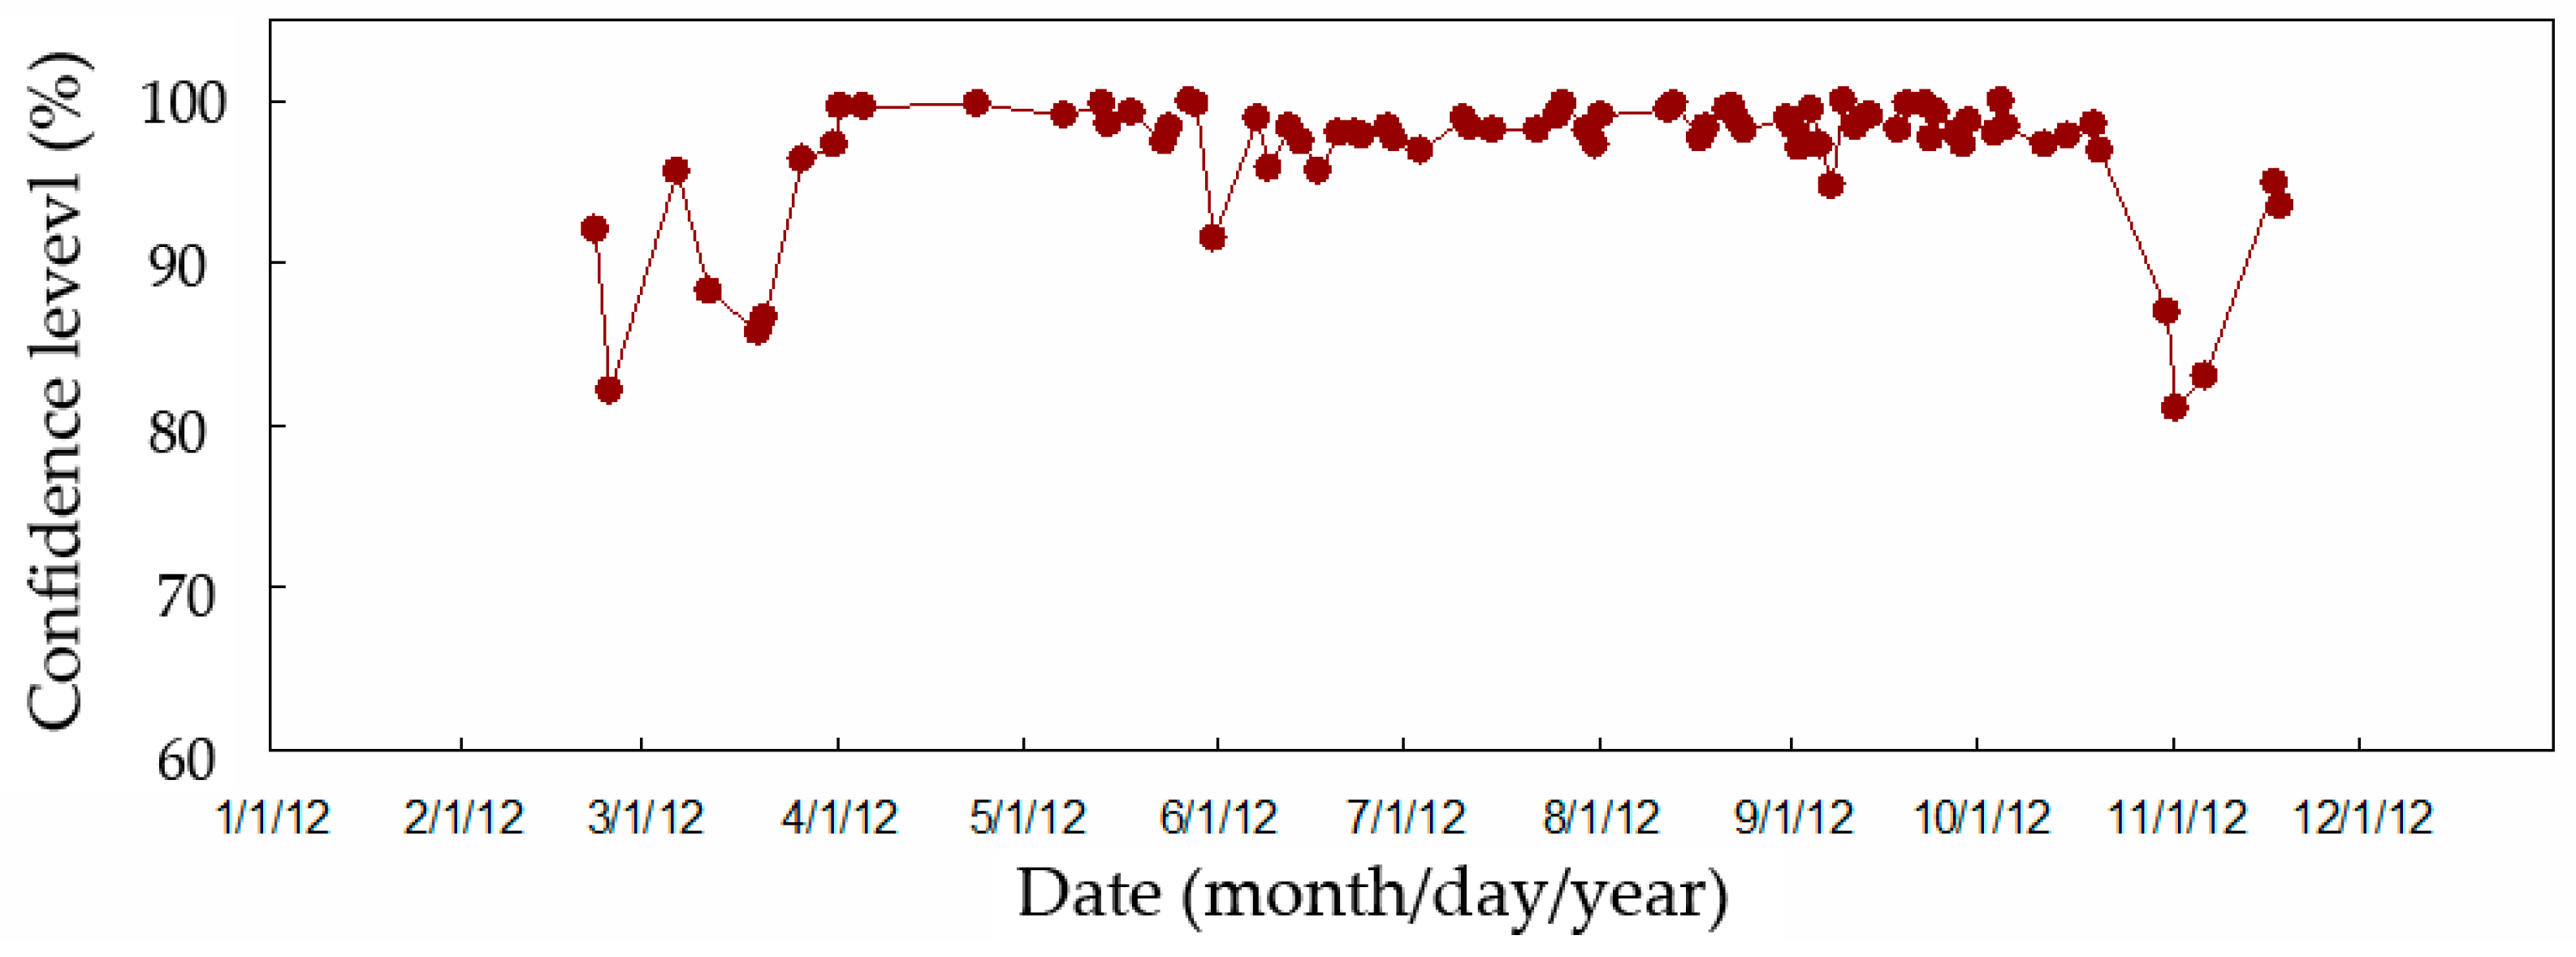
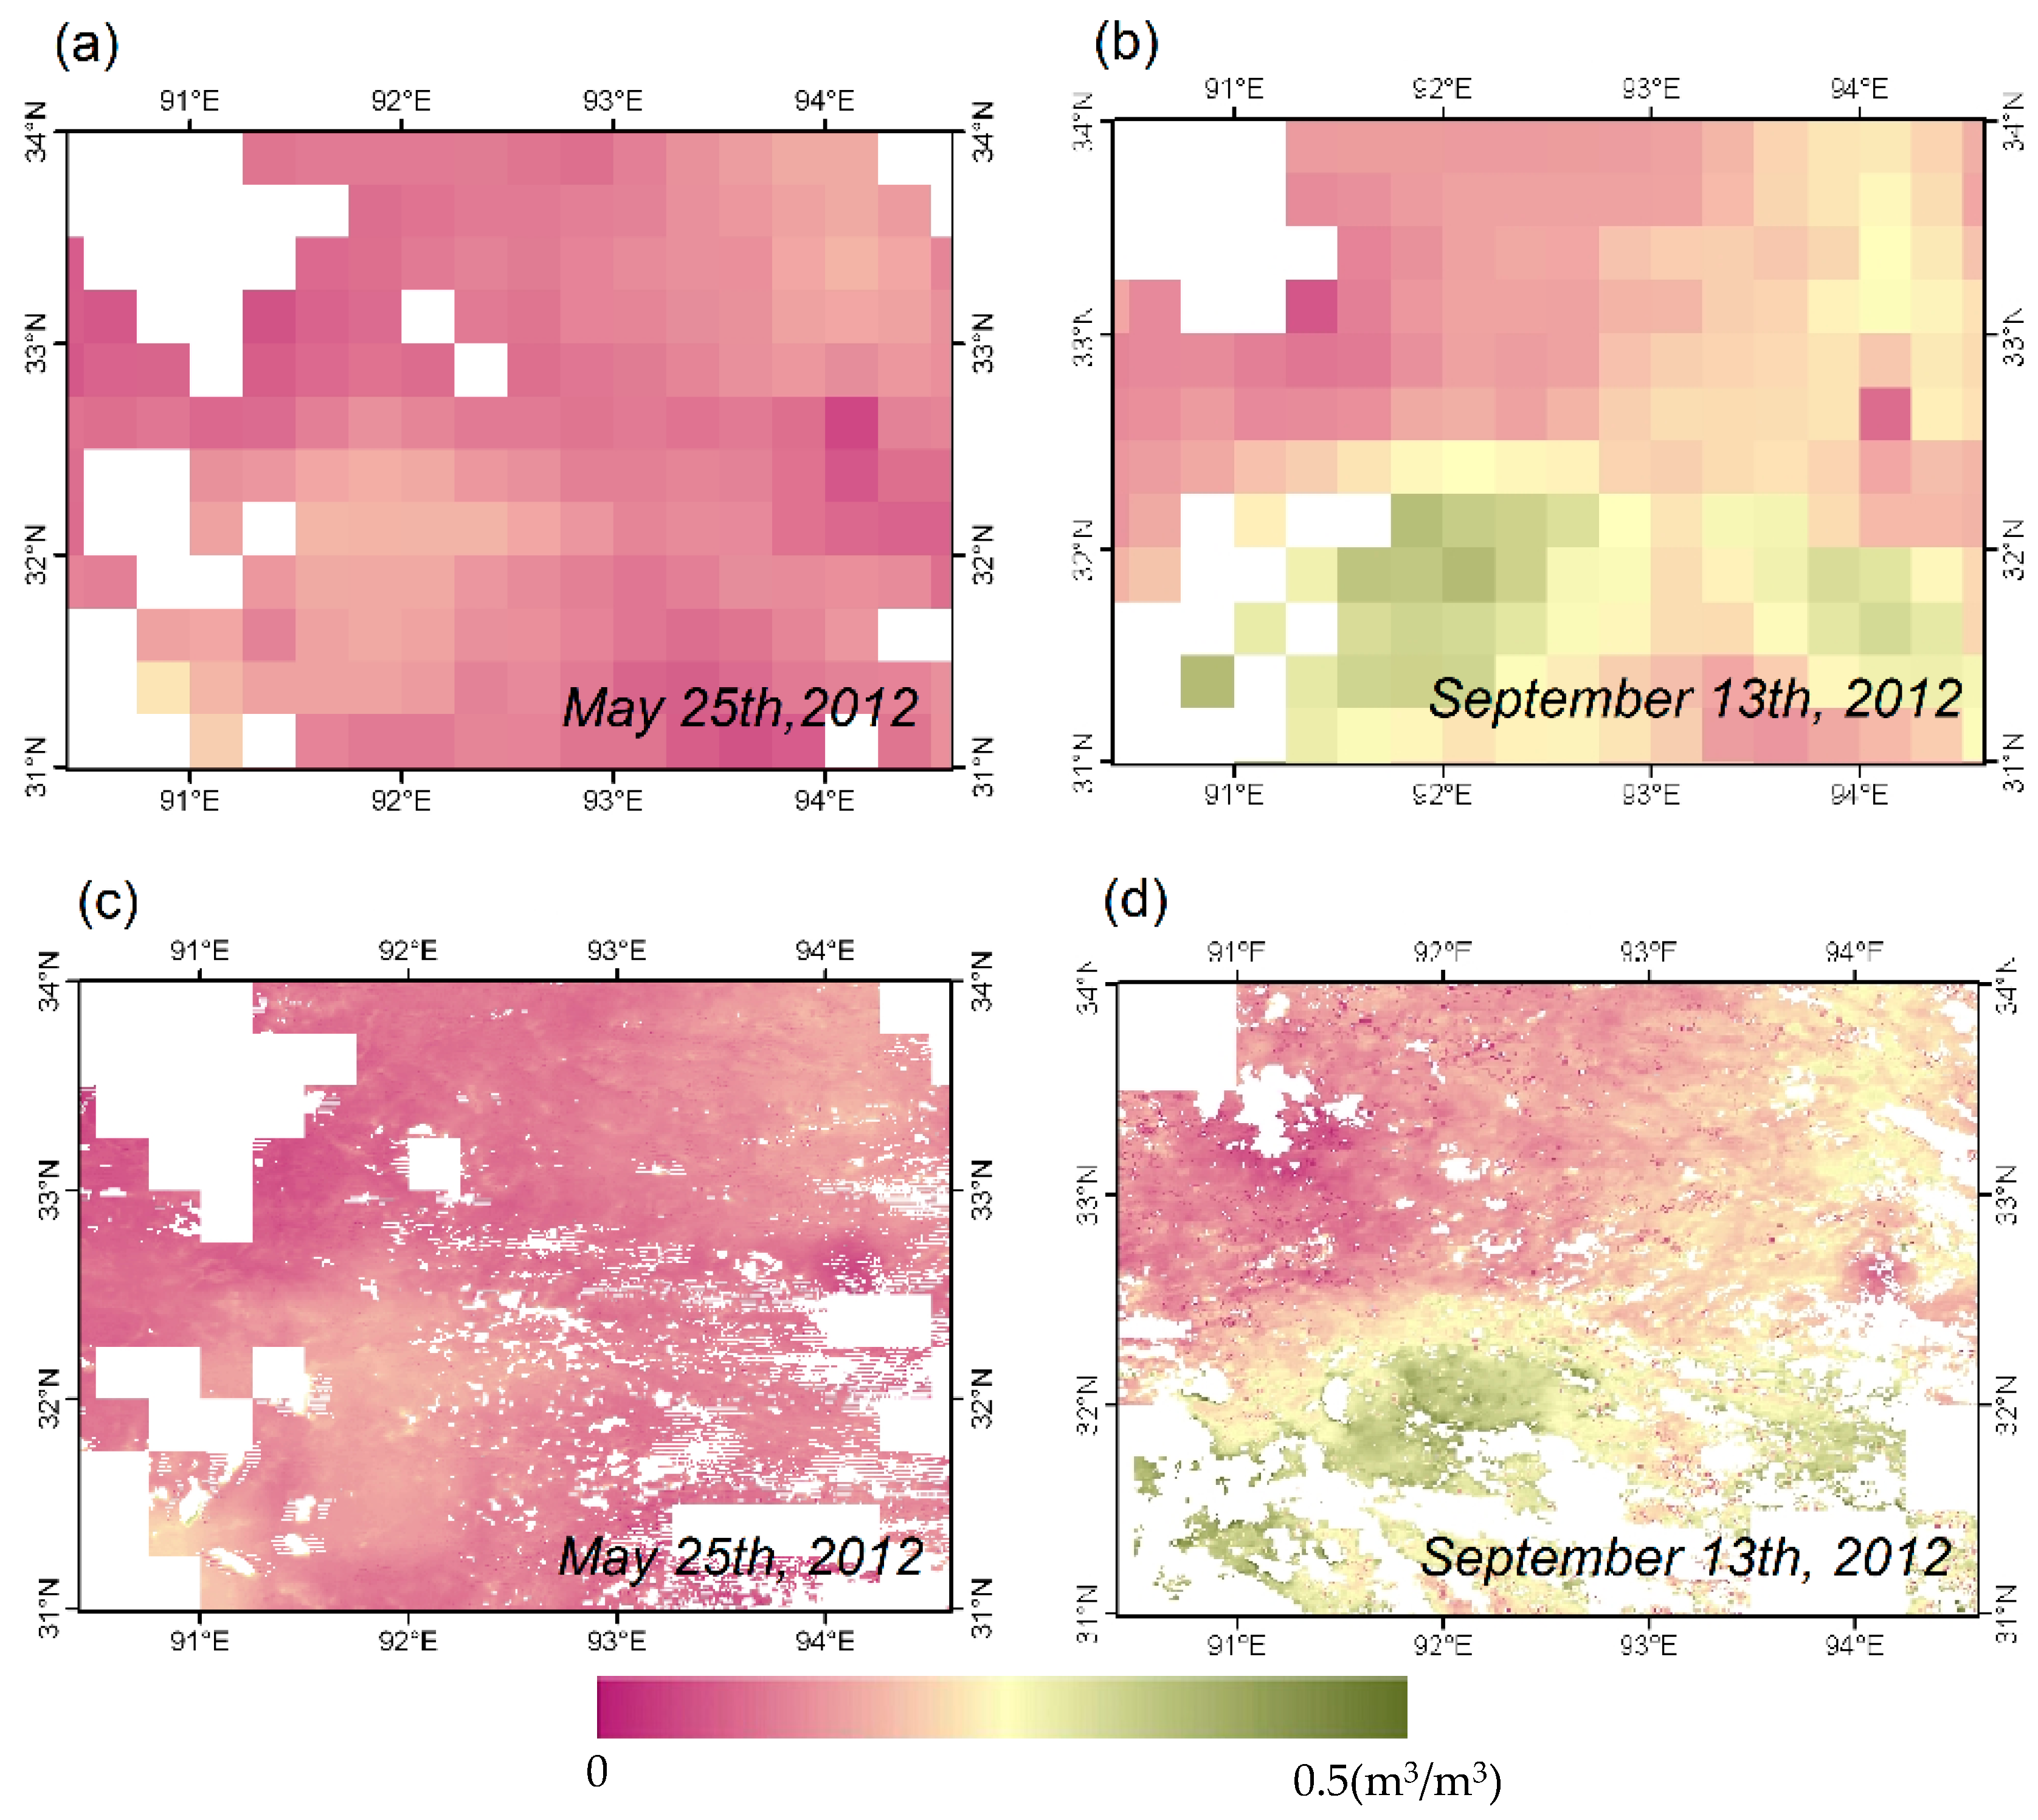
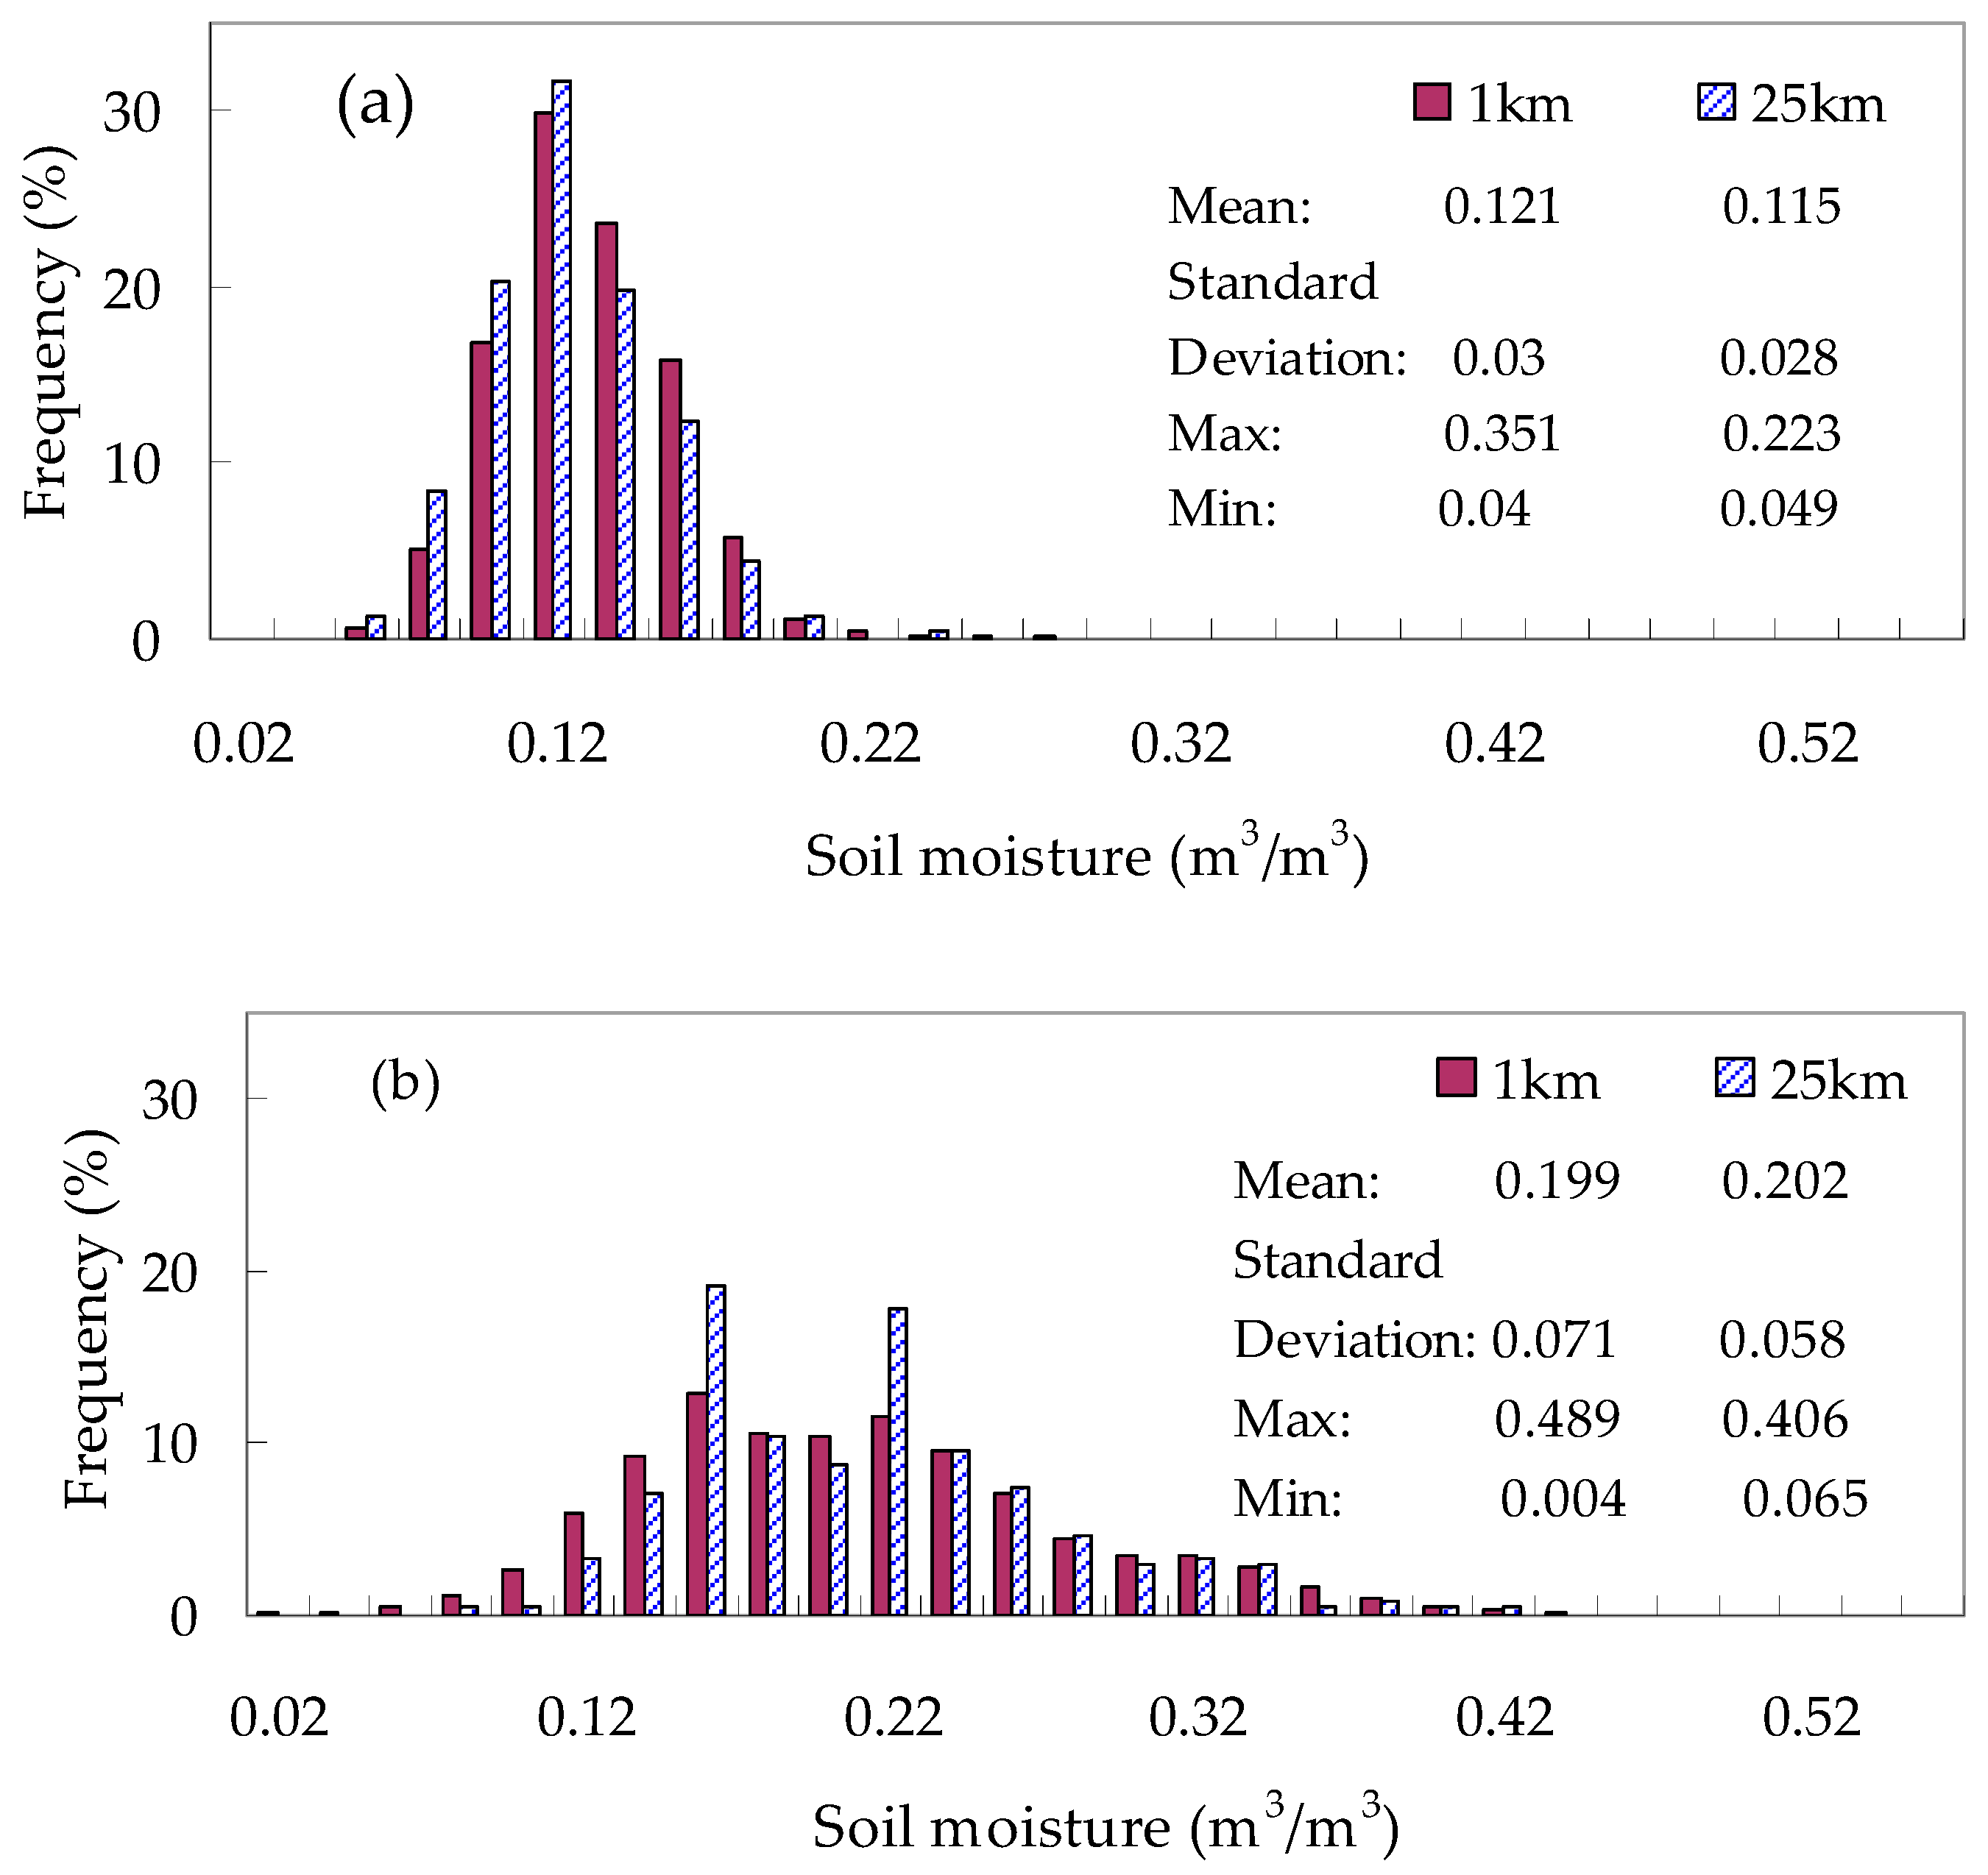
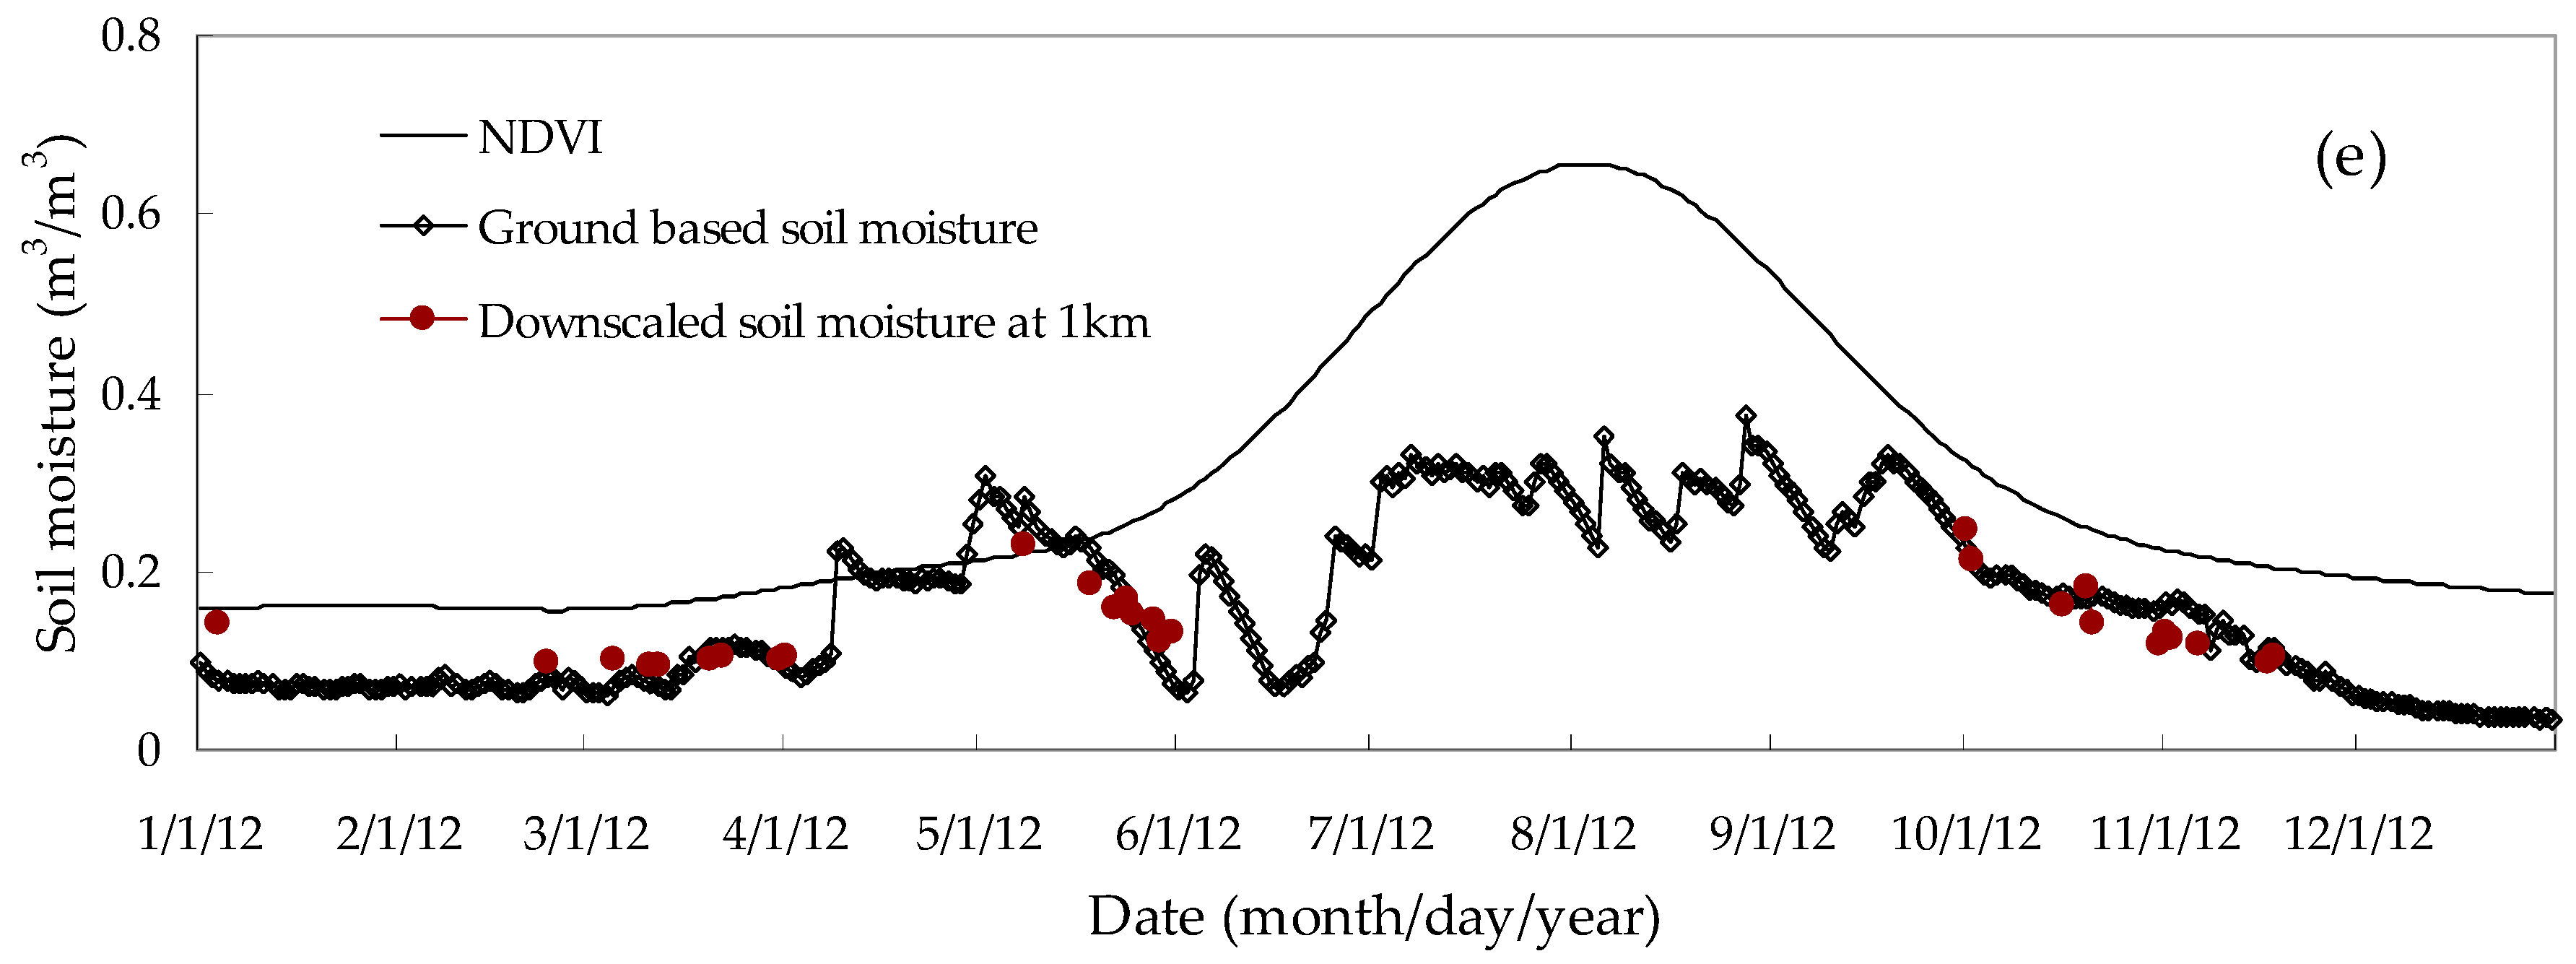
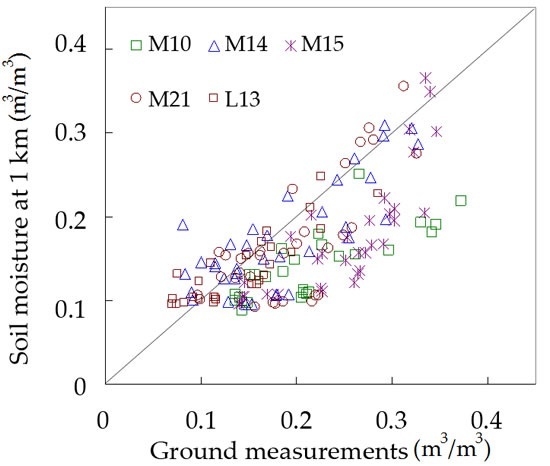
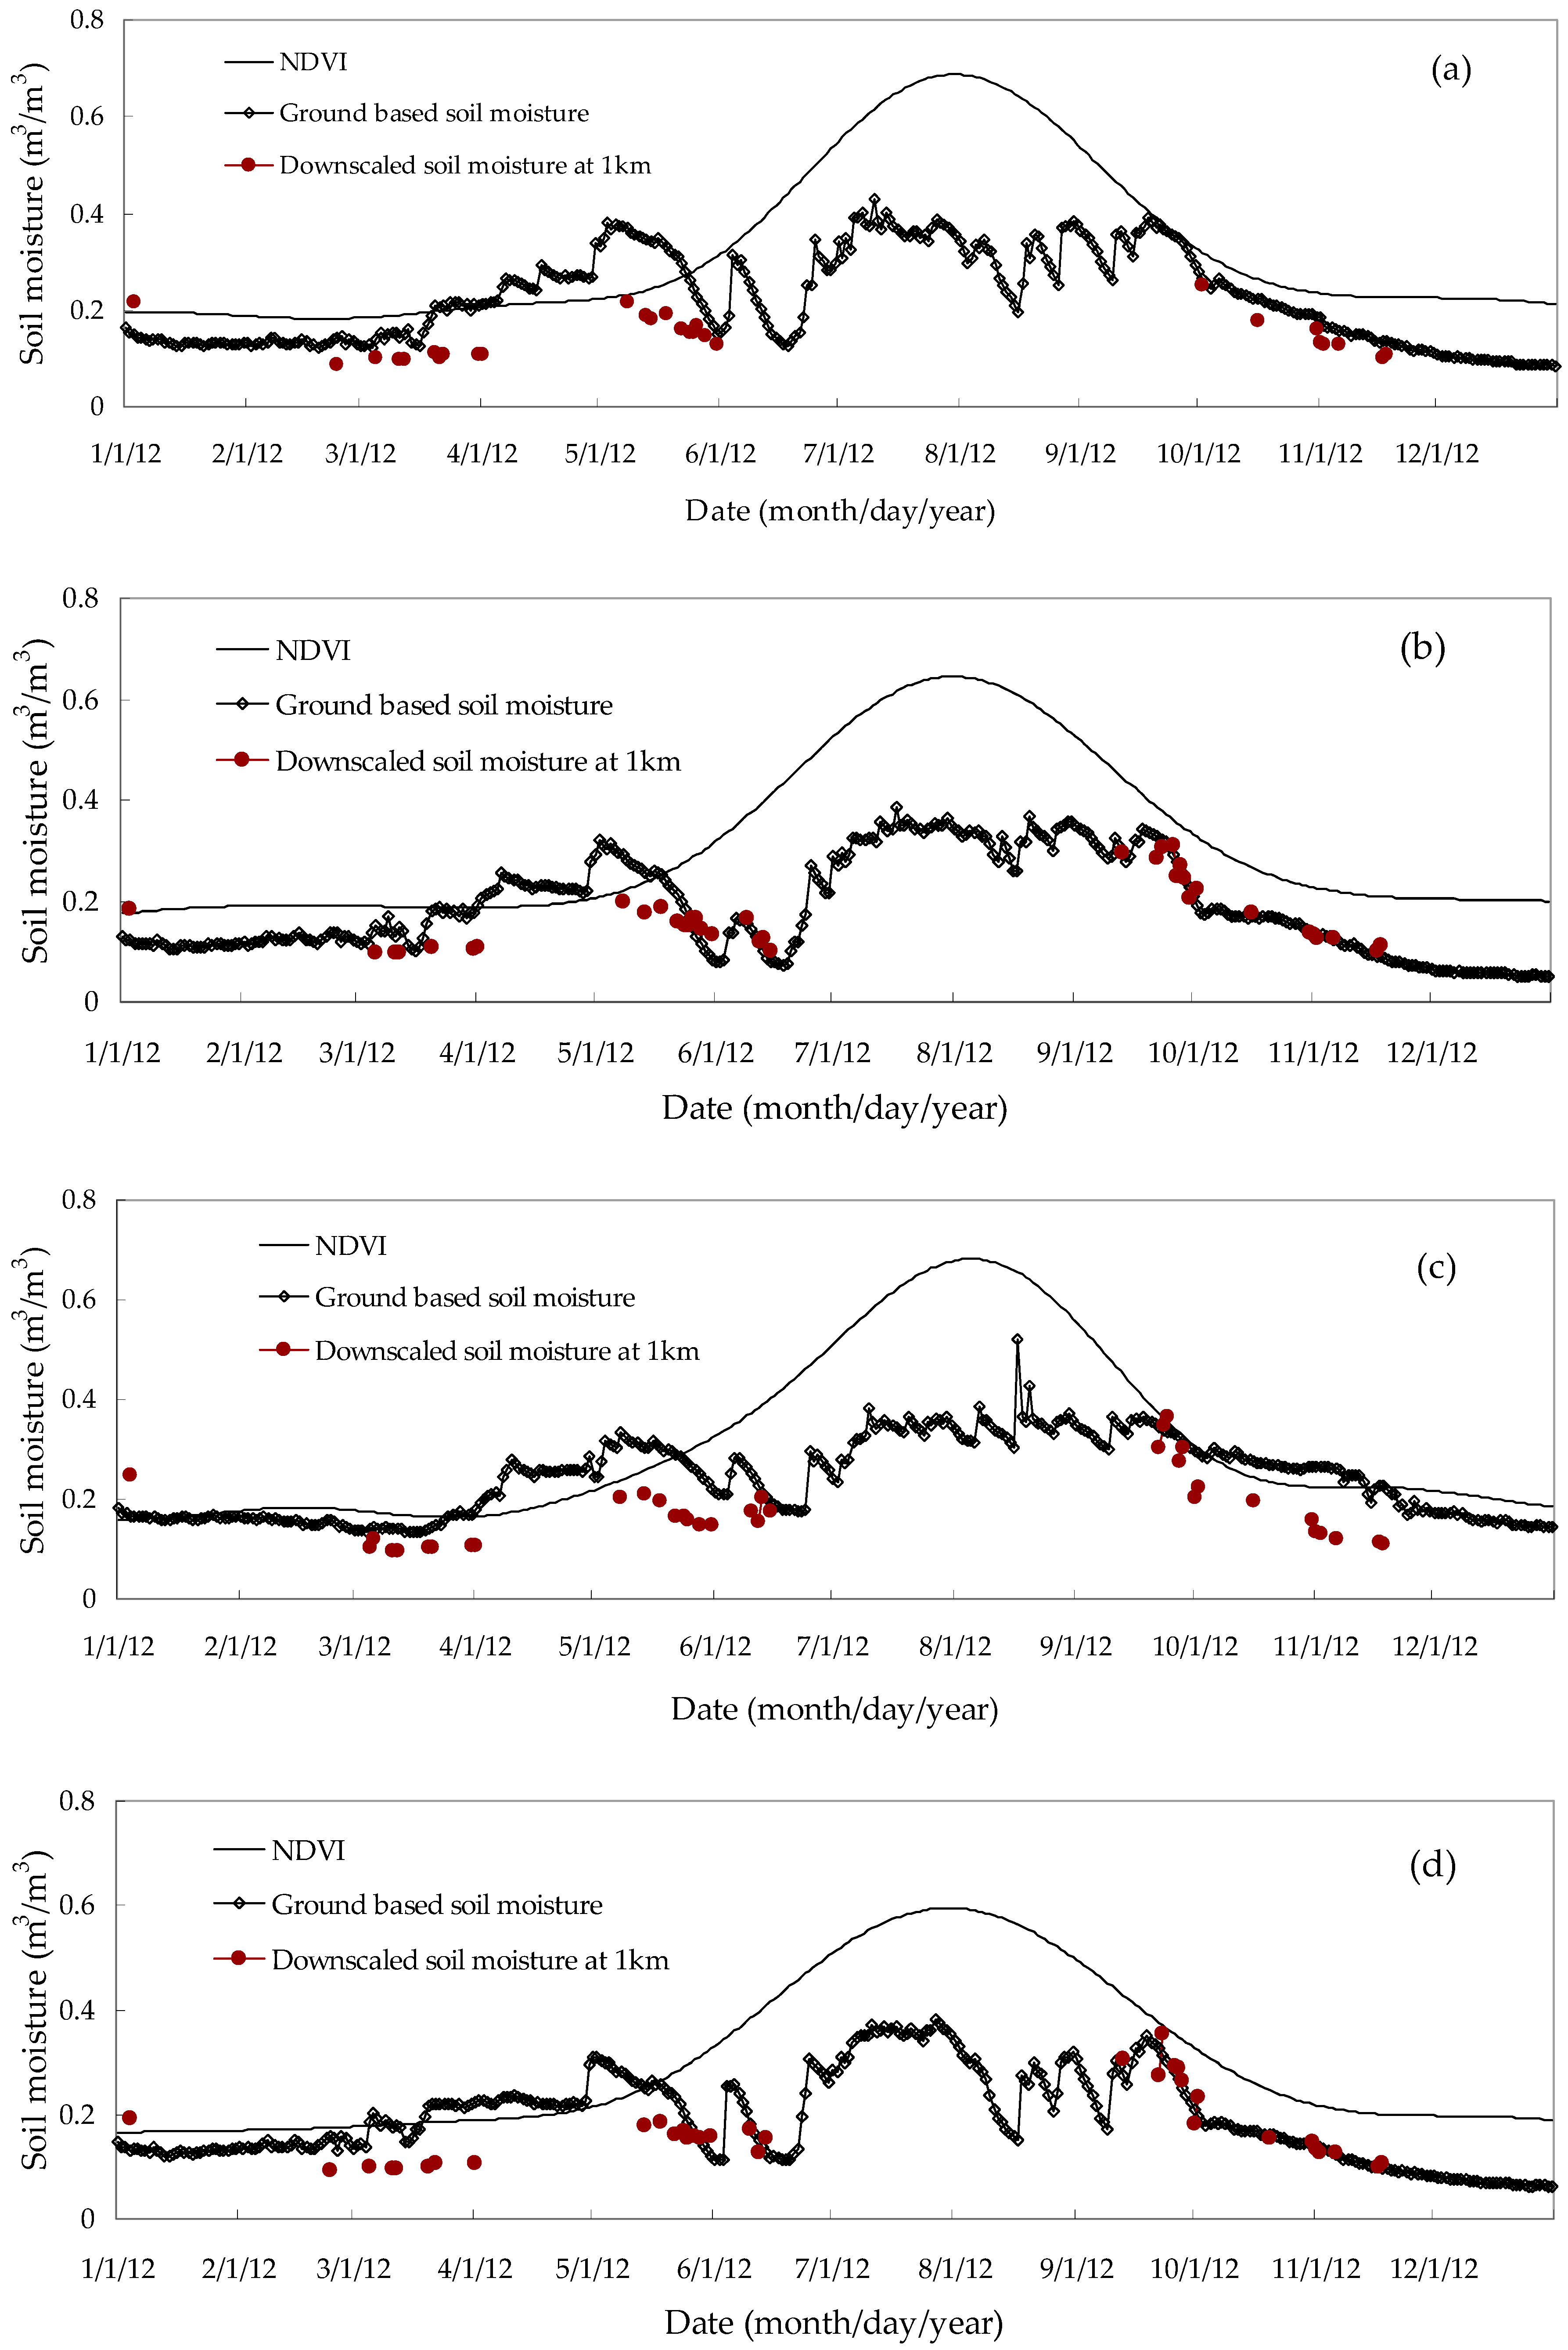
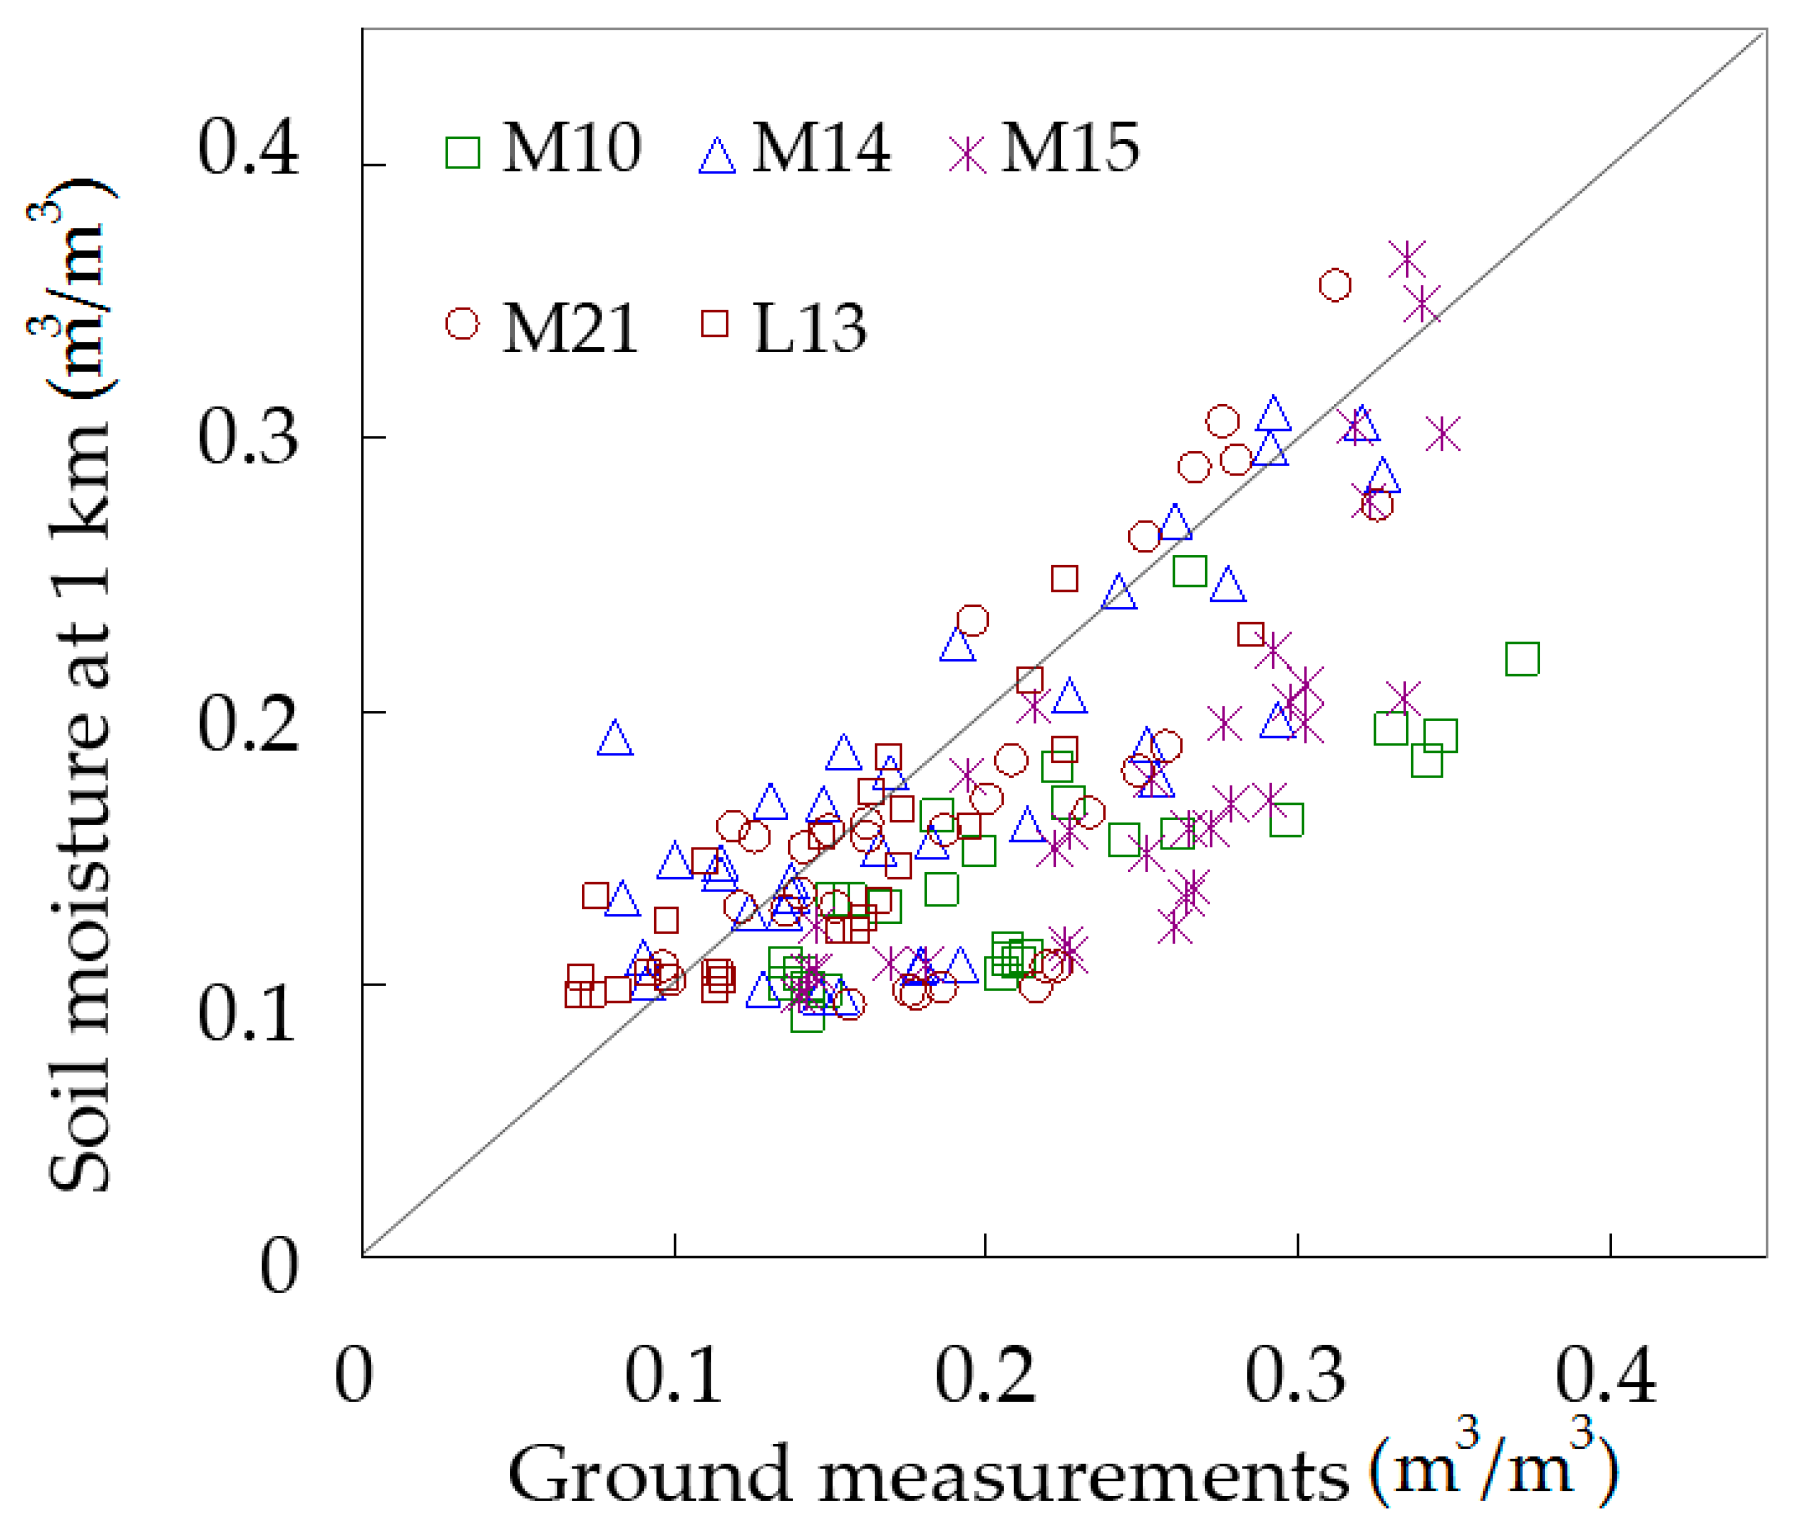
4.3. Downscaling Soil Moisture to 1-km Spatial Resolution
5. Conclusions
Acknowledgments
Author Contributions
Conflicts of Interest
Appendix A
References
- Bolten, J.D.; Crow, W.T.; Zhan, X.; Jackson, T.J.; Reynolds, C.A. Evaluating the utility of remotely sensed soil moisture retrievals for operational agricultural drought monitoring. IEEE J. Sel. Top. Appl. Earth Observ. Remote Sens. 2010, 3, 57–66. [Google Scholar] [CrossRef]
- Seneviratne, S.I.; Corti, T.; Davin, E.L.; Hirschi, M.; Jaeger, E.B.; Lehner, I.; Orlowsky, B.; Teuling, A.J. Investigating soil moisture-climate interactions in a changing climate: A review. Earth-Sci. Rev. 2010, 99, 125–161. [Google Scholar] [CrossRef]
- Njoku, E.G.; Entekhabi, D. Passive microwave remote sensing of soil moisture. J. Hydrol. 1996, 184, 101–129. [Google Scholar] [CrossRef]
- Schmugge, T.J.; Kustas, W.P.; Ritchie, J.C.; Jackson, T.J.; Rango, A. Remote sensing in hydrology. Adv. Resour. 2002, 25, 1367–1385. [Google Scholar] [CrossRef]
- Shi, J.C.; Jiang, L.M.; Zhang, L.X.; Chen, K.S.; Wigneron, J.P.; Chanzy, A.; Jackson, T.J. Physically based estimation of bare-surface soil moisture with the passive radiometers. IEEE Trans. Geosci. Remote Sens. 2006, 44, 3145–3153. [Google Scholar] [CrossRef]
- Kerr, Y.H.; Secherre, F.; Lastenet, J.; Wigneron, J.P. SMOS: Analysis of perturbing effects over land surfaces. In Proceedings of the IGARSS 2003: IEEE International Geoscience and Remote Sensing Symposium, Toulouse, France, 21–25 July 2003; pp. 908–910.
- Njoku, E.G.; Jackson, T.J.; Lakshmi, V.; Chan, T.K.; Nghiem, S.V. Soil moisture retrieval from AMSR-E. IEEE Trans. Geosci. Remote Sens. 2003, 41, 215–229. [Google Scholar] [CrossRef]
- Entekhabi, D.; Njoku, E.G.; O’Neill, P.E.; Kellogg, K.H.; Crow, W.T.; Edelstein, W.N.; Entin, J.K.; Goodman, S.D.; Jackson, T.J.; Johnson, J.; et al. The soil moisture active passive (SMAP) mission. IEEE Proc. 2010, 98, 704–716. [Google Scholar] [CrossRef]
- Liu, Y.Y.; Parinussa, R.M.; Dorigo, W.A.; Wagner, W.; Dijk, A.I.J.M.; McCabe, M.F.; Evans, J.P. Developing an improved soil moisture dataset by blending passive and active microwave satellite-based retrievals. Hydrol. Earth Syst. Sci. 2011, 15, 425–436. [Google Scholar] [CrossRef]
- Yin, J.; Zhan, X.; Zheng, Y.; Liu, J.; Fang, L.; Hain, C.R. Enhancing model skill by assimilating SMOPS blended soil moisture product into noah land surface model. J. Hydrometeorol. 2015, 16, 917–931. [Google Scholar] [CrossRef]
- Carlson, T. An overview of the “triangle method” for estimating surface evapotranspiration and soil moisture from satellite imagery. Sensors 2007, 7, 1612–1629. [Google Scholar] [CrossRef]
- Crow, W.T.; Wood, E.F.; Dubayah, R. Potential for downscaling soil moisture maps derived from spaceborne imaging radar data. J. Geophys. Res. Atmos. 2000, 105, 2203–2212. [Google Scholar] [CrossRef]
- Piles, M.; Camps, A.; Vall-Llossera, M.; Corbella, I.; Panciera, R.; Rudiger, C.; Kerr, Y.H.; Walker, J. Downscaling SMOS-derived soil moisture using MODIS visible/infrared data. IEEE Trans. Geosci. Remote Sens. 2011, 49, 3156–3166. [Google Scholar] [CrossRef]
- Chauhan, N.; Miller, S.; Ardanuy, P. Spaceborne soil moisture estimation at high resolution: A microwave-optical/IR synergistic approach. Int. J. Remote Sens. 2003, 24, 4599–4622. [Google Scholar] [CrossRef]
- Piles, M.; Entekhabi, D.; Camps, A. A Change detection algorithm for retrieving high-resolution soil moisture from SMAP radar and radiometer observations. IEEE Trans. Geosci. Remote Sens. 2009, 47, 4125–4131. [Google Scholar] [CrossRef]
- Song, C.; Jia, L.; Menenti, M. Retrieving high-resolution surface soil moisture by downscaling AMSR-E brightness temperature using MODIS LST and NDVI Data. IEEE J. Sel. Top. Appl. Earth Observ. Remote Sens. 2014, 7, 935–942. [Google Scholar] [CrossRef]
- Merlin, O.; Walker, J.P.; Chehbouni, A.; Kerr, Y. Towards deterministic downscaling of SMOS soil moisture using MODIS derived soil evaporative efficiency. Remote Sens. Environ. 2008, 112, 3935–3946. [Google Scholar] [CrossRef]
- Wagner, W.; Pathe, C.; Doubkova, M.; Sabel, D.; Bartsch, A.; Hasenauer, S.; Bloschl, G.; Scipal, K.; Martinez-Fernandez, J.; Low, A. Temporal stability of soil moisture and radar backscatter observed by the advanced Synthetic Aperture Radar (ASAR). Sensors 2008, 8, 1174–1197. [Google Scholar] [CrossRef]
- Minacapilli, M.; Iovino, M.; Blanda, F. High resolution remote estimation of soil surface water content by a thermal inertia approach. J. Hydrol. 2009, 379, 229–238. [Google Scholar] [CrossRef]
- Xue, Y.; Cracknell, A. Advanced thermal inertia modelling. Remote Sens. 1995, 16, 431–446. [Google Scholar] [CrossRef]
- Cai, G.; Xue, Y.; Hu, Y.; Wang, Y.; Guo, J.; Luo, Y.; Wu, C.; Zhong, S.; Qi, S. Soil moisture retrieval from MODIS data in Northern China Plain using thermal inertia model. Int. J. Remote Sens. 2007, 28, 3567–3581. [Google Scholar] [CrossRef]
- Verstraeten, W.W.; Veroustraete, F.; van der Sande, C.J.; Grootaers, I.; Feyen, J. Soil moisture retrieval using thermal inertia, determined with visible and thermal spaceborne data, validated for European forests. Remote Sens. Environ. 2006, 101, 299–314. [Google Scholar] [CrossRef]
- Doninck, J.V.; Peters, J.; Baets, B.D.; Clercq, E.M.; Ducheyne, E.; Verhoest, N.E.C. The potential of multitemporal Aqua and Terra MODIS Apparent Thermal Inertia as a soil moisture indicator. Int. J. Appl. Earth Observ. Geoinf. 2011, 13, 934–941. [Google Scholar] [CrossRef]
- Notarnicola, C.; Lewińska, K.E.; Temimi, M.; Zebisch, M. Application of the Apparent Thermal Inertia concept for soil moisture estimation in agricultural areas. In Thermal Infrared Remote Sensing: Sensors, Methods, Applications, Remote Sensing and Digital Image Processing; Springer: Houten, The Netherlands, 2013; pp. 331–346. [Google Scholar]
- Price, J.C. On the analysis of thermal infrared imagery: The limited utility of apparent thermal inertia. Remote Sens. Environ. 1985, 18, 59–73. [Google Scholar] [CrossRef]
- Veroustraete, F.; Li, Q.; Verstraeten, W.W.; Chen, X.; Bao, A.; Dong, Q.; Liu, T.; Willems, P. Soil moisture content retrieval based on Apparent Thermal Inertia for Xinjiang province in China. Int. J. Remote Sens. 2012, 33, 3870–3885. [Google Scholar] [CrossRef]
- Qin, J.; Yang, K.; Lu, N.; Chen, Y.; Zhao, L.; Han, M. Spatial upscaling of in-situ soil moisture measurements based on MODIS-derived apparent thermal inertia. Remote Sens. Environ. 2013, 138, 1–9. [Google Scholar] [CrossRef]
- Fengyun Satellite Data Center. Available online: http://satellite.nsmc.org.cn/portalsite/default.aspx (accessed on 10 March 2014).
- National Snow and Ice Data Center (NSIDC). Available online: http://nsidc.org/ (accessed on 10 March 2014).
- Yang, K.; Qin, J.; Zhao, L.; Chen, Y.; Tang, W.; Han, M.; Chen, Z.; Lv, N.; Ding, B.; Wu, H.; et al. A multi-scale soil moisture and freeze-thaw monitoring network on the third pole. Bull. Am. Meteorol. Soc. 2013, 94, 1907–1916. [Google Scholar] [CrossRef]
- Roerink, G.; Menenti, M.; Verhoef, W. Reconstructing cloud free NDVI composites using Fourier analysis of time series. Int. J. Remote Sens. 2000, 21, 1911–1917. [Google Scholar] [CrossRef]
- Menenti, M.; Azzali, S.; Verhoef, W.; van Swol, R. Mapping agroecological zones and time lag in vegetation growth by means of Fourier analysis of time series of NDVI images. Adv. Space Res. 1993, 13, 233–237. [Google Scholar] [CrossRef]


| Site | R2 | RMSE (m3/m3) | NSE |
|---|---|---|---|
| M10 | 0.45 | 0.102 | 0.89 |
| M14 | 0.60 | 0.047 | 0.97 |
| M15 | 0.55 | 0.089 | 0.88 |
| M21 | 0.64 | 0.042 | 0.87 |
| L13 | 0.67 | 0.043 | 0.92 |
| 5 sites | 0.54 | 0.063 | 0.95 |
© 2016 by the authors; licensee MDPI, Basel, Switzerland. This article is an open access article distributed under the terms and conditions of the Creative Commons Attribution (CC-BY) license (http://creativecommons.org/licenses/by/4.0/).
Share and Cite
Song, C.; Jia, L. A Method for Downscaling FengYun-3B Soil Moisture Based on Apparent Thermal Inertia. Remote Sens. 2016, 8, 703. https://doi.org/10.3390/rs8090703
Song C, Jia L. A Method for Downscaling FengYun-3B Soil Moisture Based on Apparent Thermal Inertia. Remote Sensing. 2016; 8(9):703. https://doi.org/10.3390/rs8090703
Chicago/Turabian StyleSong, Chengyun, and Li Jia. 2016. "A Method for Downscaling FengYun-3B Soil Moisture Based on Apparent Thermal Inertia" Remote Sensing 8, no. 9: 703. https://doi.org/10.3390/rs8090703
APA StyleSong, C., & Jia, L. (2016). A Method for Downscaling FengYun-3B Soil Moisture Based on Apparent Thermal Inertia. Remote Sensing, 8(9), 703. https://doi.org/10.3390/rs8090703