Article

Dust Aerosol Optical Depth Retrieval and Dust Storm Detection for Xinjiang Region Using Indian National Satellite Observations

1
Key Laboratory of Digital Earth Science, Institute of Remote Sensing and Digital Earth, Chinese Academy of Sciences, Beijing 100094, China
2
Department of Computing and Mathematics, College of Engineering and Technology, University of Derby, Kedleston Road, Derby DE22 1GB, UK
3
New South Wales Office of Environment and Heritage, Sydney, NSW 2000, Australia
4
Griffith School of Environment, Griffith University, Brisbane, QLD 4111, Australia
5
Institute of Urban Meteorology, China Meteorological Administration, Beijing 100089, China
6
Hebei Key Laboratory of Environmental Change and Ecological Construction, College of Resources and Environment Science, Hebei Normal University, Shijiazhuang 050024, China
*
Author to whom correspondence should be addressed.
Remote Sens. 2016, 8(9), 702; https://doi.org/10.3390/rs8090702
Submission received: 1 April 2016 / Revised: 7 August 2016 / Accepted: 18 August 2016 / Published: 26 August 2016

Abstract

:
The Xinjiang Uyghur Autonomous Region (Xinjiang) is located near the western border of China. Xinjiang has a high frequency of dust storms, especially in late winter and early spring. Geostationary satellite remote sensing offers an ideal way to monitor the regional distribution and intensity of dust storms, which can impact the regional climate. In this study observations from the Indian National Satellite (INSAT) 3D are used for dust storm detection in Xinjiang because of the frequent 30-min observations with six bands. An analysis of the optical properties of dust and its quantitative relationship with dust storms in Xinjiang is presented for dust events in April 2014. The Aerosol Optical Depth (AOD) derived using six predefined aerosol types shows great potential to identify dust events. Cross validation between INSAT-3D retrieved AOD and MODIS AOD shows a high coefficient of determination (R2 = 0.92). Ground validation using AERONET (Aerosol Robotic Network) AOD also shows a good correlation with R2 of 0.77. We combined the apparent reflectance (top-of-atmospheric reflectance) of visible and shortwave infrared bands, brightness temperature of infrared bands and retrieved AOD into a new Enhanced Dust Index (EDI). EDI reveals not only dust extent but also the intensity. EDI performed very well in measuring the intensity of dust storms between 22 and 24 April 2014. A visual comparison between EDI and Feng Yun-2E (FY-2E) Infrared Difference Dust Index (IDDI) also shows a high level of similarity. A good linear correlation (R2 of 0.78) between EDI and visibility on the ground demonstrates good performance of EDI in estimating dust intensity. A simple threshold method was found to have a good performance in delineating the extent of the dust plumes but inadequate for providing information on dust plume intensity.

Graphical Abstract

1. Introduction

Meteorological satellites are playing an increasingly important role in dust detection and monitoring. Techniques have been developed for different satellites, including polar-orbit satellites such as NOAA/AVHRR [1,2] and MODIS (TERRA/AQUA) [3,4,5] and geostationary satellites such as Meteosat Second Generation (MSG) with its Spinning Enhanced Visible and Infrared Imager (SEVIRI) [6,7] and Feng Yun-2 (FY2) with its Visible and Infrared Spin Scan Radiometer (VISSR) [8]. Previous dust detection methods generally exploit the different spectral behavior of dust particles compared to ice crystals, water droplets and the ground. Two principal methods are used for dust identification, Brightness Temperature Difference (BTD) [9] and Infrared Difference Dust Index (IDDI) [10]. BTD is only applicable for dry dust because water vapor in the atmosphere decreases BTD [11]. IDDI is the most widely used index for operational dust storm detection systems that use geostationary satellites [12].
Other methods have also been developed to detect dust storms. Ackerman identified dust storms because the BTD between 3.7 μm and 11 μm is higher for dust storms than cloud and the ground viewed through clear-sky [1]. Roskovensky and Liou identified dust as a function of the ratio of visible and shortwave bands as well as BTD [5]. Ultraviolet bands are also used to identify dust with an aerosol index (AI) [13,14,15]. Methods based on microwave polarization are increasingly being used to detect dust storms and show good performance [16,17].
Compared to polar-obit satellites, geostationary satellites have the advantage of higher temporal resolution.
The aerosol optical depth (AOD) can be used as an indicator of dust events as AOD in shortwave ranges from 0.5 to about 3 and can even reach values of more than 5 during exceptional events [10]. Many algorithms have been developed to retrieve AOD from geostationary satellites data such as MSG/SEVIRI data [18,19,20,21]. The Indian geostationary satellite (INSAT) 3D can provide data as frequently as 30 min. This offers benefits for dust identification and tracking. Sanwlani et al. exploited AOD to detect dust over water using INSAT-3A CCD (Charge Coupled Device) data [22]. Recently, BTD, IDDI and Middle Infrared methods have been integrated to discriminate dust over land using INSAT-3D data [23]. Based on Chinese geostationary satellite, FengYun-2, researchers have done some work to retrieve AOD [24,25,26]. However, the result is not ideal due to the satellite sensor gray-scale, spectrum width of visible band and sensor sensitivity to aerosols [26].
In this paper, we present the spectral response characteristics of INSAT-3D and an algorithm for the joint retrieval of AOD and aerosol types over a bright background using INSAT-3D data. We describe a new dust detection index that couples retrieved AOD and spectral response characteristics of INSAT-3D. We demonstrate the accuracy through cross validation between INSAT-3D AOD and MODIS and AERONET AOD. We further present the relationship between satellite-retrieved AOD and visibility and a simple threshold method for delineating the extent of the dust plumes using the differences in radiation responses of different underlying surfaces. Lastly, we showcase a case study on dust storm detection on 22–24 April 2014 in western China.

2. Study Area and Data
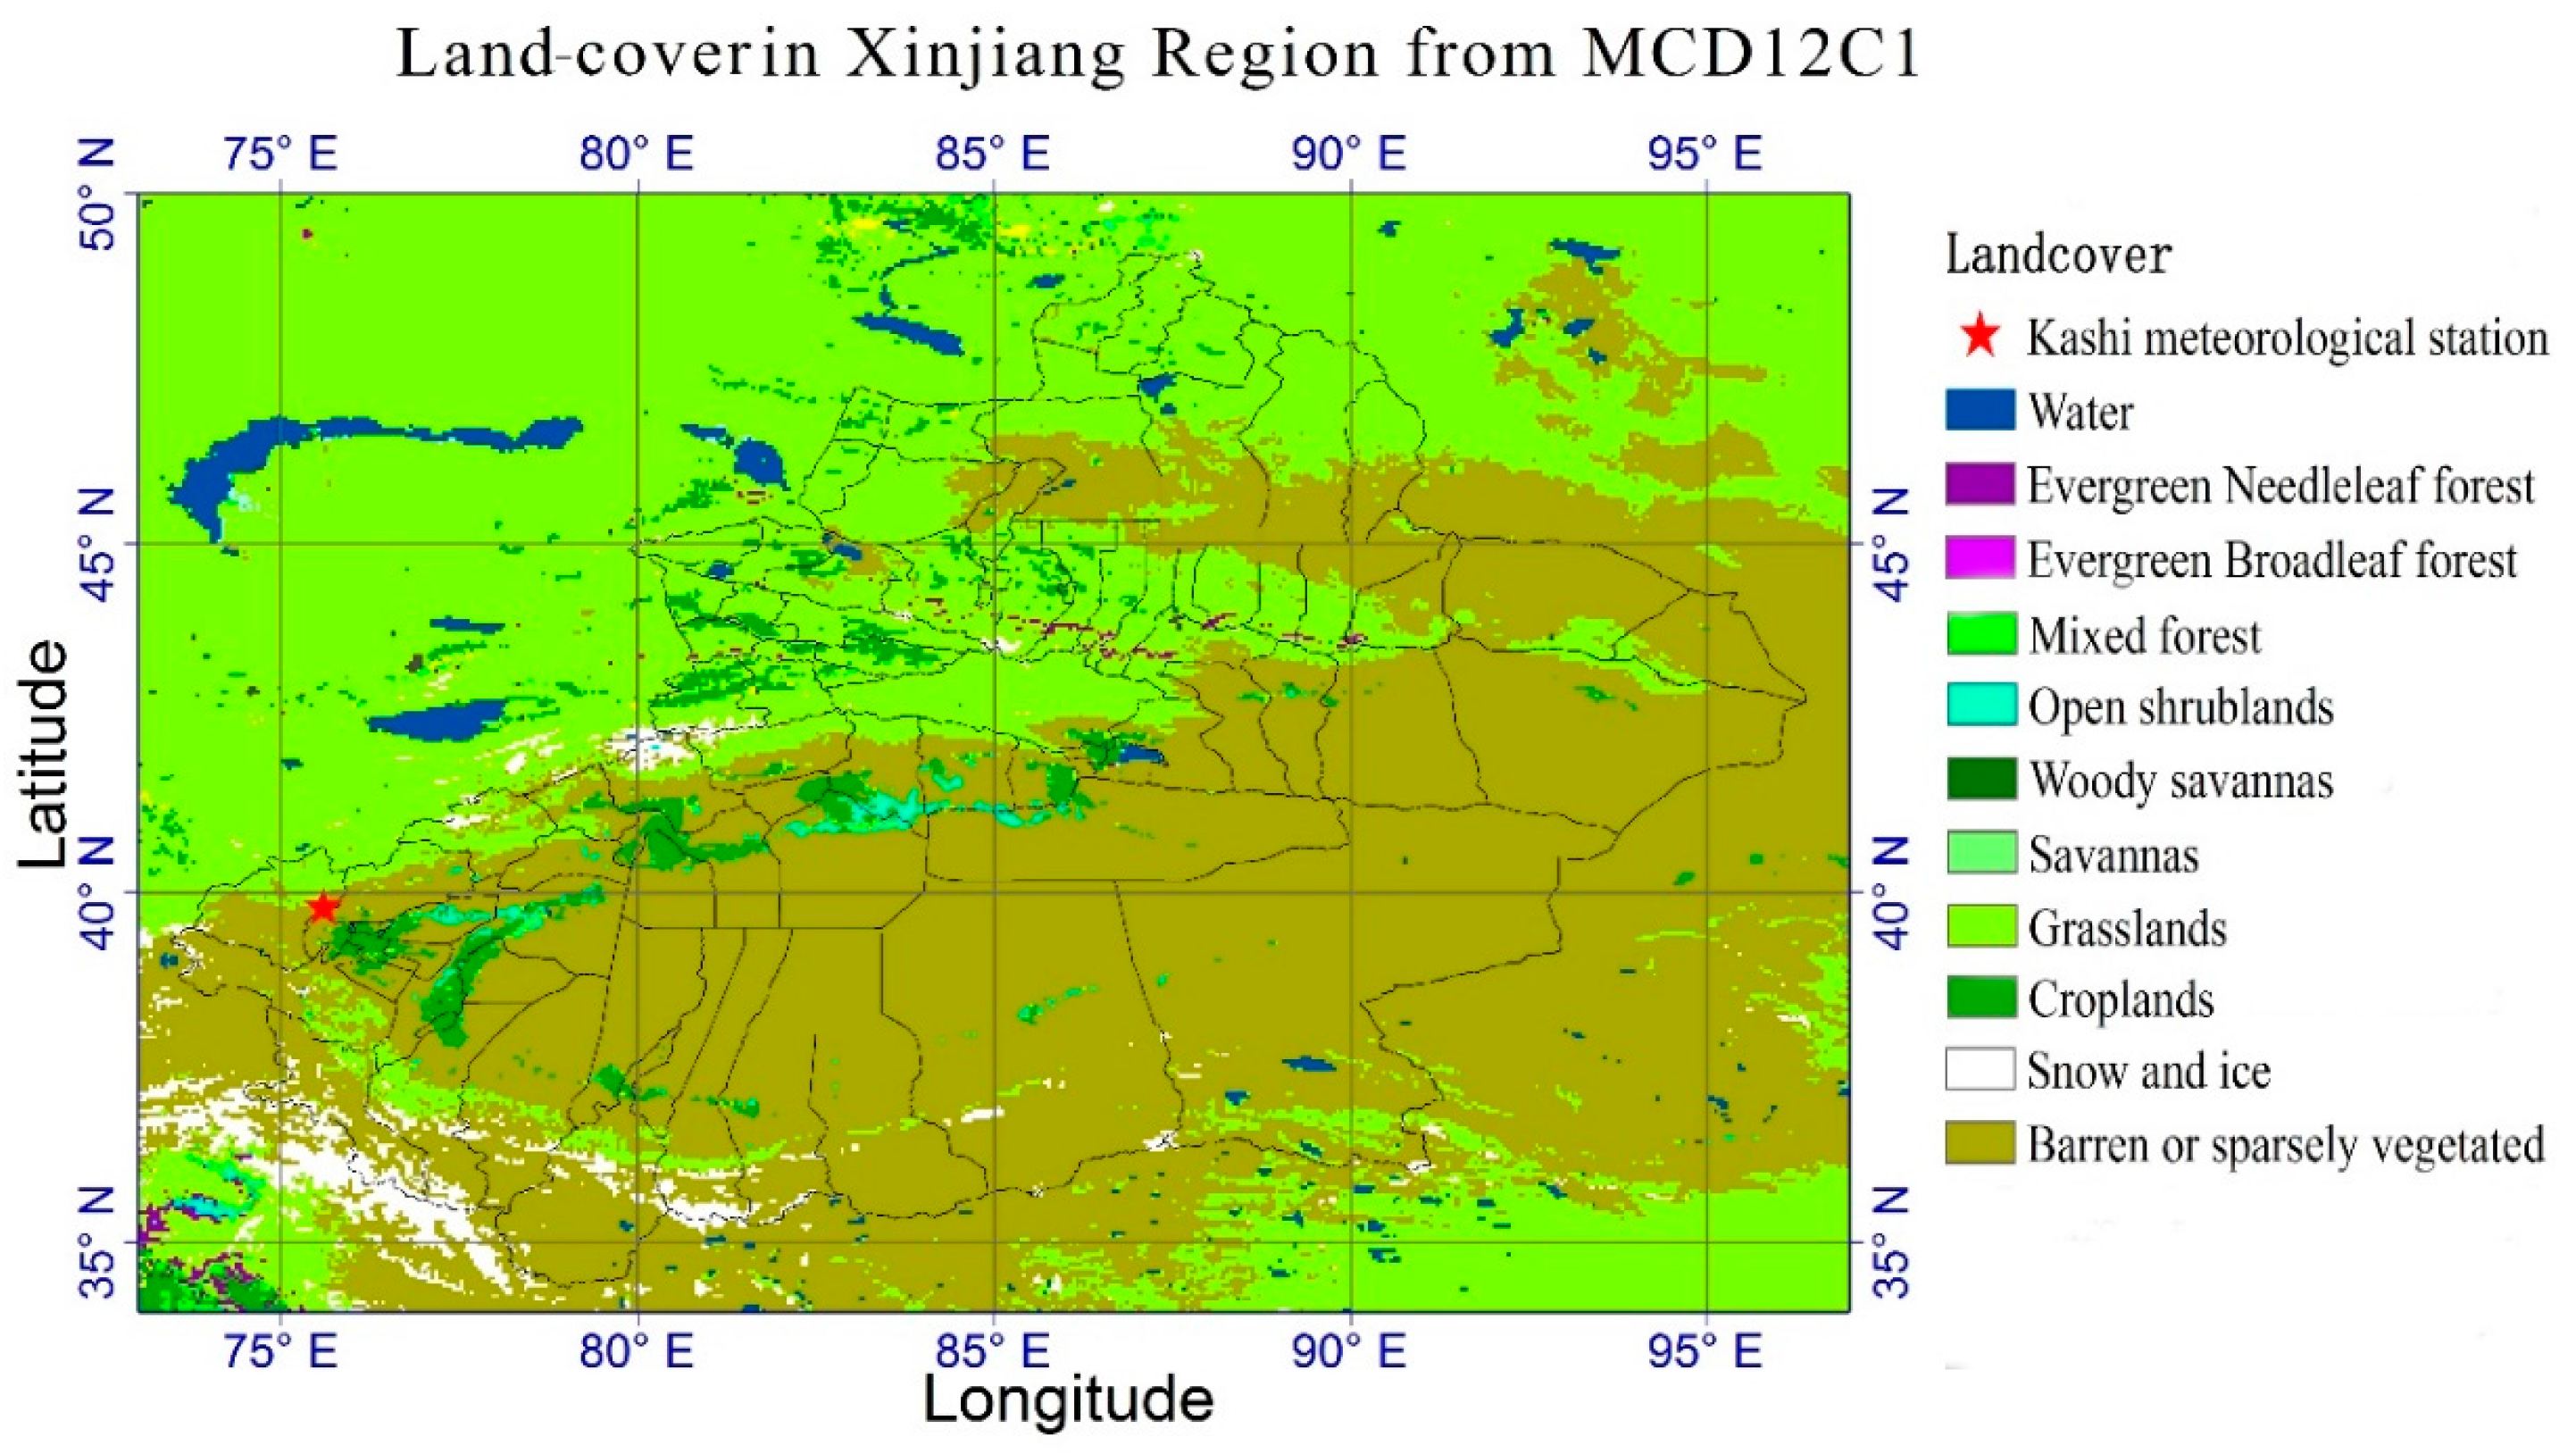
2.1. Study Area

The study area is Xinjiang Region (73°E–96°E, 34°N–45°N) located in the western portion of Taklimakan Desert in western China. Taklimakan Desert is surrounded by the Tianshan Mountain Range in the north and Kunlun Mountain Range to the west and south. The mountains have perennial snow cover. From 1961 to 2013, the mean annual precipitation in Xinjiang was 160.6 mm. In the southern part of Xinjiang, south of Tianshan Mountain the rainfall is only 59.2 mm [27]. Figure 1 shows the MODIS derived land-cover for this region [28]. “Barren or sparsely vegetated” is the predominant cover type. The dry climate, scarce vegetation and vast desert make this region one of the four main dust source areas in the world. Dust storms occur frequently, especially from 1960s to 1970s, but the frequency has been decreasing since 1990s [29].

2.2. Data

As shown in Table 1, the Imager onboard INSAT-3D contains six bands. Four of them are used in this study, namely the Visible (VIS), Shortwave Infrared (SWIR), Mid Infrared (MIR) and Thermal Infrared 1 (TIR1). The Imager provides geostationary Earth observation at 30 min intervals [23]. In this paper, the L1B data of INSAT-3D used were provided as radiation values in gray scale. We calculated the apparent reflectance from the first two bands and the brightness temperature from the third and fourth bands. AOD and aerosol type were retrieved using the visible band (0.65 μm). Other datasets were also used in the analysis and validation, including MODIS AOD product [30,31], FY-2E IDDI dust product, and in-situ observed visibility data obtained from a ground station in Kashgar.

2.3. Spectral Response Characteristics of INSAT-3D Imager

In order to investigate the spectral response characteristics of INSAT-3D Imager, five typical underlying backgrounds were analyzed during a dust event that occurred on 23 April 2014. These backgrounds include: cloud, dust, ground_S (sand ground), ground_M (non-sand ground) and snow. These backgrounds are classified from MODIS RGB image acquired at the same time as INSAT-3D and MODIS products as well as a geographic map and Digital Elevation Model (DEM).
“Dust” refers to dust aerosols in the air that are visible when comparing the RGB image of the dusty day with the clear-sky RGB image several days before. “Cloud” and “Snow” are selected based on MODIS cloud and snow products. Furthermore, in our classification, the “Snow” area is located in elevation higher than 3500 m in the DEM map because snow only exists on the top of mountains in summer. The other two underlying surfaces are determined from the MODIS land cover product as desert areas are always “Barren or sparsely vegetated” as shown in Figure 1.
Statistical analyses of spectral responses were based on these five underlying backgrounds using their pixel counts and values derived from INSAT-3D image acquired at the same time as the MODIS image. Hundreds of points of each underlying surface were sampled and the mid values of each backgrounds were used and plotted in Figure 2.
From Figure 2a, it is clear that a distinct decrement in the apparent reflectance of cloud and snow occurs when the wavelength increases from visible (VIS, 0.6 μm) to Shortwave Infrared (SWIR, 1.6 μm). As snow has strong visible reflectance and strong SWIR absorbing characteristics, its reflectance remains higher compared to other land features in the visible wavebands, but much lower in the SWIR region [32]. This characteristic has been successfully used for identifying snow [33,34].
Clouds are generally characterized by higher reflectance and lower temperature than the underlying earth surface [35]. Clouds show high absorbing characteristics in SWIR as they contain liquid water particles, but relatively less than snow, ice, and cloud ice particles [34,36]. This means that clouds have a relatively higher reflectance value than snow but still much lower than other underlying surfaces in SWIR band as shown in Figure 3a. Taking advantage of these characteristics, clouds and snow can be discriminated from dust and ground with a simple criteria RVIS − RSWIR < 0 where R refers to apparent reflectance. The remaining task is to separate dust from the ground. We have tested the above simple criteria using many different images and found that it is very consistent with the RGB images. In addition, more than 90% of clouds/snow can be distinguished by applying this simple criteria. However, thin cirrus clouds are difficult to discriminate using this simple criterion.
For SWIR at 1.6 μm, the Lorenz-Mie theory is applicable because dust-particle size is equivalent to the signal wavelength and the effect of air molecules and fine mode aerosols on the signal can be negligible [37]. The 1.6 μm signal shows a linear relationship with dust storm intensity and is applicable for dust identification [37,38]. As the wavelength increases from VIS to SWIR, the reflectance of desert surface, Gobi surface and dust layer increases; however the dust reflectance is even higher than the desert and Gobi surface [39,40].
Ackerman found that the brightness temperature difference between 3.7 μm and 11 μm is greater in the dust storm area than clear-sky ground, especially during daytime [1]. It is similar in MIR (3.9 μm) and TIR1 (10.8 μm) as shown in Figure 2b. Unlike other underlying surface, dust particle shows an appreciably higher absorbing and a considerably lower back scattering value at 10.8 μm than that at 3.9 μm [8,23]. This results in a large difference in the brightness temperature in these two bands when dust is present, as shown in Figure 2b. What should be noted is that a large difference exists between these two bands for cloud detection [35]. Interestingly, the brightness temperature difference between TIR1 (10.8 μm) and TIR2 (12 μm) presented herein does not appear as distinct as reported in other studies (e.g., [3,23]). This may be due to the atmospheric humidity or spectral emissivity variations rather than the dust layer itself [6,32]. However, this deserves further investigation. Our approach in this study was that only larger bright temperature differences (about 35 K on average) between MIR (3.9 μm) and TIR1 (10.8 μm) was used to identify dust layers and the small difference between TIR1 (10.8 μm) and TIR2 (12 μm) was not used.
As shown in Figure 3, good clustering characteristics of apparent reflectance and brightness temperature are illustrated for five wavelength regions. This enables dust to be discriminated from other underlying backgrounds using a set of threshold values. Our methods and dust detection index are based on these spectral response characteristics and thresholds, which are presented in the section below.

3. Methods

3.1. AOD Retrieval

For INSAT-3D Imager data, only one visible band, 0.6 μm, could be used for AOD retrieval (as shown in Table 1). Li et al. (2013) proposed an algorithm for AOD retrieval from AVHRR Channel 1 (0.6 μm) data using a model for the earth-atmosphere system which couples an atmospheric radiative transfer model with the Ross-Thick-Li-sparse bidirectional reflectance factor (BRF) model [41,42]. In this algorithm, four sequent observations are used using two basic assumptions that: (1) the surface bidirectional reflective property does not vary over this period; and (2) the aerosol characteristics are uniform within adjacent 4 pixels. Single scattering albedo (SSA) and asymmetry factors are input as initial parameters resampled from Aerosol Robotic Network (AERONET) data. However, the limited number and extremely uneven distribution of AERONET sites make it difficult to get accurate SSA and asymmetry factor for China, especially in Xinjiang.
In order to retrieve AOD and aerosol type simultaneously for Xinjiang, we used the six predefined aerosol types into the algorithm developed by Li [41] to replace the initial single scattering albedo (SSA, ϖ ) and asymmetry factor (g). Govaerts et al. suggested six predefined aerosol types based on different SSA and g [18]. Identifying aerosol type using SSA and asymmetry factor is a good approach as they indicate aerosol absorbing and particle distribution characters respectively [43]. As shown in Table 2, aerosols are classified into two preliminary categories, spherical and non-spherical, according to the ratio between concentrations of fine mode particles and coarse mode particles. During Asian dust storms, dust particle size may vary between 0.01 and 100 μm [38], and a large increment in the volume concentration at the coarse mode occurs against a small decrement in the volume concentrations at the fine mode [44]. The bimodal distribution of particle concentration is enriched in the coarse fraction (>2.1 μm) during Asian dust storm events, while that of non-dust period shows the major peak in the fine fraction around 0.5 μm [45]. Thus, the non-spherical types could be regarded as dust aerosols, which is coincident with the dust aerosol definition ( ϖ = 0.96, g = 0.69) provided by the MODIS aerosol team [43]. The non-spherical dust particle shape effects have not been considered as the radiative effects of dust particle shape have only minor impact on transport and emissions, with small impact on top of atmosphere shortwave forcing. The particle shape effect is largest over water surfaces in dust forcing at the top of the atmosphere [46,47,48]. This new algorithm was then implemented using INSAT-3D, as it shares the same visible band of 0.6 μm with AVHRR. Thus, six AODs were obtained corresponding to the six predefined aerosol types. Since aerosol optical properties hold a good mesoscale horizontal homogeneity within 20 km during a dust storm [49], it is compelling to consider that AOD changes little within adjacent 16 (= 4 × 4) pixels (< 10 km × 10 km). The following optimal criteria are implemented to derive the so-called true aerosol type.
τ m e a n j = i = 1 16 τ i j 16
σ j = i = 1 16 ( τ i j τ m e a n j )
A T o p t i m a l = arg min j = 0 6 ( σ j )
where τ denotes AOD, while superscript j and subscript i denote aerosol type and image pixel. We can obtain six σ values for six aerosol types. We assume that the aerosol type with the smallest σ value is the true aerosol type for the pixel in the grid. Based on this assumption, the AOD corresponding to the true aerosol type is extracted as the final retrieved AOD on pixel-by-pixel basis.

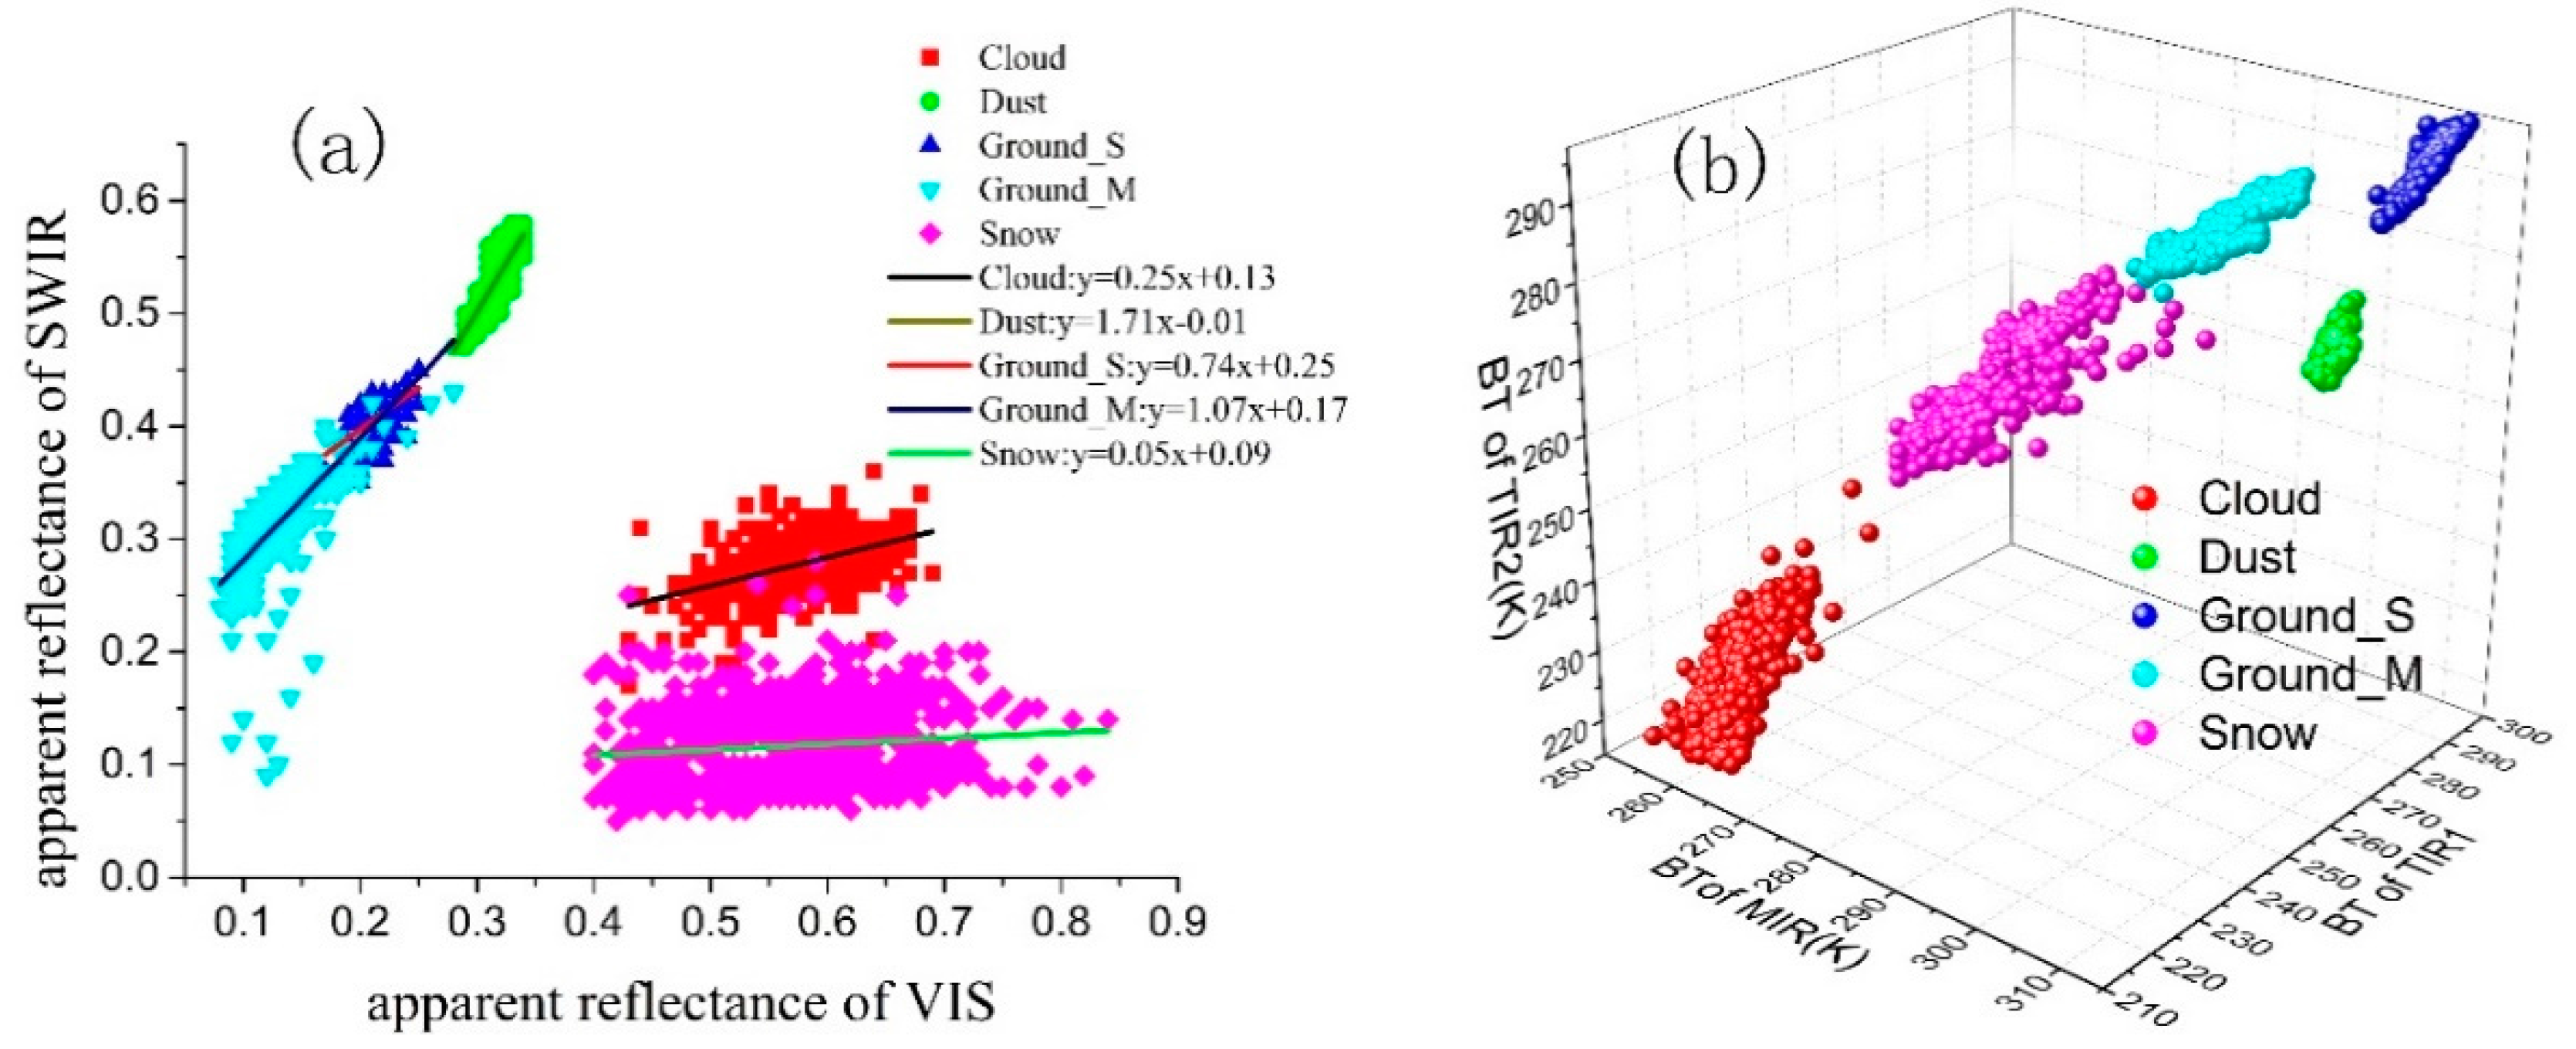
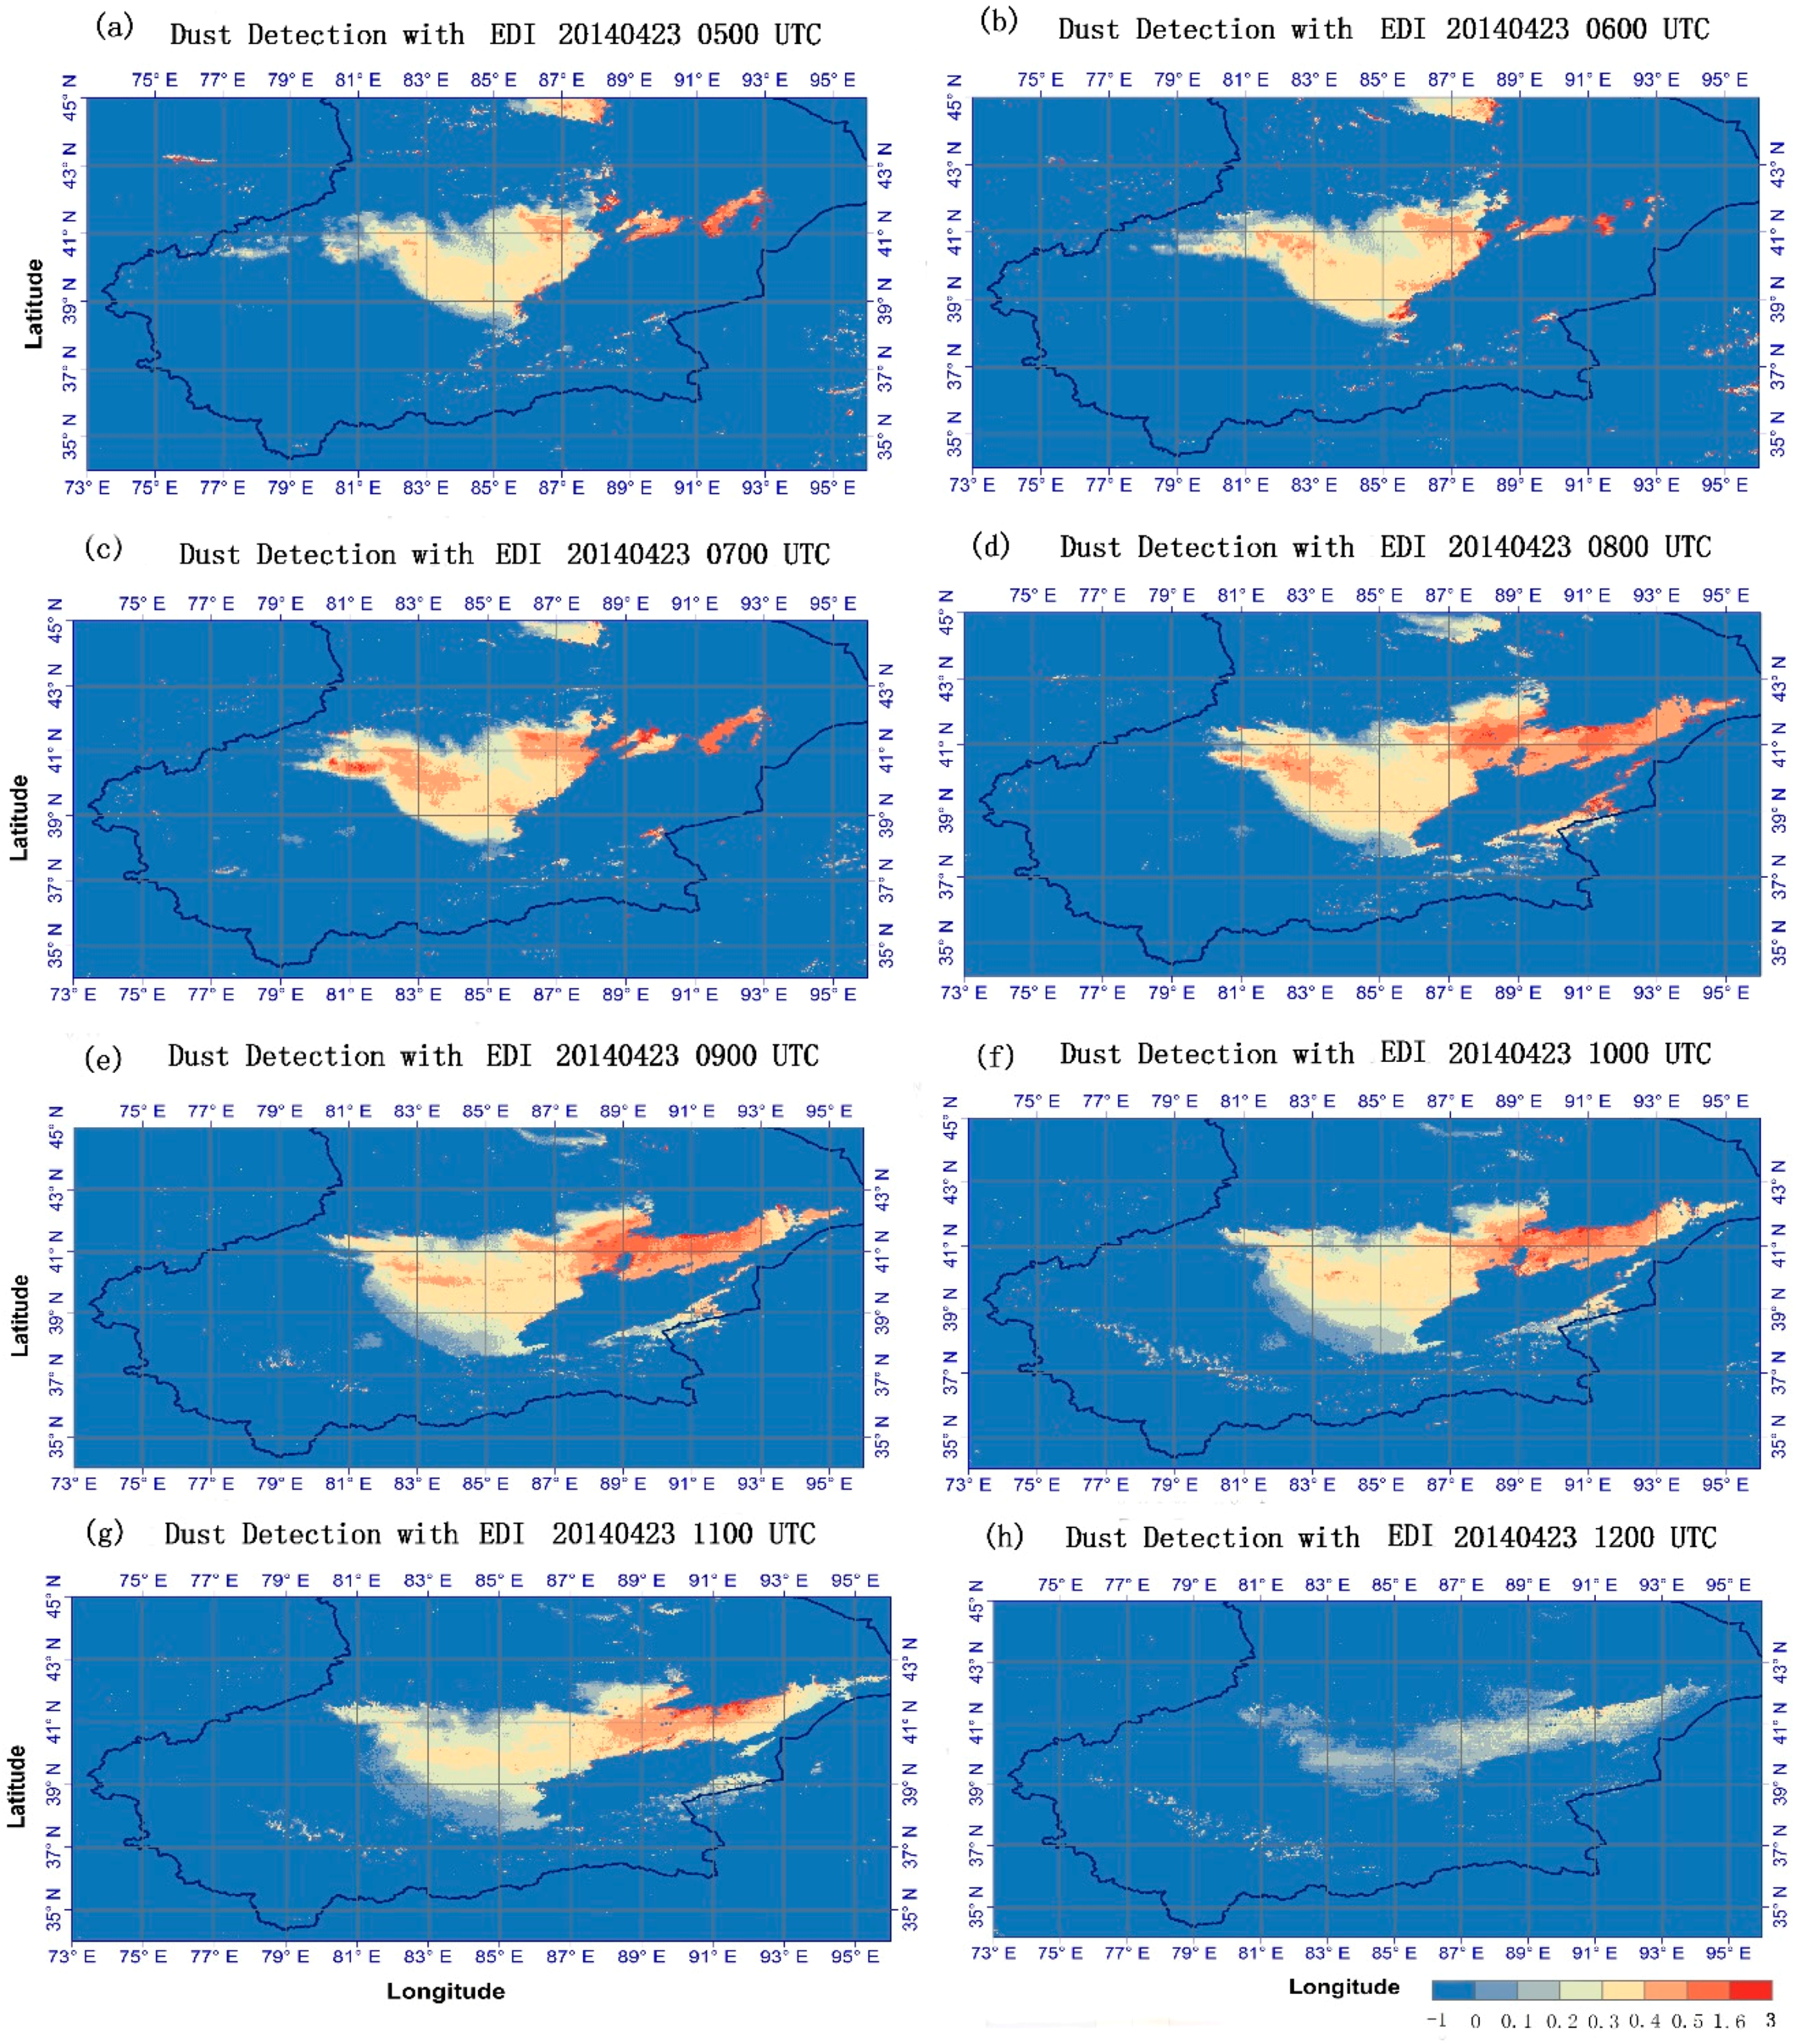
3.2. Enhanced Dust Index

Visibility is the most direct and effective means to characterize the intensity of sand and dust storms [50,51]. It is an important indicator of dust intensity and is used all over the world [50]. In China, dust events can be divided into three classes, namely dust storm (visibility < 1 km, when speed > 10 m/s), blowing dust (1 km < visibility < 10 km, wind speed > 5 m/s) and floating dust (visibility < 10 km, slight or no breeze). The dust storm is further divided into three detailed categories according to its visibility. They are dust storm (500 m < visibility < 1000 m), strong dust storm (50 m < visibility < 500 m) and extreme strong dust storm (visibility < 50 m) [52]. The intensity of the dust increases as horizontal visibility decreases.
In order to highlight the contrast between dust and ground, an innovative dust detection index is required. The previous sections have shown that: (1) the apparent reflectance of cloud and snow in SWIR is much lower than that in VIS; (2) dust has a relatively higher reflectance in SWIR and VIS than the rest underlying surfaces, except cloud and snow; and (3) the brightness temperature difference of dust between MIR and TIR1 is much larger than that of the ground. A strong negative exponential relationship between AOD and visibility at the ground has been reported by previous researches [53,54]. Thus satellite-retrieved AOD can be linked to the intensity of dust events at ground level; therefore, including AOD into the dust detection index is warranted.
Taking the above relationships into consideration we propose an Enhanced Dust Index (EDI).
E D I = ln ( a × R S W I R + R V I S R S W I R R V I S + b × B M I R B T I R 1 B M I R + B T I R 1 + c × A O D )    
In which, R refers to the apparent reflectance and B denotes the brightness temperature; and a = 0.1, b = 10, and c = 0.1. These three coefficients are set to rescale the three components to an equivalent range of [0, 1], so that these three components can have equivalent impact on the result at the same time. For areas with the dust, the sum of these three components is greater than 1, while for non-dust areas, the sum of these three components is less than 1. We choose typical areas of dust, sand and non-sand ground underlying surfaces, and set all the EDI of dust pixels greater than 0, EDI of sand surface and non-sand surface less than 0. RVIS, RSWIR, BMIR, BTIR1 and AOD of each pixels are input into the formula while a, b and c are regarded as unknown parameters. Least square fitting was used to get the most appropriate a, b and c.
As SWIR (1.6 μm) shows a positive linear relationship with dust storm intensity [37], the first component, (RSWIR + RVIS)/(RSWIRRVIS), is also positive to the dust intensity. AOD also has a positive relationship with dust intensity and as demonstrated by researches [53,54]. The second component, (BMIRBTIR1)/(BMIR + BTIR1), has a positive relationship with AOD and hence with dust intensity [55]. EDI is positively correlated to dust intensity; therefore, EDI can detect dust events and their intensity. Finally, it is assumed that the dust is homogeneous in space, so a spatial coherence method is implemented with a window size of 3 × 3 pixels [56].
Thus, the complete process is as: (a) cloud and snow detection with RVISRSWIR < 0; (b) dust detection with EDI; and (c) homogeneity test with a 3 × 3 window for EDI.
To compare the ability to identify dust events using the EDI, a simple threshold method is also implemented. This is because of the differences of radiation responses of the different underlying surfaces, as shown in Figure 3. Herein, we use the following thresholds:
{ R S W I R R V I S < 0 R S W I R     > 0.4 B T I R 1    < 280 K B M I R > 280 K
Note that these thresholds are obtained from a training set in spring (March to May) and relate to the atmospheric environment of the season. For different seasons, the thresholds need to be trained again.

4. Results and Discussion

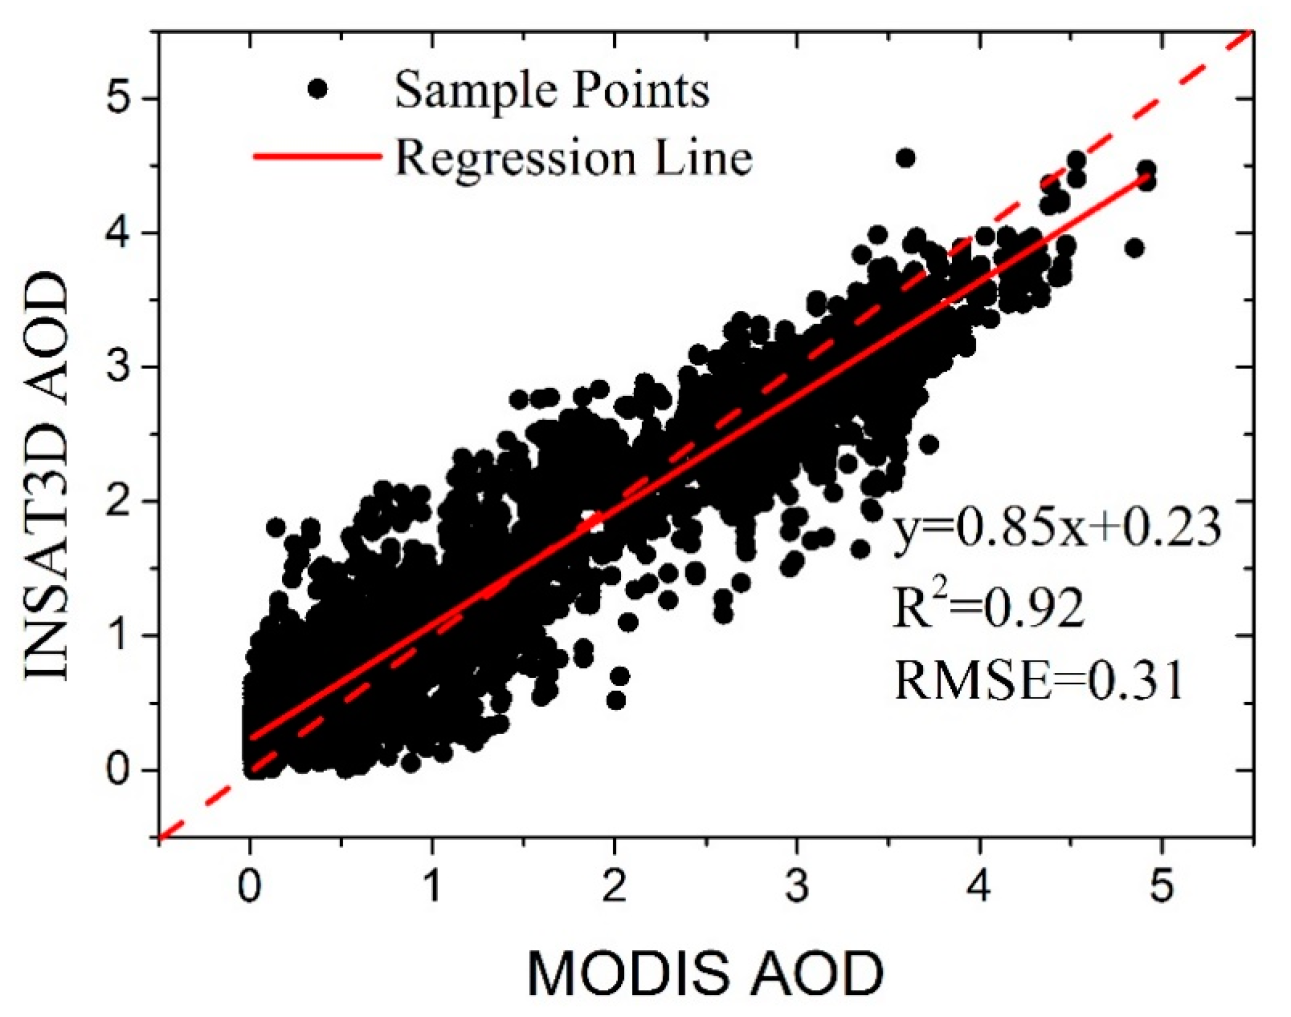
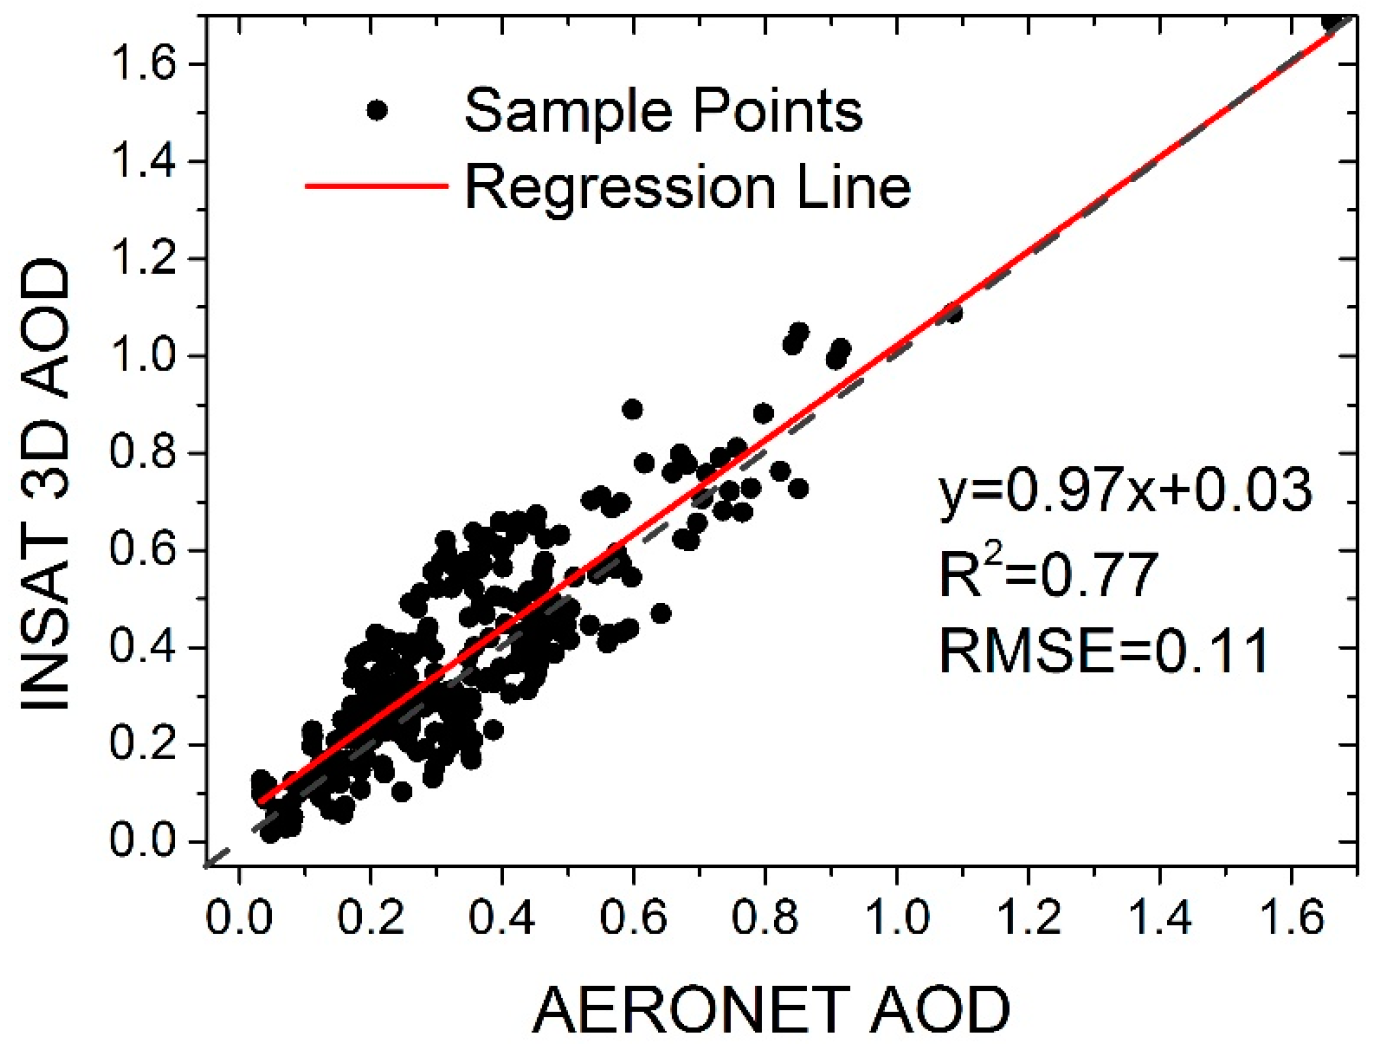
4.1. Validation of Retrieved INSAT 3D AOD

MODIS Deep-Blue AOD product on 23 April 2014 is used for cross validation of the retrieved AOD from INSAT-3D. The relationship between MODIS AOD and INSAT-3D is A O D I N S A T 3 D = 0.85   A O D M O D I S + 0.23 (R2 = 0.92, RMSE = 0.31, Figure 4). The result shows a high correlation between INSAT-3D and MODIS AODs for bright surface areas. AOD reached as high as 5, which was also reported in previous research [10].
Figure 5 shows the cross validation of INSAT 3D AOD with AERONET (Aerosol Robotic Network) in-situ AOD observations and shows strong agreement. Because there was no available AERONET sites in Xinjinag Area in 2014, we checked all the AERONET sites located in China during 23–27 April 2014. A spatial-temporary matching-up method [57] was used to match the satellite-retrieved AOD and AERONET in-situ observation. For AERONET observations, the average value was calculated for each available site of a certain time. That is during 10 min before and 10 min after satellite overpass time. For satellite-retrieved AOD, we calculated the average value in a window of 10 km × 10 km centered on AERONET sites. Then these two data were matched. There were not many AERONET AOD observations in the central area of dust events and so the maximum AOD value is 1.7 in Figure 5.
In order to validate the retrieved aerosol type, MISR (Multi-angle Imaging Spectro-Radiometer) aerosol property data are used. In MISR aerosol retrieval algorithm, 21 component particles are prescribed according to particle size, non-absorbing and absorbing, and spherical and randomly oriented non-spherical types. Different component particles can mix with different proportion and create dozens of aerosol types (see Table 3) [58].
In this paper, we take advantage of this classification strategy to process MISR aerosol properties data and get a MISR aerosol type class map for Xinjiang on 24 April 2014. Figure 6 shows the comparison between the INSAT-3D retrieved aerosol types and MISR aerosol types. As discussed above, of the six pre-defined aerosol types used to retrieve INSAT-3D aerosol properties, the first one, NONABS, is spherical absorbing type. The last three ones, namely SMARAD, MEDRAD and LARRAD, are all non-spherical types. The middle two could be considered as spherical absorbing. Thus, the aerosol type’s definition can be compared between MISR and INSAT-3D.
As seen in Figure 6, most aerosol types are non-spherical, that is dust aerosols. Figure 6a,c match well in dust area. A few pixels of the upper area, appear as non-spherical in Figure 6a but as spherical non-absorbing in Figure 6c. The reason for this may lie in the slight difference in the definition of spherical non-absorbing type in these two algorithms. In our algorithm, SSA of spherical non-absorbing type is 0.95, while it is 1 in MISR algorithm. Figure 6d gives a direct comparison of these two aerosol types, and more than 80 percent of valid pixels get the same types using these two algorithms. Considering the fact that there are only six aerosol types, meaning only six SSA values in our algorithm, the aerosol types have a great coincidence with that from MISR and show good potential for retrieval of aerosol type.
Figure 7 shows the comparison among jointly retrieved AOD (Figure 7a), aerosol types (Figure 7b) and MODIS RGB image (Figure 7c). Areas of high AOD value and coincident dust plumes are shown in areas A, B, C and D. This indicates a promising possibility to depict dust storm intensity using the retrieved AOD. Figure 7b shows the retrieved aerosol types for the three spherical particles (labeled as NaA, NA, and MA) and three non-spherical particles (labeled as SR, MR, and LR). As discussed above, it is rational to consider non-spherical particles as dust aerosols. We can clearly see in Figure 7 that the retrieved dust aerosol type (non-spherical types) is similar to the dust areas marked as A, B and C. The exception is area D and the northwest part of area A with a relative lower AOD and therefore a relatively lower intensity of dust storm. The reason for this could be due to the definition of these predefined aerosols, which are categorized with the ratio between fine mode and coarse mode particles. There is no explicit line in the ratio dimension to separate dust and non-dust. For some less intensive dust plumes like those in D area, the ratio is relatively low, which results in it being classified into spherical particles. Despite of these small misclassifications, the retrieved aerosol types look promising for dust storm detection.

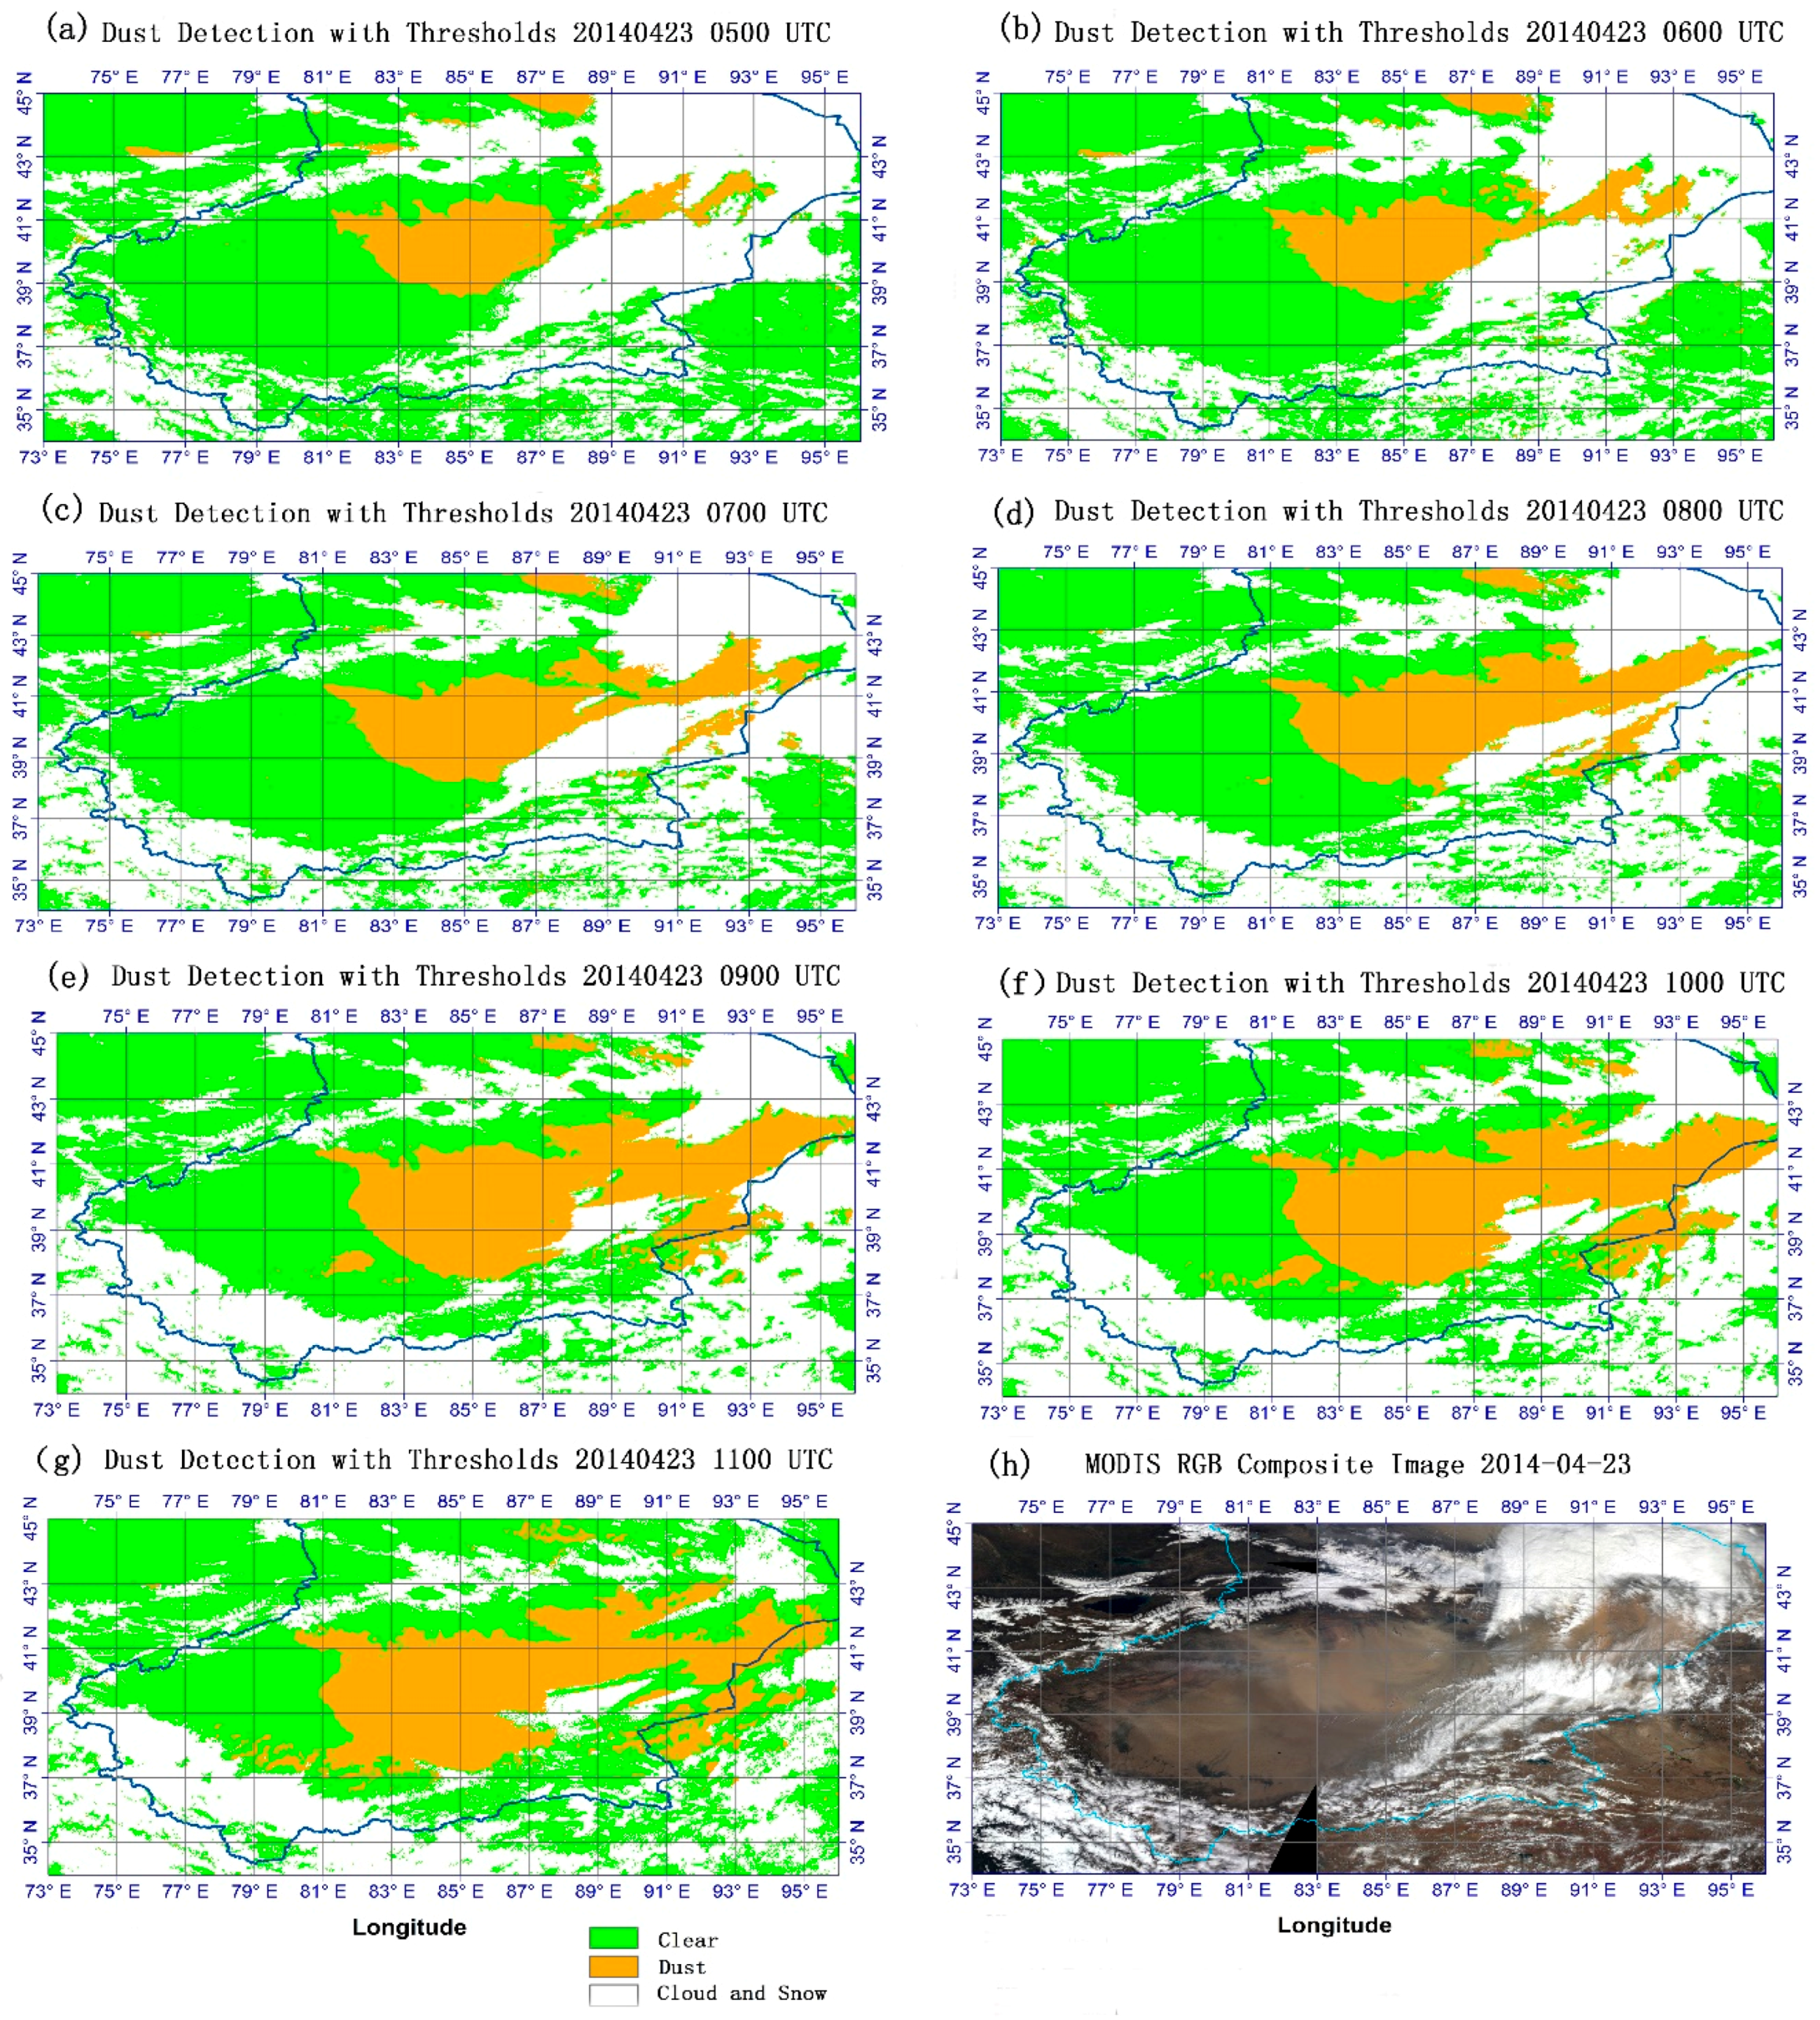
4.2. Results of Enhanced Dust Index and Thresholds Method

In order to demonstrate the relationship between EDI and the intensity of dust, a linear regression analysis was conducted between the retrieved EDI and in-situ ground level visibility observations as shown in Figure 8. The date period is from the May 2014 to the August 2015. The spatial-temporary matching-up method [57] used above was also used here. A good negative linear relationship (R2 = 0.78) was found. The significance test with a P less than 0.01 showed that the confidence level of this negative linear relation is as high as 99.99%.
In Figure 9, a comparison of the calculated EDI and the corresponding MODIS RGB image and IDDI are calculated from FengYun-2E satellite over three days (22–24 April 2014) and shows similarity in identifying dust areas.
On 22 April 2014, a small area of dust plumes (red circle A in Figure 9) can be seen on the MODIS RGB image along the northern edge of the Taklamakan Desert. This area was identified with the EDI but not IDDI. Over the next two days, the dust plumes became larger and the intensity increased as seen on the MODIS RGB image. On 23–24 April 2014, there are clear similarities between the EDI and MODIS RGB. The dust plume area identified by EDI seems less than that by IDDI in areas B and C in Figure 9. However, we can see that the dust area identified by EDI corresponds more closely to the intensity of dust in MODIS RGB image as the area with higher EDI has a thicker dust plume in the RGB image. This comparison increases our confidence with the EDI.
Figure 10 shows the EDI images for eight hours from 5:00 UTC to 12:00 UTC calculated from INSAT-3D data on 23 April 2014. This demonstrates the advantage of the geostationary satellite INSAT-3D in providing information on: (1) the source areas of the dust event; (2) how the extent of the plume changed through the day; and (3) the changing intensity of the plume each hour.
Figure 11 shows the result of the thresholds method using INSAT-3D images on 23 April 2014. In order to identify dust areas, we used the thresholds in Equation (5). Pixels that passed this threshold test were given a flag 1, meaning it is a dust pixel, otherwise 0. Then a spatial coherence test was undertaken for a window of 3 × 3 pixels. Pixels that did not pass this test were also given a flag 0, meaning non-dust pixel. Figure 11h is the MODIS RGB image acquired at the same time with Figure 11a. It illustrates a good similarity with the extent of the dust areas and indicates that this set of thresholds can discriminate dust from other underlying surfaces. One of the advantages of the thresholds method is its simplicity, which enables quick and easy detection of dust areas. However, this method does not have the capacity to indicate the intensity of the dust plume and this set of thresholds needs to be re-trained for other seasons.

5. Conclusions

This paper presents an Enhanced Dust Index (EDI) for dust detection and tracking in hourly time steps for the Xinjiang region of Western China using a geostationary satellite, INSAT-3D data during 22–24 April 2014. The EDI is proposed after an elaborate analysis of radiance response characteristics of INSAT-3D Imager. EDI not only discriminates dust from other backgrounds, it also indicates the dust intensity. A novel algorithm for the retrieval of joint AOD and aerosol type is developed by introducing six predefined aerosol types.
The satellite-retrieved AOD and aerosol types have been shown to work well in description of the extent and intensity of dust events over dust events in spring. The EDI proposed in this paper, with AOD as an important component, performed well in measuring the extent and intensity of dust storms during 22 to 24 April 2014.
The retrieved INSAT-3D AOD and aerosol types are validated using MODIS Deep-Blue AOD, AERONET in-situ AOD and MISR aerosol types, respectively, and demonstrate good performance of the proposed EDI. However, ongoing investigations are needed to verify if these methods and thresholds work for other seasons.
Visibility is an important indicator of dust storm intensity. Linear regression between EDI and visibility showed a significant negative relationship highlighting the utility of EDI. An area for improvement in future work is the discrimination of thin cirrus cloud and low density dust plumes.
A simple threshold method was found to have a good performance in delineating the extent of the dust plumes but inadequate for providing information on dust plume intensity. What should be noted is that a great brightness temperature difference between TIR1 (10.8 μm) and TIR2 (12 μm) does not appear in our sample set, the reason may be due to the atmospheric humidity or the dust composition itself as both have great impact on BTD. This is, however, an area for further study.

Acknowledgments

This work was supported by the Open Research Fund of Key Laboratory of Digital Earth Science, Institute of Remote Sensing and Digital Earth, Chinese Academy Sciences (No. 2014LDE014), and partially by the National Natural Science Foundation of China (NSFC) under grant Nos. 41120114001, 41375162 and 41471306, and by the Ministry of Science and Technology (MOST) China under Grant 2013CB733403. The authors wish to thank Pradeep Kumar Thapliyal and Pradip K. Pal from Indian Space Research Organisation (ISRO) for facilitating data acquisition and image calibration and Xinchun Liu from Institute of Desert Meteorology, CMA, Urumqi, China for providing the in-situ visibility data. INSAT-3D and FengYun-2E data were, respectively, obtained from Meteorological & Oceanographic Satellite Data Archival Center (MOSDAC, http://www.mosdac.gov.in) and Chinese National Meteorological Center (MSMC, http://satellite.cma.gov.cn). MODIS and AERONET data are both from Goddard Space Flight Center, NASA (https://ladsweb.nascom.nasa.gov and http://aeronet.gsfc.nasa.gov).

Author Contributions

A.D. and Y.X. conceived and designed the experiments; A.D., Y.X., J.G., L.S., X.H, C.G., X.Y., and J.L. performed the experiments; A.D. Y.X., J.W., and L.S. analyzed the data; A.D. Y.X., J.G., L.M., Y.H., and Y.C. contributed reagents/materials/analysis tools; A.D., Y.X., X.Y., J.L. and J.G. wrote the paper.

Conflicts of Interest

The authors declare no conflict of interest.

References

  1. Ackerman, S.A. Using the radiative temperature difference at 3.7 and 11 μm to tract dust outbreaks. Remote Sens. Environ. 1989, 27, 129–133. [Google Scholar] [CrossRef]
  2. Evan, A.T.; Heidinger, A.K.; Pavolonis, M.J. Development of a new over-water advanced very high resolution radiometer dust detection algorithm. Int. J. Remote Sens. 2006, 27, 3903–3924. [Google Scholar] [CrossRef]
  3. Baddock, M.C.; Bullard, J.E.; Bryant, R.G. Dust source identification using MODIS: A comparison of techniques applied to the Lake Eyre Basin, Australia. Remote Sens. Environ. 2009, 113, 1511–1528. [Google Scholar] [CrossRef] [Green Version]
  4. Jafari, R.; Malekian, M. Comparison and evaluation of dust detection algorithms using MODIS Aqua/Terra Level 1B data and MODIS/OMI dust products in the Middle East. Int. J. Remote Sens. 2015, 36, 597–617. [Google Scholar] [CrossRef]
  5. Roskovensky, J.; Liou, K. Differentiating airborne dust from cirrus clouds using MODIS data. Geophys. Res. Lett. 2005. [Google Scholar] [CrossRef]
  6. Klüser, L.; Schepanski, K. Remote sensing of mineral dust over land with MSG infrared channels: A new bitemporal mineral dust index. Remote Sens. Environ. 2009, 113, 1853–1867. [Google Scholar] [CrossRef] [Green Version]
  7. Sannazzaro, F.; Filizzola, C.; Marchese, F.; Corrado, R.; Paciello, R.; Mazzeo, G.; Pergola, N.; Tramutoli, V. Identification of dust outbreaks on infrared MSG-SEVIRI data by using a Robust Satellite Technique (RST). Acta Astronaut. 2014, 93, 64–70. [Google Scholar] [CrossRef]
  8. Hu, X.; Lu, N.; Zhang, P. Remote sensing and detection of dust storm in China using the thermal bands of geostationary meteorological satellite. J. Appl. Meteorol. Sci. 2007, 18, 266–275. [Google Scholar]
  9. Ackerman, S.A. Remote sensing aerosols using satellite infrared observations. J. Geophys. Res. Atmos. 1997, 102, 17069–17079. [Google Scholar] [CrossRef]
  10. Legrand, M.; Plana-Fattori, A.; N’Doumé, C. Satellite detection of dust using the IR imagery of Meteosat: 1. Infrared difference dust index. J. Geophys. Res. 2001, 106, 18251–18274. [Google Scholar] [CrossRef]
  11. Chaboureau, J.P.; Tulet, P.; Mari, C. Diurnal cycle of dust and cirrus over West Africa as seen from Meteosat second generation satellite and a regional forecast model. Geophys. Res. Lett. 2007. [Google Scholar] [CrossRef]
  12. Cao, G.; Zhang, P.; Chen, L.; Zheng, Z.; Hu, X. Dust storm detection by merging meteorological visibility with remote sensing IDDI. Remote Sens. Technol. Appl. 2013, 28, 588–593. [Google Scholar]
  13. Hsu, N.C.; Herman, J.R.; Bhartia, P.K.; Seftor, C.J.; Torres, O.; Thompson, A.M.; Gleason, J.F.; Eck, T.F.; Holben, B.N. Detection of biomass burning smoke from TOMS measurements. Geophys. Res. Lett. 1996, 23, 745–748. [Google Scholar] [CrossRef]
  14. O’Brien, D.M.; Mitchell, R.M. Atmospheric heating due to carbonaceous aerosol in Northern Australia—Confidence limits based on TOMS aerosol index and sun-photometer data. Atmos. Res. 2003, 66, 21–41. [Google Scholar] [CrossRef]
  15. Torres, O.; Tanskanen, A.; Veihelmann, B.; Ahn, C.; Braak, R.; Bhartia, P.K.; Veefkind, P.; Levelt, P. Aerosols and surface UV products from Ozone Monitoring Instrument observations: An overview. J. Geophys. Res. Atmos. 2007. [Google Scholar] [CrossRef]
  16. Huang, J.; Ge, J.; Weng, F. An analysis of global aerosol type as retrieved by MISR. J. Geophys. Res. Atmos. 2007, 120, 4248–4281. [Google Scholar]
  17. Huang, J.; Fu, Q.; Su, J.; Tang, Q.; Minnis, P.; Hu, Y.; Yi, Y.; Zhao, Q. Taklimakan dust aerosol radiative heating derived from CALIPSO observations using the Fu-Liou radiation model with CERES constraints. Atmos. Chem. Phys. 2009, 9, 4011–4021. [Google Scholar] [CrossRef]
  18. Govaerts, Y.; Wagner, S.; Lattanzio, A.; Watts, P. Joint retrieval of surface reflectance and aerosol optical depth from MSG/SEVIRI observations with an optimal estimation approach: 1. Theory. J. Geophys. Res. Atmos. 2010. [Google Scholar] [CrossRef]
  19. Knapp, K.; Frouin, R.; Kondragunta, S.; Prados, A. Toward aerosol optical depth retrievals over land from GOES visible radiances: Determining surface reflectance. Int. J. Remote Sens. 2005, 26, 4097–4116. [Google Scholar] [CrossRef]
  20. Kim, J.; Yoon, J.M.; Ahn, M.; Sohn, B.; Lim, H. Retrieving aerosol optical depth using visible and mid-IR channels from geostationary satellite MTSAT-1R. Int. J. Remote Sens. 2008, 29, 6181–6192. [Google Scholar] [CrossRef]
  21. Mei, L.; Xue, Y.; De Leeuw, G.; Holzer-Popp, T.; Guang, J.; Li, Y.; Yang, L.; Xu, H.; Xu, X.; Li, C. Retrieval of aerosol optical depth over land based on a time series technique using MSG/SEVIRI data. Atmos. Chem. Phys. 2012, 12, 9167–9185. [Google Scholar] [CrossRef]
  22. Sanwlani, N.; Chauhan, P.; Navalgund, R. Dust storm detection and monitoring using multi-temporal INSAT-3A-CCD data. Int. J. Remote Sens. 2001, 32, 5527–5539. [Google Scholar] [CrossRef]
  23. Mishra, M.K.; Chauhan, P.; Sahay, A. Detection of Asian dust storms from geostationary satellite observations of the INSAT-3D imager. Int. J. Remote Sens. 2015, 36, 4668–4682. [Google Scholar] [CrossRef]
  24. Bai, L.; Xue, Y.; Cao, C.; Feng, J.; Zhang, H.; Guang, J.; Wang, Y.; Li, Y.; Mei, L.; Ai, J. Quantitative retrieval of aerosol optical thickness from FY-2 VISSR data. In Proceedings of the Sixth International Symposium on Digital Earth, Beijing, China, 9–12 September 2009.
  25. Wang, Y.; Xue, Y.; Guang, J.; Mei, L.; Hou, T.; Li, Y.; Xu, H. Simultaneously retrieval of Aerosol Optical Depth and surface albedo with FY-2 geostationary data. In Proceedings of the 2011 IEEE International Geoscience and Remote Sensing Symposium (IGARSS), Kyoto, Japan, 24–29 July 2011; pp. 2912–2914.
  26. Ren, T.; Gao, L.; Li, C.; Mao, J.; Li, W.; Shi, G.; Yang, D.; Wang, L. Retrieval of aerosol optical depth from FengYun-2C geostationary satellite observation: Theory and Implementation. Acta Sci. Nat. Univ. Pekin. 2011, 47, 636–647. [Google Scholar]
  27. Jiang, Y.; Liu, J.; Shao, W.; Yu, X.; Wang, S. Climatic characteristics and historical evolution of precipitation in different time scales in Xinjiang from 1961 to 2013. J. Glaciol. Geocryol. 2014, 36, 1363–1375. [Google Scholar]
  28. Friedl, M.A.; Sulla-Menashe, D.; Tan, B.; Schneider, A.; Ramankutty, N.; Sibley, A.; Huang, X. MODIS Collection 5 global land cover: Algorithm refinements and characterization of new datasets. Remote Sens. Environ. 2010, 114, 168–182. [Google Scholar] [CrossRef]
  29. Wang, X.; Ma, Y.; Chen, H. Climatic characteristics of sandstorm in Xinjiang. J. Desert Res. 2003, 23, 539–544. [Google Scholar]
  30. Hsu, N.C.; Tsay, S.-C.; King, M.D.; Herman, J.R. Deep blue retrievals of Asian aerosol properties during ACE-Asia. IEEE Trans. Geosci. Remote Sens. 2006, 44, 3180–3195. [Google Scholar] [CrossRef]
  31. Hsu, N.; Jeong, M.J.; Bettenhausen, C.; Sayer, A.; Hansell, R.; Seftor, C.; Huang, J.; Tsay, S.C. Enhanced Deep Blue aerosol retrieval algorithm: The second generation. J. Geophys. Res. Atmos. 2013, 118, 9296–9315. [Google Scholar] [CrossRef]
  32. Ogawa, K.; Schmugge, T.; Jacob, F.; French, A. Estimation of land surface window (8–12 μm) emissivity from multi-spectral thermal infrared remote sensing—A case study in a part of Sahara Desert. Geophys. Res. Lett. 2003. [Google Scholar] [CrossRef]
  33. Hall, D.K.; Riggs, G.A.; Salomonson, V.V.; DiGirolamo, N.E.; Bayr, K.J. MODIS snow-cover products. Remote Sens. Environ. 2002, 83, 181–194. [Google Scholar] [CrossRef]
  34. Kulkarni, A.V.; Singh, S.K.; Mathur, P.; Mishra, V.D. Algorithm to monitor snow cover using AWiFS data of RESOURCESAT-1 for the Himalayan region. Int. J. Remote Sens. 2006, 27, 2449–2457. [Google Scholar] [CrossRef]
  35. Frey, R.A.; Ackerman, S.A.; Liu, Y.; Strabala, K.I.; Zhang, H.; Key, J.R.; Wang, X. Cloud detection with MODIS. Part I: Improvements in the MODIS cloud mask for collection 5. J. Atmos. Ocean. Technol. 2008, 25, 1057–1072. [Google Scholar] [CrossRef]
  36. Heidinger, A.K.; Frey, R.; Pavolonis, M. Relative merits of the 1.6 and 3.75 μm channels of the AVHRR/3 for cloud detection. Can. J. Remote Sens. 2004, 30, 182–194. [Google Scholar] [CrossRef]
  37. Luo, J.N.; Fan, Y.D.; Shi, P.J.; Lu, W.J.; Zhou, J.H. Comparable method of monitoring the intensity of dust storm by multisource data of remote sensing. J. Nat. Disasters 2003, 12, 28–34. [Google Scholar]
  38. Shao, Y.; Dong, C.H. A review on East Asian dust storm climate, modelling and monitoring. Glob. Planet. Chang. 2006, 52, 1–22. [Google Scholar] [CrossRef]
  39. Guo, N.; Cai, D.; Han, L.; Liang, Y.; Li, M. Introduction to the operational system and identification method of dust strom based on MODIS. Meteorol. Mon. 2009, 35, 102–108. [Google Scholar]
  40. Guo, N.; Liang, Y. A Study on quantitative identification of sand and dust storm using MODIS data. Arid Meteorol. 2006, 24, 1–6. [Google Scholar]
  41. Li, Y.; Xue, Y.; de Leeuw, G.; Li, C.; Yang, L.; Hou, T.; Marir, F. Retrieval of aerosol optical depth and surface reflectance over land from NOAA AVHRR data. Remote Sens. Environ. 2013, 133, 1–20. [Google Scholar] [CrossRef]
  42. Wanner, W.; Li, X.; Strahler, A.H. On the derivation of kernels for kernel-driven models of bidirectional reflectance. J. Geophys. Res. Atmos. 1995, 100, 21077–21089. [Google Scholar] [CrossRef]
  43. Levy, R.C.; Remer, L.A.; Mattoo, S.; Vermote, E.F.; Kaufman, Y.J. Second-generation operational algorithm: Retrieval of aerosol properties over land from inversion of moderate resolution imaging spectroradiometer spectral reflectance. J. Geophys. Res. Atmos. 2007. [Google Scholar] [CrossRef]
  44. Patel, P.N. Estimation of aerosol characteristics and radiative forcing during dust events over Dehradun. Aerosol Air Qual. Res. 2015, 15, 2082–2093. [Google Scholar] [CrossRef]
  45. Ma, C.-J.; Choi, K.-C. A Combination of bulk and single particle analyses for asian dust. Water Air Soil Pollut. 2007, 183, 3–13. [Google Scholar] [CrossRef]
  46. Colarco, P.R.; Nowottnick, E.P.; Randles, C.A.; Yi, B.; Yang, P.; Kim, K.-M.; Smith, J.A.; Bardeen, C.G. Impact of radiatively interactive dust aerosols in the NASA GEOS-5 climate model: Sensitivity to dust particle shape and refractive index. J. Geophys. Res. Atmos. 2014, 119, 753–786. [Google Scholar] [CrossRef]
  47. Feng, Q.; Yang, P.; Kattawar, G.W.; Hsu, N.C.; Tsay, S.-C.; Laszlo, I. Effects of particle nonsphericity and radiation polarization on retrieving dust properties from satellite observations. J. Aerosol Sci. 2009, 40, 776–789. [Google Scholar] [CrossRef]
  48. Yi, B.; Hsu, C. N.; Yang, P.; Tsay, S.-H. Radiative transfer simulation of dust-like aerosols: Uncertainties from particle shape and refractive index. J. Aerosol Sci. 2011, 42, 631–644. [Google Scholar] [CrossRef]
  49. Anderson, T.L.; Charlson, R.J.; Winker, D.M.; Ogren, J.A.; Holmén, K. Mesoscale variations of tropospheric aerosols. J. Atmos. Sci. 2003, 60, 119–136. [Google Scholar] [CrossRef]
  50. Baddock, M.C.; Strong, C.L.; Leys, J.F.; Heidenreich, S.K.; Tews, E.K.; McTainsh, G.H. A visibility and total suspended dust relationship. Atmos. Environ. 2014, 89, 329–336. [Google Scholar] [CrossRef] [Green Version]
  51. Camino, C.; Cuevas, E.; Basart, S.; Alonso-Pérez, S.; Baldasano, J.M.; Terradellas, E.; Marticorena, B.; Rodríguez, S.; Berjón, A. An empirical equation to estimate mineral dust concentrations from visibility observations in Northern Africa. Aeol. Res. 2015, 16, 55–68. [Google Scholar] [CrossRef] [Green Version]
  52. Zhou, X. Discussion on some terms used for sand-dust weather in the national standard. Sci. Meteorol. Sin. 2010, 30, 234–238. [Google Scholar]
  53. Yan, H.; Jiao, M.; Bi, B.; Zheng, C. Observation on Sand dust Aerosol in Center of Taklimakan Desert. J. Desert Res. 2006, 26, 389–393. [Google Scholar]
  54. Zhao, X.; Chen, C.; Yuan, T.; Zhang, W.; Dong, X. Lanzhou aerosol optical depth in winter and their relation with visibility. Plateau Meteorol. 2005, 24, 617–622. [Google Scholar]
  55. Hao, X.; John, J.Q. Saharan dust storm detection using moderate resolution imaging spectroradiometer thermal infrared bands. J. Appl. Remote Sens. 2007. [Google Scholar] [CrossRef]
  56. Jia, J.; Jiao, L. Image segmentation by spectral clustering algorithm with spatial coherence constraints. J. Infrared Millim. Waves 2010, 29, 69–74. [Google Scholar] [CrossRef]
  57. Ichoku, C.; Chu, D.A.; Mattoo, S.; Kaufman, Y.J.; Remer, L.A.; Tanre, D.; Slutsker, I.; Holben, B.N. A spatio-temporal approach for global validation and analysis of MODIS aerosol products. Geophys. Res. Lett. 2002. [Google Scholar] [CrossRef]
  58. Kahn, R.A.; Gaitley, B.J.; Garay, M.J.; Diner, D.J.; Eck, T.F.; Smirnov, A.; Holben, B.N. Multiangle Imaging SpectroRadiometer global aerosol product assessment by comparison with the Aerosol Robotic Network. J. Geophys. Res. Atmos. 2010. [Google Scholar] [CrossRef]
Figure 1. Land-cover in Xinjiang Region (from MODIS land cover product, https://ladsweb.nascom.nasa.gov).
Remotesensing 08 00702 g001
Figure 2. Spectral response characteristics of INSAT-3D: (a) the apparent reflectance of VIS (0.65 μm) and SWIR (1.6 μm); and (b) brightness temperature of MIR (3.9 μm) and TIR1 (10.8 μm) against five underlying surfaces: cloud, dust, sand ground (ground1_S), non-sand ground (ground2_M) and snow.
Remotesensing 08 00702 g002
Figure 3. Clustering characteristics of five different wavelength regions representing five different underlying surfaces: (a) the apparent reflectance of VIS (0.65 μm) and SWIR (1.6 μm); and (b) brightness temperature of MIR (3.9 μm) and TIR1 (10.8 μm).
Remotesensing 08 00702 g003
Figure 4. Cross validation of retrieved INSAT 3D AOD and MODIS Deep-Blue AOD: solid line denotes the linear regression line while dash line denotes the 1-1 line.
Remotesensing 08 00702 g004
Figure 5. Validation of retrieved INSAT 3D AOD and AERONET in-situ AOD: solid line denotes the leaner regression line while dash line denotes the 1-1 line.
Remotesensing 08 00702 g005
Figure 6. A comparison between INSAT 3D retrieved aerosol type and MISR Aerosol type: INSAT 3D retrieved aerosol types (a); MODIS RGB image (b) and MISR aerosol type product (c) at the corresponding time, and the comprehensive spatial comparison between INSAT-3D retrieved aerosol type and MISR aerosol type (d). (SNA: Spherical Non-absorbing, SAB: Spherical Absorbing, NS: Non-Spherical, NaN: Not a Number).
Remotesensing 08 00702 g006
Figure 7. Comparison among: the retrieved INSAT-3D AOD (a); aerosol types (b); and MODIS RGB image (c) at the corresponding time (NA: NONABS, MA: MODABS, AB: ABSORB, SR: SMARAD, MR: MEDRAD, LR: LARRAD, NaN: Not a Number).
Remotesensing 08 00702 g007
Figure 8. The relationship of satellite-retrieved Enhanced Dust Index and in-situ visibility.
Remotesensing 08 00702 g008
Figure 9. Comparison of Enhanced Dust Index and corresponding MODIS RGB Image and Infrared Difference Dust Index (IDDI) product obtained from FengYun-2E satellite on 22 April 2014.
Remotesensing 08 00702 g009
Figure 10. Enhanced Dust Index (EDI) images (from 5:00 UTC to 12:00 UTC) during a dust storm on 23 April 2014 (Non-dust pixels are assigned a value of −1). (ah) are the EDI values per hour from 5:00 UTC to 12:00 UTC, in 23 April 2014.
Remotesensing 08 00702 g010
Figure 11. Dust detection images (from 5:00 UTC to 12:00 UTC) calculated with the thresholds method during a dust storm event on 23 April 2014. MODIS RGB image taken at 5:00 UTC on 23 April 2014. (ag) are the results of thresholds method per hour from 5:00 UTC to 11:00 UTC, in 23 April 2014, and (h) is the MODIS RGB image at 5:00 UTC, in 23 April 2014.
Remotesensing 08 00702 g011
Table 1. INSAT-3D Imager bands.
BandsWavelength Range (μm)Wavelength Center (μm)Resolution (km)
VIS0.55–0.750.651
SWIR1.55–1.701.6251
MIR3.8–4.03.94
WV6.5–7.16.88
TIR110.3–11.310.84
TIR211.5–12.5124
Table 2. Properties of the spherical and non-spherical aerosol model in solar band of MSG/SEVIRI derived from AERONET observation.
AerosolLabelSphericalNon-Spherical
ABSORBMODABSNONABSSMARADMEDRADLARRAD
Fine modervf0.1550.2210.1790.1450.1720.202
σf0.4040.4970.4260.5000.6360.627
Cvf0.0830.0940.1010.0370.0330.043
ref0.1430.1950.1640.1290.1410.165
Coarse modervc3.0122.8863.0042.4231.9611.978
σc0.6490.5980.6230.6170.5490.527
Cvc0.0510.0500.0390.2620.3640.521
rec2.4142.4272.4741.9841.6721.697
S 98.693.698.53.11.31.2
g0.60.580.680.620.680.720.74
0.80.530.640.560.680.730.75
1.60.560.580.510.700.740.78
ϖ 0.60.860.930.950.920.950.96
0.80.8340.920.940.930.960.97
1.60.760.880.910.950.970.98
Note: The spherical aerosol types are labeled ABSORB (spherical absorbing), MODABS (spherical moderately absorbing) and NONABS (spherical non-absorbing). The non-spherical aerosol types are labeled SMARAD (non-spherical small radius), MEDRAD (non-spherical medium radius), and LARRAD (non-spherical large radius). The size distribution is defined with the following symbols: rvf, fine-mode volume median radius (μm); σf, fine-mode radius standard deviation (μm); Cvf, fine-mode volume concentration; rvc, coarse-mode volume median radius (μm); σc, coarse-mode radius standard deviation (μm); Cvc, coarse-mode volume concentration; S, percentage of spherical particles; g, asymmetry parameter, and ϖ single scattering albedo. Fine model and coarse model parameters are from [18,21].
Table 3. MISR Aerosol Type Mixture.
Aerosol Type ClassMixture Type GroupMixture Aerosol Type NumberMixture Aerosol Component NumberSSA (672 μm)
1: Spherical Non-AbsorbingSpherical_Reff_0.06_Reff_2.8_Nonabsorbing1–101, 61.0
Spherical_Reff_0.12_Reff_2.8_Nonabsorbing11–202, 61.0
Spherical_Reff_0.26_Reff_2.8_Nonabsorbing21–303, 61.0
2: Spherical AbsorbingSpherical_Reff_0.12_SSA_0.9_Reff_2.8_Absorbing31–406, 80.885–0.983
Spherical_Reff_0.12_SSA_0.8_Reff_2.8_Absorbing41–506, 140.773–0.967
3: Non–SphericalSpherical_Reff_0.06_Reff_2.8 _Med_Dust51–622, 6, 190.995–0.998
Spherical_Reff_0.12_Med_Dust_Coarse_Dust63–702, 19, 210.978–0.993
Med_Dust_Coarse_Dust71–7419, 210.975–0.99

