1. Introduction
Beijing, the Capital of China, and Tianjin, one of the four municipalities of China, both play very important roles in the nation’s political and economic framework. Especially since the coordinated development of Beijing-Tianjin-Hebei became a national strategy in 2013, in which Beijing and Tianjin are positioned as the twin engines driving the regional development. On the other side, due to insufficient rainfall in the North China plain, groundwater has been the main water resources for farmland irrigation, industrial activities, and daily water supply of urban inhabitants since 1970s [
1]. Long-term over-withdrawal of groundwater has caused continuous and dramatic decline of groundwater level in the aquifer system of this region. For example, the groundwater level has declined 2.7 m every year in Chaoyang district of Beijing from 2001 to 2010 [
2]. Continuous pumping of aquifer water triggers large scale ground subsidence across the North China Plain. Currently, ground subsidence has been recognized as the most serious disaster hindering the sustainable development of this region. In 2012, the central government announced a 10-year plan (2012–2020 plan) swore to take measures fighting against ground subsidence in several main plains across the country including the North China Plain. Establishing an effective monitoring network over subsided areas was listed as a fundamental task of the plan.
Traditionally, the surveying and mapping agencies of Beijing and Tianjin have conducted spirit leveling once per year routinely since 1990s in some areas of Beijing and Tianjin. Therefore, ground subsidence information at some sparse leveling points has been obtained, which forms the basis of official reports on ground subsidence in Beijing and Tianjin. However, such a regular leveling campaign has never been conducted on a large scale in Hebei province, because the cost would be unaffordable given the area of more than 180,000 km2 of Hebei province. The main drawback of the leveling method is that it cannot achieve dense spatial sampling due to cost limitations. For example, the area of Tianjin municipality is 11,946 km2, while the amount of leveling points routinely measured every year is less than 1200, equivalent to about one leveling point within every 10 km2. Therefore, ground subsidence information generated from leveling measurement is incomplete, thus having limited usefulness.
Interferometric SAR (InSAR) was considered an advantageous technique to monitor ground deformation over a large area in comparison with traditional ground-based methods when it emerged in late 1980s [
3], but it did not become practically reliable until several kinds of advanced time series techniques came out around the end of last century, such as the permanent scatterer InSAR (PS-InSAR) [
4,
5,
6] or persistent scattered InSAR [
7], and the SBAS InSAR [
8]. Since then, time series InSAR techniques have been widely applied to monitor various deformations across the geosciences community, including those associated with volcanic eruptions [
9], earthquakes [
10], landslides [
11,
12,
13], and urban subsidence [
14]. In China, given the significance of ground subsidence in the Beijing-Tianjin-Hebei region, time-series InSAR techniques have been employed to monitor ground subsidence in different cities, such as in Beijing [
15,
16,
17], Tianjin [
18,
19,
20], and Langfang [
21] and Cangzhou [
22] of Hebei province. All these studies concern subsidence over relatively small areas which can be covered by one SAR frame, and there is a lack of complete information on ground subsidence over the entire Beijing-Tianjin-Hebei region. In this paper, we report a research on monitoring ground subsidence using an improved time series InSAR technique for the wide Beijing-Tianjin-Hebei region over a 22-year time span dating back to 1992 when the European Remote Sensing (ERS)-1 SAR images became available. This research represents a first-ever effort on mapping ground subsidence over such a wide area in China. It involves not only technical innovations, but also significant output which can be used directly for decision-making on subsidence mitigation in the Beijing-Tianjin-Hebei region.
The paper is organized as follows.
Section 2 describes the study area and the SAR images. The processing method is introduced in
Section 3. The mosaics of ground subsidence rate during the three periods are presented in
Section 4. The accuracy validation is also introduced in this section. In
Section 5, the spatial-temporal characteristics revealed by the sequential subsidence rate over Beijing and Tianjin are described. Finally, conclusions and open problems are addressed in
Section 6.
2. SAR Image Stacks and Study Area
We aim to investigate the ground subsidence of the Beijing-Tianjin-Hebei region for a period of 22 years. No single SAR system can provide images over such a long epoch. SAR images from four satellites are used: ERS-1/2 SAR images acquired between 1992 and 2000; Envisat ASAR images acquired between 2003 and 2010 and RADARSAT-2 images acquired between 2012 and 2014. Unfortunately, there are still three-year and two-year gaps between the sequential SAR datasets.
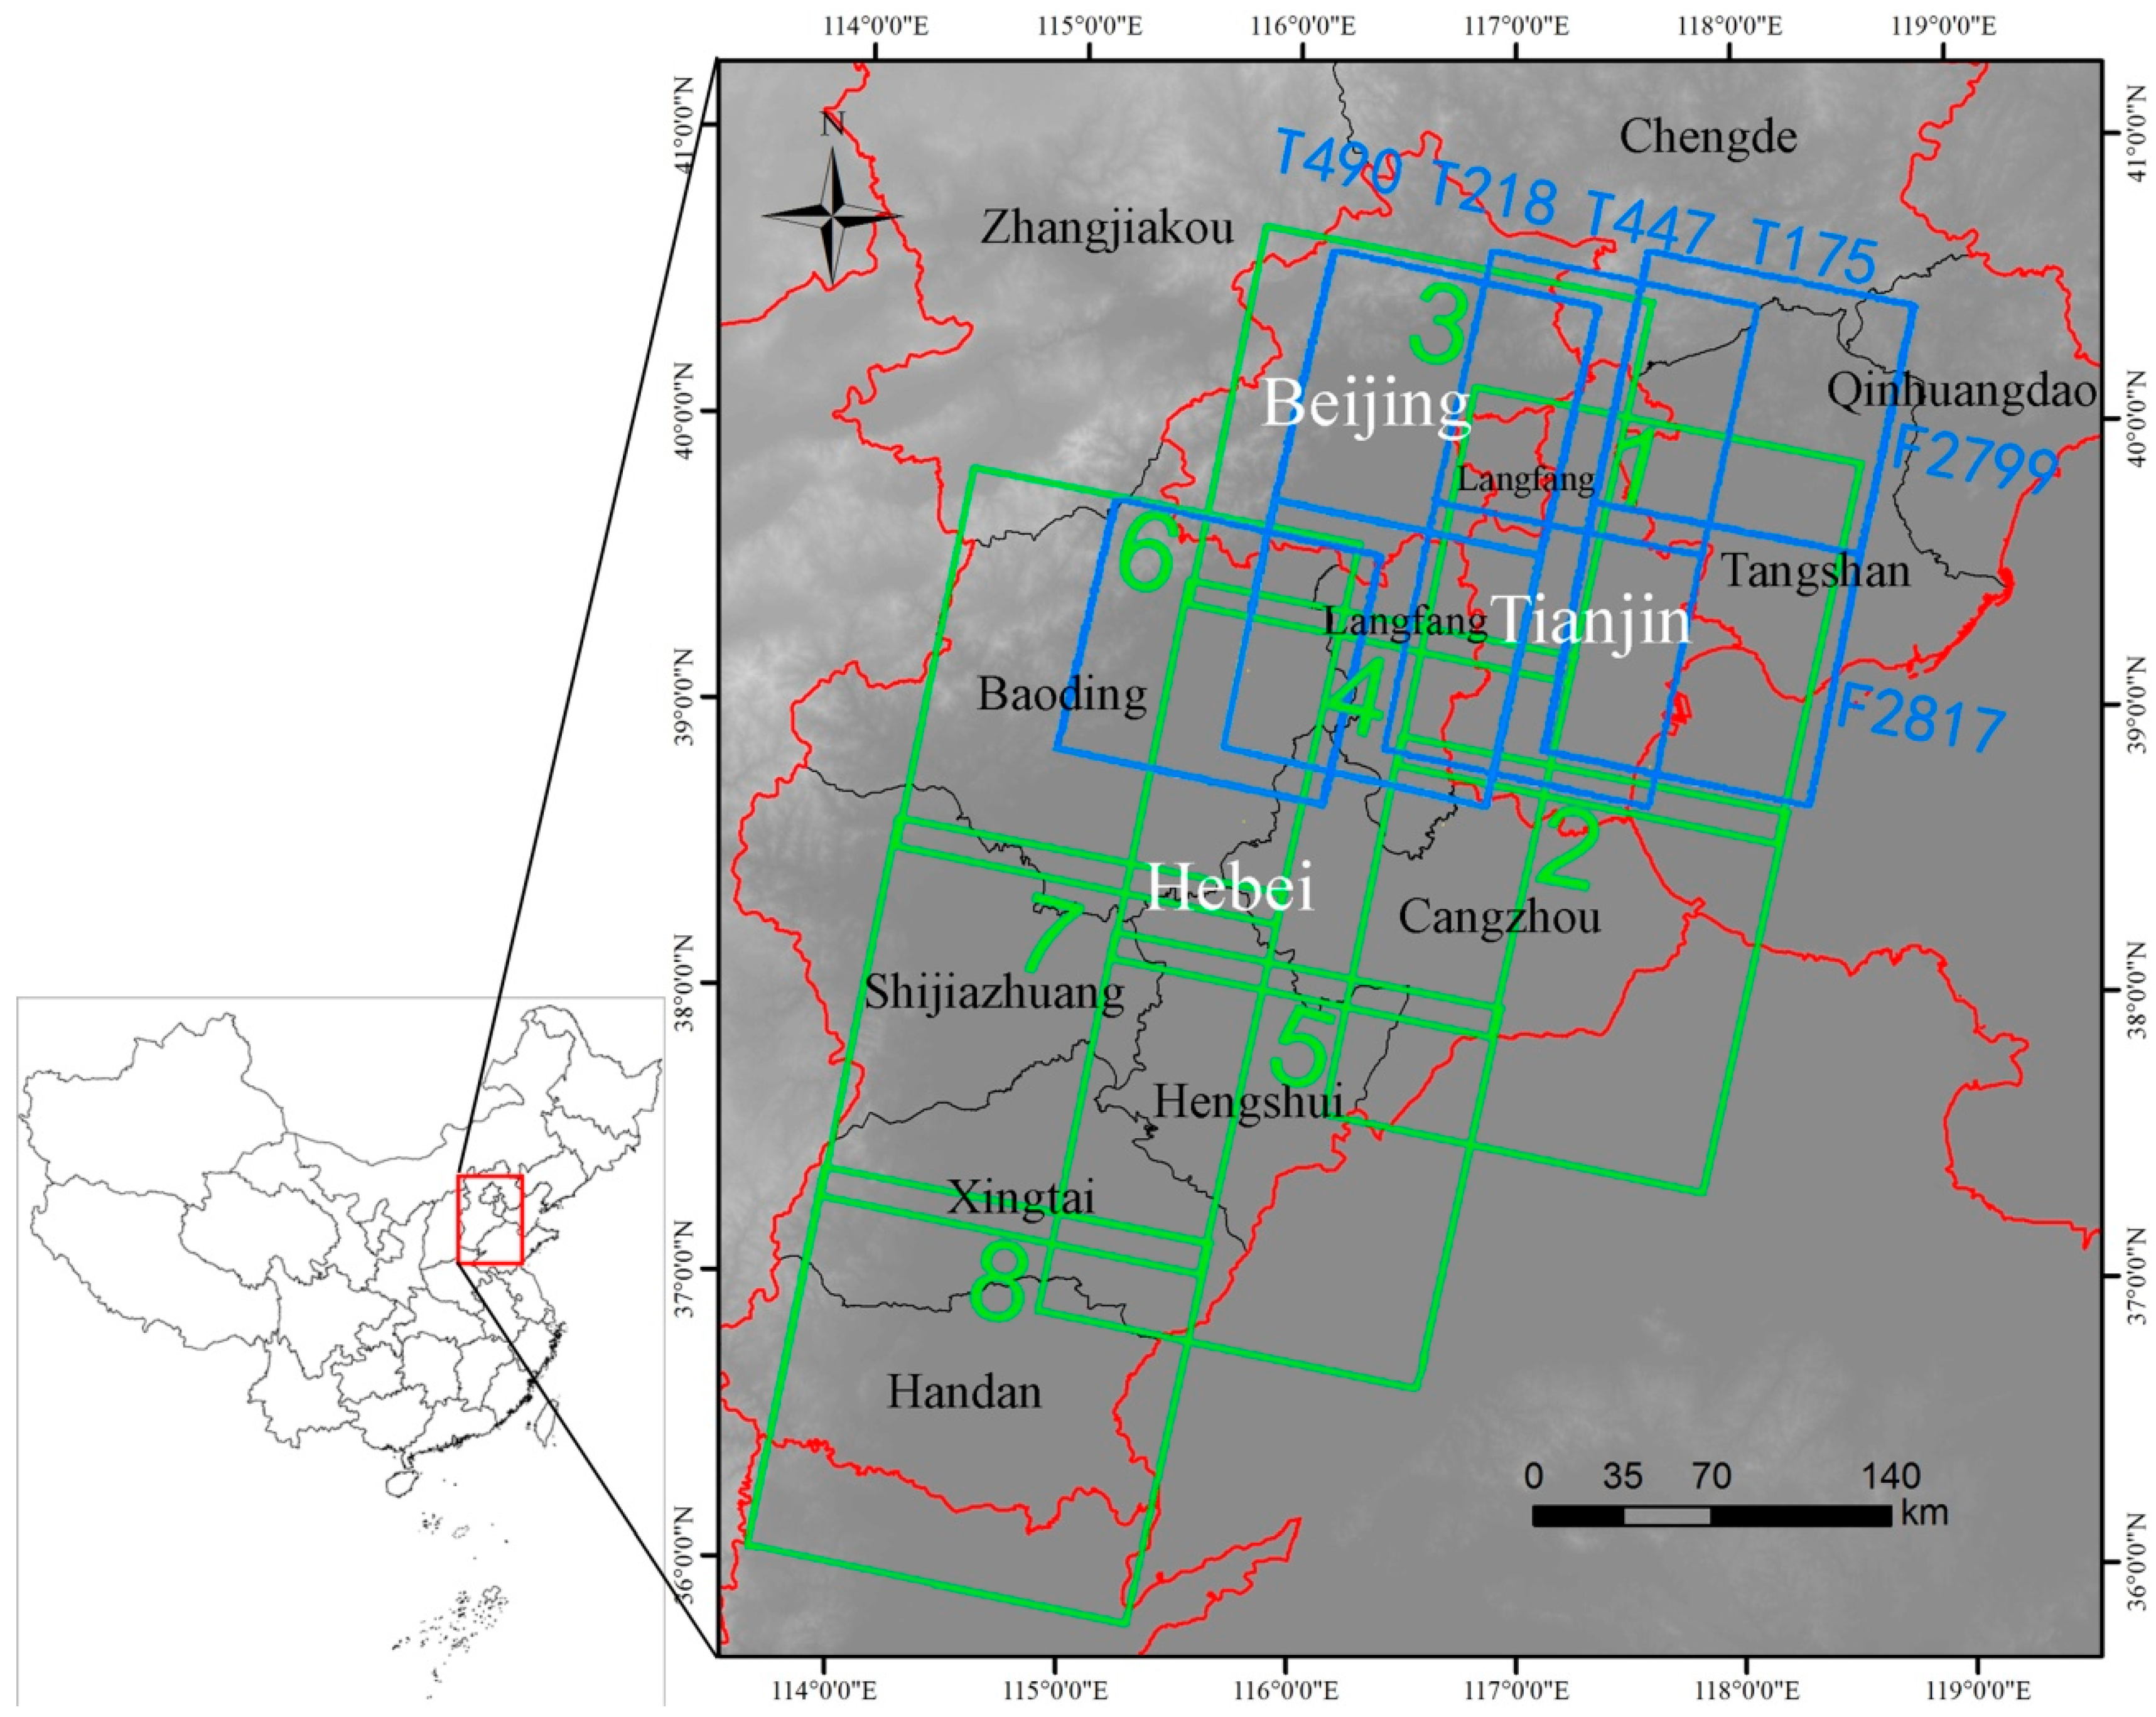
The plain area of the Beijing-Tianjin-Hebei region is targeted, because it has been confirmed that groundwater over-withdrawal is the main driving force of ground subsidence in this region and groundwater over-withdrawal mostly occurs in plain areas. Unfortunately, we could not obtain ERS and ENVISAT SAR images covering the south part of Hebei province. Therefore, for the period of 1992 to 2010, SAR images cover only the plain areas of Beijing, Tianjin, and Tangshan, Baoding and Langfang of Hebei province. For the period of 2012 to 2014, the whole plain area of the Beijing-Tianjin-Hebei region is covered by eight RADARSAT-2 wide mode frames. The study area and SAR coverages are shown in
Figure 1. The number of SAR images over each SAR frame, together with the acquisition time span of the time series of images, are listed in
Table 1 and
Table 2. We can see, the image stacks of ERS-1/2 are generally small, with the stack size less than 13 over 4 frames. The inadequacy causes difficulties in data processing and may result in less accurate deformation retrieval.
3. Methodology of Data Processing
An improved multiple InSAR method, which is entitled as “Multiple-master Coherent Target Small-Baseline InSAR” (MCTSB-InSAR), is developed to process time-series SAR images over a large area. The basic algorithms of MCTSB-InSAR are based on some classical multiple InSAR methods, like PS-InSAR [
5,
6], that presented in [
23] and the PSP method in [
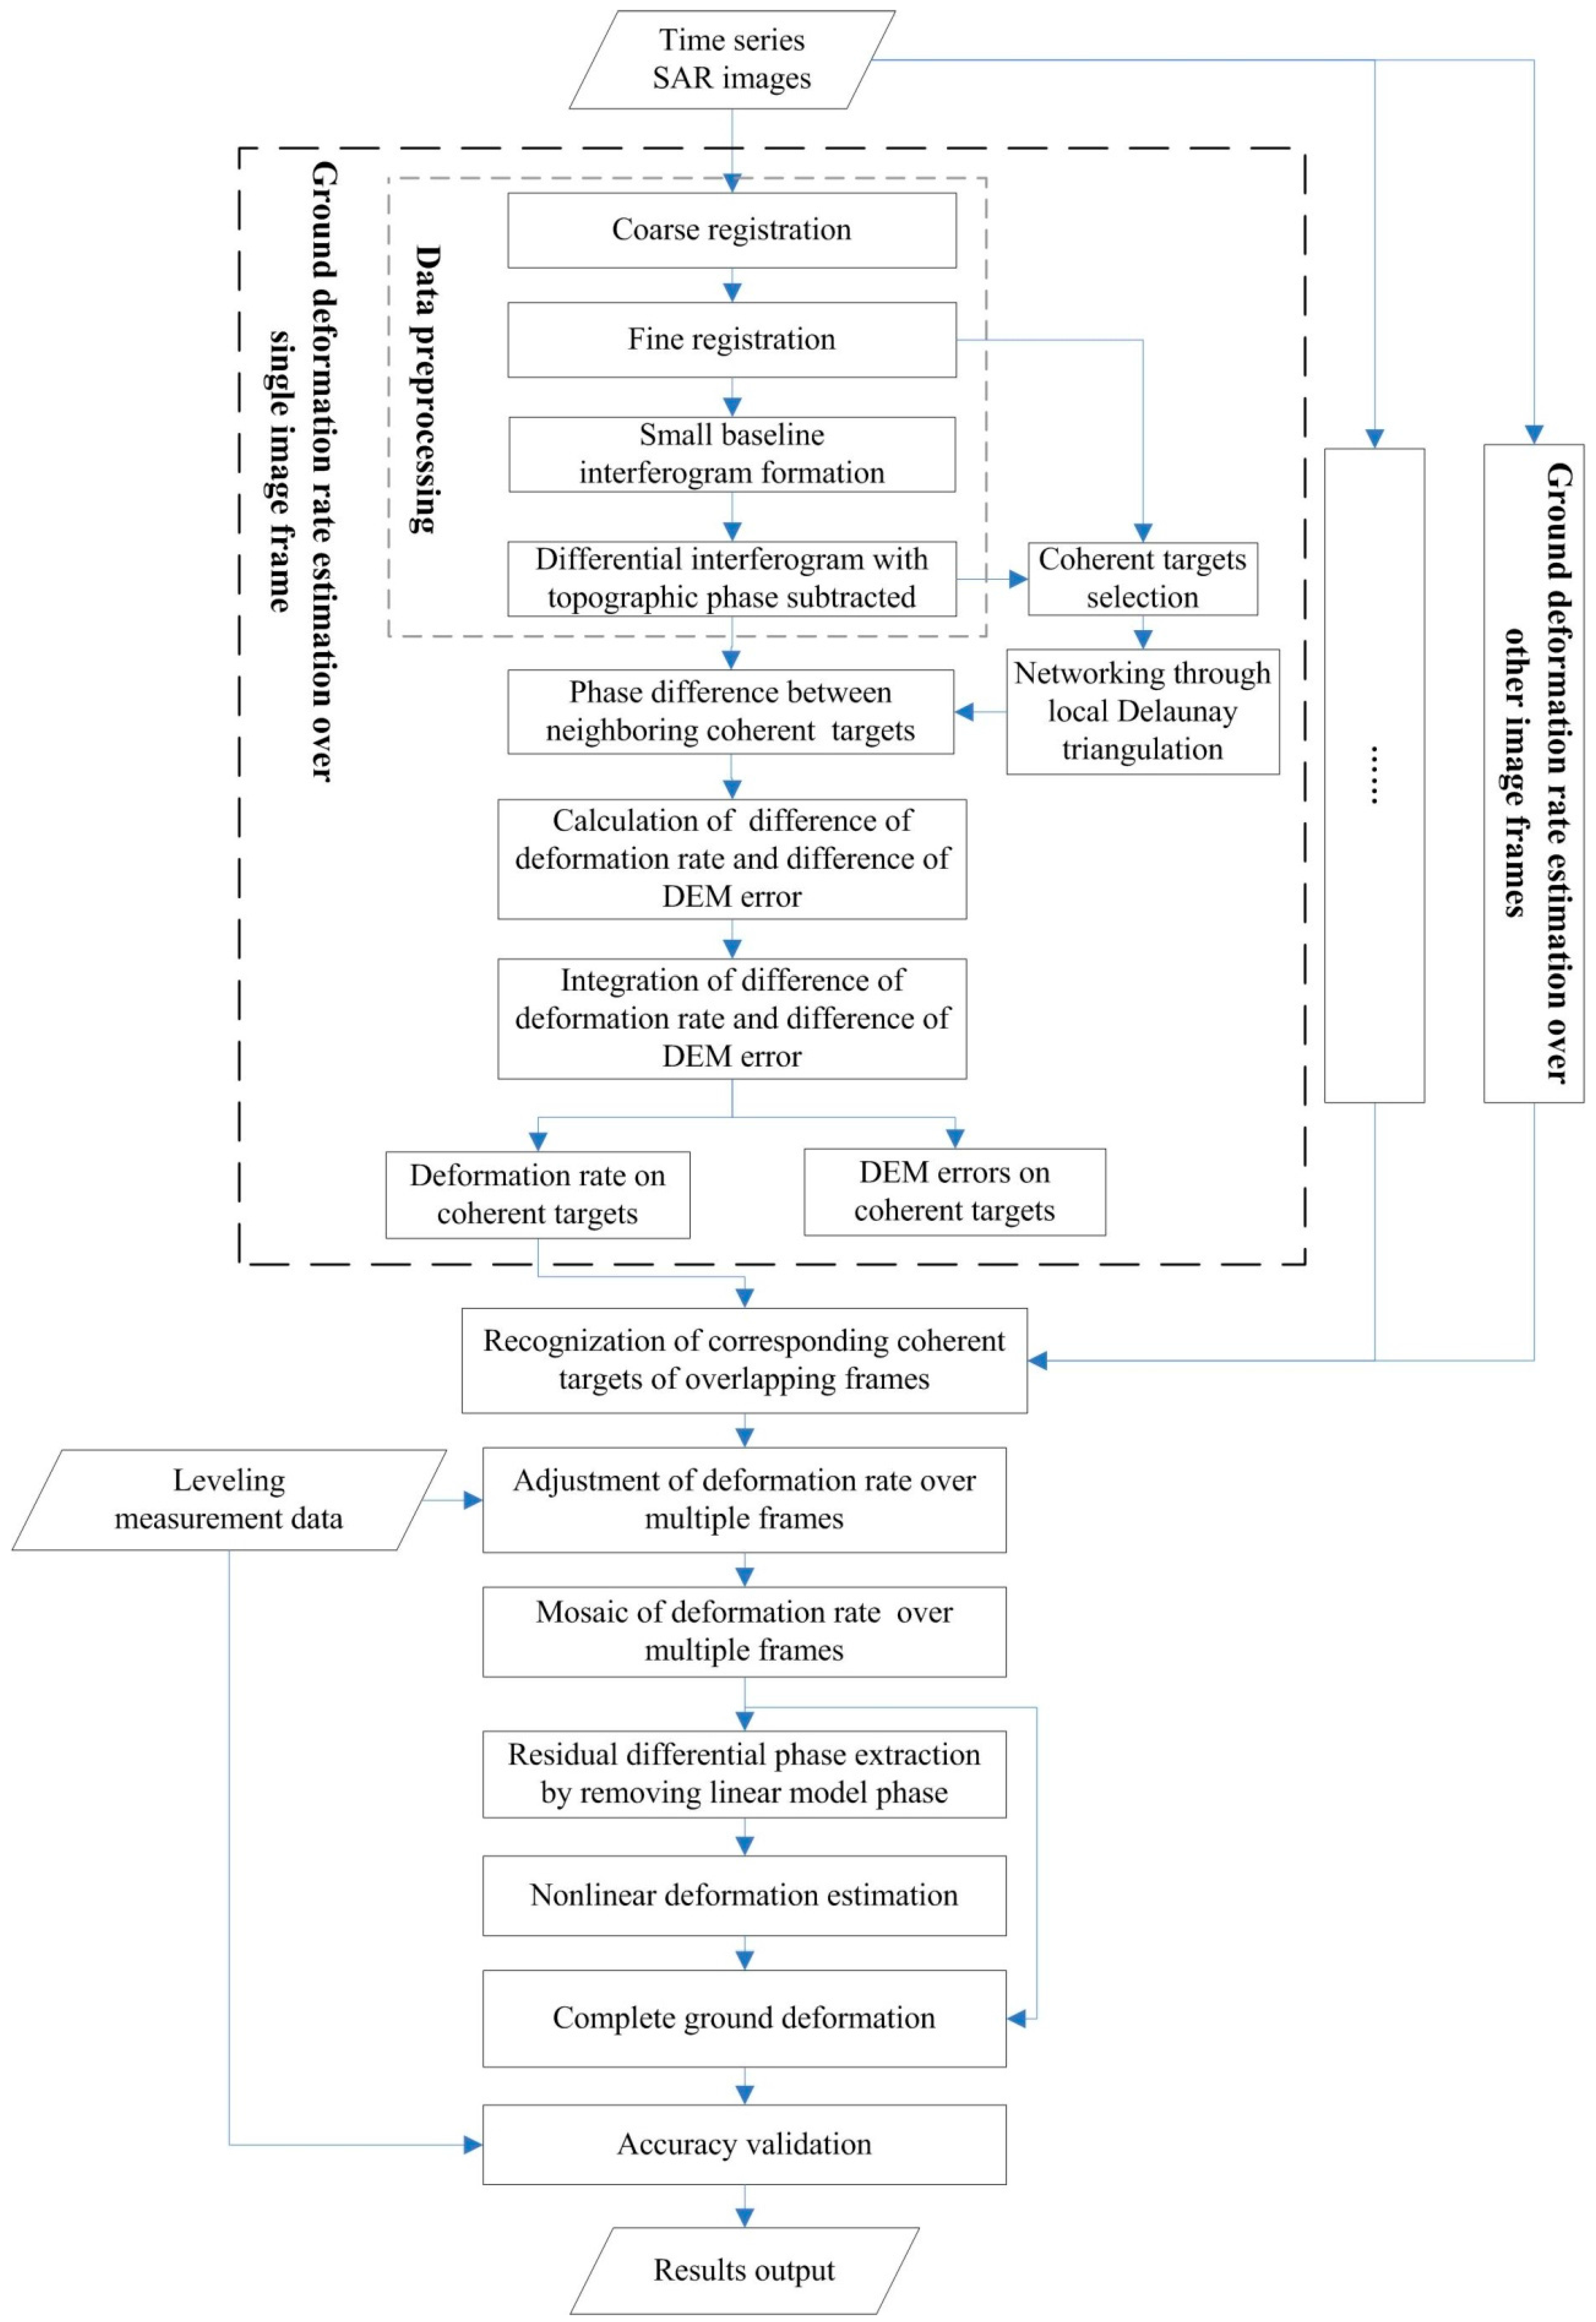
24]. The general processing flowchart for deformation mapping over large area using the MCTSB-InSAR method is shown in
Figure 2. When dealing with large area consisting of several SAR frames, the deformation over a single SAR frame is estimated first. Then, an adjustment process is employed to harmonize the deformation of overlapping frames, so that a deformation mosaic of the whole area can be generated. The adjustment process will be described in detail later. Some key steps of the method are overviewed in the paragraphs followed.
In the step of interferogram formation, interferograms with spatial baseline and temporal separation within specified thresholds are selected, not limited to one common master image. This is helpful when dealing with small dataset, like the ERS-1/2 stacks over those four frames in this research. The coherent targets include two kinds of pixels. The first type is those pixels characterized by point scatterers whose amplitude keeps stable over temporal acquisitions. These pixels are extracted by thresholding the dispersion index defined by Ferretti et al. [
6]. The other type is those pixels associated with stable distributed targets which can be extracted by checking the mean coherence of the formed interferograms [
23]. These two groups of pixels are then united and form the coherent target candidates over which the rest processing is conducted.
Similar with the PS-InSAR and the PSP method [
24], the phase difference between two neighboring coherent targets are considered in MCTSB-InSAR. Therefore the coherent targets have to be networked firstly. The Delaunay triangulation has been widely employed in many multiple InSAR processing. However, the network generated by Delaunay triangulation is not robust [
25]. MCTSB-InSAR adopts the local Delaunay triangulation proposed by Zhang et al. [
26] which places small overlapping and regular patches over the entire study area, and then connects the coherent targets within each patch using Delaunay triangulation. The local Delaunay triangulation performs well in balancing the robustness and redundancy of connections. The final density of the arcs generated by local Delaunay triangulation can be controlled by setting the size of the patch and the overlapping rate of two adjoining patches.
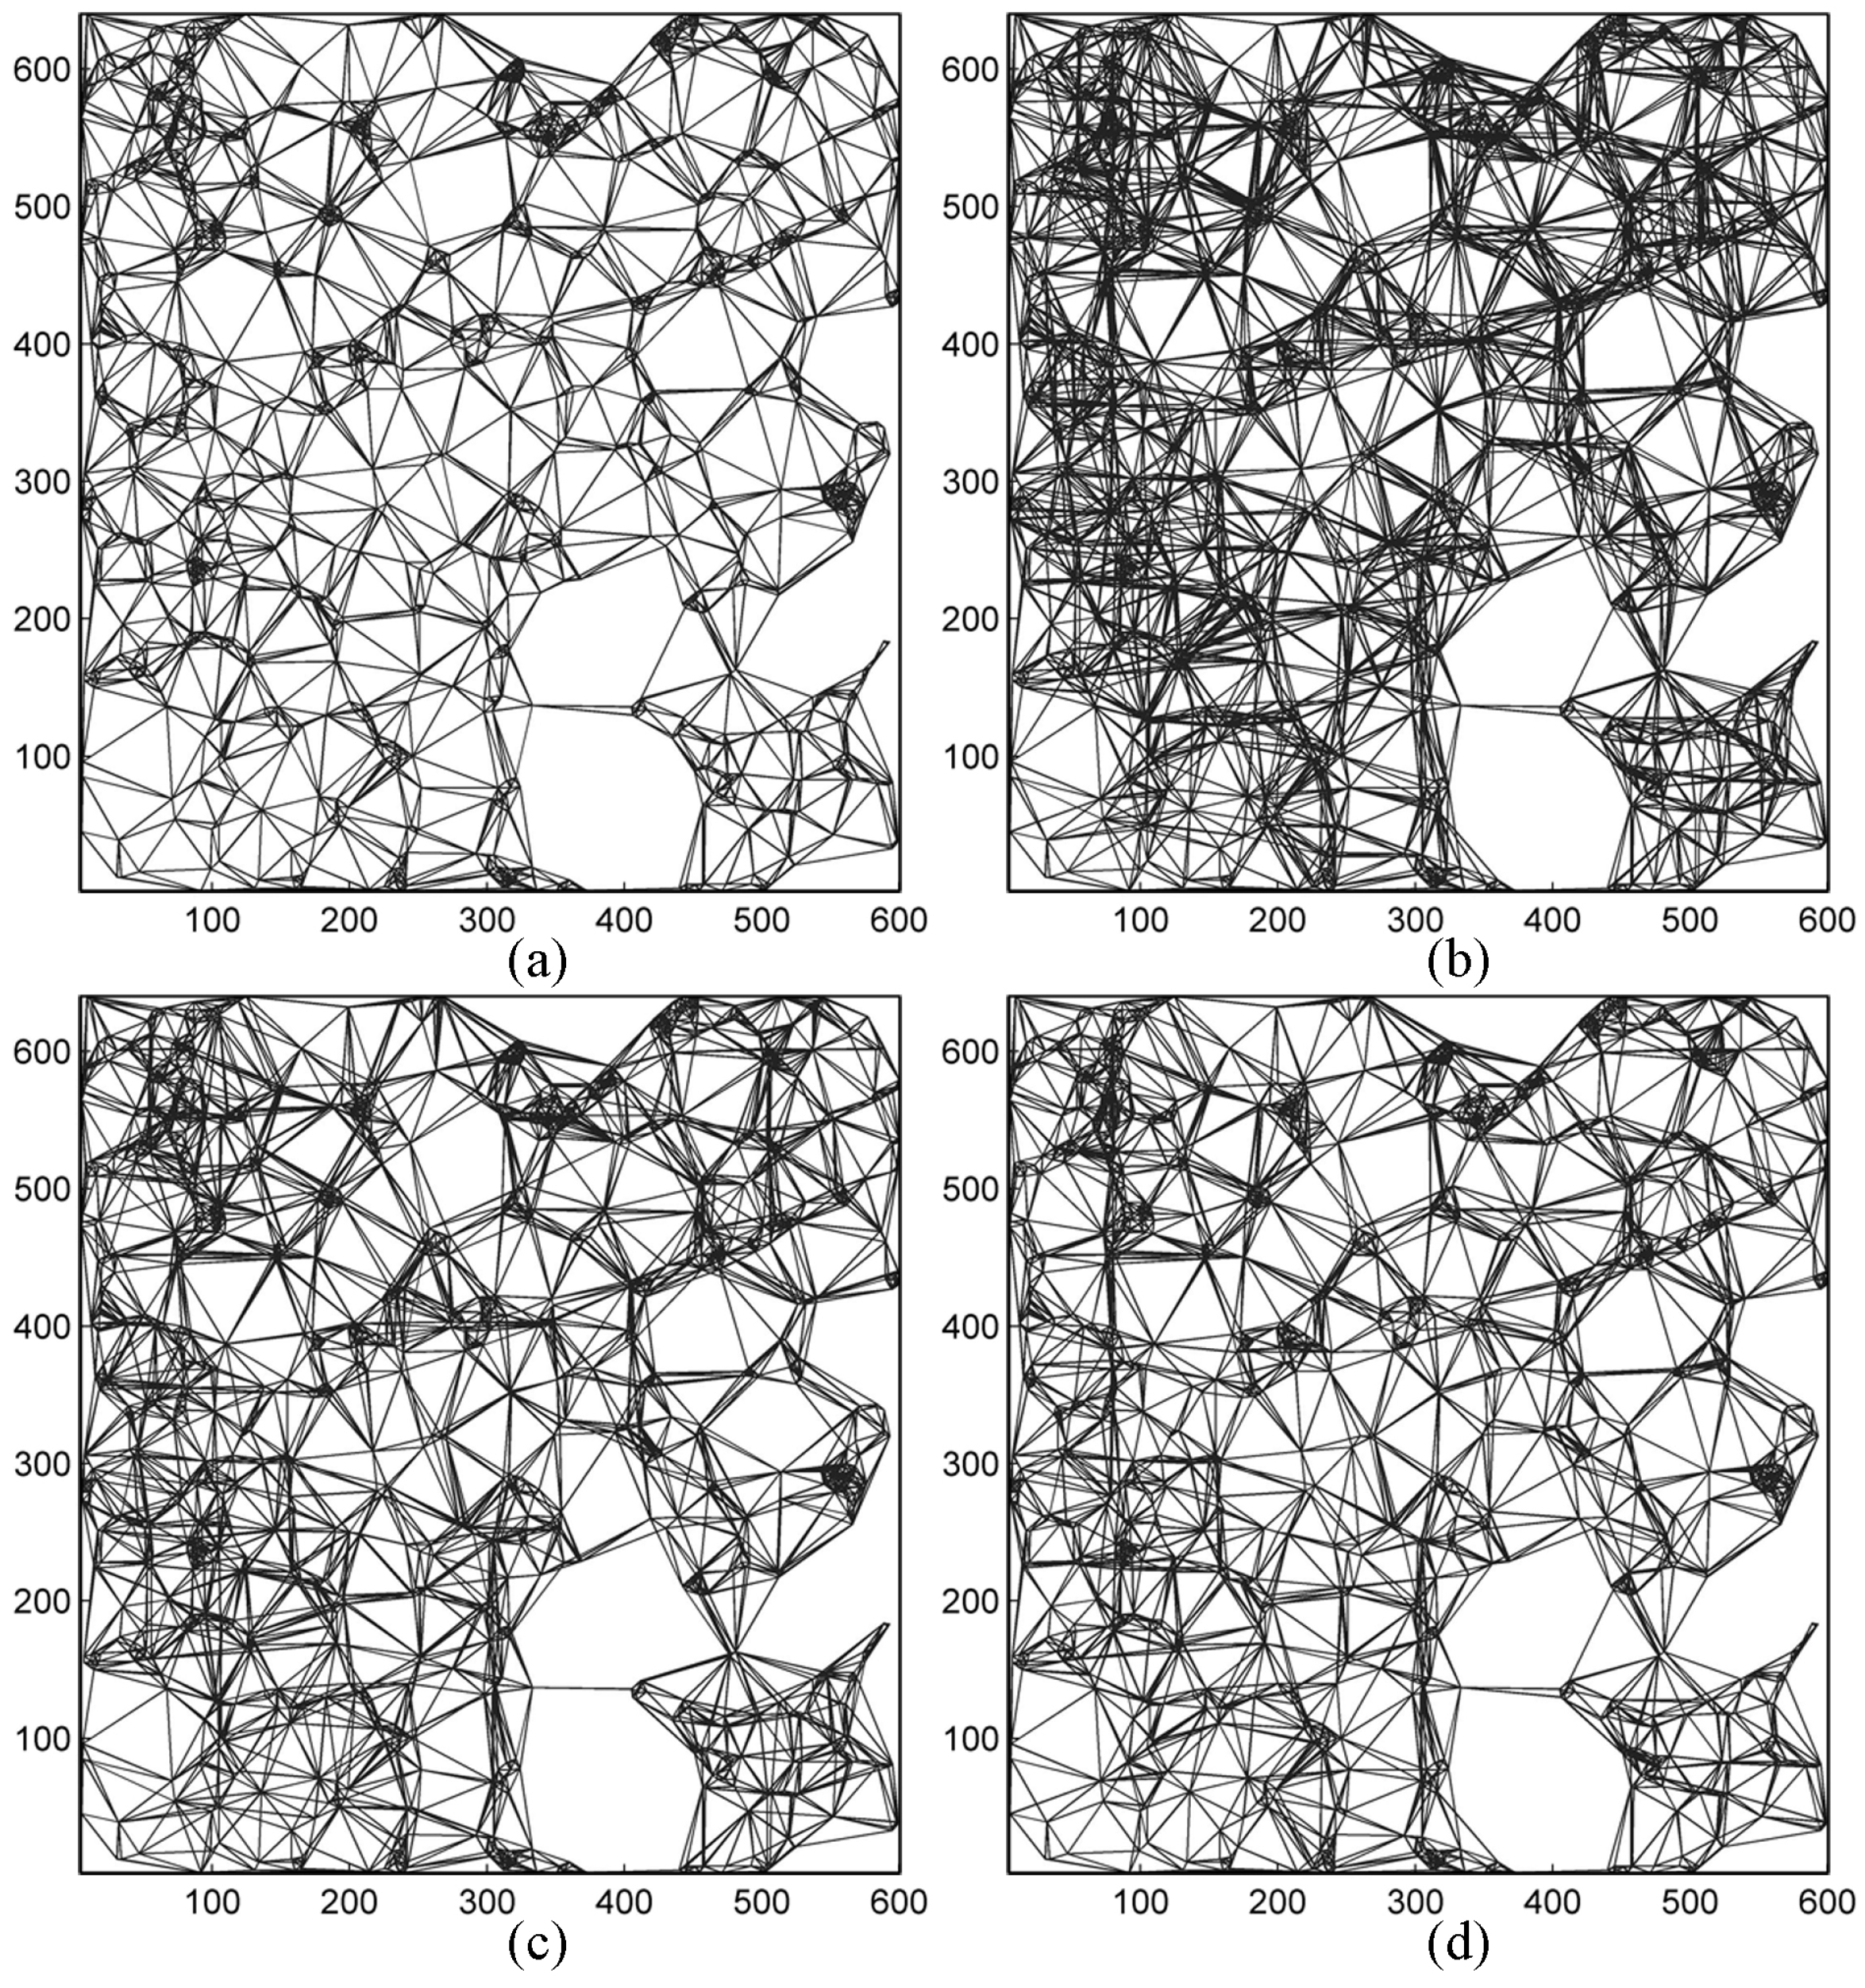
Figure 3 shows the performance of networking with Delaunay triangulation and with local Delaunay triangulation over an image subset consisting of 640 pixels in a row (about 12.8 km) and 600 pixels in a column (about 12.0 km) and 3363 coherent targets. The number of arcs generated by Delaunay triangulation is 9959, sparser than any of the three connections from local Delaunay triangulation. Generally, we will obtain dense connections if the patch size is small and the overlapping rate is high. Of course, to keep atmospheric phase cancelable along an arc, only arcs shorter than a threshold (1.2 km in this research) are kept.
Currently, the linear deformation model is used in MCTSB-InSAR for large area monitoring, that is, the main part of deformation is represented by a linear process with fixed rate, and the residual deformation is expressed as a non-linear process. More complicated deformation models such as high-order polynomial might be applicable for small region, but will cause problems in generating a mosaic of derived deformation for a large area consisting of several SAR frames. Under linear deformation assumption, the interferometric phase of the
ith coherent target in the
kth interferogram (The interferogram here is a differential interferogram with topographic phase having been subtracted using a DEM) is
where
denotes phase wrapping operator,
and
are the perpendicular baseline and the temporal separation of the interferogram respectively,
is the DEM error,
is the linear deformation rate,
is the phase associated with non-linear deformation,
is the phase caused by atmospheric artifacts, and
the phase accounting for noise,
and
are known coefficients. Consequently, the phase difference between two neighboring coherent targets along an arc can be expressed as
where
and
denote the difference of deformation rate and difference of DEM error between the two targets
and
, the residual phase
is the summation of atmospheric phase difference, noise phase difference and non-linear phase difference over the two targets. For each arc, we will form a set of equations like (2) with each corresponding to an interferogram. The unknown variables of the equation set, namely
and
, can be solved using the periodogram [
5] or 2-D searching algorithm [
27]. After all arcs in the network are processed, the absolute values of the linear deformation rate
and DEM error
for each coherent target can be calculated through an integration process.
After the deformation rate over every single SAR frame has been estimated, an adjustment process is employed to harmonize the deformation estimates from overlapping frames, which is a unique feature of the MCTSB-InSAR method, and has seldom been discussed by other multiple InSAR methods yet. Here only the adjustment of deformation rate is concerned. Accumulative deformations are difficult to be mosaicked, because the time span of SAR images over different tracks are usually different. Before the adjustment, the corresponding coherent targets from overlapping frames have to be recognized. This can be done easily on the basis of geocoded images. The underlying principle is that the geographic coordinates of two corresponding coherent targets should be similar, that is, the difference of their coordinates should be smaller than the grid size of geocoding. The adjustment is to estimate an offset adding to the calculated deformation rate for a frame, so that the adjusted deformation rate over corresponding coherent targets within overlapped area of neighboring frames is identical. This forms the first category of adjustment equations, which has the following form
where
and
are InSAR-derived deformation rate over a corresponding coherence target at position
from overlapped frame
and
,
and
are the unknown offset of deformation rate. On the other hand, the deformation rate calculated from leveling and/or GPS measurements can be used as reference of the adjustment. Especially, the adjusted deformation rate should be equal to that calculated from the reference data, which forms the second category of adjustment equations and has the following form
where
denotes deformation rate calculated from leveling and/or GPS measurements. The two groups of equations join together and form an over-determined linear system with the offset attached to every overlapped frame as unknown variables. Obviously, these unknowns can be solved under the least mean square criterion. Finally, a deformation rate mosaic is formed by averaging the adjusted deformation rates of overlapping frames. The adjustment process is powerful in large area monitoring. It provides an integrated solution for both calibration of InSAR-derived deformation rate for every frame and the harmonization of the deformation rates from overlapping frames.
Once the linear deformation rate is determined, the nonlinear deformation is estimated by temporal and spatial filtering of the residual phase. More information about nonlinear deformation estimation can be found in [
5,
23].
4. Result and Accuracy
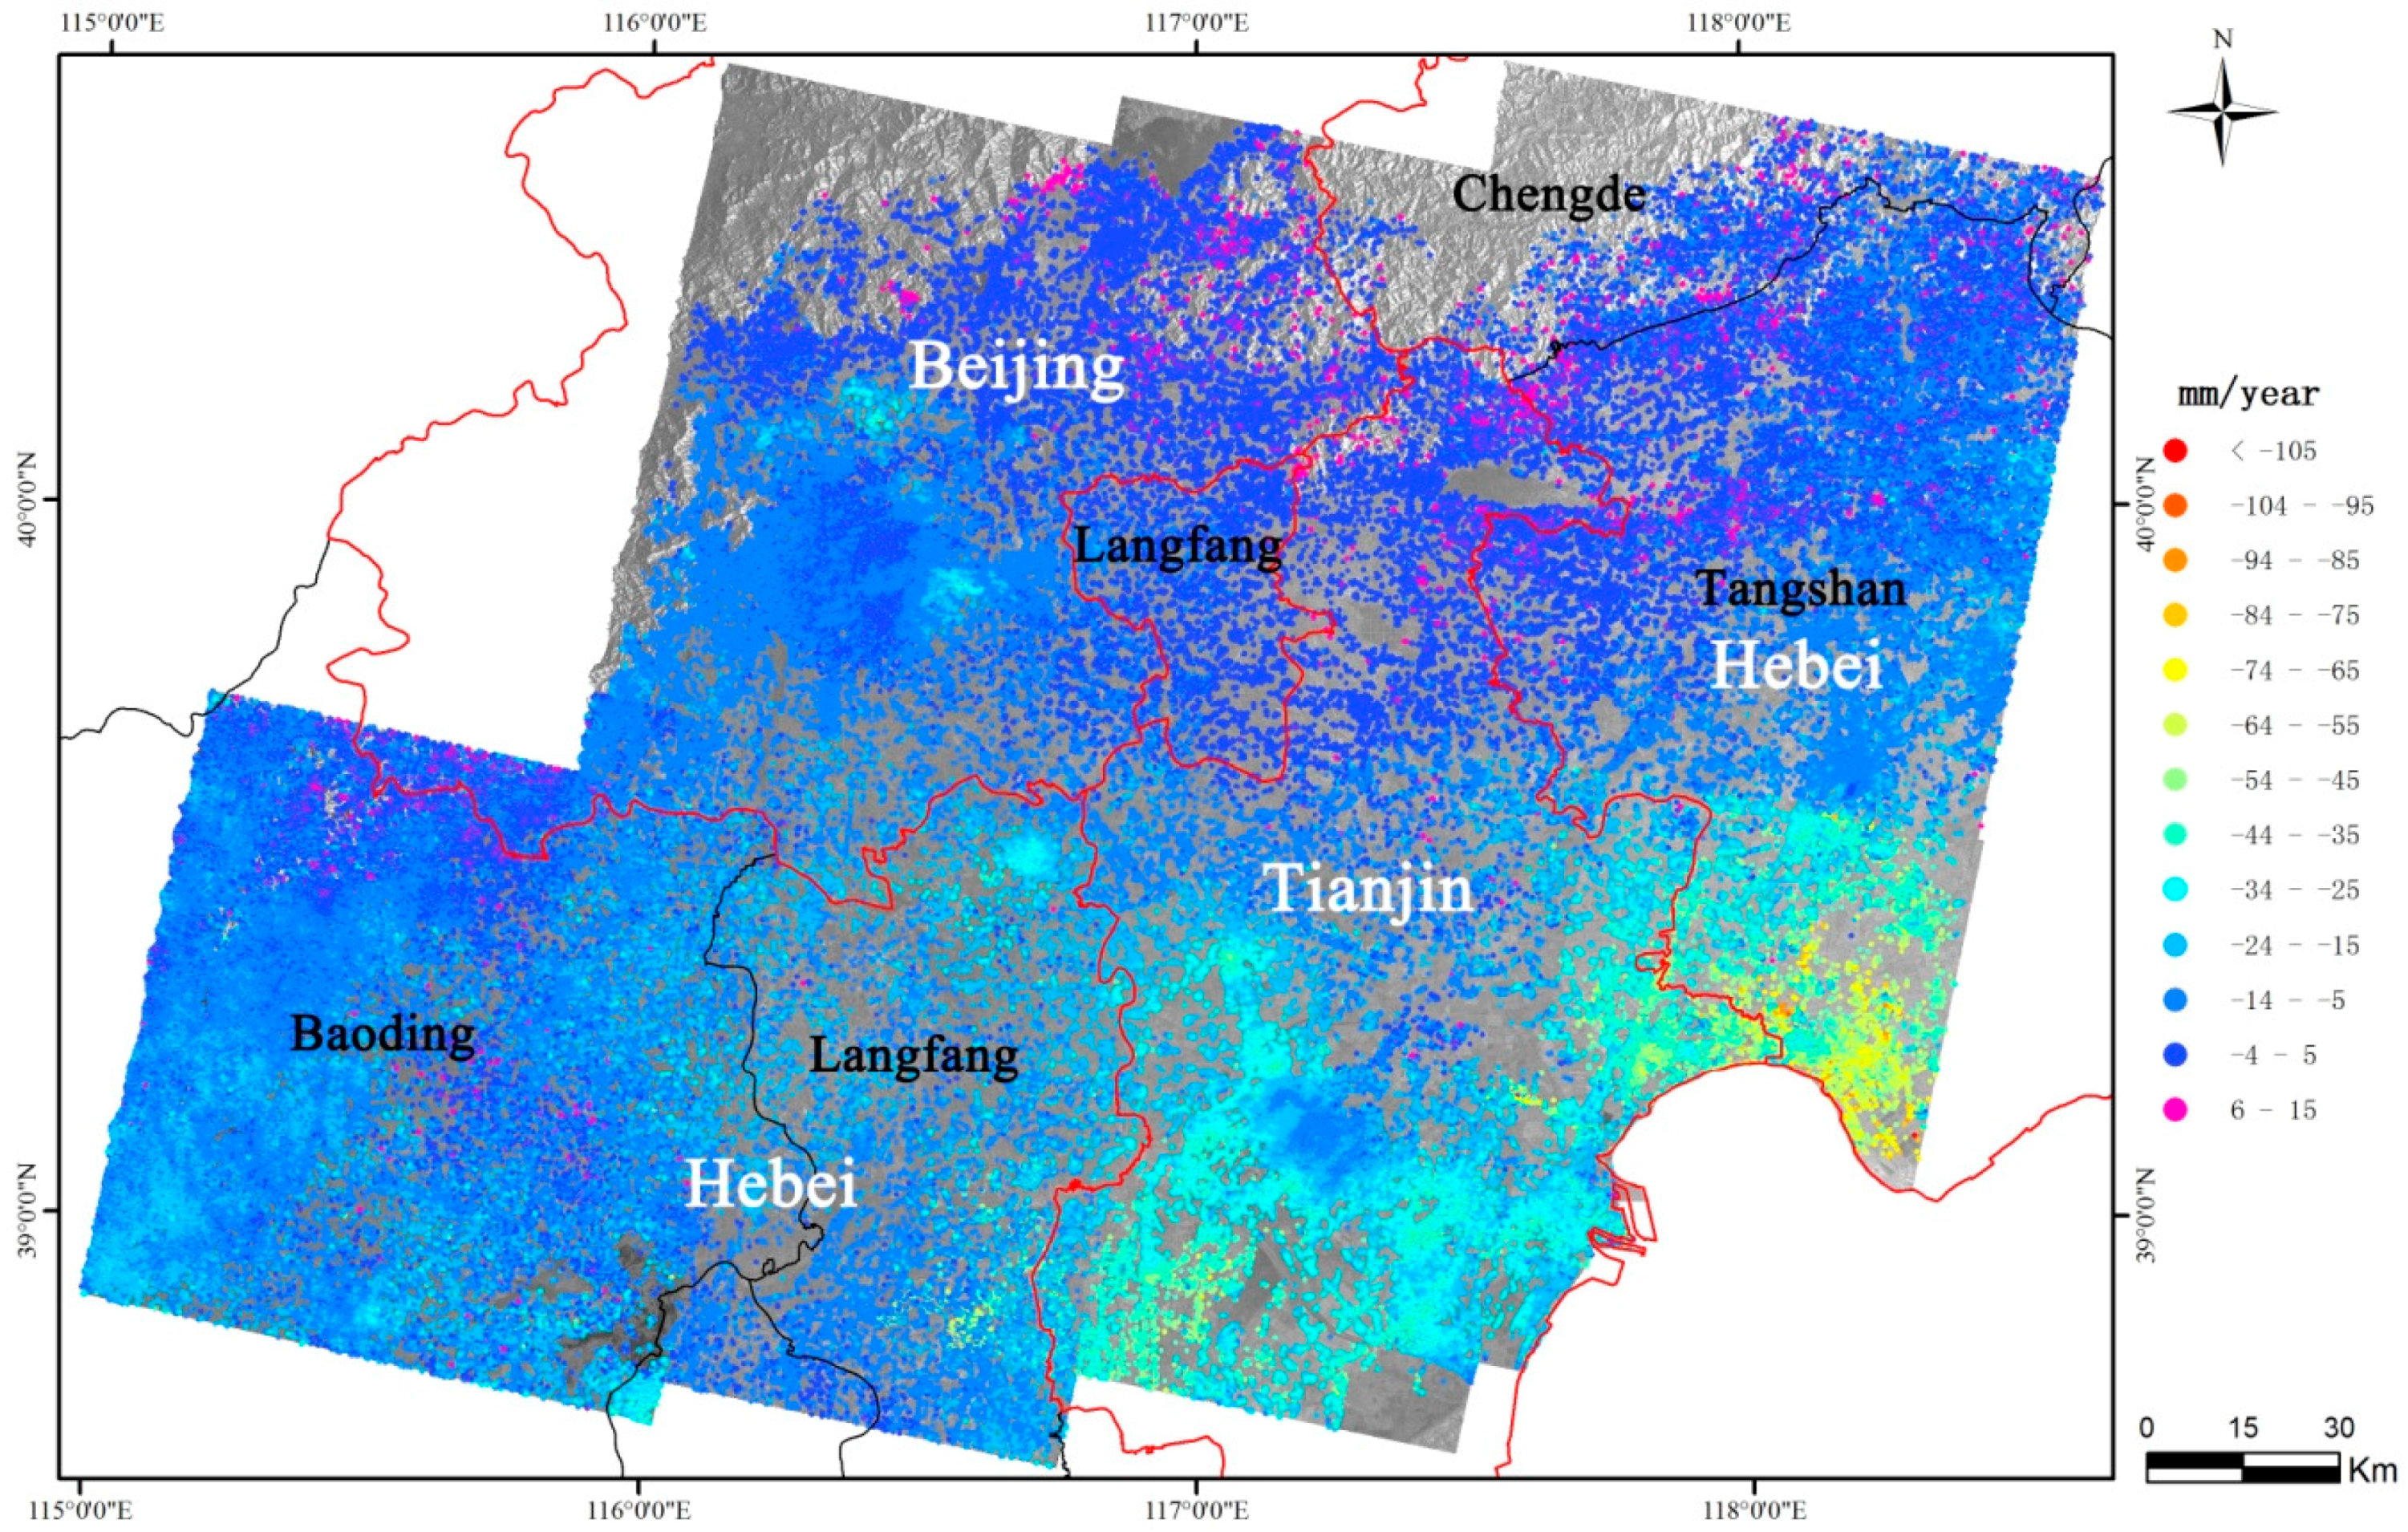
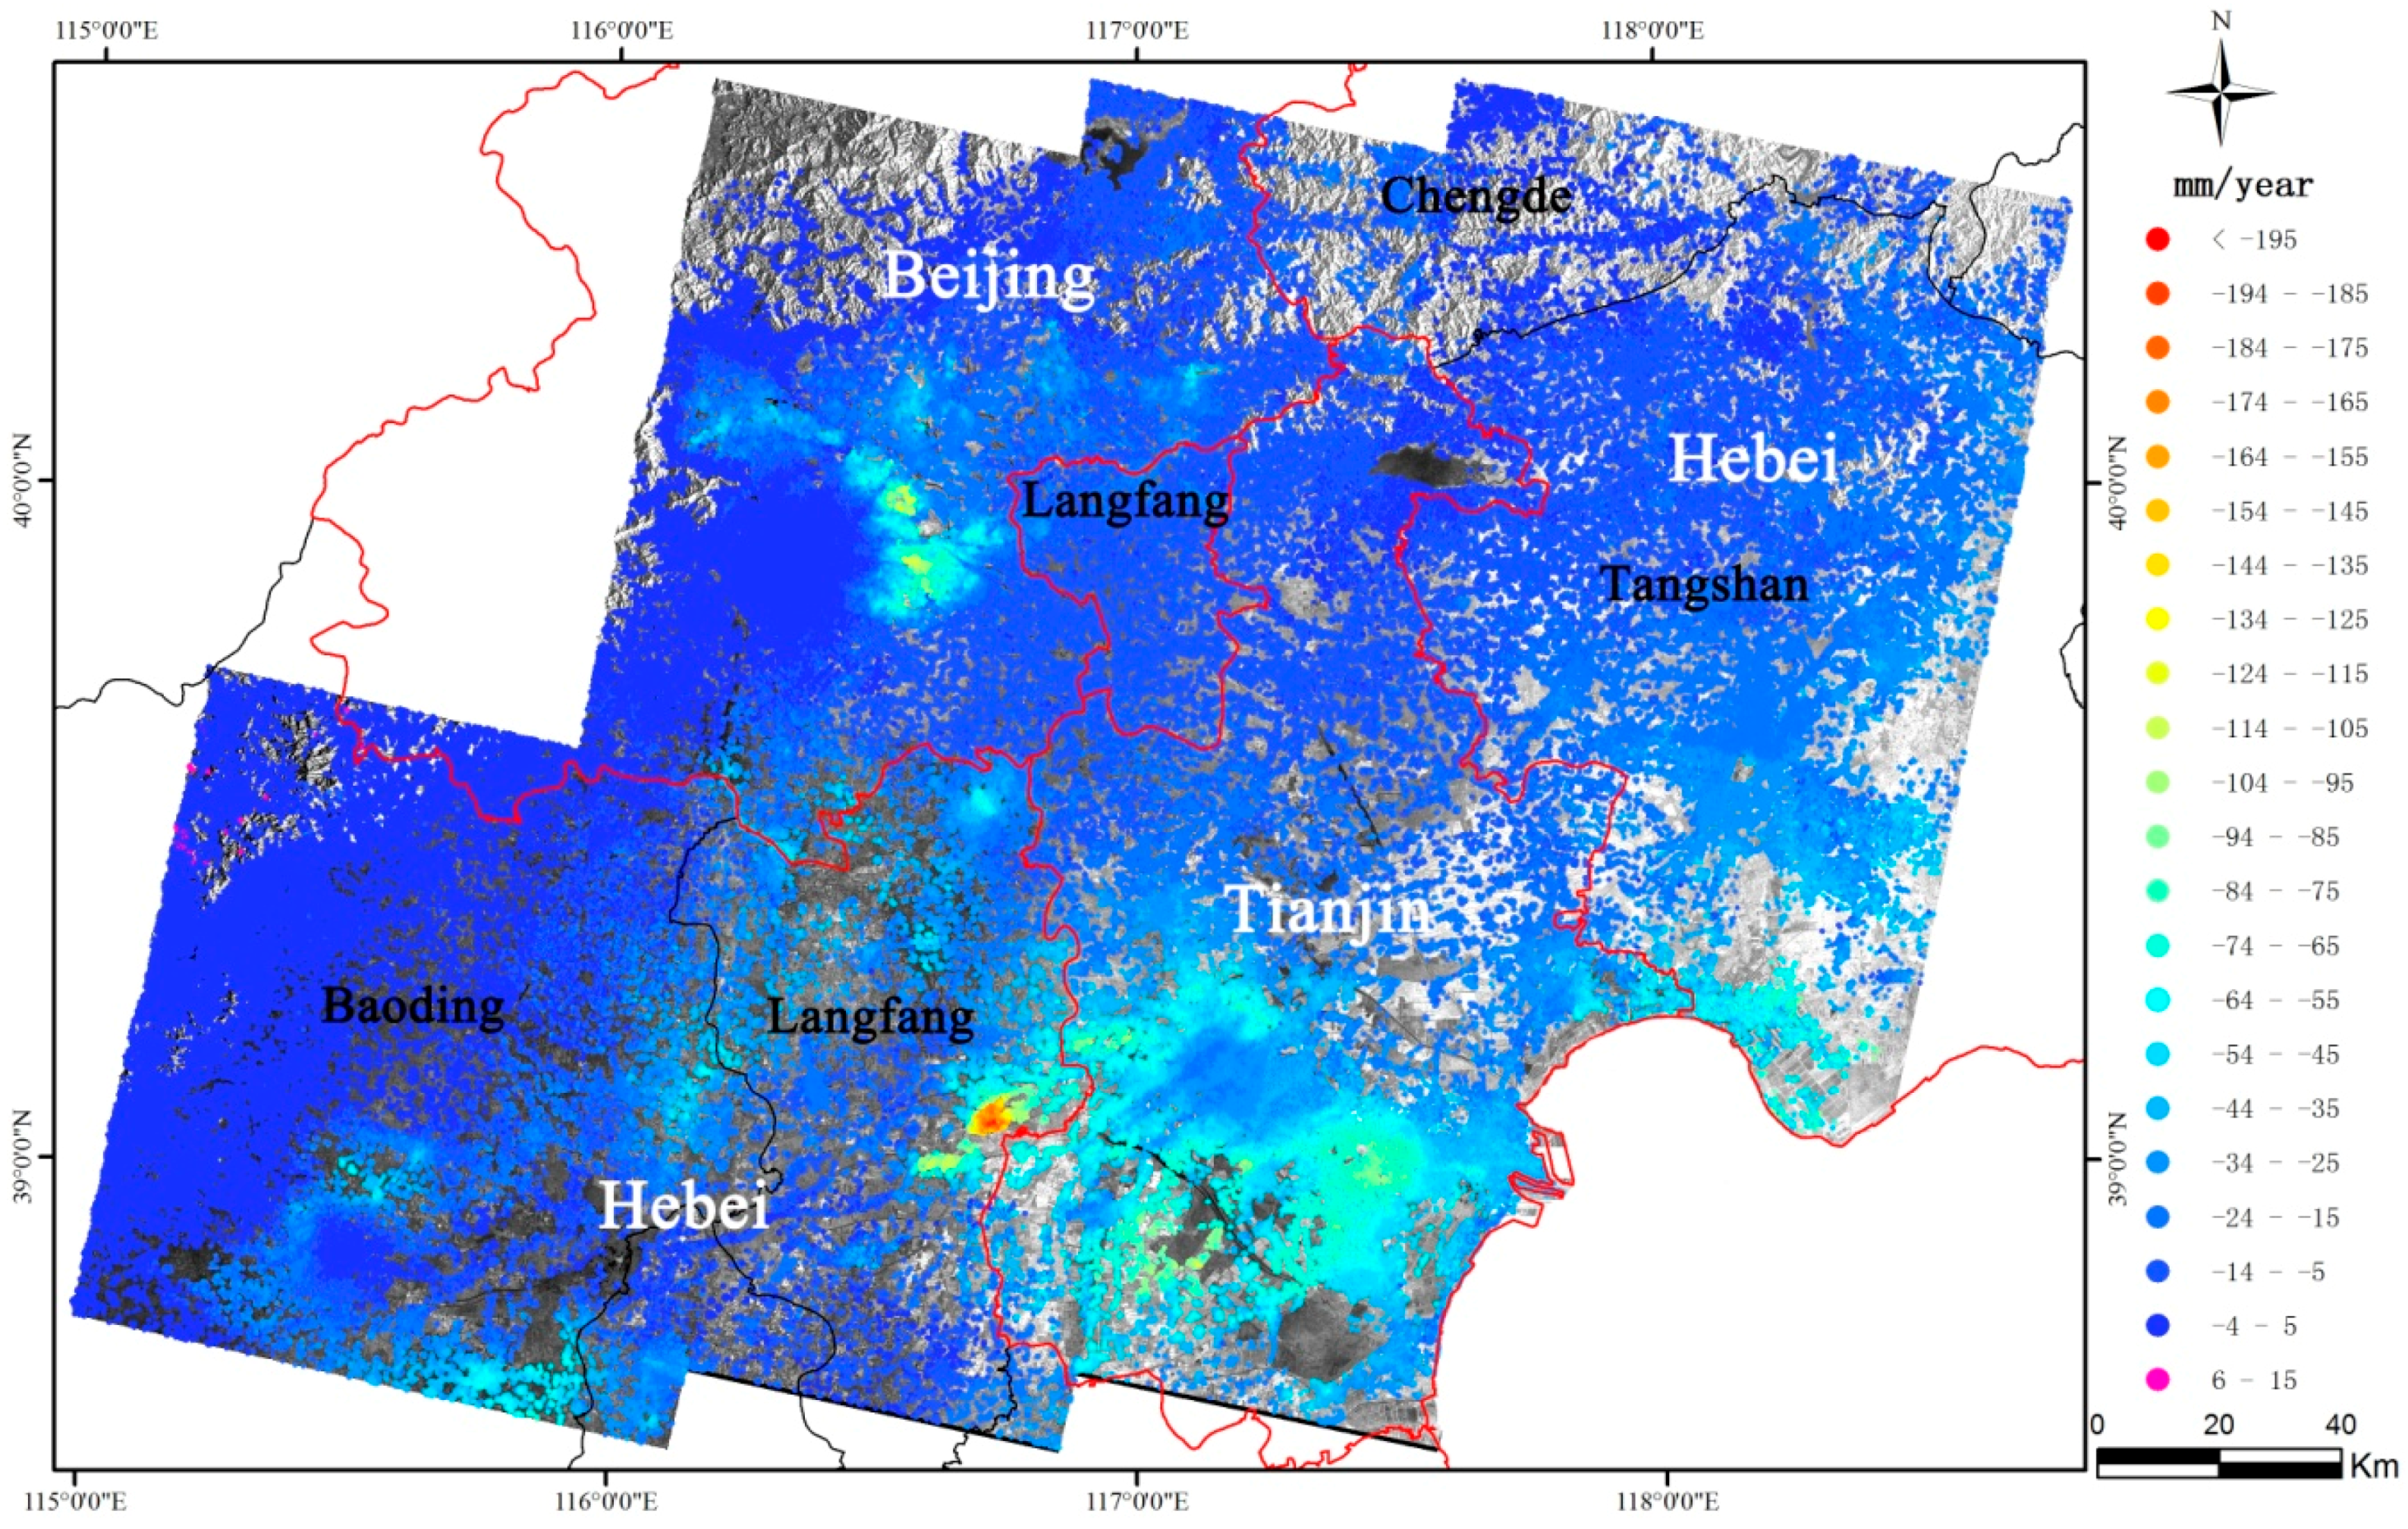
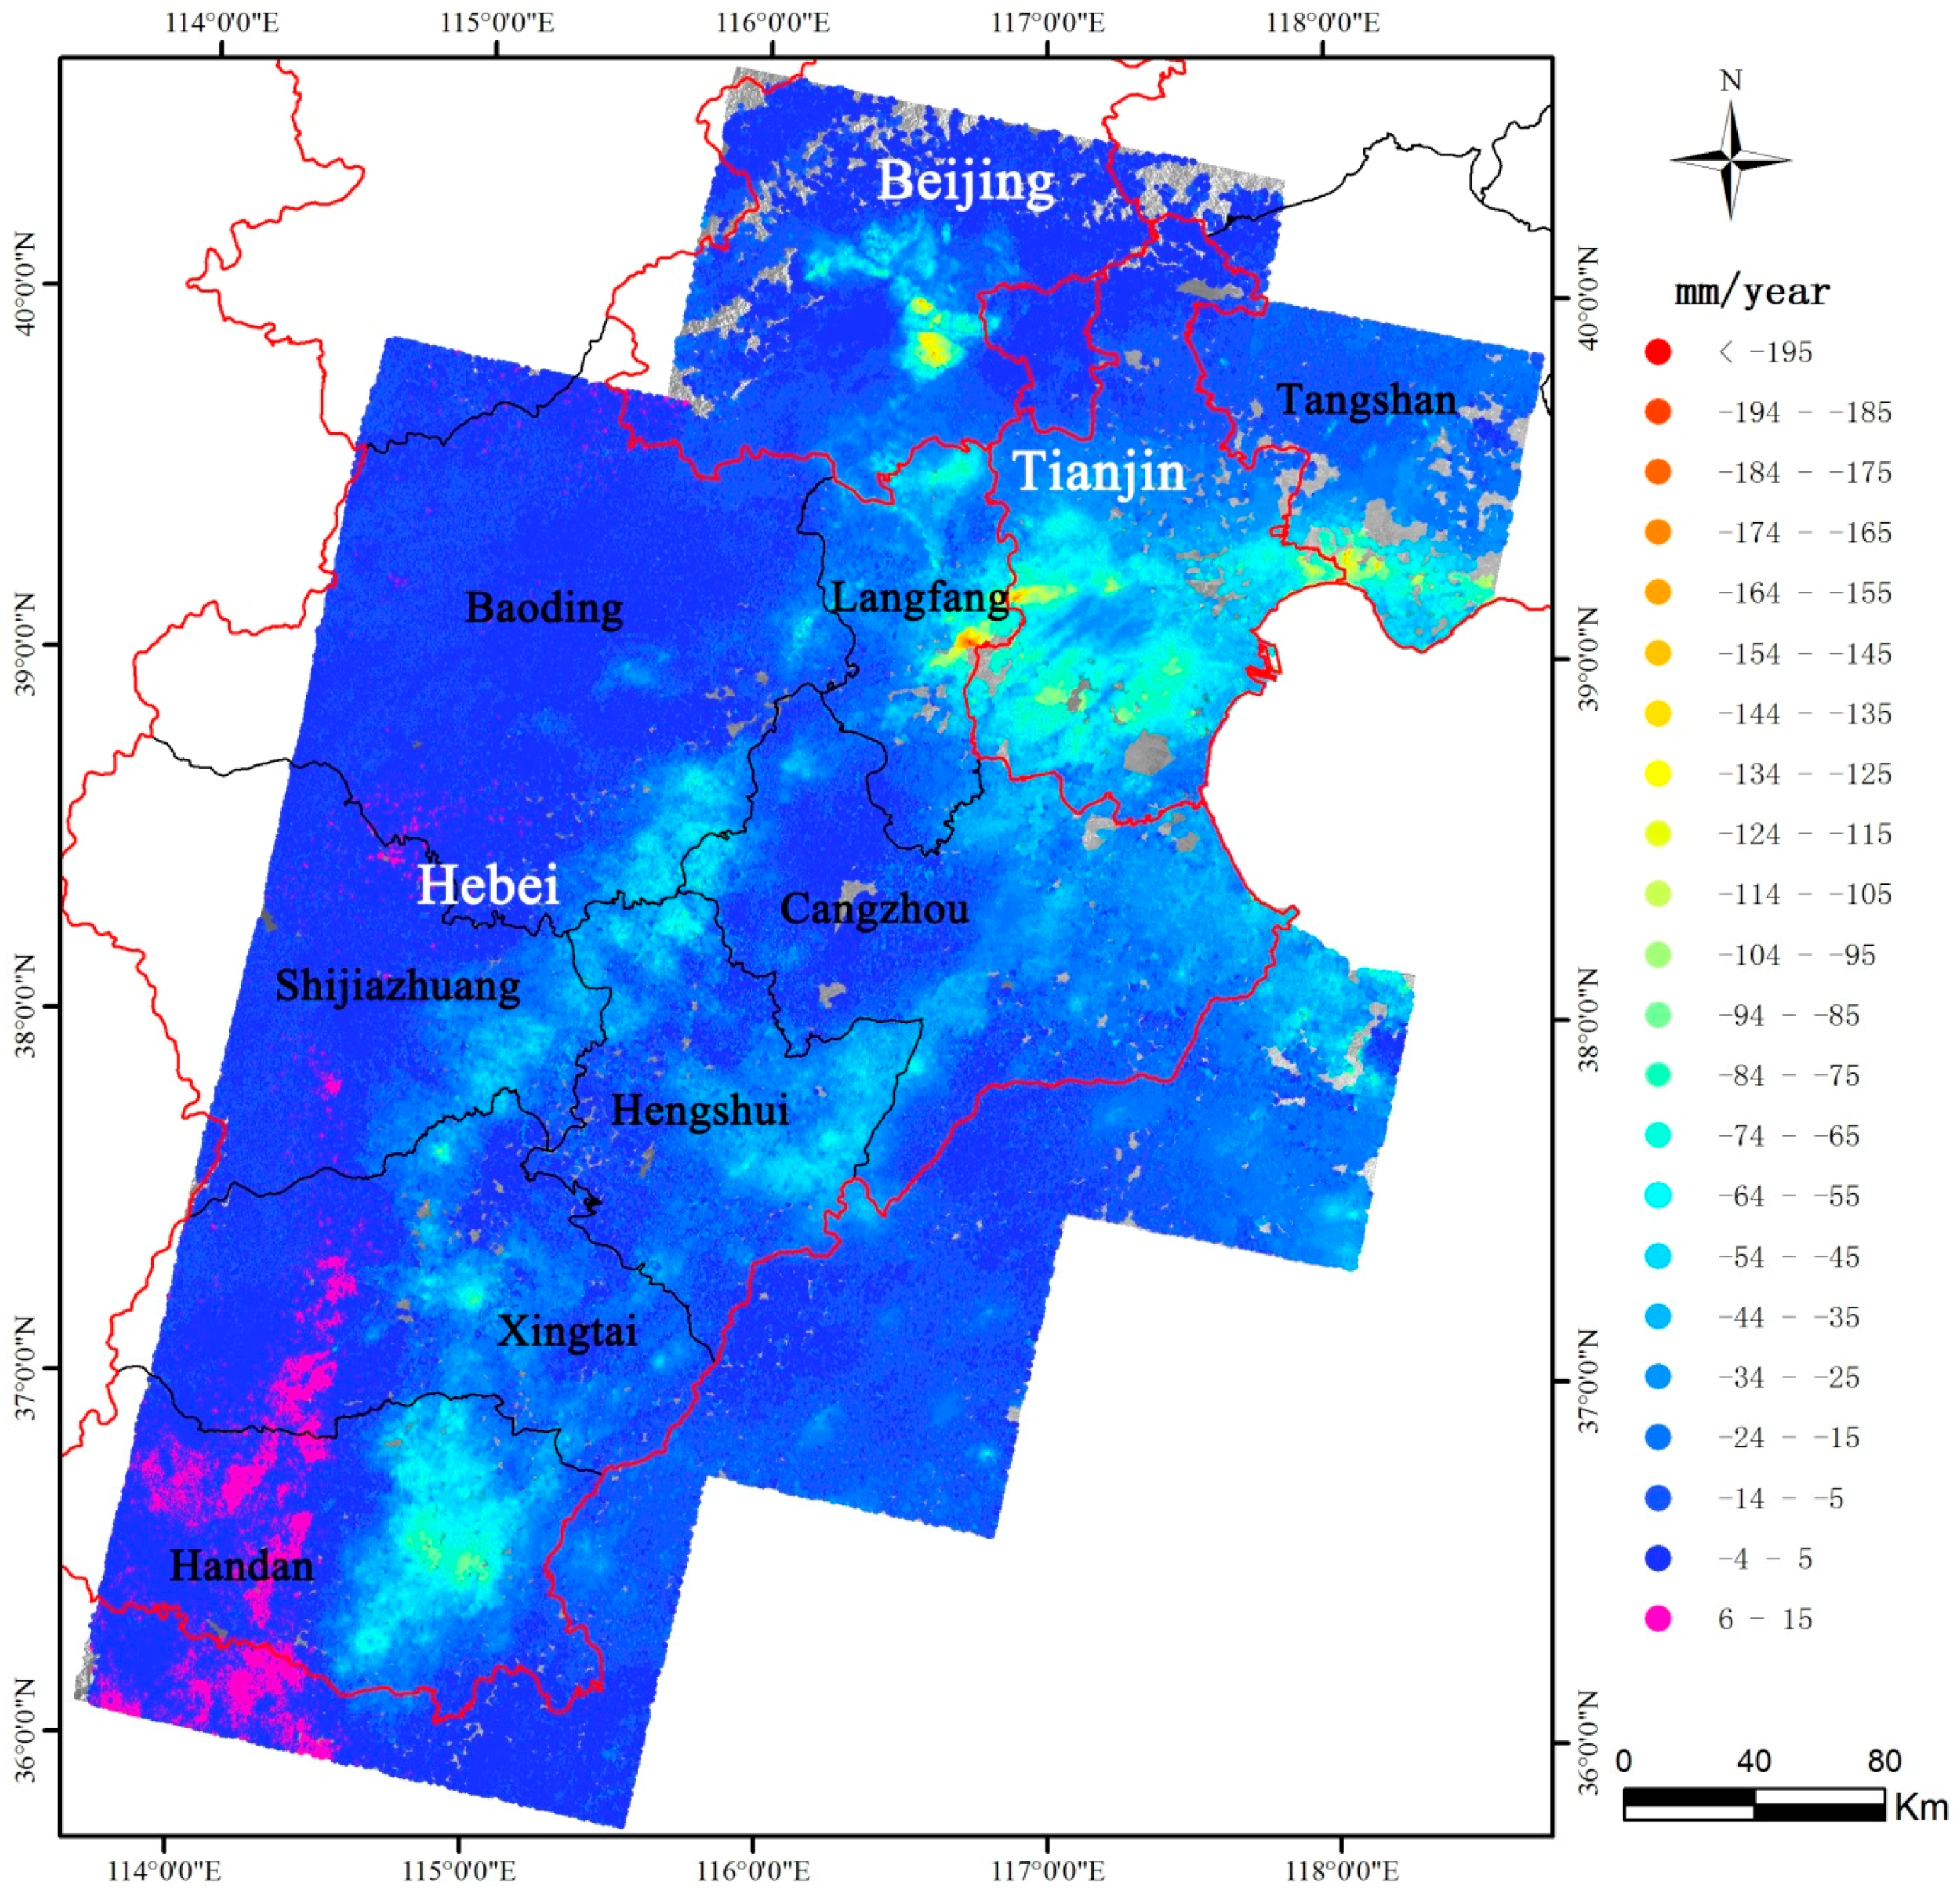
The three sets of SAR stacks are processed and the deformation of the study area over the three time spans is calculated, respectively. ERS-1/2 and ENVISAT SAR images are multilooked with a pixel size on the ground of 40 m. RADARSAT-2 images are multilooked, with a pixel size of 25 m on the ground. The numbers of final coherent targets over the study area are 518,150 in ERS-1/2 images, 982,045 in ENVISAT images, and 4,906,691 in RADARSAT-2 images. The deformation rate mosaic of the three time spans is shown in
Figure 4,
Figure 5 and
Figure 6, respectively. Please note the deformation rate in SAR line-of-sight (LOS) direction has been projected into the up-down direction as subsidence rate according to Equation (5):
where,
and
are the up-down subsidence rate and SAR LOS deformation rate respectively,
is SAR viewing angle at position
. Of course, Equation (5) holds only under an ideal condition that ground uplift or subsidence is the sole deformation. For this study, this assumption is reasonable, because it has been widely recognized that ground subsidence and uplift are the dominant ground deformations in the North China plain [
1]. Another reason for doing so is to facilitate the generation of the subsidence rate mosaic for the wide Beijing-Tianjin-Hebei region. The study area is covered by SAR images from at least three tracks, and the SAR LOS varies with different tracks. Therefore, in order to generate a mosaic of the deformation rate, we have to choose a SAR LOS as the reference direction, and project the deformation rate of other LOS into this direction. This process also involves some assumptions. In conclusion, projecting the deformation rate of all SAR LOSs into the up-down direction may be a good solution. In the figures, positive value means uplift, and negative value means subsidence. We have to admit that the subsidence rate estimated from ERS-1/2 SAR stacks over some frames is not very accurate, which cause obvious inconsistency between neighboring frames, like the frame 2817 and 2799 of track 175 as shown in
Figure 4. Also from
Figure 4, there are some noisy points showing uplift at the rate of 6–15 mm/year, which is inconsistent with the neighboring subsidence. As mentioned in
Section 2, the relatively small size of the image stack and the heterogeneous spatial and temporal baseline of ERS-1/2 images may result in a less accurate deformation estimate, thus producing inconsistency in the mosaic. In contrast, the subsidence rate mosaic generated from ENVISAT and RADARSAT-2 dataset shows very good consistency, which indirectly indicates that the deformation rate estimates are accurate. You may notice there are obvious uplifts in the south-western mountainous areas in
Figure 6. This may be caused by some topography induced atmospheric artifacts, or real ground uplift. Unfortunately, there is no leveling measurements over there. Further research is needed to investigate the uplift over the mountainous areas.
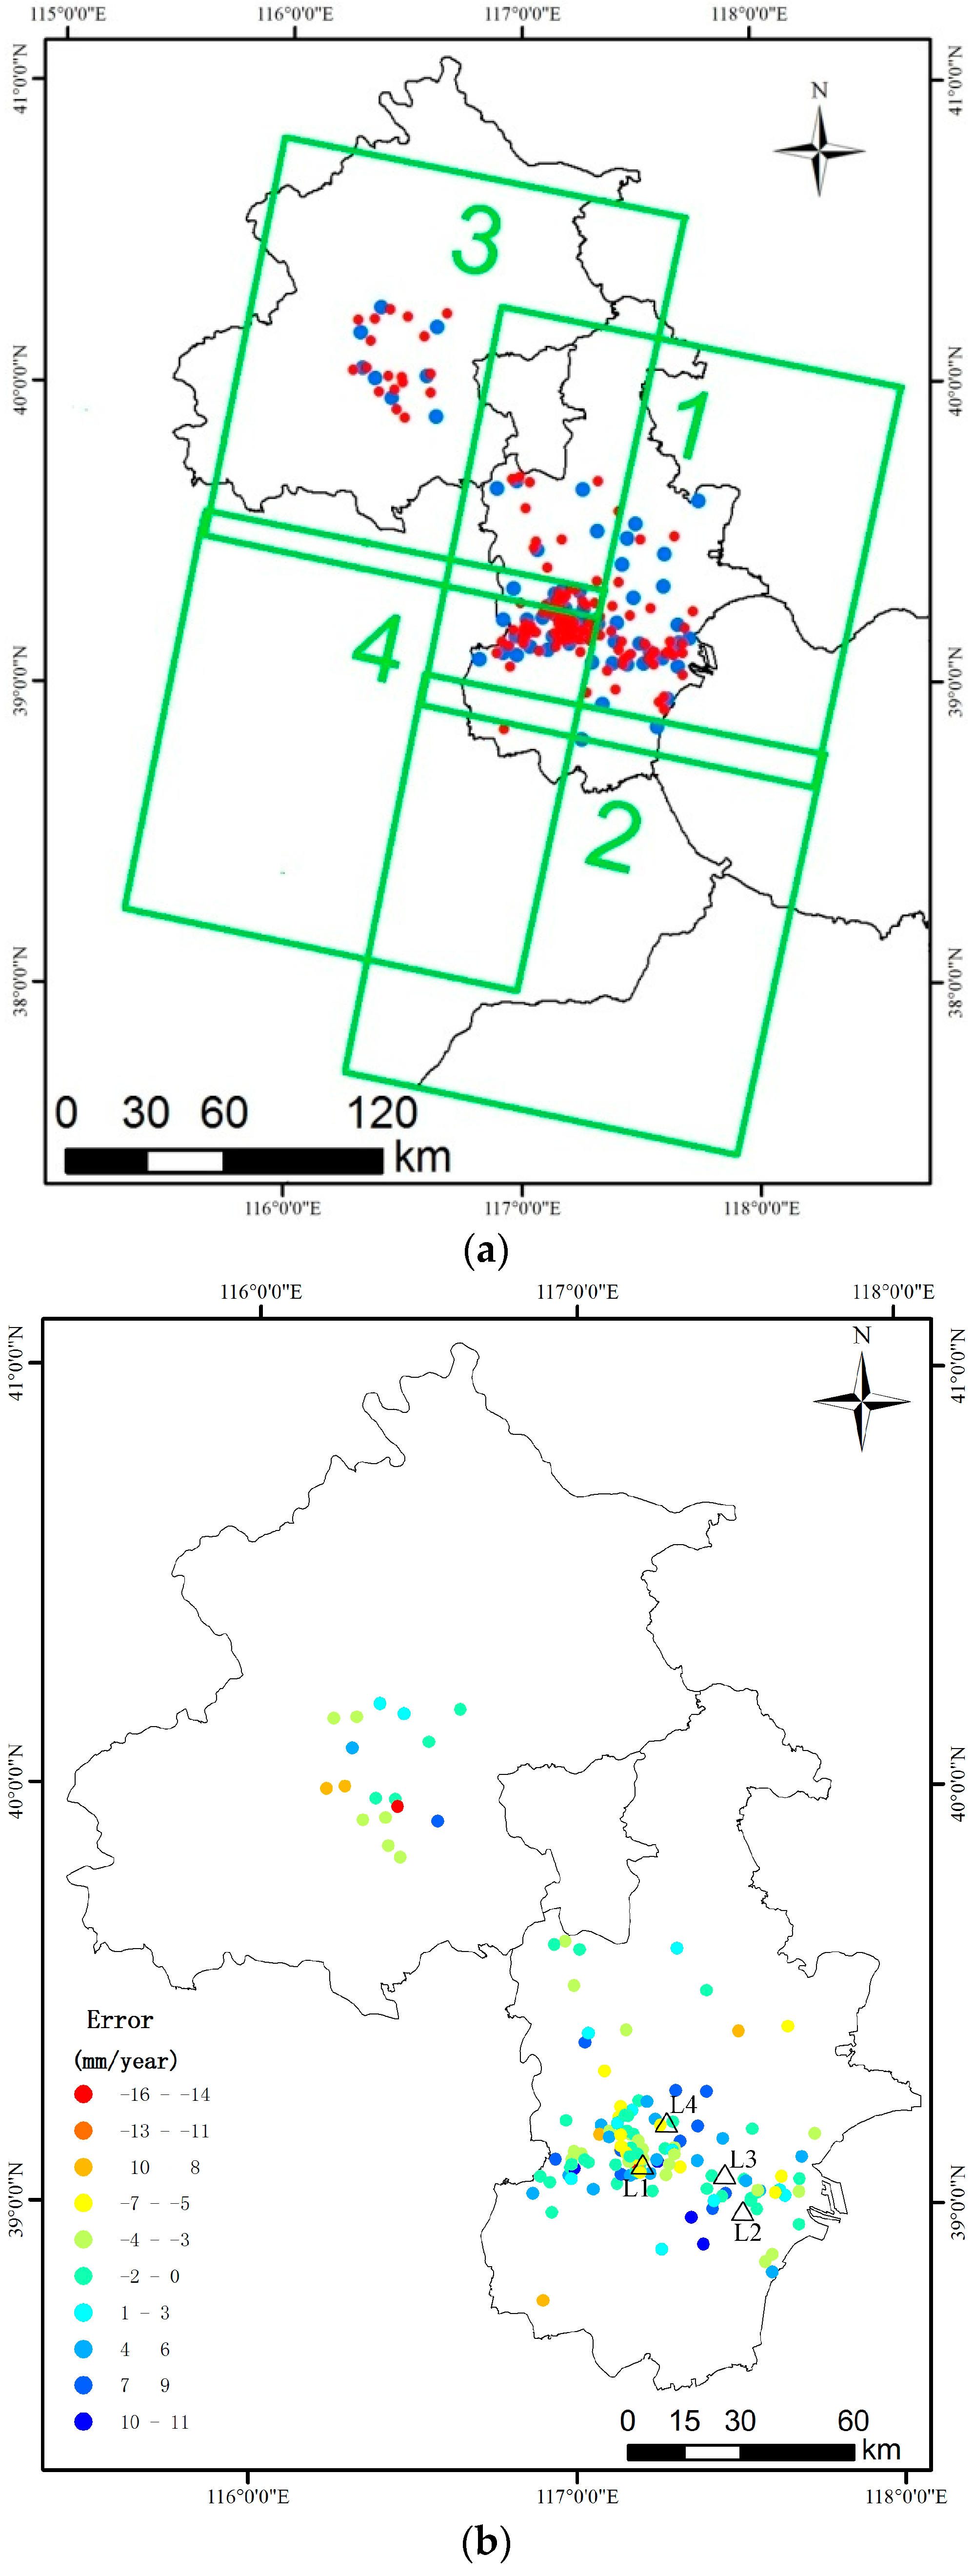
We have collected subsidence measurements over 204 leveling points from the surveying and mapping authority of Tianjin, which were measured every October from 1992 to 2014, and subsidence measurements over 169 leveling points measured annually through 2005 to 2012, and 34 leveling points measured annually through 2012 to 2014 from the surveying and mapping authority of Beijing. Of course, not all of these leveling points are usable, because there may not be a coherent InSAR target in the vicinity of a leveling point. Only those leveling points in a circle neighborhood with 80-m radius centered where there is at least one coherent target are used. Generally, around one third of those usable leveling measurements are used as reference in the adjustment process, and the rest are used to evaluate the accuracy of InSAR-derived subsidence rate. For example, totally 211 leveling points are used in the processing of RADARSAT-2 dataset. Out of them, 70 points are used as the references of adjustment, and 141 points are used in accuracy evaluation. The locations of the 211 leveling points are plotted in
Figure 7a, where the blue points are for adjustment reference, and the red points for accuracy evaluation. The statistics of the evaluation result are listed in
Table 3, including the standard deviation of the difference between subsidence rate derived from InSAR and leveling measurement, and the maximum and minimum values of the difference. The differences between the subsidence rate derived from RADARSAT-2 dataset and that from leveling measurement over the 141 red points in
Figure 7a are shown in
Figure 7b. The standard deviation in
Table 3 indicates that the subsidence rate derived from ASAR and RADARSAT-2 images have an accuracy of 4.7 mm/year and 5 mm/year respectively, while the subsidence rate derived from ERS-1/2 images has an accuracy of 8.7 mm/year, not as good as the other two. Of course, the leveling measurements are back-projected into the SAR LOS direction in the accuracy evaluation in some publications. From Equation (5), it can be seen that the evaluation result of these two processes is linearly correlated. In this case, you may obtain an little better accuracy result if the leveling measurements are back-projected into SAR LOS, as the scaling factor
tends to reduce the values of deformation. The evaluation results in
Table 3 agree with the visual quality of the three mosaics of subsidence rate shown in
Figure 4,
Figure 5 and
Figure 6. This also confirms that the deformation rate derived from the three SAR dataset is generally accurate and the MCTSB-InSAR method is reliable.
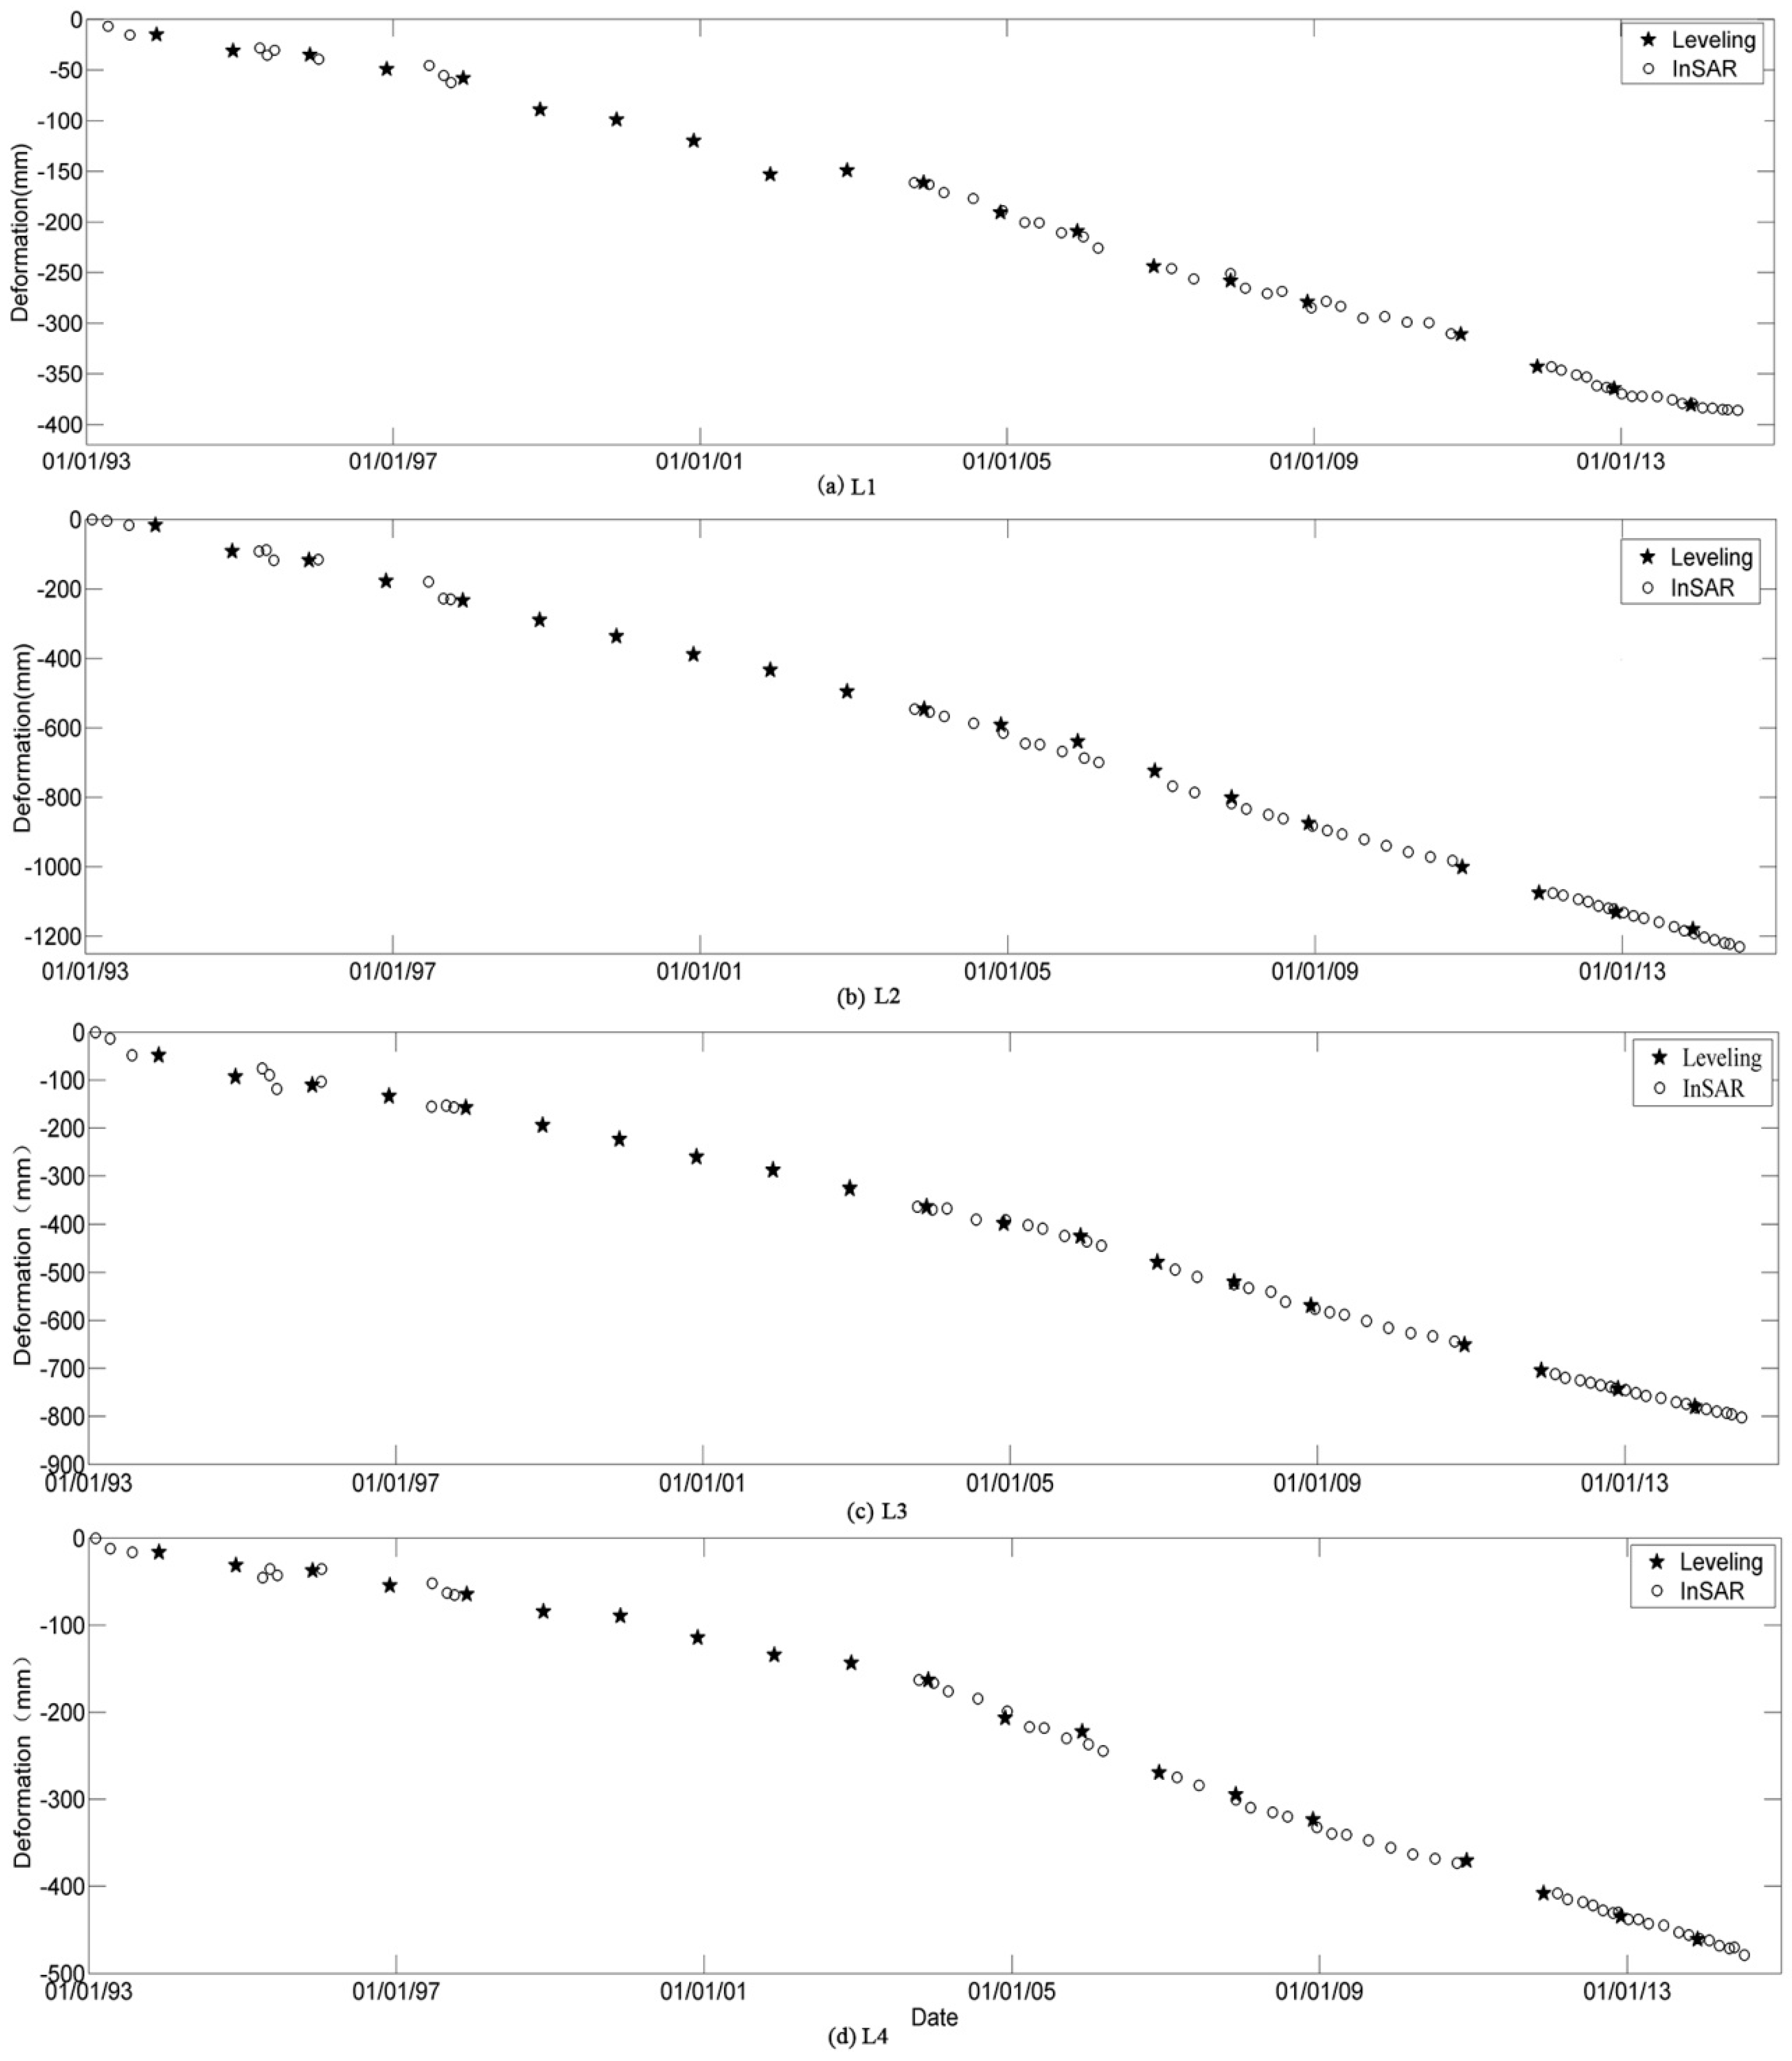
Besides the subsidence rate, the accumulative subsidence over individual coherent targets can also be estimated from one SAR stack. As mentioned earlier, there are two-to-three year gaps between the three sequential SAR stacks, therefore we can only obtain three discrete time series of accumulative subsidence for the period of 1992 to 2014. However, by means of the continuous annual leveling measurements over some parts of the region, such as Tianjin, the three discrete time series of accumulative subsidence can be linked together to form a continuous time series of ground subsidence.
Figure 8 shows the time series of subsidence over four coherent targets in Tianjin, together with the subsidence series from the nearest leveling point. The positions of the four coherent targets are marked in
Figure 7b. We can see that the time series of InSAR-derived subsidence fit well with the subsidence evolution recorded by leveling measurements, which conforms the accuracy of the ground subsidence mapped by InSAR.
5. Spatial—Temporal Variation of Ground Subsidence in Beijing and Tianjin
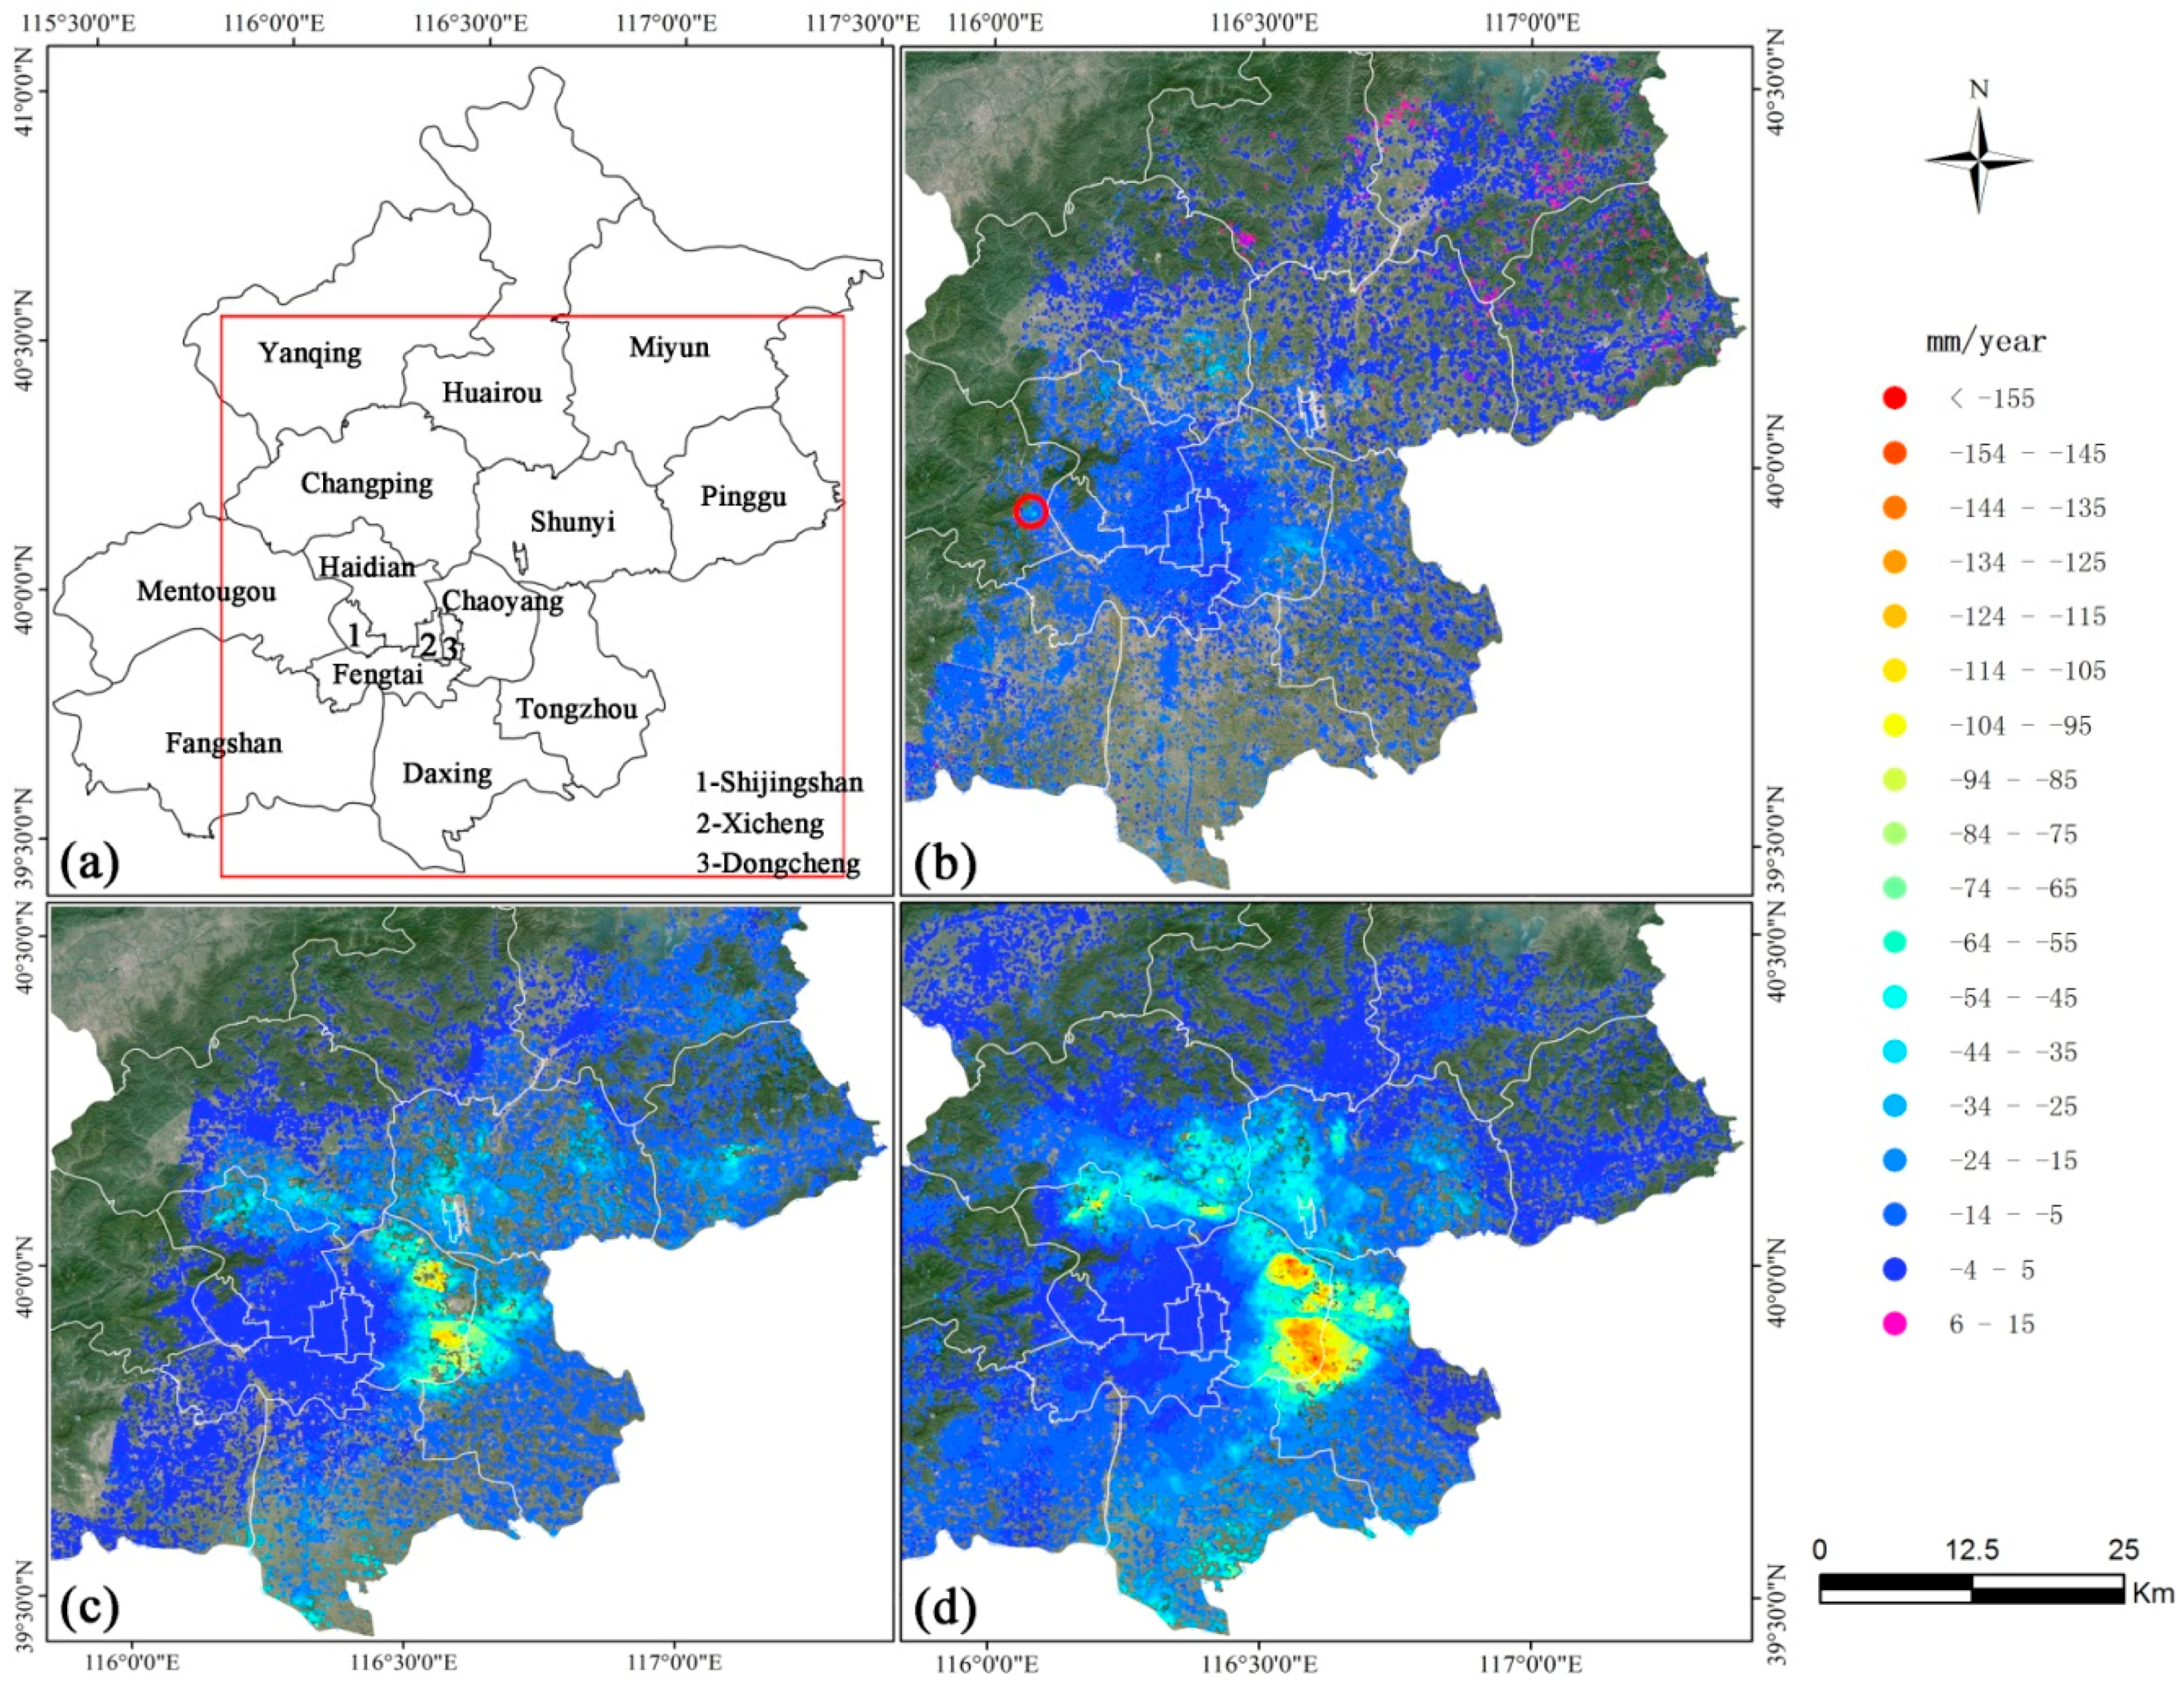
The subsidence rate of the Beijing plain area over the three time spans is shown in
Figure 9. During the time span from 1992 to 2000, most of the Beijing plain is stable. Some small scale subsidence took place in Haidian, Changping, Chaoyang, and Mentougou districts. The maximum subsidence rate is 48 mm/year in this period which occurred at a mining site in Mentougou district marked by the redline circle in
Figure 9b. The coal exploited in this mine had been the main energy source for heating Beijing during the winter for decades. The mine site was shut down in 2000. From
Figure 9c, the previous subsiding sites in the Chaoyang district had evolved as large subsiding zones, with a maximum rate reaching 143 mm/year. Subsiding zones also existed in the north part of the Beijing plain, including Haidian, Changping, Shunyi, and Pinggu districts. To count the subsiding area, the subsidence rate over non-coherent pixels is estimated using the simple Kriging interpolation method with the normal score transformation and spherical semivariogram model in ArcGIS software. Totally, the subsiding area with a subsidence rate of more than 50 mm/year was 265.41 km
2. A noticeable change is that the subsidence at the mining site in the Mentougou district disappeared, which turned out to be the result of the shutdown. During the period from 2012 to 2014 as shown in
Figure 9d, the subsidence in the Beijing plain had continuously developed, with 433.25 km
2 area subsiding at a rate more than 50 mm/year. The subsiding zones of Chaoyang, Tongzhou, Haidian, Changping, and Shunyi districts kept growing and became geographically joined together. The maximum subsidence rate was 152 mm/year, even higher than that of the previous time span. Generally, during the last two decades, ground subsidence mainly occurred in the east and north part of the Beijing plain, with the east rim of Chaoyang district and the northwest part of Tongzhou district suffering the most severe subsidence. The urban center consisting of Xicheng and Dongcheng districts and the western part of Beijing kept relatively stable with little subsidence. More analysis on the relationship between the temporal-spatial variations of ground subsidence and the groundwater exploration and the hydro-geological environment in Beijing is needed in the future.
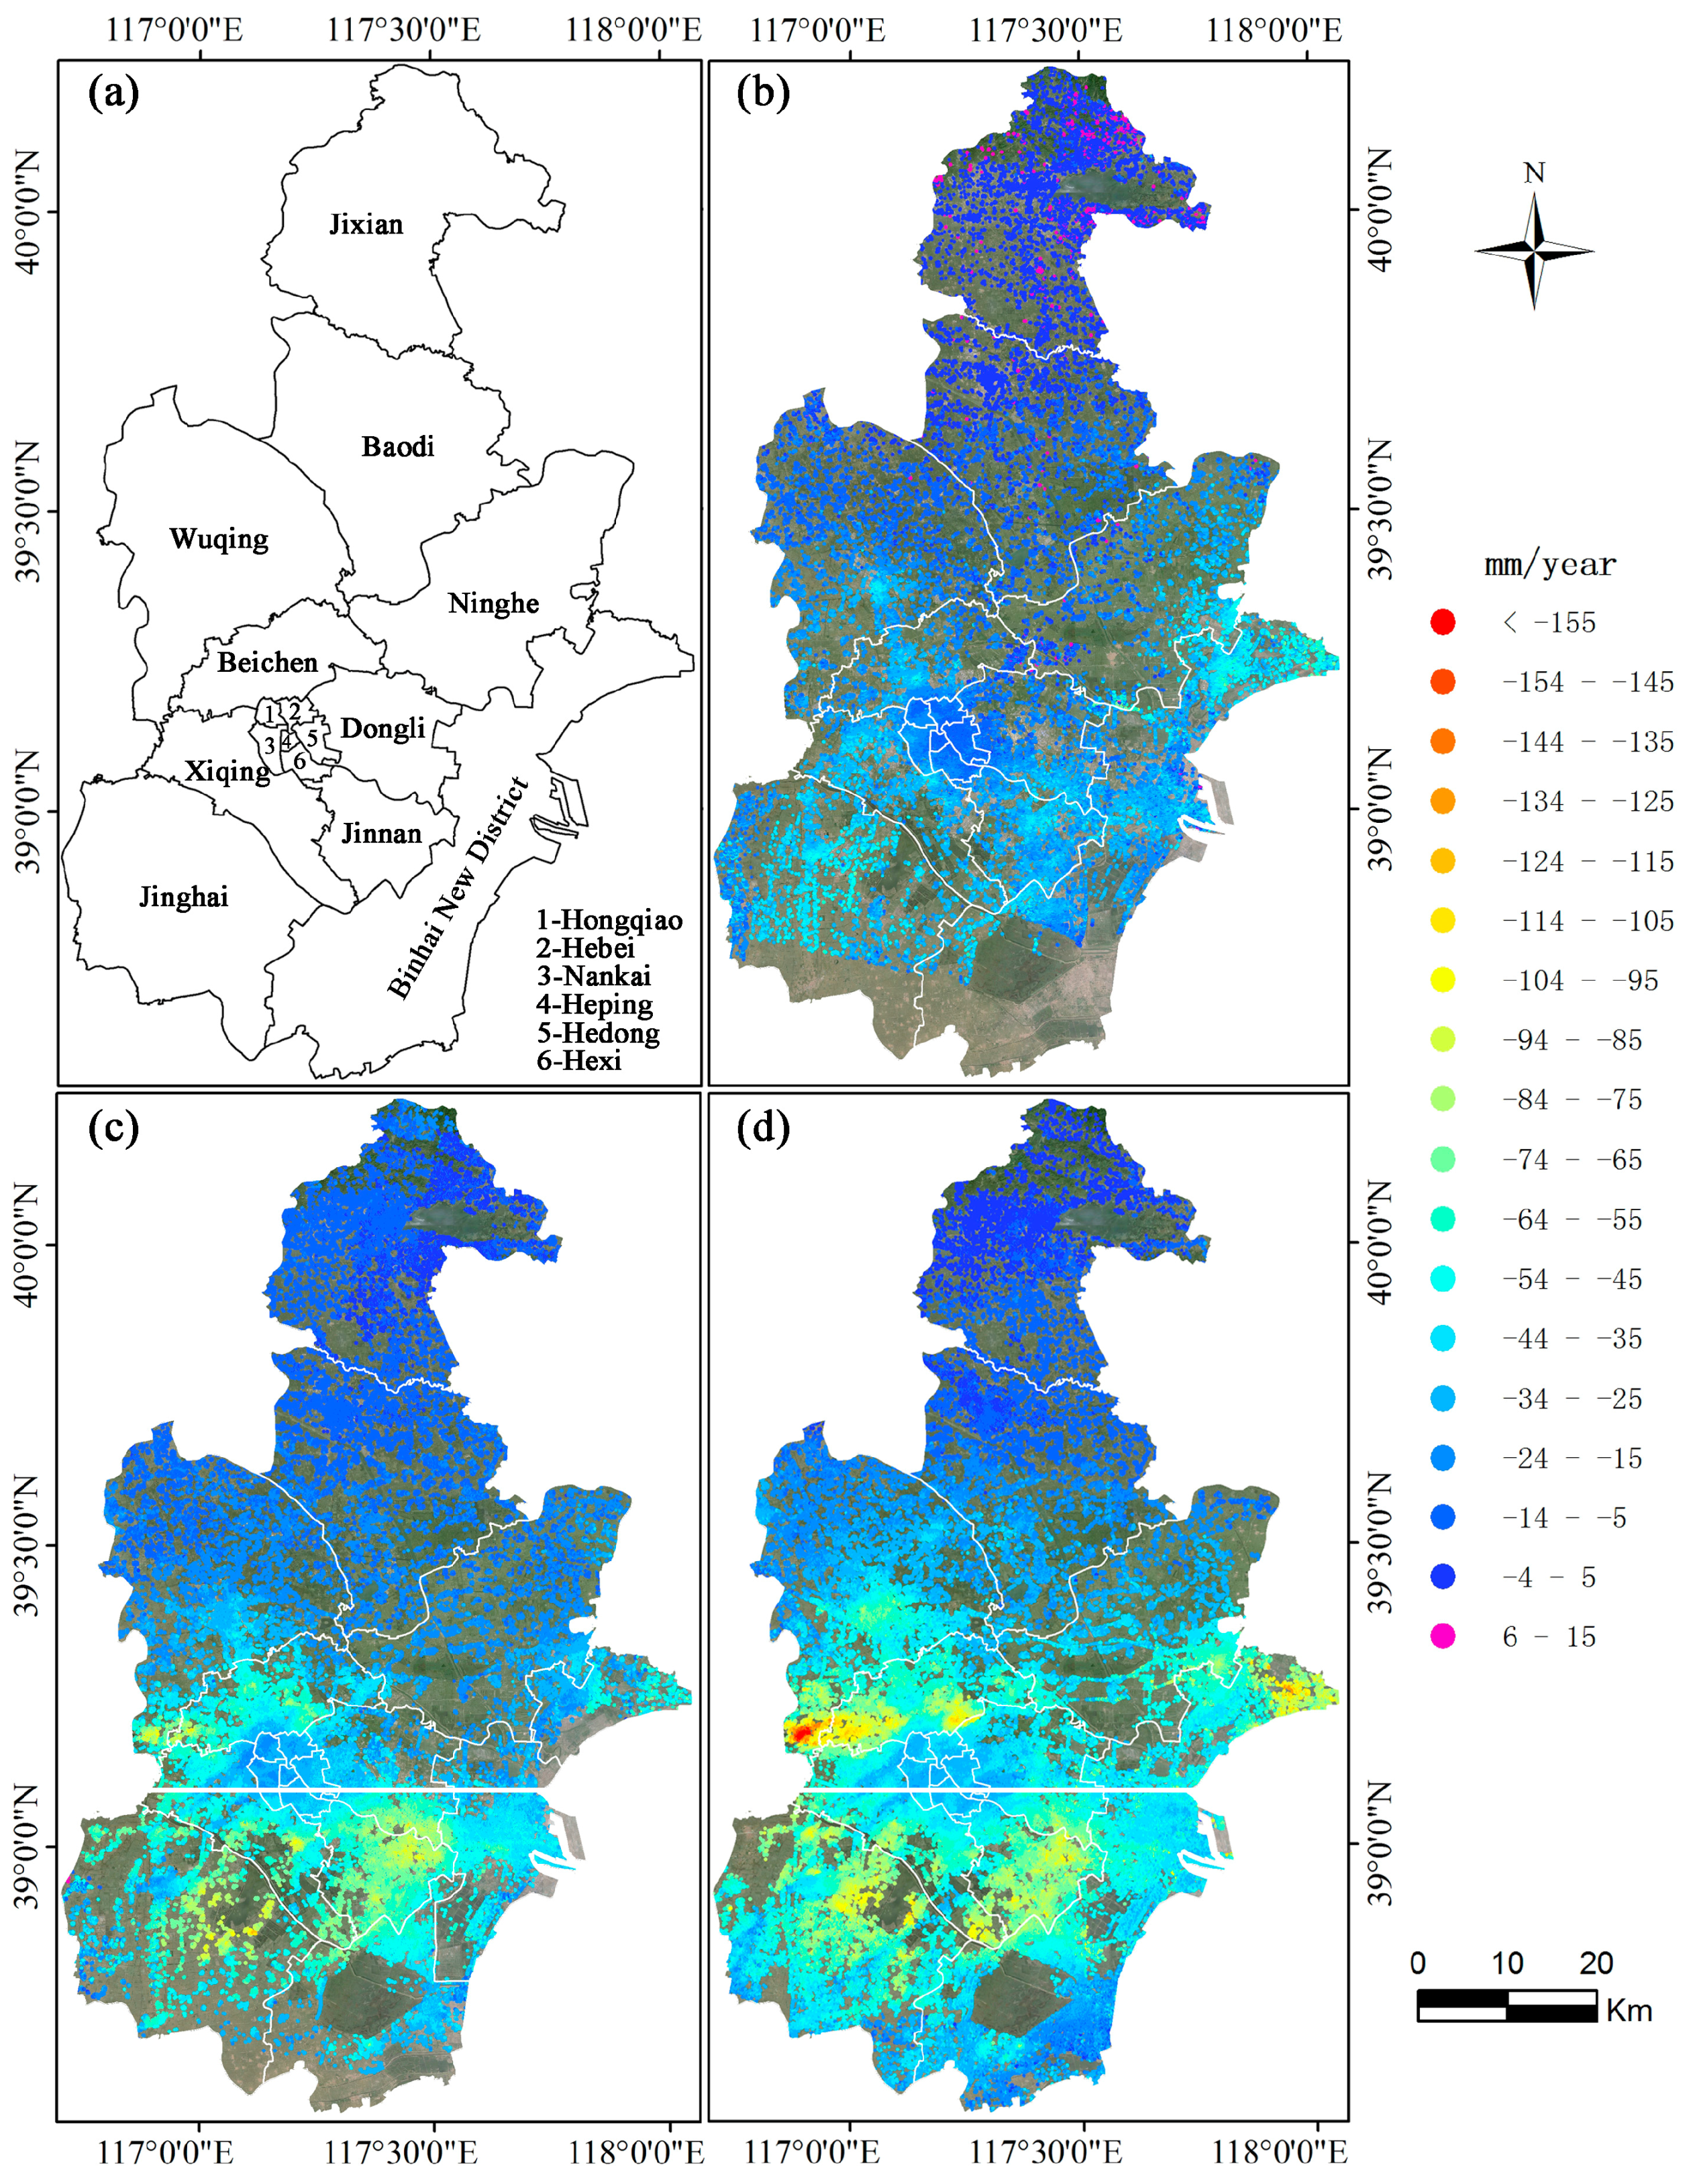
The spatial-temporal characteristic of subsidence in Tianjin is a little different from that of Beijing. The maps of subsidence rate of Tianjin in the three time spans are shown in
Figure 10. During the time span from 1992 to 2000, ground subsidence took place in nearly all the suburb districts surrounding the urban center, including Wuqing, Beichen, Xiqing, Jinghai, Dongli, Jinnan, Tanggu, and Hangu districts. The majority of the subsidence rate was in the range of 30 mm/year to 60 mm/year. The maximum subsidence rate was 81 mm/year. The area with a subsidence rate more than 50 mm/year was 85.73 km
2, in comparison to none in Beijing at that period. During the period from 2003 to 2010, ground subsidence had developed very quickly. In the north, west, and south of the urban center, ground subsidence had expanded dramatically, especially in districts of Beichen, Xiqing, Jinghai, Dongli, and Jinnan as shown in
Figure 10c. Only in the coastal area of Hangu district was ground subsidence relieved somehow. The maximum subsidence rate of Tianjin at this period reached 135 mm/year. The area with a subsiding rate more than 50 mm/year was 2749.1 km
2, 10 times of that in Beijing. During the period from 2012 to 2014, ground subsidence in Tianjin presented different scenario over the north part and south part which was approximately marked by the white solid line in
Figure 10c,d. In the northern part, ground subsidence was exacerbated, especially in districts of Beichen and Wuqing. The subsided area became wider, and the subsidence rate became larger. The largest subsidence occurred at the town of Wangqingtuo of the Wuqing district reaching 153 mm/year. In the south part of Tianjin, ground subsidence showed substantial alleviation, which might be the result of control of groundwater exploration in recent years in this region. As a comparison, the area with a subsiding rate more than 50 mm/year decreased to 1117.55 km
2 in the period of 2012 to 2014, roughly 41% of the area in previous period. In summary, ground subsidence in Tianjin had already been serious in 1990s, had dramatically expanded during 2000s, and started to alleviate in recent years.
6. Conclusions
An application using multi-temporal InSAR technology to map ground subsidence over the wide Beijing-Tianjin-Hebei region is presented. Three sets of SAR images coming from four satellites are employed to cover a long time span from 1992 to 2014. An improved time series InSAR methodogy, namely MCTSB-InSAR, has been developed to deal with small datasets consisting of only 11 to 12 images and to monitor deformation over wide area equivalent to the coverage of several SAR frames. The adjustment process of MCTSB-InSAR provides an integrated solution for both calibration of InSAR-derived deformation and the harmonization of the deformation estimates from overlapping frames. Of course, some aspects of MCTSB-InSAR need to be improved further. For example, the currently used linear deformation model may not fit a situation with strong non-linear deformation. More complicated deformation models, such as high-order polynomial and sinusoid model as presented in [
28] should be incorporated into MCTSB-InSAR in the future.
Three subsidence rate maps over the Beijing-Tianjin-Hebei region on three time spans are generated from SAR images acquired by ERS-1/2, ENVISAT, and RADARSAT-2 satellites. Compared with more than 120 leveling measurements collected in Beijing and Tianjin, the subsidence rate maps have a standard deviation of 8.7 mm/year (1992–2000), 4.7 mm/year (2003–2010), and 5.4 mm/year (2012–2014) respectively. The comparison validates the accuracy the subsidence information derived from InSAR, and confirms the reliability and robustness of the MCTSB-InSAR method.
During the 22-year time span, the evolution of ground subsidence in Beijing and Tianjin shows different scenarios. In the period from 1992 to 2000, there were only some sites with small-scale subsidence mainly scattered in the eastern and northern suburbs of Beijing, with the largest rate being 48 mm/year; while in Tianjin, serious ground subsidence already took place in nearly all the suburb districts with 85.73 km2 area subsiding at a rate more than 50 mm/year. In the period of 2003 to 2010, ground subsidence had expanded dramatically in both Beijing and Tianjin. In the period of 2012 to 2014, ground subsidence in Beijing had continuously developed, with the area subsiding at a rate more than 50 mm/year increasing 63% than that of the previous period; while the development of ground subsidence in Tianjin had slowed down with the area subsiding at a rate more than 50 mm/year decreasing 41% than that of the previous period. The different spatial-temporal characteristics of subsidence evolution in Beijing and Tianjin surely were related to the exploration of groundwater, precipitation, hydro-geological environment, and others. How these factors affected ground subsidence need further analysis in the future.
The output of the research provides first-hand, relatively complete and accurate information about ground subsidence over the Beijing-Tianjin-Hebei region. This information could directly serve the decision-making on ground subsidence mitigation and water resource management in the Beijing-Tianjin-Hebei region.


