1.1. Remote Sensing and Forest Mapping
Forests play a pivotal role in biogeophysical feedbacks of the terrestrial biosphere with the climate system [
1] and constitute one of the main components of the global carbon cycle [
2] in the form of woody aboveground biomass (AGB) [
3]. Availability of information on forest cover and accurate mapping algorithm are essential for monitoring and managing forests [
4]. Accuracies of forest cover information vary depending on the type of tools and methods used. For example, the United Nation’s Food and Agriculture Organization (FAO), has provided estimates of global forest cover at 5–10 year intervals since 1946 based on national statistics [
5], largely relying on forest inventory data, models and expert opinion. However, there is a lack of consistency in terms of defining forest and assessment methods of different countries [
6]. Moreover, there are data gaps in national forest inventories in many parts of the world, particularly areas with inaccessible problems. To overcome these uncertainties on forest cover extent, surveys based on remote sensing are now being used operationally [
7].
For a consistent and systematic study on global monitoring of forested areas, use of Earth observation data from satellite offers robust and continuous data with large area coverage and repetitive observations [
8] and can reduce the cost and time of field inventories. At the small scale, remote sensing also provides forest maps on inventory estimates with precision for limited field data and can be used for purposes related to timber production, procurement and ecological studies [
9]. Therefore, remotely sensed data have been incorporated into operational forest inventories. Over the past decades, different forest cover maps at continental to global scales have been generated utilising optical sensors with fine, medium and coarse spatial resolutions [
4,
10,
11,
12]. The majority of the optical-derived forest/non-forest (F/NF) maps have been generated from optical data acquired in a single year or period due to persistent cloud cover using time-series composite data. Additionally, they have been used for mapping forest cover and AGB of forest where relatively simple stand structure and gradients of cover exists such as wooded savannas [
13].
For the first time, forest cover maps with the annual forest gain and loss from 2000 to 2012 have been produced using multi-temporal fine-resolution Landsat data at global scale [
4]. The existing optical-derived global maps showing areas of F/NF reveal differences in the forested area estimations ranging from 3.5 billion ha to 4 billion ha primarily due to the varying definition of forest and methodologies. In general, forest is defined as all contiguous area >0.5 ha with at least 10% canopy cover and 2–5 m height [
5]. Moreover, the spectral reflectances (both absorbed and scattered) of forest canopy components (leaves, needles and branches) at optical wavelengths are sensitive to weather conditions and closely related to two-dimensional structure (i.e., amount of foliage cover, leaf area index) and their biochemical properties such as chlorophyll, nitrogen, lignin and cellulose content and the difficulty in separating mixed vegetation types has resulted in varying accuracies between 66.9% (IGBP DISCover 1.1 km) and 78.3% (MODIS 1 km) at global scale [
14]. Information related to radiation scattering from leaves, branches, trunks (i.e., forest structure particularly height) and the ground is highly desirable for differentiating woody from herbaceous or other mixed vegetation where the use of optical data is often problematic. Specific information related to stands of different species, age or density [
15] including stand information with tree trunk diameter and stem volume [
16] will aid in classification of forest cover types. Forest structural properties related to crown architecture at tree level and spatial heterogeneity distribution at stand level will also be useful in forest cover mapping [
15].
1.2. Forest/Non-Forest Mapping Using SAR
Approximately 47% of the Earth’s land surface was assumed to be covered by closed forest about 8000 years ago based on numerous global and regional biogeographic information [
17]. Since the last decades, nearly 30% of the world’s land area is forested due to wildfires, drought, logging and large-scale deforestation particularly in the tropics [
18]. Within this area, different forest types occur based on climatic (global), soil, topography and disturbance factors at landscape level [
19]. They also constitute about 80% of terrestrial AGB as a function of forest growth (e.g., regeneration) and mortality (e.g., logging, deforestation) [
18]. The extent of progressive losses in forest area and forest biomass (productivity) caused by human activities has been substantial, resulting in significant greenhouse gas emissions and regional to global climate changes and carbon budgets [
20]. Therefore, accurate measurement of the forested areas and spatio-temporal variations in the biomass of these forests at local, national to global scales is needed.
For an operational forest cover monitoring system at high spatial and temporal resolutions, Synthetic Aperture Radar (SAR) systems have emerged as robust tools which can penetrate clouds and record signals which originate from scattering within the vertical canopy layer [
21,
22]. For example, Shimada, Itoh, Motohka, Watanabe, Shiraishi, Thapa and Lucas [
22] have generated global F/NF cover maps (2007–2010) at 25 m resolution from the Advanced Land Observing Satellite (ALOS) Phased Arrayed L-band Synthetic Aperture Radar (PALSAR) HV gamma-nought (γ
0) reporting around 85% overall accuracy. For the past three decades, significant efforts in microwave remote sensing have been devoted to interpreting the radar backscatter [
23] for improved forest classification accuracy [
24] and biophysical retrievals [
25,
26]. For information related to forest attributes at the stand level such as cleared-felled or canopy degradation, S-band radar data at 6 m resolution from NovaSAR-S could potentially provide a more useful data product than is currently available from Sentinel-1, ALOS-2 and other SAR sensors that provide global coverage.
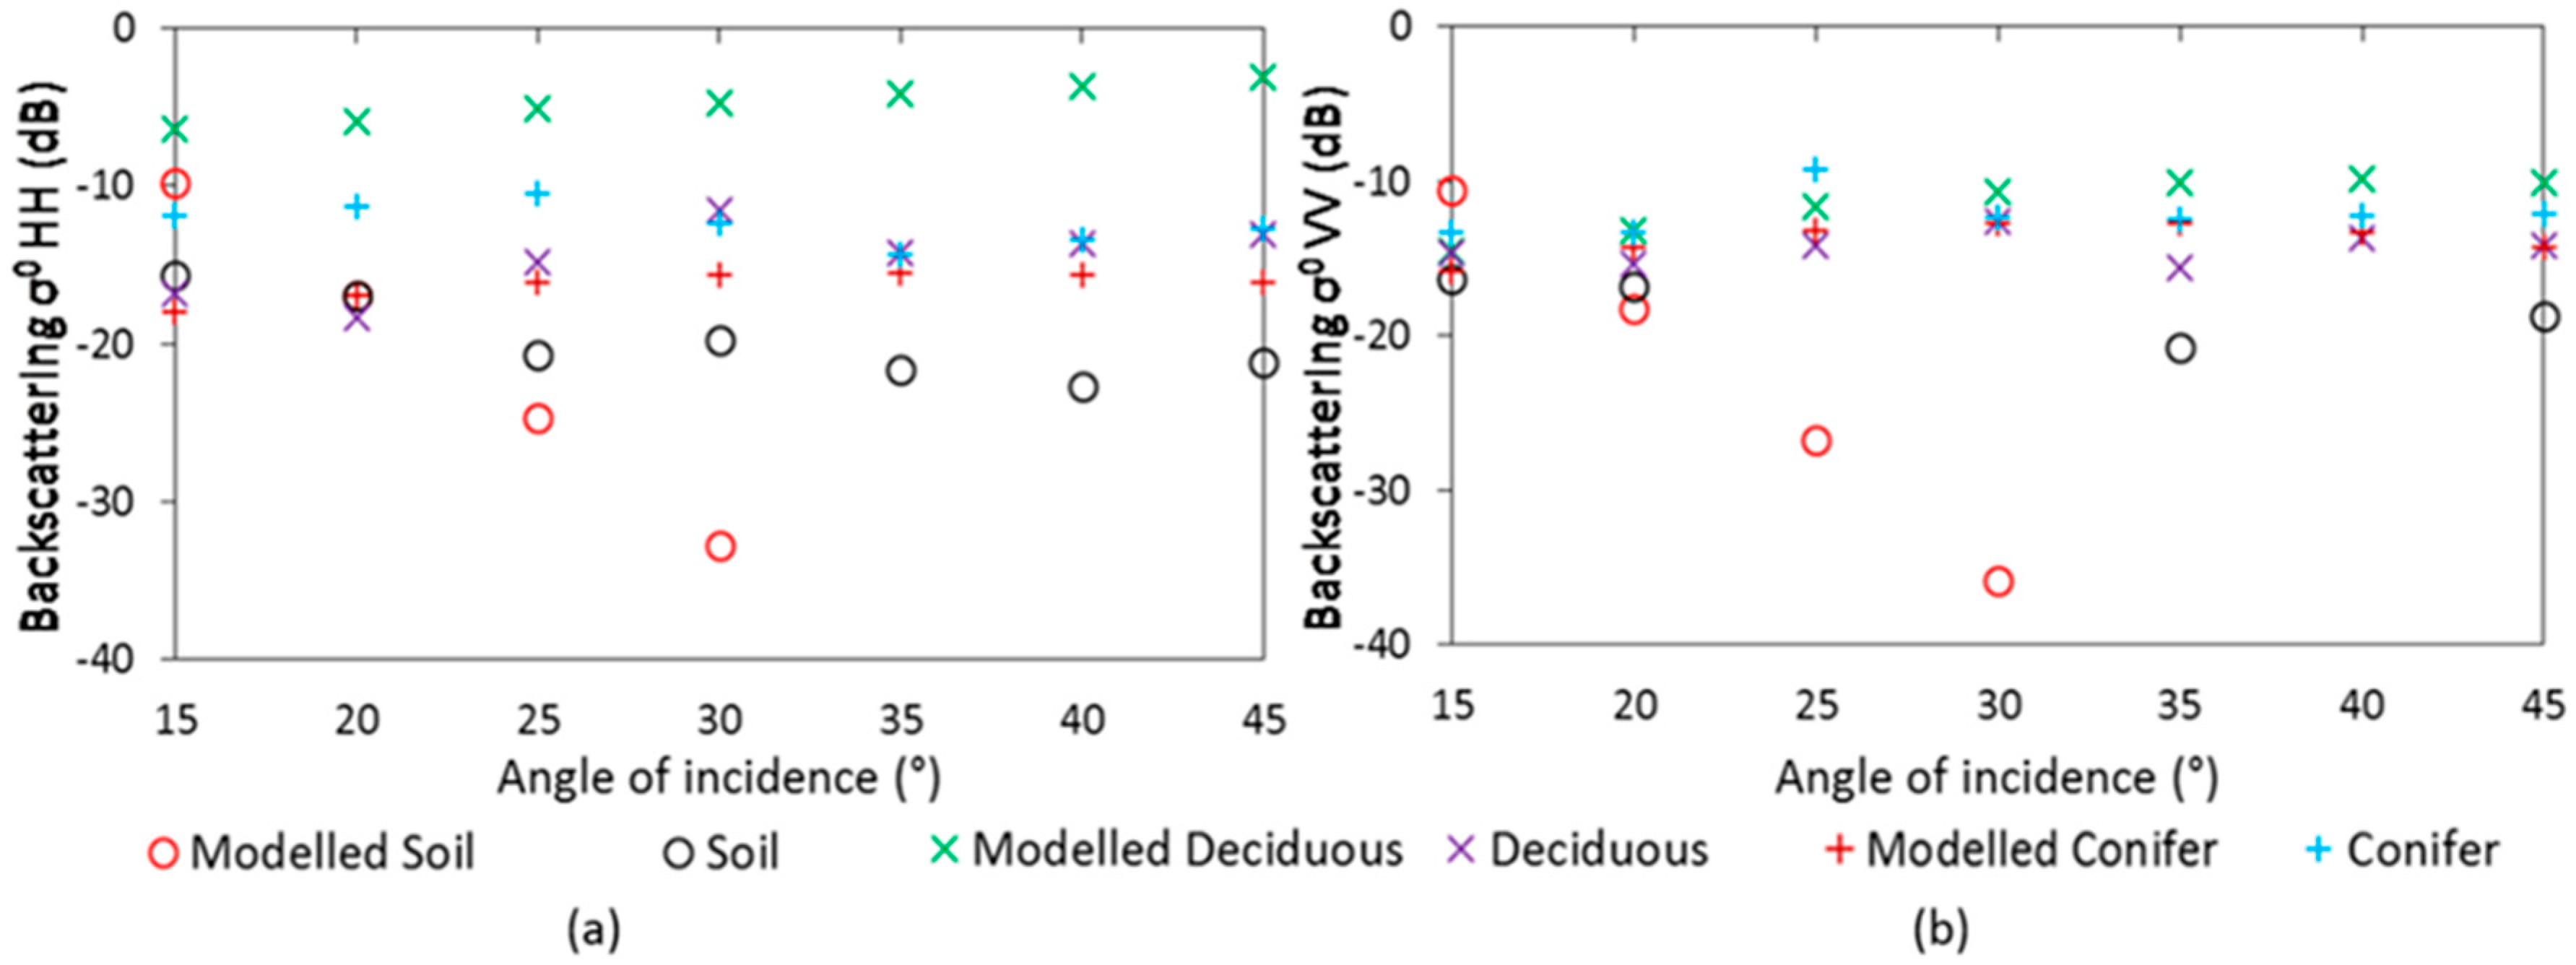
Understanding the relationships between SAR backscatter at different wavelengths and polarisation combinations and forest canopy parameters is critically important for developing forest monitoring methods. However, the sensitivity of the radar backscatter to different canopy elements (leaves, branches and trunks) cannot easily be quantified based on image data alone (without complementary field data) due to the inter-relationship between forest parameters and radar parameters. Simulations from microwave canopy radiative transfer models provide insight into the complex interactions of the radar wave with the different components of the canopy as a function of wavelength, incidence angle and polarisations [
26,
27,
28,
29]; for instance, increasing level of penetration with increasing wavelength. Such models have shown that the low frequencies (P- and L-band), in particular co-polarized (horizontal transmit and horizontal receive—HH, vertical transmit and vertical receive—VV) channels produce stronger scattering from larger scattering elements (branches, trunks) with high frequencies (X- and C-band) from leaves and needles. This can be understood by radar being most sensitive to features in a scene with dimensions characteristic of the scale of the probing wavelength, combined with increasing canopy penetration wave with increasing wavelength. In contrast to X-, C-, L- and P-band, the nature of the S-band microwave scattering mechanism in forest canopies is poorly studied to date due to the historic lack of availability of S-band SAR data. The S-band (3.1–3.3 GHz) lies between the longer L-band (1–2 GHz) and the shorter C-band (5–6 GHz).
1.3. Potential of S-Band Data for Forest Mapping
The first S-band SAR observations from space were provided by the Russian Almaz-1 satellite, which carried a single-polarized HH S-band SAR sensor operating between 1991 and 1992. Since the Almaz-1 mission, interest in S-band SAR has led to the launch of the Environment and Disaster Monitoring Satellite Huan Jing -1 Constellation (HJ-1C) from China [
30] and new S-band SAR missions are planned, e.g., the UK NovaSAR S-band [
31] and the joint NASA-ISRO Synthetic Aperture Radar (NISAR) missions [
32]. NovaSAR is planned to provide S-band data with StripMap and ScanSAR resolution modes at 6 m and 20 m respectively.
Few published studies have investigated S-band radar responses to agricultural crops and forest canopies to date. The sensitivity of S-band backscatter to maize crops was dominantly volume scattering due to the random distribution over the whole plants [
33]. The Michigan Microwave Canopy Scattering (MIMICS) model suggests that S-band backscatter is sensitive to the temporal dynamics of the structure of wheat crops [
34]. In the young fir, S-band backscatter arises from the needles and branches resulting in lower volume scattering due to the conical structure of conifer species [
35]. The capability of S-band backscatter to map agricultural crop canopies [
36] and forested areas [
37] using an integration of polarimetric scattering entropy H/average alpha angle α and Pauli’s decomposition techniques and salt marsh habitat mapping using a Random Forest algorithm [
38] have also been explored using airborne very-high resolution S-band data. Studies by Yatabe and Leckie [
39] and Fransson, et al. [
40] have demonstrated the mapping of clear-felled and forested areas using S-band Almaz-1 in boreal forest of Canada and Sweden.
The fine 6 m resolution data from NovaSAR could provide a useful and better than other available datasets from Sentinel-1, ALOS-2 and other SAR sensors that provide global coverage. This means that the radar pulse at this frequency can provide the information in relation to the small-scale changes in the forest ecosystem particularly degraded and disturbed areas due to its sensitivities to the forest canopy and its structural components. Modelling studies have highlighted the sensitivity of longer wavelength at L-band to the varying sizes of branch canopy and canopy density [
29] and similar sensitivity to varying canopy density, branching level and branch size have also been found to be sensitive to S-band radar pulse.
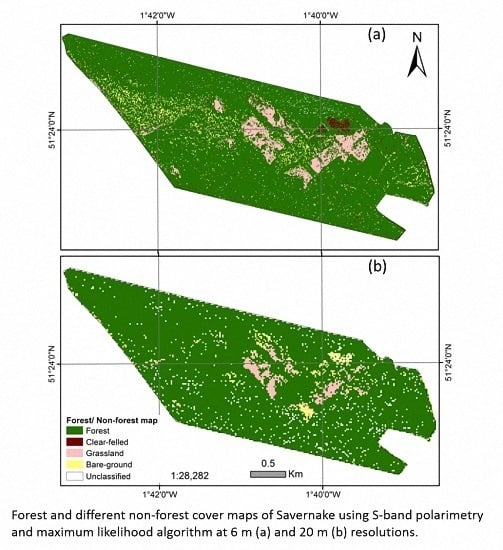
The main objective of this study is to classify S-band radar backscatter data to produce F/NF cover and change maps using a Maximum Likelihood Classification (MLC) algorithm at different spatial resolutions that match the anticipated acquisition modes of NovaSAR-S. Scattering mechanisms in the canopy and from the ground have been investigated from radiative transfer modelling experiment with MIMICS-I [
29]. This paper is organised as follows:
Section 2 gives the details of test site, the dataset involved in the study and the used methodology.
Section 3 mainly deals with the results and discussion and the conclusions are drawn in
Section 4.


 ,
, 


