Article

Landscape-Level Associations of Wintering Waterbird Diversity and Abundance from Remotely Sensed Wetland Characteristics of Poyang Lake

1
Department of Landscape Architecture & Environmental Planning, College of Environmental Design, University of California Berkeley, Berkeley, CA 94720-2000, USA
2
Department of Environmental Science, Policy and Management, Division of Ecosystem Science, College of Natural Resources, University of California, Berkeley, CA 94720-3114, USA
3
Department of Forest and Wildlife Ecology, College of Agriculture and Life Sciences, University of Wisconsin-Madison, Madison, WI 53706-1598, USA
4
The International Crane Foundation, Baraboo, WI 53913, USA
5
Ministry of Education Key Laboratory for Earth System Modeling, Center for Earth System Science, Tsinghua University, Beijing 100084, China
6
Poyang Lake Ecological Research Station for Environment and Health, Duchang 332600, China
*
Author to whom correspondence should be addressed.
Remote Sens. 2016, 8(6), 462; https://doi.org/10.3390/rs8060462
Submission received: 28 February 2016 / Revised: 24 May 2016 / Accepted: 25 May 2016 / Published: 31 May 2016
(This article belongs to the Special Issue What can Remote Sensing Do for the Conservation of Wetlands?)

Abstract

:
Poyang Lake, the largest freshwater wetland in China, provides critical habitat for wintering waterbirds from the East Asian Flyway; however, landscape drivers of non-uniform bird diversity and abundance are not yet well understood. Using a winter 2006 waterbird survey, we examined the relationships among metrics of bird community diversity and abundance and landscape characteristics of 51 wetland sub-lakes derived by an object-based classification of Landsat satellite data. Relative importance of predictors and their sets was assessed using information-theoretic model selection and the Akaike Information Criterion. Ordinary least squares regression models were diagnosed and corrected for spatial autocorrelation using spatial autoregressive lag and error models. The strongest and most consistent landscape predictors included Normalized Difference Vegetation Index for mudflat (negative effect) and emergent grassland (positive effect), total sub-lake area (positive effect), and proportion of submerged vegetation (negative effect). Significant spatial autocorrelation in linear regression was associated with local clustering of response and predictor variables, and should be further explored for selection of wetland sampling units and management of protected areas. Overall, results corroborate the utility of remote sensing to elucidate potential indicators of waterbird diversity that complement logistically challenging ground observations and offer new hypotheses on factors underlying community distributions.

Graphical Abstract

1. Introduction

More than 400 waterbird species, including long-distance migrants, critically depend on wintering habitat in wetlands of warm low-latitude regions, large extents of which have been lost to agriculture, residential sprawl and modifications to store or manage water resources in recent decades [1,2,3,4,5,6,7,8]. The United Nations has designated a number of conservation targets and wetlands of international importance under the Ramsar Convention [9]. However, the understanding of specific factors behind non-uniform distributions and “hotspots” of bird diversity in wetlands is often limited by constrained site access, logistics and financial costs [10,11]. These challenges may hinder allocation of management, conservation and research targets within large wetlands and selection of meaningful habitat features in predictive models of bird population dynamics and diversity.
Recognition of these constraints has stimulated efforts to characterize wetland habitat properties relevant to landscape-scale bird distributions from cost-efficient geospatial and remote sensing data [12,13,14,15,16,17,18]. For instance, significant statistical associations of wetland bird species richness and spatial variables, such as wetland area, proportion of emergent wetland vegetation, or water depth, have been reported by studies in the Rainwater Basin and Prairie Pothole Region of the USA [17,19]. Similarly, a number of terrestrial studies found strong relationships between bird diversity and remote sensing indices of vegetation greenness, compositional heterogeneity, and structure based on both passive and active remote sensing [20,21,22,23,24,25,26]. However, few studies have used remote sensing in the analyses of broad-scale bird community patterns in large wetland regions with limited field access yet high concentrations of resident and migratory avifauna [7,8].
This limitation can be also attributed to known constraints of remote sensing and spatial analyses in wetlands, such as infamous “salt-and-pepper” noise arising from high spectral variation within individual patches of wetland cover types [10,16,27,28]. Novel object-based image analysis (OBIA) methods and machine learning image classification algorithms offer promise to enhance the quality of wetland cover mapping and interpretation, although these techniques are still relatively under-utilized [29,30,31,32]. Another caveat to spatial analyses of ecosystem and habitat properties is presented by potential spatial dependence (autocorrelation), which may violate the assumptions of independent and identically distributed errors in landscape models but in some cases indicate ecological processes such as dispersal or species interactions [33,34,35,36,37,38,39].
The goal of this study was to explore the variation in diversity and abundance of resident and migratory wintering waterbirds at Poyang Lake, the largest freshwater lake in China (Figure 1) and an internationally important wetland conservation site under the Ramsar convention since 1992 [9,40] using landscape characteristics derived from satellite remote sensing data. In the winter, this area hosts large numbers of resident and migratory waterbirds from the East Asian Flyway, including 11 endangered and six globally threatened species [41,42]. Most of them utilize the habitats within sub-lakes, or water bodies within the major wetland that become isolated during the low-water winter stage [43,44]. Of particular conservation concern are tuber-feeding waterbirds, including the critically endangered Siberian White Crane (Leucogeranus leucogeranus), which depend on multiple species of Vallisneria, a submerged aquatic macrophyte (SAM) [43,45].
Land use and climate change, novel aquaculture practices and hydrological control projects threaten the future ecological integrity of Poyang Lake wetlands and their long-term capacity to sustain wintering birds [1,7,8,45,46,47,48,49,50]. However, the understanding of factors behind spatial patterns of bird diversity and abundance is still limited [7,45,51,52], while primary habitat requirements have been studied mainly for specific species and foraging guilds [43,45,53]. Previous multi-year analyses of waterbird diversity and abundance have investigated their associations with basin-wide hydrological and climatic factors [8] and remotely sensed extents and heterogeneity of major habitat cover types [7]. These studies, however, were based on bird censuses from 10–12 spatial observation units [7,8], while whole-region monitoring has been limited by the high logistical cost of repeated basin-wide surveys in this large wetland [42,44,54]. These constraints call for further exploration of remote sensing’s potential to characterize habitat features related to diversity and abundance at spatial scales relevant to conservation and management of Poyang Lake protected areas.
To address this call, we examined the associations between several metrics of waterbird diversity and abundance based on a basin-wide ground survey in December 2006 and remotely sensed landscape characteristics of the sub-lake neighborhoods extracted by the object-based image analysis of the Landsat TM satellite data. Here we explored which landscape characteristics of the sub-lakes were most consistently and strongly associated with the observed bird diversity and abundance patterns across the seasonally flooded wetland area and to what extent the detection and interpretation of these relationships was affected by spatial autocorrelation in waterbird and landscape variables and their statistical models.

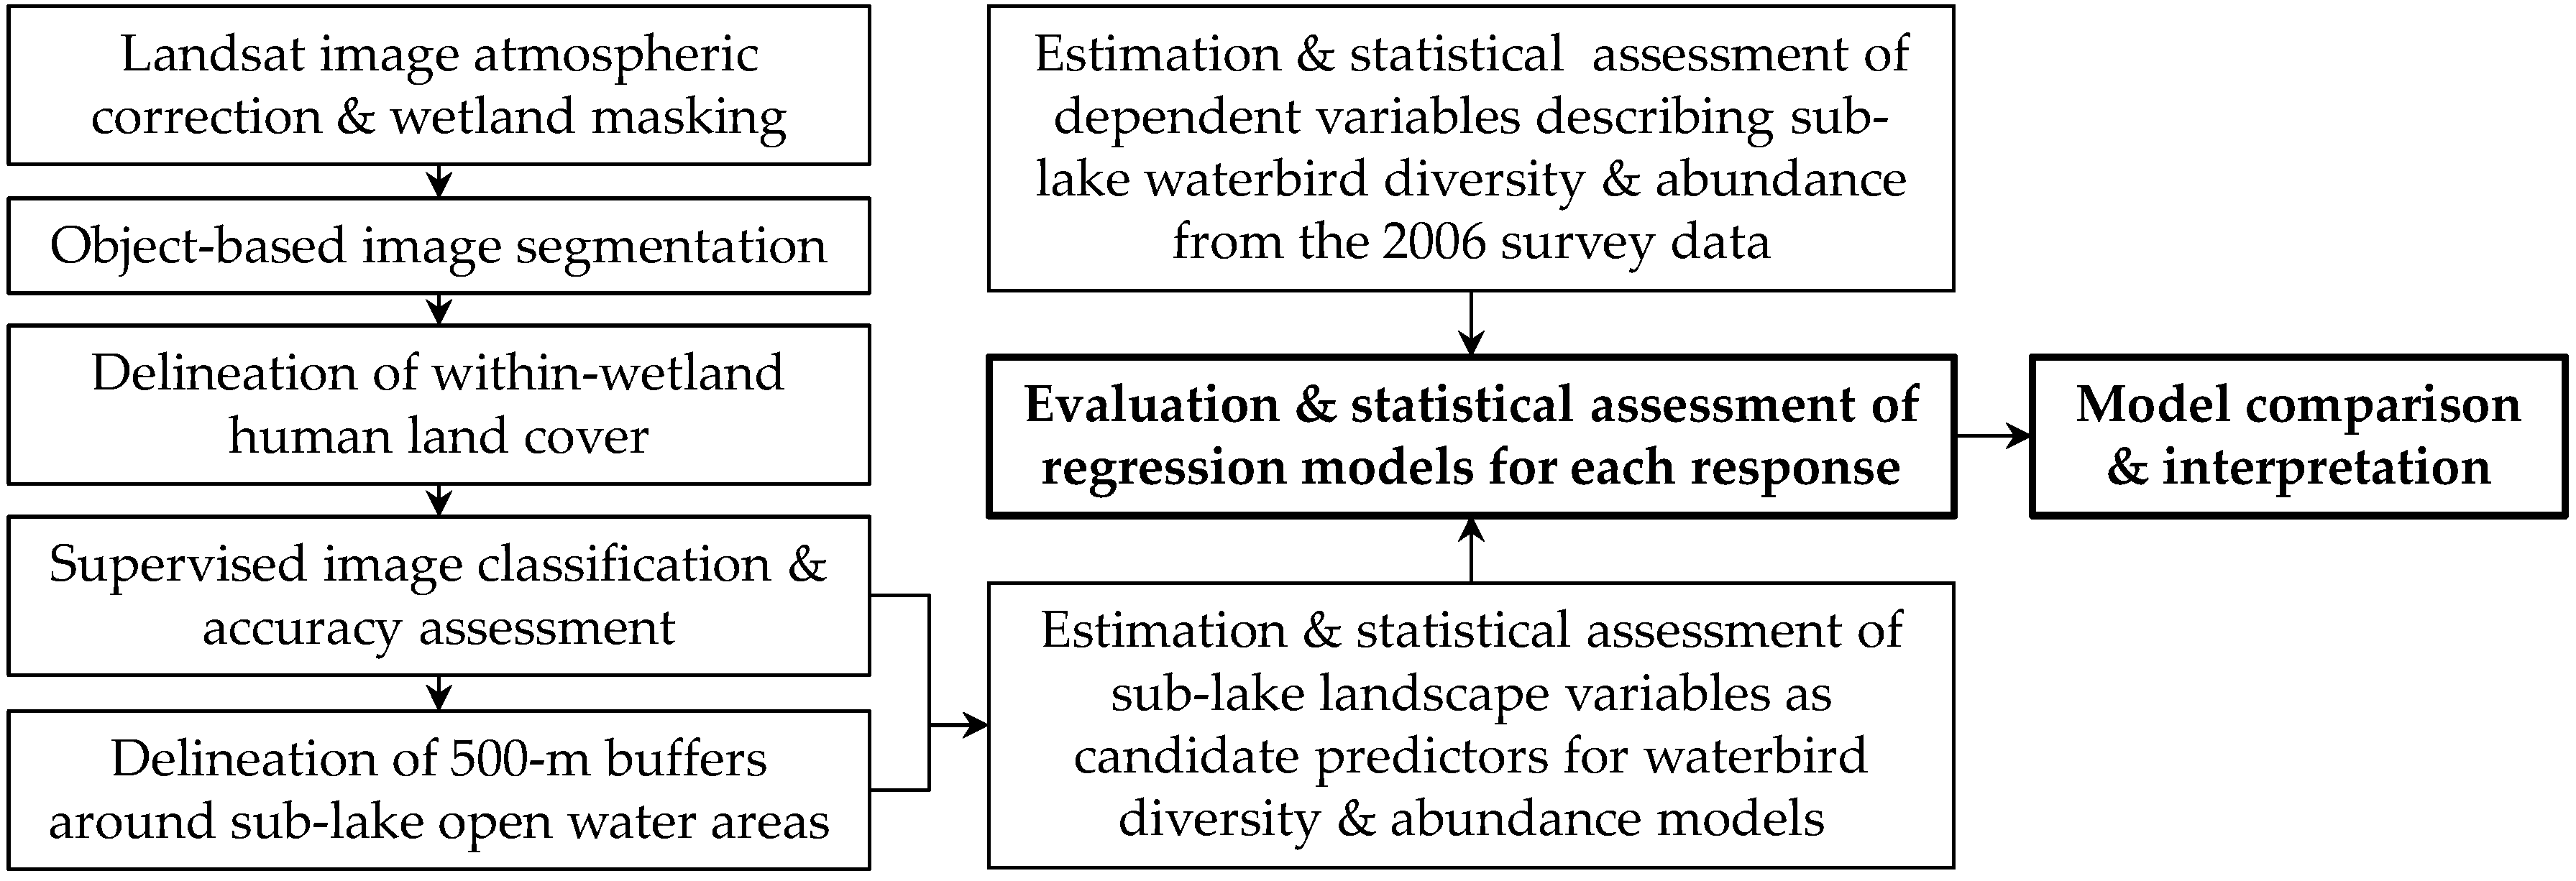
2. Materials and Methods

2.1. Study Area

Poyang Lake is located in the middle Yangtze River basin, Jiangxi Province, China (28°25′N–29°45′N, 115°48′E–116°44′E; Figure 1). Its surface exhibits considerable year-round hydrological variation where water coverage at the highest summer flood stage in July–August can exceed 4000 km2, while in winter it reduces to less than 1000 km2 [55,56] exposing rivers, channels and smaller sub-lakes. At these sub-lakes, waterbirds are often observed within 500 m or less of the water boundary along the inundation gradient from water 0.5–5 m deep to mudflats and higher-elevation emergent grasslands [44,45]. Some of these sub-lakes have been important diversity hotspots in local nature reserves [43,44,54,57].
The immediate spatial neighborhoods of winter sub-lakes often have gentle slopes with slow change in elevation and belt-shaped zonation of emergent wetland cover types ranging from shallow water to mudflats to emergent grassland dominated by sedges (Carex spp.) and forbs [45,57,58]. Some of the submerged aquatic macrophyte species (e.g., Vallisneria spp. and Stuckenia pectinata) overwinter in the form of tubers buried in lake sediment. Although “invisible” to remote sensors, these tubers provide critical food resources to bird foragers from the tuber-feeding guild [40,43,45,59]. Some areas of Poyang Lake also retain photosynthetically active submerged and floating macrophytes from other taxa during the cool growing season [44,51]; however, the specific role of this vegetation in wintering waterbird habitat relationships remains unclear to date.

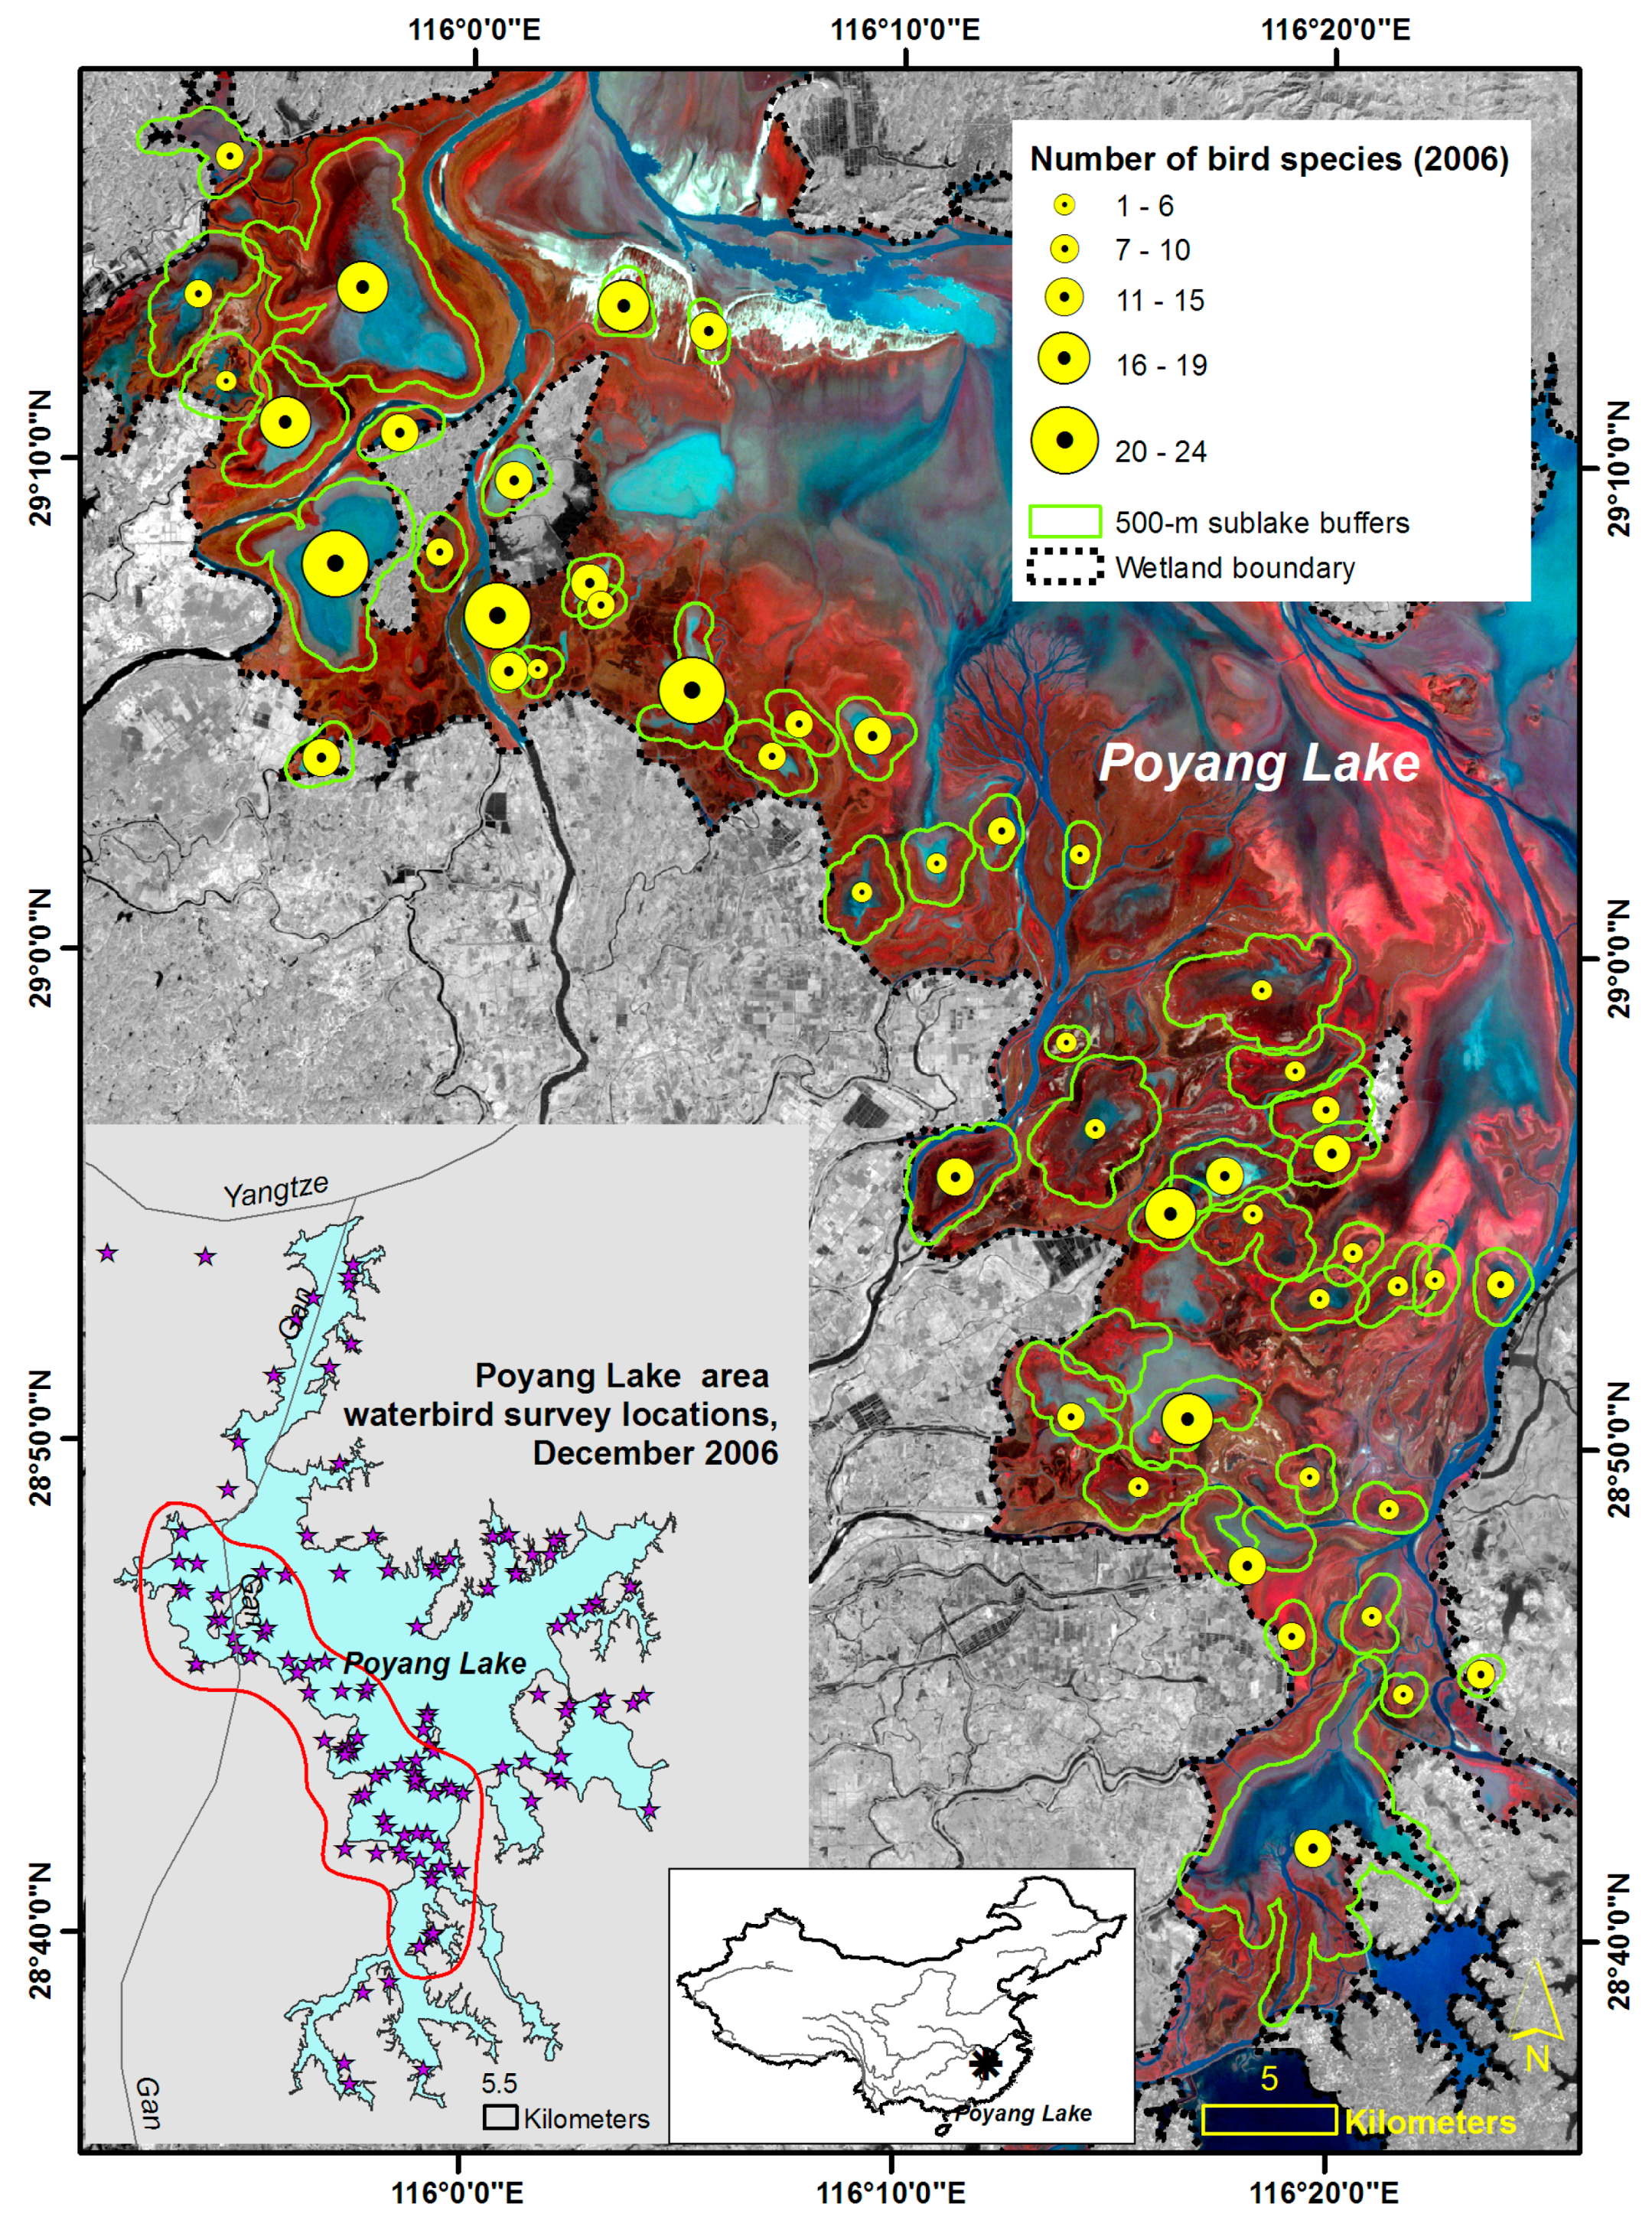
2.2. Waterbird Survey of 2006 and Dependent Variables

Our study used the data from the basin-wide point-count waterbird survey in 15–25 December 2006, obtained with permission from the State Key Lab of Remote Sensing Science (the Chinese Academy of Sciences, Beijing, China) who jointly organized it with the State Key Lab of Poyang Lake Ecology and Environment at Jiangxi Normal University, Nanchang, China, and local nature reserves [44,60]. The survey included 138 target locations representing permanent sub-lakes, water reservoirs near cities and selected vantage points at the shorelines of rivers and channels within the Poyang Lake area (Figure 1). Bird species identification and counts were performed by field technicians using binoculars and telescopes [42,60] and then reported as summaries for each observation location along with one, rarely two, geolocated GPS point(s) marking the primary spatial position of observers. For the purposes of this study, we focused on the data from 51 sub-lakes representing permanent water bodies in western, southwestern and southern part of the lake basin (Figure 1) that were part of the seasonally inundated wetland area. Because of the uncertainty in spatial position of observers relative to birds [60], the whole sub-lakes were used as the units of spatial analysis. It should be also acknowledged that the single-event 2006 bird survey represented only a phase in the wintering season and did not allow us to estimate the observation error or extrapolate results beyond this time frame. We further discuss the implications of this constraint in Section 4.3 below.
Our analysis specifically targeted resident and migratory Poyang Lake waterbirds from the orders of Podicipediformes, Pelecaniformes, Suliformes, Ciconiformes, Anseriformes, Gruiformes and Chradriiformes. Six major foraging guilds were defined among them based on the long-term Poyang Lake ecological research by the International Crane Foundation [40,45] and other studies in this region [7,8,43,44,53,59,61,62] and other wetlands [63]: (1) tuber feeding; (2) sedge/grass eating; (3) seed eating/dabbling; (4) benthic insect/larvae eating; (5) fish eating; and (6) zooplankton eating. Four size groups were also designated: (1) larger floating birds; (2) smaller floating birds; (3) large waders; and (4) small shorebirds. From the bird counts at 51 selected sub-lakes, we quantified dependent variables (Table 1) for the models of their relationships with remotely sensed wetland characteristics. These included four alpha-diversity indices (species richness, or the total number of species per sub-lake; Shannon index; number of foraging guilds and number of size groups), total number of waterbirds and the number of tuber-feeders. This latter guild was given special attention because it includes conservation targets of international importance with four out of five species that are threatened or endangered with recently reported declines in the study region [41,59].
Both abundance variables had non-normal distributions due to large number of small values, similar to other studies [7,8,18]. For the number of birds, natural logarithm transformation significantly improved the normality. However, the number of tuber-feeders had zero values at 12 sub-lakes. Thus, for the number of tuber-feeders, we applied and compared two different strategies: (1) statistical transformation of their counts using natural logarithm+1 for linear regression models to alleviate the skewness and compare results with models with other response variables; and (2) the alternative negative binomial regression modeling of the non-transformed variable to address the potential zero inflation (discussed in Section 2.4 below).

2.3. Independent Variables Based on Remote Sensing Data

We characterized major wetland cover types and their landscape metrics for subsequent bird diversity and abundance analyses (Figure 2) using a terrain-geocorrected (Level 1T) Landsat 5 TM satellite image of 6 January 2007. Digital numbers from six 30-m spatial resolution bands representing visible (bands 1–3), near-infrared (band 4) and shortwave-infrared (bands 5 and 7) portions of the electromagnetic spectrum were corrected to radiance at the sensor using sensor-specific radiometric calibration coefficients [64] and then to ground surface reflectance using 6S algorithm [65,66]. We then isolated wetland area by digitizing its hydrological boundaries shaped by levees using a high-resolution basemap imagery layer in ArcGIS 10 (Esri Inc., Redlands, CA, USA). Basemap images in ArcGIS are compiled from high-resolution remote sensing data provided by Esri partners and streamlined directly into the ArcMap window [67].
We then segmented wetland area into small spectrally homogeneous groups of pixels, i.e., objects, followed by their statistical classification into wetland cover types (Figure 2) using a multiresolution segmentation tool in eCognition 8.0 software (Trimble Inc., Sunnyvale, CA, USA) which allows for flexibility in the output object sizes. Due to the lack of prior information on wetland patch structure, segmentation parameters prioritized spectral band values in object generation, while shape and compactness were kept at low values of 0.1 each. Following Reference [57], we used a value of 8 for the scale parameter which controls maximum level of heterogeneity and object size [68]. As a result, most primitive objects exceeded Landsat pixels, and their median size was ~19 pixels.
Prior to classification, we visually interpreted and labeled objects corresponding to residential and other human land cover within sub-lake neighborhoods using again the high-resolution basemap imagery in ArcGIS 10. Then, we classified wetland area into common cover types that were hypothesized to represent suitable and non-suitable habitat (Table 2): Open water, mudflat, sand, flooded vegetation, green emergent C3 grasses, senescent grasses and burned vegetation. For these classes, we assigned 222 objects for classification training and 300 separate objects for accuracy assessment using several sources of reference data from March 2006 to April 2008 (because no field assessments of wetland cover were performed at the time of the 2006 bird survey). Reference objects were selected to represent homogeneous regions of target cover types (Table 2) based on (1) their spatial overlap with transects and locations of several field surveys at Poyang Lake in March 2006, March 2007, December 2007, April 2008 where vegetation and other types were recorded along with field photographs of surveyed areas (performed by the State Key Lab of Remote Sensing Science (the Chinese Academy of Sciences, Beijing, China); and (2) visual interpretation of cover types from the reference high-resolution imagery from DigitalGlobe Worldview-1 and QuickBird satellites for November and December 2007, provided for a portion of the study area by the National Aeronautics and Space Administration (NASA) and The National Geospatial-Intelligence Agency (NGA) NextView program [69]. Classification was performed in open-source Weka 3.6.5 software (University of Waikato, Hamilton, New Zealand; [70]) using a supervised k-nearest neighbor algorithm. Object mean values of Landsat bands 3–5 and 7 and spectral indices representing normalized differences between bands 3 and 4, 2 and 4 and 2 and 5 were used as discriminating features. Classification accuracy was quantified as the agreement between reference classes of test objects and their respective mapped categories using confusion matrices.
From the classification results, we selected open water and flooded vegetation together as proxies of the extent of inundated areas at the time of image acquisition. We then constructed 500-m buffer neighborhoods around these sub-lake areas in ArcGIS 10 (Figure 1 and Figure 2) and within those estimated thirteen metrics subsequently used as candidate predictor variables in diversity and abundance models (Table 3). These variables were informed by previous research at Poyang Lake and other wetlands [17,19,43,45,60] and selected so as to minimize both conceptual redundancy and statistical multi-collinearity. Several independent variables had highly skewed distributions that were corrected to improve normality using natural log transformation (total sub-lake area) and square root transformation (proportions of mudflat, emergent grassland and flooded vegetation).

2.4. Model Selection and Diagnostics for Spatial Autocorrelation

For each response variable (Table 1), we first constructed multivariate ordinary least squares (OLS) linear regression models with different sets of predictors in MATLAB R2012a software (MathWorks Inc., Natick, MA, USA). We then ranked these models using the Akaike Information Criterion corrected for the small sample size (AICc) following [71]:
A I C c = 2 l n L + 2 k + 2 k ( k + 1 ) ( n k 1 )   ,
where lnL is the model log-likelihood, k is the number of parameters to be estimated and n is the number of observations in the model. This approach was chosen to allow the relative comparison of models with different predictor sets, as well as OLS and spatial regression results for a given predictor combination. However, with 13 predictor variables, the number of their theoretically possible combinations becomes extremely large, and the risk of multi-collinearity increases as more predictors are included in regression. For these reasons, we estimated regression parameters and AICc only for the models with 5 or fewer predictors, and for the final set of candidate models we considered only the models within 2 AICc units from the minimum AICc [71]. To further account for the zero values in the number of tuber-feeders, we separately estimated a zero-inflated negative binomial regression in R (Version 3.2.4; R Development Core Team 2016, Vienna, Austria) with the package pscl (Version 1.4.9 [72,73]). This approach estimates a two-component negative binomial model for bird counts with the assumption that the data may include both “true” zero counts for the tuber-feeders, and “excess” zeros, e.g., sub-lakes that are never visited by this guild [73]. The output models were ranked using AICc, and selected predictor sets with the strongest support were compared to those in OLS results.
Next, we examined spatial dependence in response and predictor variables using Anselin’s local indicators for spatial association (LISA; [74]) in GeoDa spatial analysis software [75] and then tested for significant spatial autocorrelation in OLS regression. A matrix of spatial weights W was calculated based on Euclidean distances between sub-lakes and then used to perform Lagrange Multiplier (LM) tests for spatial dependence in OLS. When significant spatial autocorrelation was detected, we further estimated two maximum-likelihood linear spatial autoregressive models in GeoDa [75]. The first one was the spatial lag model, which accounts for a second-order spatial interaction between localities based on their proximity:
y = X β + ρ W y + ε   ,
where β indicates coefficients for the predictor variables X, ρ is the spatial autoregressive coefficient on the matrix of weights W applied to response values from spatial neighbors of each data point and ε is the random error term. The second form of spatial regression was the spatial error model which accounts for spatial autocorrelation in the model error structure:
y = X β + λ W ε + ε   ,
where λ is the spatial autoregressive coefficient for the error term. We then compared statistics for individual predictors and model AICc among OLS and spatial regression results.

3. Results

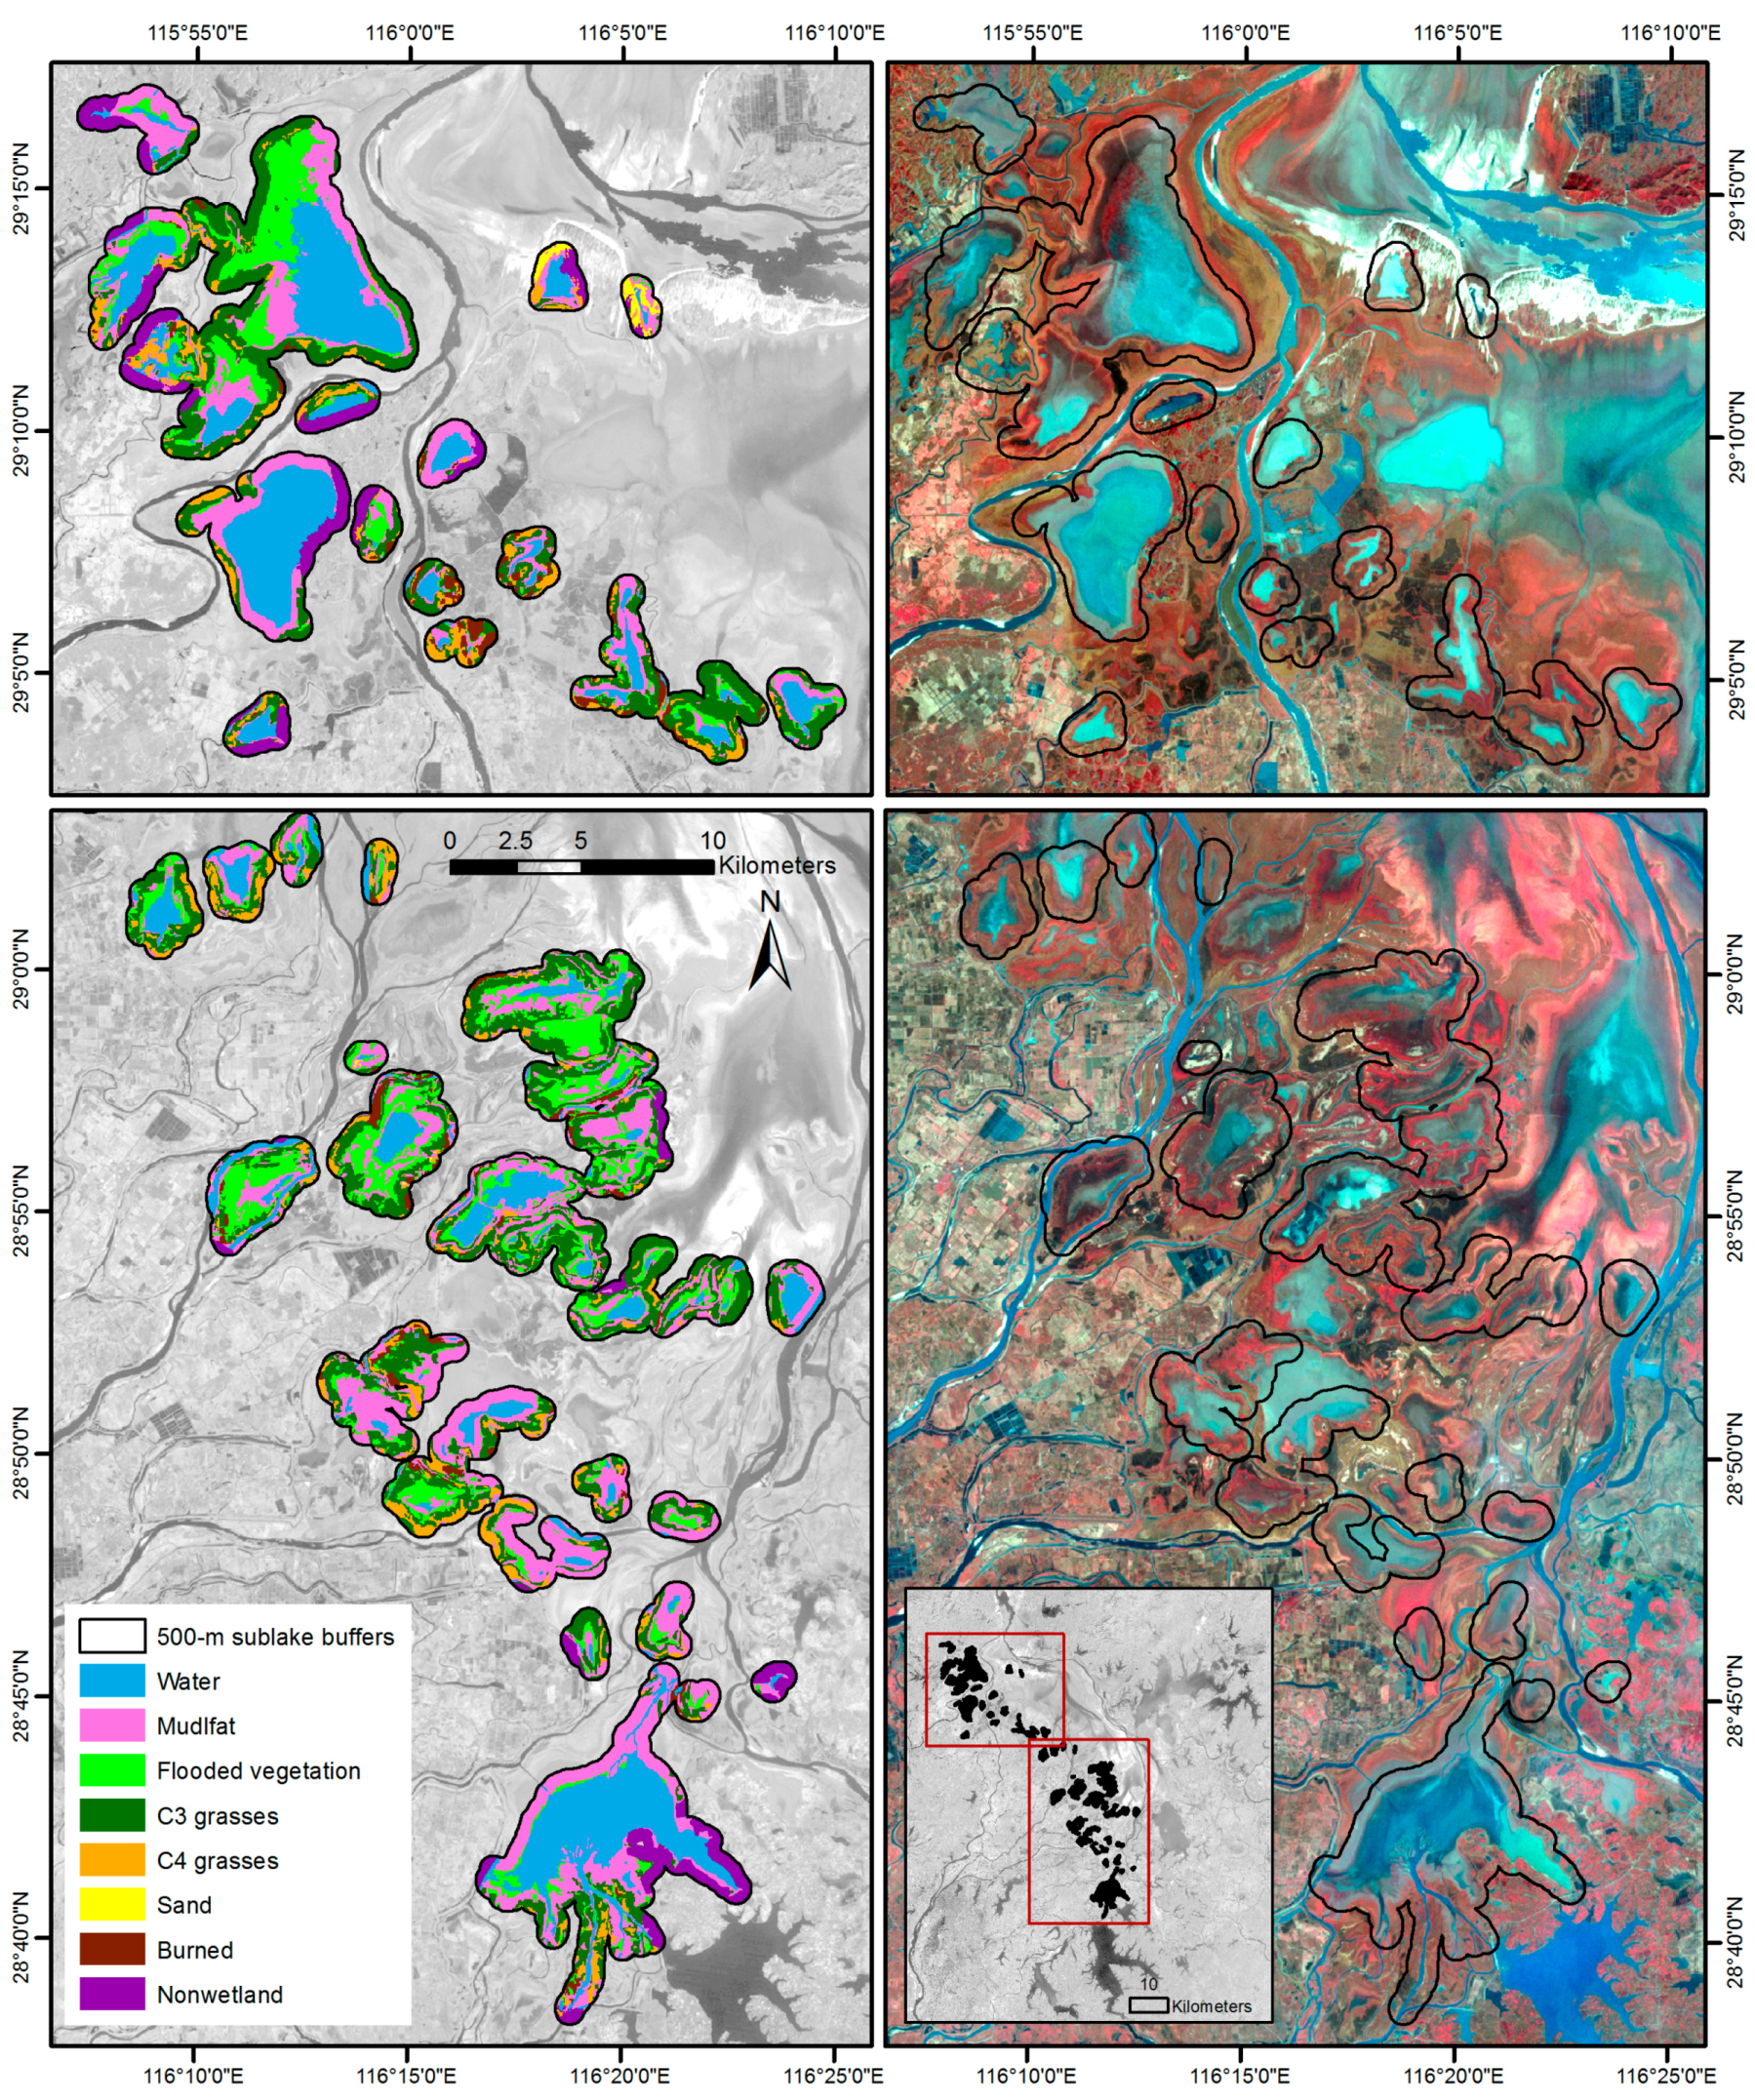
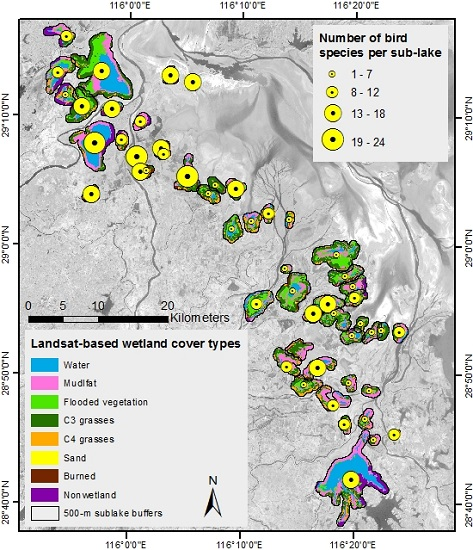
3.1. Image Classification Results

The supervised classification of the Landsat image had the overall accuracy of 94.3% and kappa statistics value of 0.93 (Table 4). The confusions occurred between turbid shallow water and mudflat, flooded vegetation and mudflat or burned vegetation, and between emergent and senescent vegetation in mixed-cover areas, similar to other studies of this region [10,57,58]. Sand was detected in 15 sub-lakes, and only in three cases exceeded 2% of sub-lake area. Given limited presence of this class and its primary concentration near dunes in the upper northern part of the study region (Figure 3), sand metrics were not included in subsequent regression analysis.

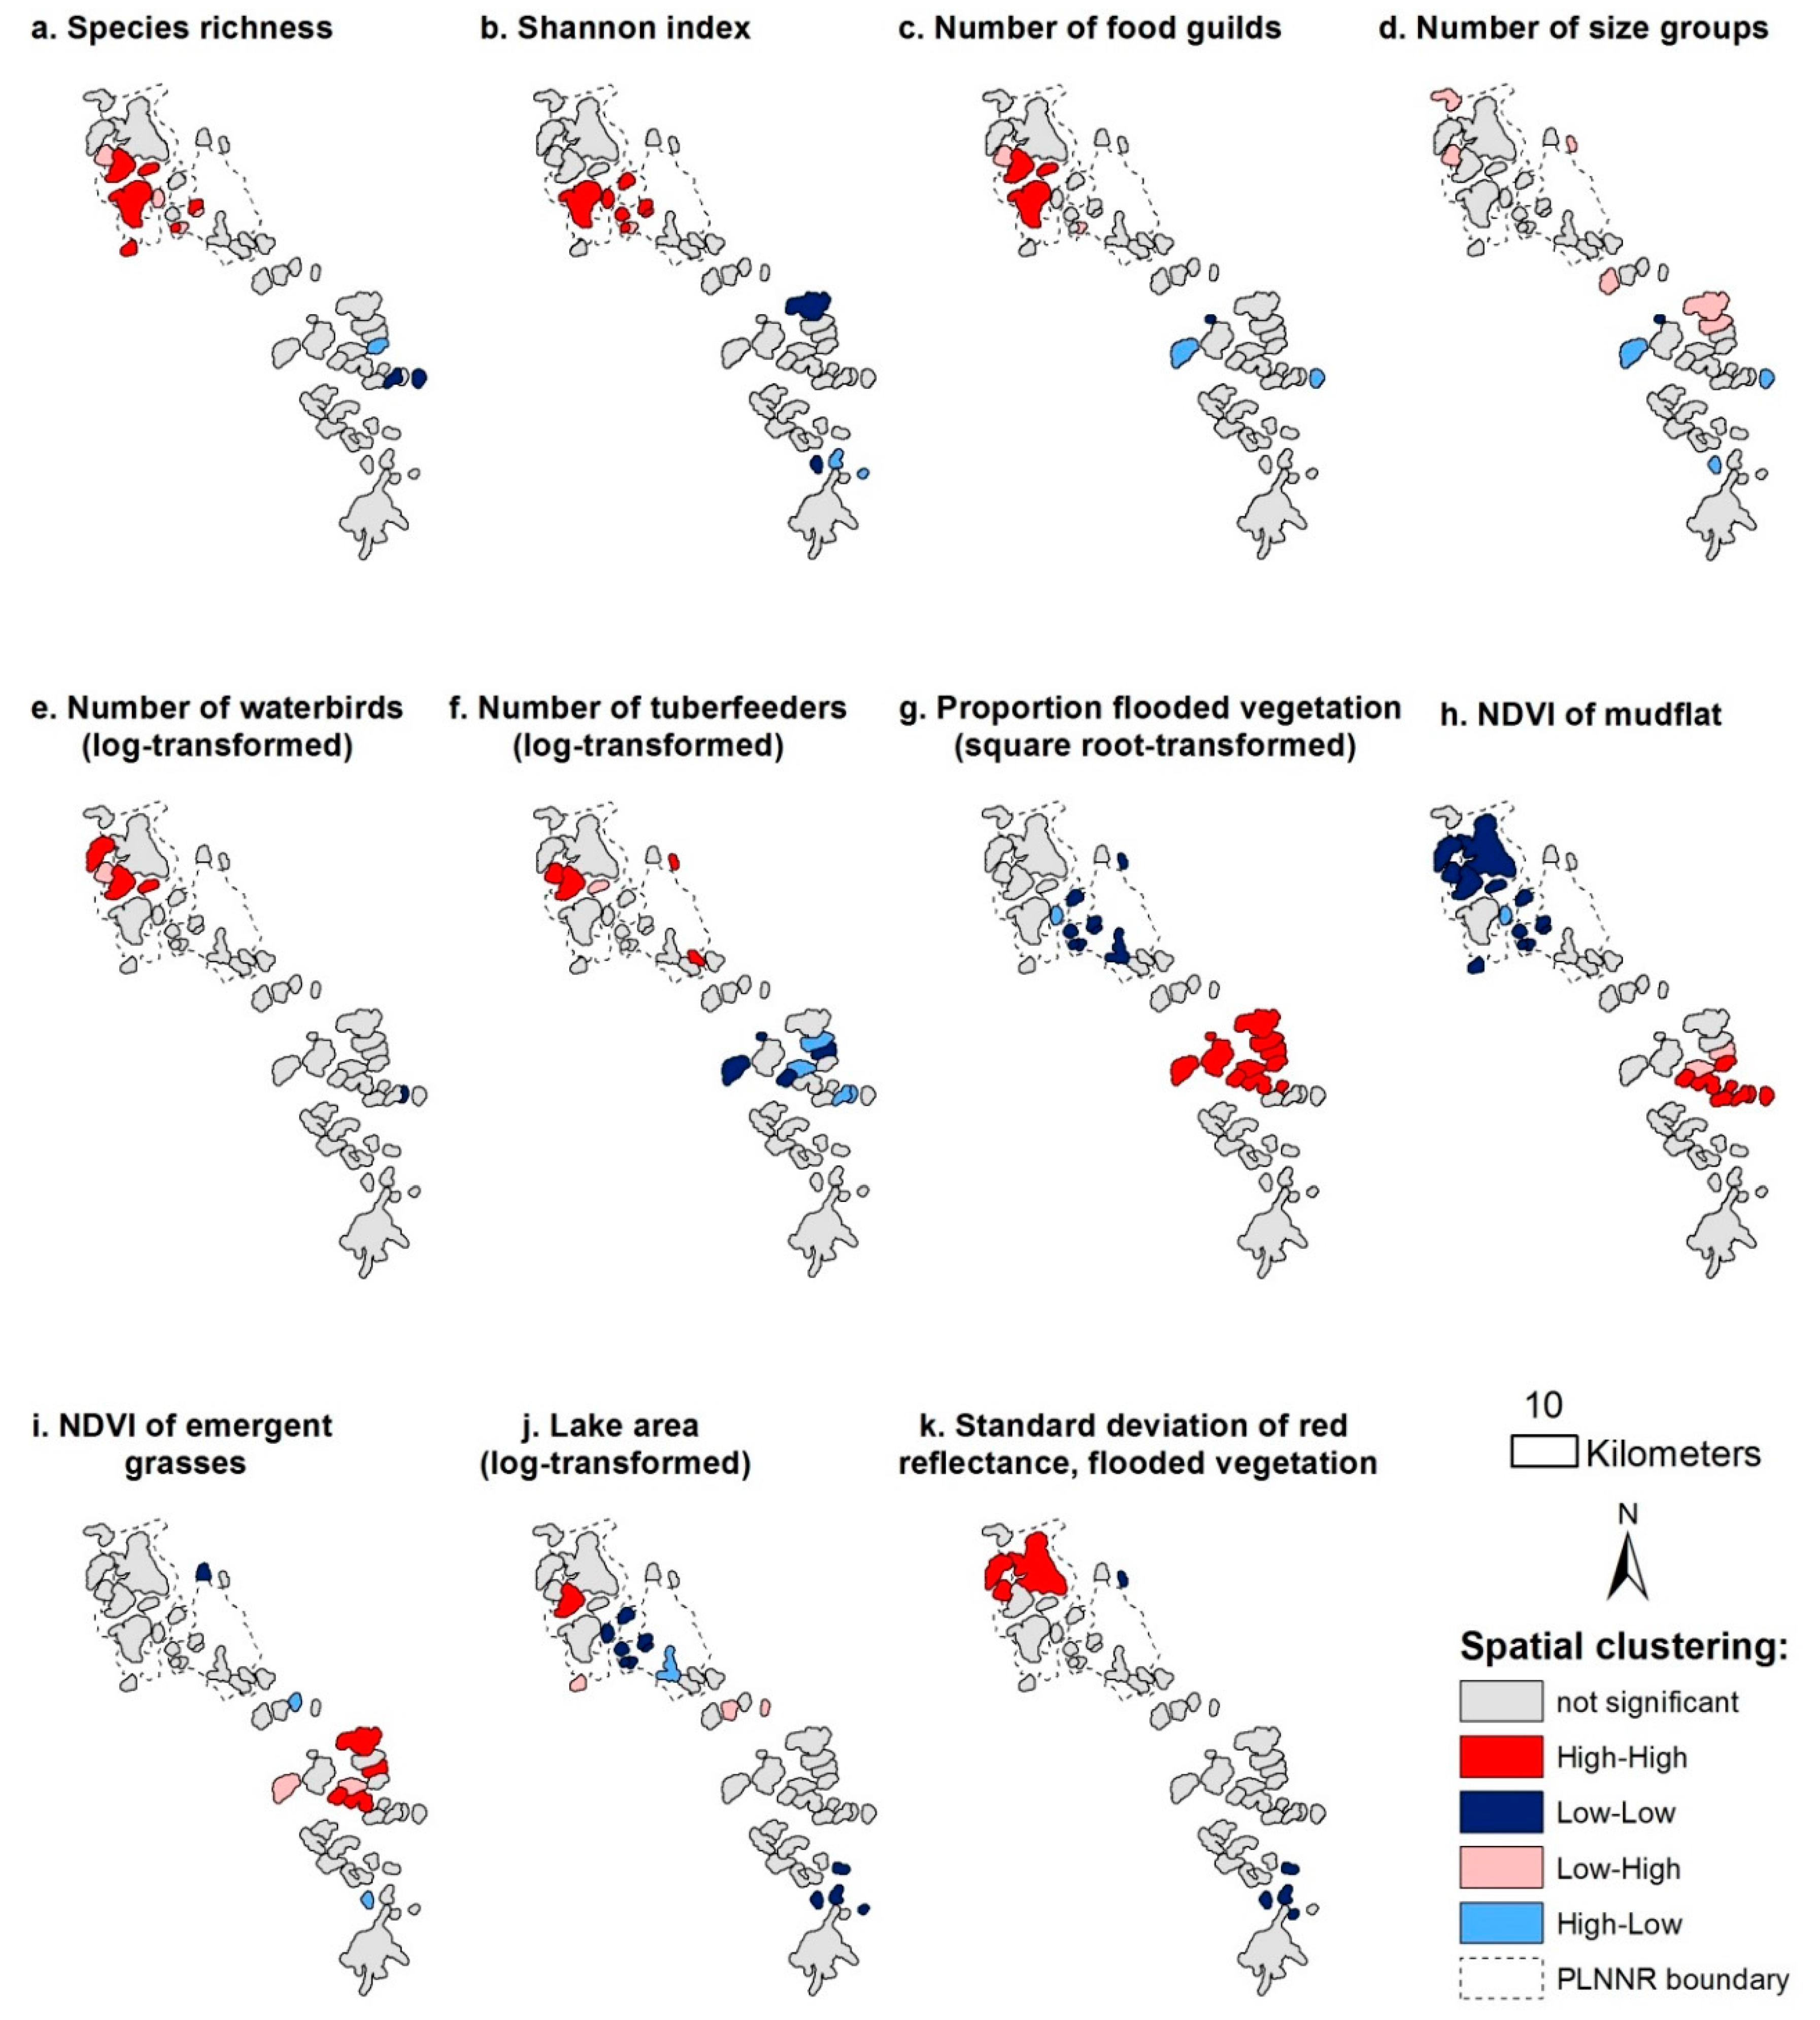
3.2. Spatial Patterns of Response and Predictor Variables

Total number of species varied from two to 23 among 51 sub-lakes (Table 1), and the proportional species turnover [76] was equal to 0.86, suggesting that an average sub-lake contained only ~14% of the overall species richness. Local spatial autocorrelation of response variables was not uniform across the landscape and concentrated in a few statistically significant “hotspots” (Figure 4). Species richness, Shannon index, number of food guilds, number of birds and number of tuber-feeders showed significant clustering of spatially close high values at several lakes within Poyang Lake National Nature Reserve (PLNNR; Figure 4a–c,e,f). For species richness, Shannon index and the number of tuber-feeders there were also clusters of low values and high-low associations in the southeastern part of the study area (Figure 4a,b,f) within the Nanjishan National Nature Reserve. The number of size groups showed several low-high and high-low instances of negative spatial dependence, including those in PLNNR reserve (Figure 4d).
Among predictor variables, the proportion of flooded vegetation and mudflat NDVI had significant aggregations of high values in the southeastern portion of study area and clusters of low values in PLNNR (Figure 4g,h). The NDVI of emergent grasses also showed clusters of high values in the southeastern region and several clusters of high and low values (Figure 4i). Sub-lake area had clusters of low values associated with small lake groupings in northeastern and southern portions of the study area (Figure 4j). Standard deviation of red reflectance of the flooded vegetation showed a cluster of high values in PLNNR and clusters of low values in other parts of the region (Figure 4k). Significant local clustering in both response and predictor variables based on these results indicated potential risk of violating assumptions of the ordinary linear regression due to spatial dependence.

3.3. Variable Selection in Regression Models

Relative importance of independent variables in the univariate OLS models varied among diversity and abundance metrics (Table 5). Spectral greenness (NDVI) of mudflat with a negative effect was consistently among the strongest predictors, while other important variables included proportion of flooded vegetation with negative effect, for the numbers of food guilds and size groups—total sub-lake area with positive effect, and for species richness and Shannon index—spectral heterogeneity of mudflat or flooded vegetation, respectively (Table 5). Combinations of 2–3 of these variables were also frequently included in the lowest AICc multivariate models for each response variable (Table 6). However, none of the univariate models in Table 5 was within 2 AICc units from the minimum-AICc multivariate models in Table 6.
Multivariate models within 2 units from the lowest-AICc outcome included three to eight candidate sets for a given response variable (Table 6 and Table 7). These frequently included sub-lake area with positive effect and mudflat NDVI and proportion of flooded vegetation with negative effects (Table 6). The NDVI of emergent grasses with positive effect was also included in OLS models for all dependent variables except the number of tuber-feeders (Table 6). Other predictors in the highest-support multivariate models differed among response variables and included spectral heterogeneity of flooded vegetation with positive effect, proportions of human land use with positive effect and burned vegetation with negative effect, and for abundance response variables—also, object shape heterogeneity of emergent grassland with negative effect (Table 6). Predictors selected by the highest-rank zero-inflated negative binomial models for the number of tuber-feeders (Table 7) were consistent with the OLS results (Table 6), including sub-lake area and NDVI of emergent grassland with positive effects and object shape heterogeneity of emergent grassland, proportion of burned vegetation, NDVI of mudflat, and proportion of flooded vegetation with negative effects in the count model component. The latter two predictors were also selected in the zero-inflated model component with positive effects (Table 7).
Notably, the strongest multivariate models for different response variables often included similar predictors. For instance, sub-lake area, proportion of flooded vegetation and NDVI of emergent grassland were often selected together and formed the key component of all lowest AICc models for number of food guilds and number of size groups (Table 6). In the models for species richness and two abundance metrics, NDVI of mudflat was often included together with heterogeneity of object shape index for emergent grasses (Table 6 and Table 7). The interactions among predictors were also tested; however, most of them appeared to be not significant and did not contribute explanatory power comparable to the best-fit multivariate sets in Table 6.

3.4. Spatial Autocorrelation in Linear Regression Models

Significant spatial autocorrelation was detected in the OLS models for species richness, number of food guilds and two abundance variables (Table 6). Spatial regression successfully corrected this effect in most cases as indicated by GeoDa diagnostics of these models; however, goodness-of-fit was only marginally affected. Most of the changes in AICc with spatial regression were within 2 units from a corresponding OLS model (Table 6), in part because both spatial models estimate one additional parameter relative to OLS, which penalized their AICc values.
For species richness, spatial error model had stronger support than spatial lag model when significant spatial autocorrelation was detected (Table 6), and the lambda coefficient in spatial error model was significant with p-value < 0.05. For the number of food guilds and the number of birds, spatial lag model had higher support than spatial error regression (Table 6) in case of significant spatial dependence in OLS. Applying the lag model also slightly changed model ranks and reduced the number of candidate models within 2 units of AICc from the minimum (Table 6). For the number of tuber-feeders, spatial lag models had slightly lower AICc than corresponding spatial error models (Table 6). However, the latter models for this response variable no longer had significant spatial dependence for weight matrix (p-values > 0.05). For the number of size groups and Shannon index, LM tests in GeoDa did not detect significant spatial dependence in favor of spatial regression.

4. Discussion

4.1. Remotely Sensed Indicators of Poyang Lake Bird Diversity and Abundance

The degree to which spatial and temporal biodiversity patterns can be interpreted with indirect but cost-effective geospatial habitat proxies is an important pre-requisite for comprehensive landscape-scale monitoring of vulnerable ecosystems globally. Our analysis highlighted several landscape variables associated with waterbird diversity and abundance at Poyang Lake, China based on the remotely sensed characteristics of their wintering habitat from Landsat satellite data. In particular, statistical importance of sub-lake open water area was consistent with evidence from other wetland regions [12,13,17,77,78] and the significance of shallow water extent in waterbird abundance models in a previous Poyang Lake study [7]. This outcome likely represented the effect of lake size on the amount and potential diversity of food resources and foraging space.
Strong negative effect of mudflat NDVI on all response variables indicated the importance of mudflats with lower green vegetation cover and/or wetter surface. Mudflats with such properties may represent lake beds with more recent post-flood exposure [10,51] that contain aquatic invertebrates, vegetation seeds, propagules and tubers of the summer-season aquatic macrophytes [40,43] and, thus, support birds of different size and foraging preferences. The size of mudflat was previously reported to positively contribute to bird abundance, and negatively—to species richness based on the study of 10 Poyang Lake sub-lakes [7]; however, in our models the proportion of mudflat area was not as important. The latter result may indicate potential availability of unoccupied wintering habitat, with sub-lake environments providing more suitable territories and resources than current bird populations could utilize.
Positive association of emergent grassland NDVI with bird diversity and abundance was consistent with previous terrestrial studies [14,20,24,37] and a recent analysis of selected waterbird species’ habitat across Yangtze River wetlands [12]. These relationships may be attributed to potential correlations between NDVI and plant density, biomass and foliar nutrient content [79,80], which play important role in habitat quality [53,62]. At Poyang Lake, green sedges provide a critical food resource to Anatidae of the grass-eating guild, which forage in large numbers [12,45,49,53,60] and contribute to both bird diversity and abundance at sub-lakes with this vegetation type. However, relative size of emergent grassland was not among the main predictors, suggesting, again, that the available grassland habitat could exceed the demand of surveyed bird populations.
The importance of metrics related to variation in spectral and shape properties within grasslands and flooded vegetation was consistent with the expectation that more heterogeneous habitats may favor diverse avian communities and foraging opportunities [7,13,21,26,81]. A previous study of Poyang Lake bird diversity and abundance from 10 sub-lakes [7] reported the importance of the number of wet meadows and a form of shape index for waterbodies that were also related to habitat complexity. While specific ecological roles of heterogeneity should be investigated in the future, this collective evidence suggests that landscape complexity of wetland habitats should be considered in the analyses of diversity and abundance in addition to presence and extent of the relevant cover types. Estimation of heterogeneity metrics may especially benefit from remote sensing due to comprehensive spatial coverage of limited-access wetlands.
Significant negative correlation of most diversity and abundance variables with the proportion of flooded vegetation raises a question on what features make the sub-lakes less conducive to high diversity and abundance [60]. Potential ecological benefits of aquatic macrophytes growing in winter to waterbirds are less well understood at Poyang Lake than the importance of emergent grasses [49,53] or tubers of the warm-season aquatic plants [43,45]. Flooded vegetation types that are not preferential to birds or compete with their primary food species may indicate sub-lake differences in habitat quality, which may be important in light of reported declines in tuber-producing species along central Yangtze River [1,59,82,83]. Higher proportion of flooded vegetation could also indirectly signal other habitat characteristics; for instance, shallower water column allowing for greater abundance of macrophytes may restrict activities of diving and swimming species.
Although proportions of cover types directly associated with potential human disturbance within lake neighborhoods were not frequently associated with response variables, similar to evidence from other wetlands [18], we cannot rule out the potential effects of human disturbance on bird distributions and statistical importance of other variables. For instance, larger sub-lakes may provide better opportunities to avoid human presence, while higher greenness of some emergent grasslands may be driven by lower grazing pressure by domestic livestock due to limited wetland access. A variety of human-driven stressors at Poyang Lake, such as poaching, fishing, and livestock herding [5,43,49], may not be captured with remote sensing data alone. Hence, future work should incorporate the information on roads, elevation, and soil characteristics to more explicitly address the effect of human activities on bird spatial distribution and behavior.
Our results also show that sets of predictors describing complementary habitat features may be more useful in models of diversity and abundance than single variables. Consistent inclusion of several predictors in the lowest AICc models (Table 6) suggests that not only their individual importance, but also their synergy could elucidate conditions favoring certain diversity levels. Collectively, results indicate that bird community diversity and abundance were on average higher in larger sub-lakes with relatively small but heterogeneous component of flooded vegetation, non-vegetated mudflat and green emergent grassland with more uniform patches. This description matches several spatially close lakes that have been previously reported as diversity hotspots [42,43,45,54]. In contrast, smaller sub-lakes with more flooded vegetation in winter and the lack of bare mudflat were associated with lower diversity and abundance and exhibited spatial clustering with respect to these two characteristics. However, the latter conditions should not be immediately interpreted as “non-desirable” for wetland management, since theoretically they might be critical for selected bird species or their diet components, which should be investigated in the future.

4.2. Spatial Autocorrelation in Diversity and Abundance Models

Significant spatial autocorrelation detected in multiple models with high support presents an important caveat for landscape analyses of bird diversity and abundance due to the risk of violating key assumptions of linear regression. Our results suggest that significant spatial autocorrelation in selected models could arise both from model specification and from the underlying spatial patterns in landscape variables (Figure 4). Specifically, higher effectiveness of spatial error models at correcting for spatial autocorrelation for species richness likely reflected the absence of important but spatially structured variables [84], such as the availability of tubers from warm-season summer aquatic plants [43] that were not sampled in the 2006 bird survey. The importance of spatial error models may also question the utility of sub-lake units to represent spatial patterns in diversity, particularly among adjacent water bodies which may be utilized by the same bird flocks more frequently and thus function as a single landscape unit in representing bird communities (Figure 4).
At the same time, stronger support for spatial lag models for the number of food guilds, the number of birds and the number of tuberfeeders suggests potential importance of yet unknown second-order spatial interactions [34,39] among sub-lakes that should be studied further. For instance, moderate intra-specific or intra-guild competition for resources and foraging space may be hypothesized to force large groups of birds to disperse over spatially close sub-lakes, producing similar community composition and autocorrelated bird counts. Alternatively, spatial autocorrelation in food resources caused by distance-sensitive dispersal of aquatic vegetation, fish and invertebrates could make close sub-lakes attractive to similar bird species and foraging guilds [18]. Location of significant response and predictor clusters within natural reserve territories also suggest that reserve management and restriction of human activities could play a role in these interactions and the overall habitat suitability for avifauna.

4.3. Uncertainties in Models and Study Limitations

Several limitations of this study should be considered in the interpretation and generalization of the findings. A particularly important constraint was the timing of 2006 bird survey which represented only a short-term portion of waterbird distributions during the wintering season. From these data alone, we could not estimate observation error or assess the dynamics of sub-lake habitat use by different species and of the wetland landscape itself. Although major clusters of bird diversity in these data were generally consistent with reports from other years [44,54], one-time surveys make it problematic to verify whether bird distribution displayed their “typical” spatial pattern of the winter season or had been affected by a temporary “aggregate shock” e.g., due to prior burning of reeds across the wetland in 2006. Unfortunately, most of the basin-wide Poyang Lake surveys to date has been conducted as a one-time effort per winter, with different method of observation and timing within the season, which limits the possibility of their comparisons and remains an important challenge for monitoring programs [42,44,54].
The unexplained variation in regressions also suggests that useful predictors could be missing from the model structure. Water level may be such a key missing factor which often determines spatial location of waterbirds within the study area and access to food resources [8,43,45]; however, spatially explicit water level data have not been monitored at the sub-lake scale in the Poyang Lake region. Finally, study results could be affected by more general constraints of remote sensing analyses in wetlands, such as heterogeneity of wetland surface as a challenge to classification accuracy that may be partially addressed by OBIA [29,57,85] and relatively coarse resolution of 30-m Landsat data obscuring local patterns of vegetation composition and micro-topography [57].

4.4. Implications for Wetland Management and Conservation

Our results corroborate the utility of remote sensing to provide cost-effective, landscape-scale habitat variables to complement ground observations and ultimately inform monitoring, management and conservation in vulnerable wetland regions such as Poyang Lake [1,3,12,49,59,61]. In particular, non-vegetated seasonal mudflat and shallow water interfaces with low spectral greenness appear to be important potential targets for these efforts. At Poyang Lake and other periodically inundated wetlands globally [13,77,86], these habitat components may change their spatial position throughout the low water winter season due to fluctuations in adjacent water bodies and spread of emergent grasses [10,51]. Although with the one-time 2006 survey it was not possible to examine whether birds had been “tracking” mudflats, a survey later in winter season of 2009 reported higher waterbird aggregations close to Poyang Lake center [42] where mudflats are expected to become flood-free later than in peripheral sub-lakes [51]. Being directly adjacent to water bodies, mudflat habitats and hence their supported avian groups may be particularly vulnerable to hydrological changes caused by shifts in climate and new water control structures [45,47]. Thus, future management and projections of waterbird habitat should consider pre-allocating for potential redistributions of these cover types throughout the winter season.
Importantly, the “snapshot” patterns of bird distributions and habitat properties from individual surveys and remote sensing images are shaped by seasonal and inter-annual ecological processes and interactions underlying the distribution of foraging space, resources and risk factors [7,8,18,40,43]. Thus, to better understand the effects of selected habitat predictors on bird diversity and abundance, their associations need to be further investigated in the broader spatio-temporal context of wetland dynamics, which can also be greatly facilitated by remote sensing. For instance, seasonal transitions of Poyang Lake habitats may be captured by multi-date remote sensing analyses as “dynamic cover type” analyses of wetland zones with similar patterns of change within annual flood cycles [51,52,58] and then coupled with seasonally repeated waterbird surveys [7,8]. Such analyses are urgently needed at the whole-wetland scale given recent declines in several important waterbird species along the Yangtze River [49] and threats to wetland hydro-ecological regimes from the water control projects [8,45,47,48].
Efforts to improve the frequency of waterbird surveys and incorporate habitat dynamics into the analyses of diversity and abundance may also benefit from complementary remote sensing technology. Near-surface wireless acoustic sensors, phenocam photography and uninhabited aerial vehicle surveys may be used to provide local observations of both bird communities and landscape properties at high spatial resolution and temporal frequency. These datasets may be further combined with the analyses of optical and active remote sensing (e.g., radar) images [51] to fill the gaps in their time series, provide local reference information on limited-access sites and ultimately inform selection and validation of wetland biodiversity and habitat models.

5. Conclusions

Remote sensing offers important strategies to characterize landscape ecosystems and habitats in large wetland regions with constrained field access and limited ecological data. This capacity is critical for understanding the habitat utilization and non-uniform patterns of bird community diversity and abundance that are of high interest to conservation, management and adaptation to future environmental changes. This study investigated spatial relationships among several metrics of waterbird diversity and abundance and remotely sensed characteristics of their wetland habitat at 51 sub-lakes within the Poyang Lake basin, one of the largest Ramsar protected biodiversity hotspots in Southeast Asia. Several landscape variables from Landsat satellite data were strongly associated with bird community metrics, including sub-lake area and spectral greenness (NDVI) of emergent grassland with positive effect and the proportion of flooded vegetation and NDVI of mudflats with negative effect. These associations elucidate the importance of lake size and specific wetland habitat features along the local inundation gradients in explaining bird diversity and abundance patterns beyond species- or guild-specific analyses alone.
Our results also revealed significant spatial dependence in some of the habitat variables and bird diversity and abundance metrics, as well as in their regression models. This spatial autocorrelation leads to violation of linear regression assumptions and points to shortcomings of the model specification, such as the lack of potentially important predictors related to water depth and food resources that have not been yet characterized at the whole-basin scale. At the same time, significant local clustering of both waterbird and landscape variables and stronger support for spatial lag models in some instances suggest that more complex ecological connectivity and second-order spatial interactions may exist among individual sub-lakes and ultimately contribute to the observed bird distributions. This evidence calls for more in-depth future investigations of the second-order spatial interactions among the waterbird community metrics and sub-lake characteristics, as well as for alternative testing of sub-lake aggregations as spatial units of bird diversity, abundance and habitat analyses. Association of detected clusters with local nature reserve territories further supports the relevance of waterbird community analyses using remote sensing-based habitat descriptors to conservation and management at Poyang Lake. To expand the cost-effective potential of remote sensing and improve temporal contiguity of bird and habitat surveying, future efforts should take advantage of complementary sensors including near-surface platforms such as wireless sensor and in situ phenological observations.

Acknowledgments

We acknowledge the waterbird survey data contributions from December 2006 ground survey sponsored by the State Key Lab of Remote Sensing Science at the Chinese Academy of Sciences, Beijing, PR China and the State Key Lab of Poyang Lake Ecology and Environment at Jiangxi Normal University, Nanchang, China, in collaboration with local nature reserves. We thank Lin Wang for the information on wetland vegetation and landscape characteristics from 2006–2008 field surveys that facilitated remote sensing classification and accuracy assessment. We also acknowledge partial financial support of Poyang Lake remote sensing data analysis from the NASA Earth and Space Science Student Fellowship (NNX09AO27H) and the services of the Geospatial Innovation Facility, University of California Berkeley (gif.berkeley.edu) for the object-based remote sensing image analysis.

Author Contributions

I.D. conceived the study and analyzed the data; I.D., S.B. and J.B. participated in the interpretation of data patterns and study results and edited the paper; P.G. contributed bird survey data and advised the remote sensing analysis, I.D. wrote the paper.

Conflicts of Interest

The authors declare no conflict of interest.

Abbreviations

The following abbreviations are used in this manuscript:
MDPIMultidisciplinary Digital Publishing Institute
DOAJDirectory of open access journals
NDVINormalized Difference Vegetation Index
OBIAObject-based image analysis
AICAkaike Information Criterion
PLNNRPoyang Lake National Nature Reserve
ICFInternational Crane Foundation
OLSOrdinary least squares regression
LISALocal indicators of spatial autocorrelation

References

  1. Fang, J.; Wang, Z.; Zhao, S.; Li, Y.; Tang, Z.; Yu, D.; Ni, L.; Liu, H.; Xie, P.; Da, L.; et al. Biodiversity changes in the lakes of the Central Yangtze. Front. Ecol. Environ. 2006, 4, 369–377. [Google Scholar] [CrossRef]
  2. Dudgeon, D.; Arthington, A.H.; Gessner, M.O.; Kawabata, Z.-I.; Knowler, D.J.; Leveque, C.; Naiman, R.J.; Prieur-Richard, A.-H.; Soto, D.; Stiassny, M.L.J.; et al. Freshwater biodiversity: Importance, threats, status and conservation challenges. Biol. Rev. 2006, 81, 163–182. [Google Scholar] [CrossRef] [PubMed]
  3. An, S.; Li, H.; Guan, B.; Zhou, C.; Wang, Z.; Deng, Z.; Zhi, Y.; Liu, Y.; Xu, C.; Fang, S.; et al. China’s natural wetlands: Past problems, current status, and future challenges. AMBIO 2007, 36, 335–342. [Google Scholar] [CrossRef]
  4. Kirby, J.S.; Stattersfield, A.J.; Butchart, S.H.M.; Evans, M.I.; Grimmett, R.F.A.; Jones, V.R.; O’Sullivan, J.; Tucker, G.M.; Newton, I. Key conservation issues for migratory land- and waterbird species on the world’s major flyways. Bird Conserv. Int. 2008, 18, S49–S73. [Google Scholar] [CrossRef]
  5. Cao, C.X.; Zhao, J.; Gong, P.; Ma, G.R.; Bao, D.M.; Tian, K.; Tian, R.; Niu, Z.G.; Zhang, H.; Xu, M.; et al. Wetland changes and droughts in southwestern China. Geomat. Nat. Hazards Risk 2012, 3, 79–95. [Google Scholar] [CrossRef]
  6. De Boer, W.F.; Cao, L.; Barter, M.; Wang, X.; Sun, M.; van Oeveren, H.; de Leeuw, J.; Barzen, J.; Prins, H.H.T. Comparing the Community Composition of European and Eastern Chinese Waterbirds and the Influence of Human Factors on the China Waterbird Community. AMBIO 2011, 40, 68–77. [Google Scholar] [CrossRef] [PubMed]
  7. Guan, L.; Jia, Y.; Saintilan, N.; Wang, Y.; Liu, G.; Lei, G.; Wen, L. Causality between abundance and diversity is weak for wintering migratory waterbirds. Freshw. Biol. 2016, 61, 206–218. [Google Scholar] [CrossRef]
  8. Wang, Y.; Jia, Y.; Guan, L.; Lu, C.; Lei, G.; Wen, L.; Liu, G. Optimising hydrological conditions to sustain wintering waterbird populations in Poyang Lake National Natural Reserve: Implications for dam operations. Freshw. Biol. 2013, 58, 2366–2379. [Google Scholar] [CrossRef]
  9. Ramsar Convention the List of Wetlands of International Importance, 2016. The Secretariat of the Convention on Wetlands (Ramsar, Iran, 1971). Available online: http://www.ramsar.org/sites/default/files/documents/library/sitelist.pdf (accessed on 1 February 2016).
  10. Dronova, I.; Gong, P.; Wang, L. Object-based analysis and change detection of major wetland cover types and their classification uncertainty during the low water period at Poyang Lake, China. Remote Sens. Environ. 2011, 115, 3220–3236. [Google Scholar] [CrossRef]
  11. Feng, L.; Hu, C.; Chen, X.; Cai, X.; Tian, L.; Gan, W. Assessment of inundation changes of Poyang Lake using MODIS observations between 2000 and 2010. Remote Sens. Environ. 2012, 121, 80–92. [Google Scholar] [CrossRef]
  12. Zhang, Y.; Jia, Q.; Prins, H.H.T.; Cao, L.; de Boer, W.F. Effect of conservation efforts and ecological variables on waterbird population sizes in wetlands of the Yangtze River. Sci. Rep. 2015, 5, 17136. [Google Scholar] [CrossRef] [PubMed]
  13. Canepuccia, A.D.; Isacch, J.P.; Gagliardini, D.A.; Escalante, A.H.; Iribarne, O.O. Waterbird response to changes in habitat area and diversity generated by rainfall in a SW Atlantic coastal lagoon. Waterbirds 2007, 30, 541–553. [Google Scholar] [CrossRef]
  14. Nohr, H.; Jorgensen, A.F. Mapping of biological diversity in Sahel by means of satellite image analyses and ornithological surveys. Biodivers. Conserv. 1997, 6, 545–566. [Google Scholar] [CrossRef]
  15. Lavers, C.P.; HainesYoung, R.H.; Avery, M.I. The habitat associations of dunlin (Calidris alpina) in the Flow Country of northern Scotland and an improved model for predicting habitat quality. J. Appl. Ecol. 1996, 33, 279–290. [Google Scholar] [CrossRef]
  16. Moffett, K.B.; Law, J.; Gorelick, S.M.; Nur, N.; Wood, J.K. Alameda Song Sparrow Abundance Related to Salt Marsh Vegetation Patch Size and Shape Metrics Quantified from Remote Sensing Imagery. San Franc. Estuary Watershed Sci. 2014, 12, 2. [Google Scholar] [CrossRef]
  17. Webb, E.B.; Smith, L.M.; Vrtiska, M.P.; Lagrange, T.G. Effects of Local and Landscape Variables on Wetland Bird Habitat Use during Migration through the Rainwater Basin. J. Wildl. Manag. 2010, 74, 109–119. [Google Scholar] [CrossRef]
  18. Pap, K.; Nagy, L.; Balogh, C.; G-Toth, L.; Liker, A. Environmental factors shaping the distribution of common wintering waterbirds in a lake ecosystem with developed shoreline. Hydrobiologia 2013, 716, 163–176. [Google Scholar] [CrossRef] [Green Version]
  19. Fairbairn, S.E.; Dinsmore, J.J. Local and landscape-level influences on wetland bird communities of the prairie pothole region of Iowa, USA. Wetlands 2001, 21, 41–47. [Google Scholar] [CrossRef]
  20. Hurlbert, A.H.; Haskell, J.P. The effect of energy and seasonality on avian species richness and community composition. Am. Nat. 2003, 161, 83–97. [Google Scholar] [CrossRef] [PubMed]
  21. Bergen, K.M.; Goetz, S.J.; Dubayah, R.O.; Henebry, G.M.; Hunsaker, C.T.; Imhoff, M.L.; Nelson, R.F.; Parker, G.G.; Radeloff, V.C. Remote sensing of vegetation 3-D structure for biodiversity and habitat: Review and implications for lidar and radar spaceborne missions. J. Geophys. Res. Biogeosci. 2009, 114, G00E06. [Google Scholar] [CrossRef]
  22. Goetz, S.J.; Fiske, G.J.; Bunn, A.G. Using satellite time-series data sets to analyze fire disturbance and forest recovery across Canada. Remote Sens. Environ. 2006, 101, 352–365. [Google Scholar] [CrossRef]
  23. Hawkins, B.A. Summer vegetation, deglaciation and the anomalous bird diversity gradient in eastern North America. Glob. Ecol. Biogeogr. 2004, 13, 321–325. [Google Scholar] [CrossRef]
  24. Bino, G.; Levin, N.; Darawshi, S.; Van Der Hal, N.; Reich-Solomon, A.; Kark, S. Accurate prediction of bird species richness patterns in an urban environment using Landsat-derived NDVI and spectral unmixing. Int. J. Remote Sens. 2008, 29, 3675–3700. [Google Scholar] [CrossRef]
  25. Wood, E.M.; Pidgeon, A.M.; Radeloff, V.C.; Keuler, N.S. Image Texture Predicts Avian Density and Species Richness. PLoS ONE 2013, 8, e63211. [Google Scholar] [CrossRef] [PubMed]
  26. Culbert, P.D.; Radeloff, V.C.; St-Louis, V.; Flather, C.H.; Rittenhouse, C.D.; Albright, T.P.; Pidgeon, A.M. Modeling broad-scale patterns of avian species richness across the Midwestern United States with measures of satellite image texture. Remote Sens. Environ. 2012, 118, 140–150. [Google Scholar] [CrossRef]
  27. Rundquist, D.; Narumalani, S.; Narayanan, R. A review of wetlands remote sensing and defining new considerations. Remote Sens. Rev. 2001, 20, 207–226. [Google Scholar] [CrossRef]
  28. Ozesmi, S.L.; Bauer, M.E. Satellite remote sensing of wetlands. Wetl. Ecol. Manag. 2002, 10, 381–402. [Google Scholar] [CrossRef]
  29. Tian, B.; Zhou, Y.; Zhang, L.; Yuan, L. Analyzing the habitat suitability for migratory birds at the Chongming Dongtan Nature Reserve in Shanghai, China. Estuar. Coast. Shelf Sci. 2008, 80, 296–302. [Google Scholar] [CrossRef]
  30. Richmond, O.M.W. Inferring Ecological Relationships from Occupancy Patterns for California Black Rails in the Sierra Nevada Foothills. Ph.D. Thesis, University of California Berkeley, Berkeley, CA, USA, December 2010. [Google Scholar]
  31. Dronova, I. Object-Based Image Analysis in Wetland Research: A Review. Remote Sens. 2015, 7, 6380–6413. [Google Scholar] [CrossRef]
  32. Blaschke, T. Object based image analysis for remote sensing. ISPRS J. Photogramm. Remote Sens. 2010, 65, 2–16. [Google Scholar] [CrossRef]
  33. Tobler, W. Computer movie simulating urban growth in Detroit region. Econ. Geogr. 1970, 46, 234–240. [Google Scholar] [CrossRef]
  34. Legendre, P. Spatial autocorrelation—Trouble or new paradigm? Ecology 1993, 74, 1659–1673. [Google Scholar] [CrossRef]
  35. Anselin, L.; Bera, A.K.; Florax, R.; Yoon, M.J. Simple diagnostic tests for spatial dependence. Reg. Sci. Urban Econ. 1996, 26, 77–104. [Google Scholar] [CrossRef]
  36. Hoeting, J.A.; Davis, R.A.; Merton, A.A.; Thompson, S.E. Model selection for geostatistical models. Ecol. Appl. 2006, 16, 87–98. [Google Scholar] [CrossRef] [PubMed]
  37. Bacaro, G.; Santi, E.; Rocchini, D.; Pezzo, F.; Puglisi, L.; Chiarucci, A. Geostatistical modelling of regional bird species richness: Exploring environmental proxies for conservation purpose. Biodivers. Conserv. 2011, 20, 1677–1694. [Google Scholar] [CrossRef]
  38. Dormann, C.F.; McPherson, J.M.; Araujo, M.B.; Bivand, R.; Bolliger, J.; Carl, G.; Davies, R.G.; Hirzel, A.; Jetz, W.; Kissling, W.D.; et al. Methods to account for spatial autocorrelation in the analysis of species distributional data: A review. Ecography 2007, 30, 609–628. [Google Scholar] [CrossRef]
  39. Miller, J.; Franklin, J.; Aspinall, R. Incorporating spatial dependence in predictive vegetation models. Ecol. Model. 2007, 202, 225–242. [Google Scholar] [CrossRef]
  40. Barzen, J. Phase 1 Report: How Development Projects May Impact Wintering Waterbirds at Poyang Lake; Unpublished report submitted to Hydro-ecology Institute of the Yangtze Water Resources Commission; International Crane Foundation: Baraboo, WI, USA, 2008; p. 14. Available online: https://www.savingcranes.org/wp-content/uploads/2008/05/Phase%201%20Report_English.pdf (accessed on 2 January 2016).
  41. The IUCN Red List of Threatened Species. Available online: http://www.iucnredlist.org/ (accessed on 2 January 2016).
  42. Qian, F.; Yu, C.; Jiang, H. Ground and aerial surveys of wintering waterbirds in Poyang Lake basin. In Proceedings of the UNEP/GEF Siberian Crane Wetland Project—Project Completion Workshop, Harbin, China, 14–15 October 2009; pp. 1–13.
  43. Burnham, J. Environmental Drivers of Siberian Crane (Grus Leucogeranus) Habitat Selection and Wetland Management and Conservation in China. Master’s Thesis, University of Wisconsin, Madison, WI, USA, December 2007. [Google Scholar]
  44. Ji, W.; Zeng, N.; Wang, Y.; Gong, P.; Bing, X.; Bao, S. Analysis on the Waterbirds Community Survey of Poyang Lake in Winter. Geogr. Inf. Sci. 2007, 13, 51–64. [Google Scholar] [CrossRef]
  45. Barzen, J. Phase 2 Report: Potential Impacts of a Water Control Structure on the Abundance and Distribution of Wintering Waterbirds at Poyang Lake; Unpublished Report Submitted to Hydro-Ecology Institute of the Yangtze Water Resources Commission; International Crane Foundation: Baraboo, WI, USA, 2009; p. 54. Available online: https://www.savingcranes.org/wp-content/uploads/2008/05/Phase%202%20Report_English.pdf (accessed on 2 January 2016).
  46. Wu, G. Impact of Human Activities on Water Level and Clarity and Underwater Light Climate of Vallisneria Spiralis L. in Poyang Lake, China. Ph.D. Thesis, Wageningen University, Wageningen, The Netherlands, February 2008. [Google Scholar]
  47. Finlayson, M.; Harris, J.; McCartney, M.; Young, L.; Chen, Z. Report on Ramsar Visit to Poyang Lake Ramsar Site, P.R. China 12–17 April 2010; Report prepared on behalf of the Secretariat of the Ramsar Convention; The Ramsar Convention of Wetlands: Gland, Switzerland; Available online: http://archive.ramsar.org/pdf/Poyang_lake_report_v8.pdf (accessed on 15 January 2011).
  48. Guo, H.; Hu, Q.; Zhang, Q.; Feng, S. Effects of the Three Gorges Dam on Yangtze River flow and river interaction with Poyang Lake, China: 2003–2008. J. Hydrol. 2012, 416, 19–27. [Google Scholar] [CrossRef]
  49. Zhao, M.; Cong, P.; Barter, M.; Fox, A.D.; Cao, L. The changing abundance and distribution of Greater White-fronted Geese Anser albifrons in the Yangtze River floodplain: Impacts of recent hydrological changes. Bird Conserv. Int. 2012, 22, 135–143. [Google Scholar] [CrossRef]
  50. Sun, F.; Zhao, Y.; Gong, P.; Ma, R.; Dai, Y. Monitoring dynamic changes of global land cover types: Fluctuations of major lakes in China every 8 days during 2000–2010. Chin. Sci. Bull. 2014, 59, 171–189. [Google Scholar] [CrossRef]
  51. Dronova, I.; Gong, P.; Wang, L.; Zhong, L. Mapping dynamic cover types in a large seasonally flooded wetland using extended principal component analysis and object-based classification. Remote Sens. Environ. 2015, 158, 193–206. [Google Scholar] [CrossRef]
  52. Han, X.; Chen, X.; Feng, L. Four decades of winter wetland changes in Poyang Lake based on Landsat observations between 1973 and 2013. Remote Sens. Environ. 2015, 156, 426–437. [Google Scholar] [CrossRef]
  53. Markkola, J.; Iwabuchi, S.; Lei, G.; Aarvak, T.; Tolvanen, P.; Oien, I.J. Lesser white-fronted goose survey at the East Dongting and Poyang lakes in China, February 1999. In Fennoscandian Lesser White-fronted Goose Conservation Project. Annual Report 1999; Tolvanen, P., Øien, I.J., Ruokolainen, K., Eds.; WWF Finland Report No 12 and Norwegian Ornithological Society, NOF Rapportserie Report no. 1-2000: Helsinki, Finland, 2000; pp. 9–15. [Google Scholar]
  54. Shao, M.; Jiang, J.; Guo, H.; Zeng, B. Abundance, Distribution and Diversity Variations of Wintering Water Birds in Poyang Lake, Jiangxi Province, China. Pak. J. Zool. 2014, 46, 451–462. [Google Scholar]
  55. Shankman, D.; Keim, B.D.; Song, J. Flood frequency in China’s Poyang Lake region: Trends and teleconnections. Int. J. Climatol. 2006, 26, 1255–1266. [Google Scholar] [CrossRef]
  56. Qi, S.; Brown, D.G.; Tian, Q.; Jiang, L.; Zhao, T.; Bergen, K.A. Inundation Extent and Flood Frequency Mapping Using LANDSAT Imagery and Digital Elevation Models. Gisci. Remote Sens. 2009, 46, 101–127. [Google Scholar] [CrossRef]
  57. Dronova, I.; Gong, P.; Clinton, N.E.; Wang, L.; Fu, W.; Qi, S.; Liu, Y. Landscape analysis of wetland plant functional types: The effects of image segmentation scale, vegetation classes and classification methods. Remote Sens. Environ. 2012, 127, 357–369. [Google Scholar] [CrossRef]
  58. Wang, L.; Dronova, I.; Gong, P.; Yang, W.; Li, Y.; Liu, Q. A new time series vegetation-water index of phenological-hydrological trait across species and functional types for Poyang Lake wetland ecosystem. Remote Sens. Environ. 2012, 125, 49–63. [Google Scholar] [CrossRef]
  59. Fox, A.D.; Cao, L.; Zhang, Y.; Barter, M.; Zhao, M.J.; Meng, F.J.; Wang, S.L. Declines in the tuber-feeding waterbird guild at Shengjin Lake National Nature Reserve, China—A barometer of submerged macrophyte collapse. Aquat. Conserv. Mar. Freshw. Ecosyst. 2011, 21, 82–91. [Google Scholar] [CrossRef]
  60. Kwaiser, K. Accounting for Observation Uncertainty in Species-Habitat Models: A Case Study Using Bird Survey Data from Poyang Lake, China. Master’s Thesis, University of Michigan, Ann Arbor, MI, USA, August 2009. [Google Scholar]
  61. Barter, M.; Cao, L.; Chen, L.; Lei, G. Results of a survey for waterbirds in the lower Yangtze floodplain, China, in January–February 2004. Forktail 2005, 21, 1–7. [Google Scholar]
  62. Wu, X.; Lv, M.; Jin, Z.; Michishita, R.; Chen, J.; Tian, H.; Tu, X.; Zhao, H.; Niu, Z.; Chen, X.; et al. Normalized difference vegetation index dynamic and spatiotemporal distribution of migratory birds in the Poyang Lake wetland, China. Ecol. Indic. 2014, 47, 219–230. [Google Scholar] [CrossRef]
  63. Liordos, V. Foraging Guilds of Waterbirds Wintering in a Mediterranean Coastal Wetland. Zool. Stud. 2010, 49, 311–323. [Google Scholar]
  64. Chander, G.; Markham, B.L.; Helder, D.L. Summary of current radiometric calibration coefficients for Landsat MSS, TM, ETM+, and EO-1 ALI sensors. Remote Sens. Environ. 2009, 113, 893–903. [Google Scholar] [CrossRef]
  65. Vermote, E.F.; Tanre, D.; Deuze, J.L.; Herman, M.; Morcrette, J.J. Second Simulation of the Satellite Signal in the Solar Spectrum, 6S: An overview. IEEE Trans. Geosci. Remote Sens. 1997, 35, 675–686. [Google Scholar] [CrossRef]
  66. 6SV–MODIS Land Surface Reflectance Science Computing Facility. Available online: http://6s.ltdri.org/ (accessed on 10 February 2011).
  67. ESRI Data Basemaps. Available online: http://www.esri.com/data/basemaps (accessed on 5 April 2016).
  68. Trimble Documentation. eCognition Reference Book v. 8.8 2012; Trimble Germany GmbH: München, Germany, 2012. [Google Scholar]
  69. NASA/NGA Commercial Data Access. Available online: http://cad4nasa.gsfc.nasa.gov/ (accessed on 14 December 2011).
  70. Hall, M.; Frank, E.; Holmes, G.; Pfaringer, B.; Reutemann, P.; Witten, I. The WEKA Data Mining Software: An Update. ACM SIGKDD Explor. Newslett. 2009, 11, 10–18. [Google Scholar] [CrossRef]
  71. Burnham, K.P.; Anderson, D.R. Model Selection and Multimodel Inference: A Practical Information-Theoretic Approach, 2nd ed.; Springer: New York, NY, USA, 2002; p. 488. [Google Scholar]
  72. Jackman, S. pscl: Classes and Methods for R Developed in the Political Science Computational Laboratory, Stanford University. Department of Political Science, Stanford University. Stanford, California. R package Version 1.4.9. 2015. Available online: https://cran.r-project.org/web/packages/pscl/index.html (accessed on 10 April 2016).
  73. Zeileis, A.; Kleiber, C.; Jackman, S. Regression models for count data in R. J. Stat. Softw. 2008, 27, 1–25. [Google Scholar] [CrossRef]
  74. Anselin, L. Local indicators of spatial autocorrelation—LISA. Geogr. Anal. 1995, 27, 93–115. [Google Scholar] [CrossRef]
  75. Anselin, L.; Syabri, I.; Kho, Y. GeoDa: An introduction to spatial data analysis. Geogr. Anal. 2006, 38, 5–22. [Google Scholar] [CrossRef]
  76. Tuomisto, H. A diversity of beta diversities: Straightening up a concept gone awry. Part 1. Defining beta diversity as a function of alpha and gamma diversity. Ecography 2010, 33, 2–22. [Google Scholar] [CrossRef]
  77. Roshier, D.A.; Robertson, A.I.; Kingsford, R.T. Responses of waterbirds to flooding in an arid region of Australia and implications for conservation. Biol. Conserv. 2002, 106, 399–411. [Google Scholar] [CrossRef]
  78. Cerezo, A.; Cecilia Conde, M.; Poggio, S.L. Pasture area and landscape heterogeneity are key determinants of bird diversity in intensively managed farmland. Biodivers. Conserv. 2011, 20, 2649–2667. [Google Scholar] [CrossRef]
  79. Ollinger, S.V. Sources of variability in canopy reflectance and the convergent properties of plants. New Phytol. 2011, 189, 375–394. [Google Scholar] [CrossRef] [PubMed]
  80. Turner, D.P.; Cohen, W.B.; Kennedy, R.E.; Fassnacht, K.S.; Briggs, J.M. Relationships between leaf area index and Landsat TM spectral vegetation indices across three temperate zone sites. Remote Sens. Environ. 1999, 70, 52–68. [Google Scholar] [CrossRef]
  81. Goetz, S.; Steinberg, D.; Dubayah, R.; Blair, B. Laser remote sensing of canopy habitat heterogeneity as a predictor of bird species richness in an eastern temperate forest, USA. Remote Sens. Environ. 2007, 108, 254–263. [Google Scholar] [CrossRef]
  82. Liu, X.P.; Kelin, W.; Geli, Z. Perspectives and policies: Ecological industry substitutes in wetland restoration of the Middle Yangtze. Wetlands 2004, 24, 633–641. [Google Scholar]
  83. Xing, Y.; Xie, P.; Yang, H.; Wu, A.; Ni, L. The change of gaseous carbon fluxes following the switch of dominant producers from macrophytes to algae in a shallow subtropical lake of China. Atmos. Environ. 2006, 40, 8034–8043. [Google Scholar] [CrossRef]
  84. Legendre, P.; Dale, M.R.T.; Fortin, M.J.; Gurevitch, J.; Hohn, M.; Myers, D. The consequences of spatial structure for the design and analysis of ecological field surveys. Ecography 2002, 25, 601–615. [Google Scholar] [CrossRef]
  85. Laba, M.; Blair, B.; Downs, R.; Monger, B.; Philpot, W.; Smith, S.; Sullivan, P.; Baveye, P.C. Use of textural measurements to map invasive wetland plants in the Hudson River National Estuarine Research Reserve with IKONOS satellite imagery. Remote Sens. Environ. 2010, 114, 876–886. [Google Scholar] [CrossRef]
  86. Taft, O.W.; Colwell, M.A.; Isola, C.R.; Safran, R.J. Waterbird responses to experimental drawdown: Implications for the multispecies management of wetland mosaics. J. Appl. Ecol. 2002, 39, 987–1001. [Google Scholar] [CrossRef]
Figure 1. Study area and waterbird survey in December 2006. The background images represent Landsat 5 TM scene as a color composite of bands 4 (near-infrared), 3 (red) and 2 (green) for the wetland area (RGB), and a grayscale image of band 4 for the surrounding mixed-cover landscape.
Remotesensing 08 00462 g001
Figure 2. Major steps in the study analysis of remote sensing and waterbird survey data.
Remotesensing 08 00462 g002
Figure 3. Major wetland cover types within sub-lakes included in December 2006 Poyang Lake waterbird surveys (left; overlaid on Landsat 5 TM grayscale image of band 4 (near-infrared) and characterized with supervised object-based k-nearest neighbor classification of the Landsat satellite image from 6 January 2007) and sub-lake 500-m neighborhood buffers (right; overlaid on Landsat 5 TM RGB composite of bands 4, 3 (red) and 2 (green)).
Remotesensing 08 00462 g003
Figure 4. Sub-lake clusters of significant spatial dependence (p < 0.05) determined using Local Indicators of Spatial Association (LISA) for (a) species richness; (b) Shannon index; (c) number of food guilds; (d) number of size groups; (e) number of waterbirds; (f) number of tuberfeeders; (g) proportion of flooded vegetation; (h) NDVI of mudflat; (i) NDVI of emergent grasses; (j) lake area; and (k) standard deviation of red reflectance for flooded vegetation. For positive spatial dependence, “High-High” indicates significant clustering of high values in each variable and “Low-Low”—significant clustering of low values. Negative spatial dependence is represented by “High-Low” and “Low-High” significant associations.
Remotesensing 08 00462 g004
Table 1. Dependent (response) variables used in regression models and their basic descriptive statistics for 51 sub-lakes from December 2006 Poyang Lake survey.
VariableDescriptionMin–MaxMean (st. dev.)
Species richnessNumber of waterbird species per sub-lake2–239.1 (5.44)
Shannon indexDiversity index which accounts for both the number of
species and evenness of their abundance calculated as
H = i = 1 R p i ln p i , where pi is the proportion of individuals
from species i in the whole dataset and R is the total number of species in the dataset
0.2–2.031.1 (0.44)
Number of
food guilds
The number of foraging guilds represented per sub-lake,
out of 6 groups after [45]: tuber-feeding, sedge/grass-eating,
seed eating/dabbling, benthic insect/larvae eating, fish eating
and zooplankton eating birds
1–63.9 (1.38)
Number of
size groups
The number of bird groups defined by foraging habit (wading
versus floating/diving birds) and size (average body mass
greater or less than 2 kg for floating birds, average body length greater or less than 0.8 m for waders)
1–43.2 (0.98)
Total waterbird abundanceTotal number of waterbirds per sub-lake17–94,6587201 (16,262)
Abundance of tuber feeding birdsThe number of birds from the tuber-feeding foraging guild
including Leucogeranus leucogeranus, Grus monarcha, Grus vipio, Anser cygnoides and Cygnus columbianus
0–46,3952750 (8185)
Table 2. Poyang Lake wetland cover types used in satellite image classification.
Cover Type NameDescription
WaterInundated areas with water coverage above the ground or vegetation surface: sub-lakes, channels, pools, rivers etc.
MudflatExposed lake bottomland directly adjacent to the water body with sparse (<30%) or no plant cover
Emergent grasslandGreen photosynthetically active emergent wetland vegetation dominated by C3 grasses and forbs
Flooded vegetationGreen photosynthetically active vegetation with “wet” spectral signal (significantly lower near- and short-wave-infrared range than emergent grasses); includes inundated emergent, floating and submerged aquatic macrophytes and their mixtures
Senescent grassesPerennial vegetation that maintains senescent biomass during the winter, typically dominated by mixed warm-season C4-grasses and reeds that grow in higher-elevation sub-lake and channel periphery
Burned vegetationRecently burned grassland with distinct dark soil/ash and little or no vegetation regrowth
Human land useAreas of active human land use adjacent to Poyang Lake wetlands (residential, agriculture, extraction, etc.)
Table 3. Independent variables used in regression models of Poyang Lake waterbird abundance and diversity, summarized for 500-m neighborhoods around sub-lakes within the natural wetland area.
CategoryName (Model Code)Definition
AreaTotal sub-lake unit
area (area)
Total area of the sub-lake water body
and its 500-m buffer neighborhood, m2
Prevalence of habitat cover
types within sub-lake neighborhood
Percent mudflat
(%mudflat)
Proportion of the area classified as
mudflat within the sub-lake neighborhood
Percent emergent
vegetation (%emgrass)
Proportion of the area classified as emergent
grassland within the sub-lake neighborhood
Percent flooded vegetation (%floodveg)Proportion of the area classified as flooded
vegetation within the sub-lake neighborhood
Spectral
greenness
Normalized Difference Vegetation Index (NDVI)
of emergent grassland
(ndvi emgrass)
Spectral index of vegetation greenness, here calculated as
mean object-level NDVI from Landsat TM bands 3 (red) and
4 (near-infrared) within green emergent grass class for each
sub-lake: NDVI= (Band 4 − Band 3)/(Band 4 + Band 3)
Normalized Difference Vegetation Index (NDVI)
of mudflat (ndvi mudflat)
Calculated using the same formula as above as
mean of the objects within the mudflat class
Spectral heterogeneity
of habitat cover types
Spectral heterogeneity of mudflat (stdev Red mud)Standard deviation of the object-level mean values for
Landsat TM band 3 (red) among the mudflat image objects
Spectral heterogeneity of flooded vegetation
(stdev Red floodveg)
Standard deviation of the object-level mean values for
Landsat TM band 3 (red) among the flooded vegetation image objects
Spectral heterogeneity
of emergent vegetation
(stdev Red emgrass)
Standard deviation of the object-level mean values for
Landsat TM band 3 (red) among the emergent C3 grass image objects
Heterogeneity
of primitive
patch shapes within habitat cover types
Heterogeneity of shape
index for mudflat
(stdev SI mud)
Standard deviation of the shape index (perimeter of the image object divided by four times the square root of its area [66])
for primitive image objects classified as mudflat within the sub-lake neighborhood
Heterogeneity of shape index for emergent vegetation
(stdev SI emgrass)
Standard deviation of the shape index (perimeter of the image object divided by four times the square root of its area [66]) for primitive image objects classified as emergent grassland within
the sub-lake neighborhood
Potential human disturbance
within sub-lake neighborhood
Percent of burned vegetation area (%burnveg)Proportion of the area classified as burnt vegetation within the
sub-lake neighborhood
Percent of human land
use (%human LU)
Proportion of the area representing active human land use (residential or agriculture) within the sub-lake neighborhood
Table 4. Confusion matrix for the object-based k-nearest neighbor classification of the study area.
Assigned Class:Reference ClassUser’s Accuracy %
Emergent GrasslandMudflatSenescent GrasslandFlooded VegetationWaterBurned VegetationSand
Overall Accuracy 94.3%, Kappa 0.934
Emergent grassland483290.6
Mudflat471294.0
Senescent grassland23694.7
Flooded vegetation137390.2
Water214093.0
Burned vegetation35100
Sand40100
Producer’s accuracy,%96.094.090.092.510087.5100
Table 5. Relative importance of independent variables with p-value > 0.05 in univariate ordinary least squares (OLS) regression models of diversity and abundance response variables, sorted by Akaike Information Criterion (AICc) in ascending order. The AICc values of the intercept-only models are provided as reference.
Dependent Variable:Species RichnessShannon IndexNumber of Food Guilds
Independent VariableR2AICCIndependent VariableR2AICcIndependent VariableR2AICc
ndvi mudflat0.35303.2ndvi mudflat0.1564.1ndvi mudflat0.21178.5
Sqrt (%floodveg)0.21313.4Sqrt (%floodveg)0.1265.5Sqrt (%floodveg)0.12184.1
Stdev Red mud0.11319.3Stdev Red floodveg0.0867.9Ln(area)0.08186.1
Intercept-only0.00322.7Intercept-only0.0069.81Intercept-only0.00188.3
Dependent Variable:Number of Size GroupsLn (Number of Birds)Ln (Number of Tuber Feeding Birds + 1)
Independent VariableR2AICcIndependent VariableR2AICcIndependent VariableR2AICc
ndvi mudflat0.15149.2Ln(area)0.2216.0ndvi mudflat0.09267.3
ndvi emgrass0.09152.4ndvi mudflat0.13220.4Sqrt (%floodveg)0.08267.4
Ln (area)0.08153.2Intercept-only0.00225.2Intercept-only0.00269.6
Intercept-only0.00155.2
Table 6. Multivariate ordinary least squares (OLS) and spatial regression models for waterbird diversity and abundance response variables within 2 units of AICc from the lowest AICc OLS model.
ModelsR2 OLSAICc OLSAICc LagAICc ErrorAkaike Weight
Dependent Variable: Species Richness
Ln(area) − Sqrt(%floodveg) + ndvi emgrass − ndvi mudflat − stdev SI emgrass0.54294.38297.17291.540.60
−Sqrt(%floodveg) + ndvi emgrass – ndvi mudflat − stdev SI emgrass0.50295.94298.60293.92
−Sqrt(%floodveg) + ndvi emgrass − ndvi mudflat − stdev SI emgrass + stdev Red emgrass0.52296.15298.83292.340.40
Dependent Variable: Shannon Index
−Sqrt(%floodveg) + ndvi emgrass + stdev Red floodveg + stdev Red emgrass0.4052.69 *0.27
−Sqrt(%floodveg) + ndvi emgrass + stdev Red floodveg0.3752.76 *0.26
Ln(area) − Sqrt(%floodveg) + ndvi emgrass + stdev Red floodveg0.3953.01 *0.23
Ln(area) − Sqrt(%floodveg) + ndvi emgrass + stdev Red floodveg + stdev Red emgrass0.4253.90 *0.15
−Sqrt(%floodveg) + ndvi emgrass + stdev Red floodveg + stdev Red emgrass − ndvi mudflat0.4154.58 *0.10
Dependent Variable: Number Of Food Guilds
Ln(area) − Sqrt(%floodveg) + ndvi emgrass0.38169.73170.45172.240.35
Ln(area) − Sqrt(%floodveg) + ndvi emgrass − ndvi mudflat0.41170.23 *0.4
Ln(area) − Sqrt(%floodveg) + ndvi emgrass − %emgrass0.41170.29171.18172.960.25
Ln(area) − Sqrt(%floodveg) + ndvi emgrass + %human LU0.39171.55172.72174.24
Ln(area) − Sqrt(%floodveg) + ndvi emgrass − stdev SI emgrass0.39171.73172.55174.42
Dependent Variable: Number of Size Groups
Ln(area) − Sqrt(%floodveg) + ndvi emgrass0.33140.55 *0.25
Ln(area) − Sqrt(%floodveg) + ndvi emgrass + %human LU0.35141.59 *0.15
Ln(area) − Sqrt(%floodveg) + ndvi emgrass − ndvi mudflat0.35141.71 *0.14
Ln(area) − Sqrt(%floodveg) + ndvi emgrass − %emgrass0.35141.72 *0.14
Ln(area) − Sqrt(%floodveg) + ndvi emgrass − %burnveg0.35141.89 *0.13
Ln(area) − Sqrt(%floodveg) + ndvi emgrass − %mudflat0.34142.41 *0.10
Ln(area) − Sqrt(%floodveg) + ndvi emgrass + stdev Red floodveg0.34142.45 *0.10
Dependent Variable: Natural Log of the Total Number of Birds
Ln(area) + ndvi emgrass − ndvi mudflat − stdev SI emgrass0.4207.90209.62210.560.23
Ln(area) − ndvi mudflat − stdev SI emgrass0.35209.19 *0.44
Ln(area) + ndvi emgrass − ndvi mudflat − stdev SI emgrass − %burnveg0.41209.24211.47211.59
Ln(area) − ndvi mudflat − stdev SI emgrass − %burnveg0.38209.83 *0.33
Ln(area) + ndvi emgrass − ndvi mudflat − stdev SI emgrass − Sqrt(%floodveg)0.41209.84211.55212.63
Dependent Variable: (Natural Log + 1) of the Number of Tuber Feeding Birds
Ln(area) − Sqrt(%floodveg)0.16264.41263.87265.170.36
Ln(area) − Sqrt(%floodveg) − stdev SI emgrass0.19264.79264.56266.110.22
− ndvi mudflat − stdev SI emgrass0.14265.19264.54265.610.28
Ln(area) − Sqrt(%floodveg) − %burnveg0.17266.15266.03267.45
Ln(area) − ndvi mudflat − stdev SI emgrass0.17266.19265.51266.970.14
− ndvi mudflat0.09266.25 *
%emgrass − ndvi mudflat − stdev SI emgrass0.17266.31 *
− Sqrt(%floodveg)0.08266.39 *
* Spatial autocorrelation diagnostics not significant with p-value > 0.05.
Table 7. Predictors selected by the highest-rank zero-inflated negative binomial regression models for the number of tuber-feeding birds within 2 units of AICc from the lowest AICc model.
Count ModelZero-Inflation ModelAICcAkaike Weight
Ln(area) − stdev SI emgrassndvi mudflat + Sqrt(%floodveg)661.40.28
Ln(area) − stdev SI emgrassSqrt(%floodveg)661.50.27
Ln(area) − stdev SI emgrass − Sqrt(%floodveg)Sqrt(%floodveg)663.00.13
Ln(area) − stdev SI emgrass − Sqrt(%floodveg)ndvi mudflat + Sqrt(%floodveg)663.30.11
Ln(area) – stdev SI emgrass − ndvi mudflatSqrt(%floodveg)663.30.11
ndvi emgrass − ndvi mudflat − %burnvegSqrt(%floodveg)663.30.11

