Article

Evaluation of HY-2A Scatterometer Wind Vectors Using Data from Buoys, ERA-Interim and ASCAT during 2012–2014

1
State Key Laboratory of Remote Sensing Science, Institute of Remote Sensing and Digital Earth, Chinese Academy of Sciences, Beijing 100101, China
2
University of Chinese Academy of Sciences, Beijing 100049, China
3
Key Laboratory of Research on Marine Hazards Forecasting, National Marine Environmental Forecasting Center, SOA, Beijing 100081, China
4
Joint Center for Global Change Studies (JCGCS), Beijing 100875, China
5
Centre for Climate Research Singapore, Meteorological Service Singapore, Singapore 537054, Singapore
6
National Center for Atmospheric Research, Boulder, CO 80301, USA
*
Author to whom correspondence should be addressed.
Remote Sens. 2016, 8(5), 390; https://doi.org/10.3390/rs8050390
Submission received: 22 January 2016 / Revised: 19 April 2016 / Accepted: 2 May 2016 / Published: 7 May 2016

Abstract

:
The first Chinese operational Ku-band scatterometer on board Haiyang-2A (HY-2A), launched in August 2011, is designed for monitoring the global ocean surface wind. This study estimates the quality of the near-real-time (NRT) retrieval wind speed and wind direction from the HY-2A scatterometer for 36 months from 2012 to 2014. We employed three types of sea-surface wind data from oceanic moored buoys operated by the National Data Buoy Center (NDBC) and the Tropical Atmospheric Ocean project (TAO), the European Centre for Medium Range Weather Forecasting (ECMWF) reanalysis data (ERA-Interim), and the advanced scatterometer (ASCAT) to calculate the error statistics including mean bias, root mean square error (RMSE), and standard deviation. In addition, the rain effects on the retrieval winds were investigated using collocated Climate Prediction Center morphing method (CMORPH) precipitation data. All data were collocated with the HY-2A scatterometer wind data for comparison. The quality performances of the HY-2A NRT wind vectors data (especially the wind speeds) were satisfactory throughout the service period. The RMSEs of the HY-2A wind speeds relative to the NDBC, TAO, ERA-Interim, and ASCAT data were 1.94, 1.73, 2.25, and 1.62 m·s−1, respectively. The corresponding RMSEs of the wind direction were 46.63°, 43.11°, 39.93°, and 47.47°, respectively. The HY-2A scatterometer overestimated low wind speeds, especially under rainy conditions. Rain exerted a diminishing effect on the wind speed retrievals with increasing wind speed, but its effect on wind direction was robust at low and moderate wind speeds. Relative to the TAO buoy data, the RMSEs without rain effect were reduced to 1.2 m·s−1 and 39.68° for the wind speed direction, respectively, regardless of wind speed. By investigating the objective laws between rain and the retrieval winds from HY-2A, we could improve the quality of wind retrievals through future studies.

Graphical Abstract

1. Introduction

Ocean surface wind vectors play an important role in the development of sea waves, currents, and water mass activities. They also affect the evolution of sea surface temperatures, monsoons, ENSO (El Niño Southern Oscillation), and other phenomena. The wind vectors retrieved from the space-borne scatterometer have already been applied in many research fields [1]. The satellite Haiyang-2A (HY-2A), launched in August 2011 [2], monitors global ocean environment parameters such as sea-surface winds, ocean waves and currents [3]. HY-2A is operated by China National Satellite Ocean Application Service (NSOAS) and carries four sensors: a microwave scatterometer (SCAT), a dual-frequency (Ku- and C-band) radar altimeter, a scanning microwave radiometer, and a three-frequency microwave radiometer [2,4].
The HY-2A SCAT (H2SCAT) is the first Chinese operational instrument since the first experimental SCAT launched in 2002 [5]. Similar to the National Aeronautics and Space Administration (NASA) SeaWinds scatterometer on the Quick Scatterometer (QuikSCAT) satellite, which operates in the 13.4 GHz (Ku-band) [6] and the scatterometer on the Indian Space Research Organisation (ISRO)’s satellite Oceansat-2 (OSCAT), which operates at 13.5 GHz (in the Ku-band) [7], H2SCAT has a one-meter dish reflector antenna at a frequency of 13.256 GHz (also in the Ku-band). The QuikSCAT antenna ceased spinning in November 2009 [8]. Moreover, the OSCAT failed in early 2014, leaving only three in-orbit operational scatterometers (H2SCAT and the advanced scatterometer (ASCAT-A and ASCAT-B) on board the meteorological operational (MetOp) series of satellites) [9]. As the ASCATs operate at 5.255 GHz (C band), they are less sensitive to rain than the other scatterometers listed, which operate in the Ku band. [10]. The two pencil beams of H2SCAT cover more than 90% of the global ocean in one day. The inner beam is HH polarized at incidence angle of 41° over a swath of 1350 km; the outer beam is VV polarized at incidence angle of 48° over a swath of 1700 km [5,11].
The evaluation of scatterometer wind retrievals is fundamental in data applications. After the launch of the QuikSCAT satellite in 1999 [12], Ebuchi [13] referenced the wind vectors observed by QuikSCAT/SeaWinds to the data from various buoys and found good agreement between the wind speeds and directions and the buoy data. In subsequent studies, the quality of the QuikSCAT winds was investigated in comparison to wind data from near-shore and moored buoys [14,15,16], the results of numerical weather prediction (NWP) models [17,18,19], and observations from ocean platforms and other scatterometers [20,21,22]. The OSCAT [7,23,24,25] and ASCAT [22,26,27,28,29,30,31,32] data were also validated in several comparisons with the wind vectors from global ocean buoys, NWP and other scatterometers. Wang [33] assessed the quality of H2SCAT wind products during the first six months (from January to June of 2012), using in situ winds from the National Data Buoy Center (NDBC) buoys and several oil platforms. Yang [34] compared the data from moored buoys and the European Centre for Medium Range Weather Forecasting (ECMWF) reanalysis data and preliminarily validated the accuracy of the H2SCAT wind retrievals over four months (the three-month period from January to March 2012, and August 2012). However, the H2SCAT products have yet to be evaluated over the designed lifetime of the satellite (January 2012 to December 2014). In this study, we gather three different types of wind data from oceanic moored buoys (NDBC and TAO), the ERA-Interim reanalysis and ASCAT, and collocate H2SCAT wind vectors with them. The aim was to evaluate the H2SCAT Level-2 near-real-time (NRT) during the entire 36 months from 2012 to 2014. The H2SCAT NRT product has been operationally received by the China National Marine Environmental Forecasting Centre (NMEFC). To improve and further apply the operational ocean forecasts, we comprehensively evaluate the quality of the HY-2A scatterometer winds.
In this study, we additionally consider the effect of rain on the scatterometer. As demonstrated in previous studies [8,35,36,37,38,39,40,41,42], the effects of rain events cannot be ignored. The wind retrievals from returned signals use a geophysical model function (GMF), which empirically relates the wind vectors to radar observation of sea-surface [8]. H2SCAT data are treated similarly [5]. However, raindrops not only splash on the sea surface (magnifying the surface roughness) [35] but also scatter or absorb the microwave radiation in the air while falling [43]. In general, the splashing effect of rain is stronger which increases the measured radar backscatter, and affects the quality of the wind speed and wind direction retrievals [36]. Lin [44] shows that rainy areas also exhibit more wind variability, leading to larger differences between C-band scatterometer winds and buoy winds. There are no rain flags and other related rain information in the current version H2SCAT NRT Sea wind products. To investigate the effect of rain on the quality of the H2SCAT sea surface winds, we employ the National Oceanic and Atmospheric Administration (NOAA) Climate Prediction Center morphing method (CMORPH) rain data [45]. The effect of rain on the wind speeds and directions derived from H2SCAT has not been discussed in previous studies.

2. Datasets and Methods

2.1. Datasets

Four types of wind data and one set of precipitation data were analyzed in this study. The used datasets are briefly described below.

2.1.1. H2SCAT Level-2 NRT Wind Vectors

To evaluate the quality of the H2SCAT operational wind products,we use only the Level-2 NRT retrieved wind vectors which is the retrieved 10-m neutrally stable wind. These swath data were obtained from the NSOAS internal FTP site, which operated daily from 2012 to 2014. NSOAS performs wind inversion by the maximum likelihood estimation (MLE) method and remove ambiguities by a circle median filter. The retrieval process is detailed in elsewhere, while measurements of sigma-0 flagged by land or ice were removed [2,46]. The designed accuracy in RMSE of H2SCAT mission is <2 m·s−1 or <10% for wind speed and <20° for wind direction, between wind speeds of 2 and 24 m·s−1 [2].

2.1.2. Wind Observations by NDBC and TAO Buoys

Wind observations during the 36-month observation period (2012–2014) were obtained from 51 moored buoys operated by the National Data Buoy Center (NDBC) [47] (also see www.ndbc.noaa.gov) and 30 moored buoys operated by the Tropical Atmospheric Ocean (TAO) project. The locations of these buoys are shown in Figure 1. Most of the NDBC buoys are 3-meter discus buoys, with an anemometer height of 5 m above sea level. The TAO wind observations (see http://tao.ndbc.noaa.gov) include 20 Autonomous Temperature Line Acquisition System (ATLAS) buoys with 4 m height from and 10 Triangle Trans Ocean Buoy Network (TRITON) buoys with 3.5 m height. In order to make the buoy data comparable with scatterometer data, all of the buoy winds were converted to 10-m neutral winds using the LKB model [48,49].

2.1.3. ERA-Interim 10-m Wind Reanalysis Data

The U- and V-components of the wind vectors obtained by ERA-Interim in 2012–2014 (at a height of 10 m) were acquired for this study. ERA-Interim is the latest global atmospheric reanalysis produced by the European Centre for Medium-Range Weather Forecasts (ECMWF) [50]. The ERA-Interim was generated by a data assimilation system based on the 2006 release of the atmospheric model and data assimilation system which is called the Integrated Forecasting System (IFS), including a 4-dimensional variational analysis (4D-Var) with a 12-h analysis window. The spatial resolution of the wind data is 0.25° with global coverage and a 6-h time interval (00:00 a.m., 06:00 a.m., 12:00 a.m., and 06:00 p.m. UTC).

2.1.4. ASCAT Retrieved from Sea Surface Wind Vectors

We collected ASCAT on the MetOp-A Level-2 12.5 km Ocean Surface Wind Vector Products in 2012–2014 (https://podaac.jpl.nasa.gov/dataset/ASCATA-L2-12.5km). These data were produced by the Royal Netherlands Meteorological Institute (KNMI) in the Ocean and Sea Ice Satellite Application Facility European Organisation for the Exploitation of Meteorological Satellites (OSI-SAF EUMETSAT) project. ASCAT was launched on 19 October 2006 by EUMETSAT and is similar in design to the scatterometers on board the European remote sensing satellites ERS-1 and ERS-2 [9]. The wind speed bias of the 12.5-km products is −0.19 m·s−1 [31].

2.1.5. CMORPH Precipitation Data

To estimate the effect of rain on the H2SCAT NRT wind vectors, we collected the CMORPH precipitation data during 2012–2014 (http://www.cpc.ncep.noaa.gov/products/janowiak/cmorph_description.html). CMORPH uses the motion vectors derived from geostationary satellite IR imagery, which are obtained at half-hourly interval, to propagate the relatively high quality precipitation estimates derived from passive microwave data aboard the DMSP 13, 14 and 15 (SSM/I), the NOAA-15, 16, 17 and 18 (AMSU-B), and AMSR-E and TMI aboard NASA’s Aqua and TRMM spacecraft [45]. The global coverage of this dataset is 60°S–60°N, with a horizontal resolution of 8 km by 8 km and an acquisition interval of 30 min since January 1998. The CMORPH precipitation data indicate high quality when compared to the rain gauges over various regions [51,52,53].

2.2. Collocations

The time intervals of the NDBC and TAO observations are 60 and 10 min, respectively. Therefore, the buoys data were temporally collocated to H2SCAT using data pairs with time spans below 30 min for NDBC and 5 min for TAO. Because H2SCAT is spatially resolved to 25 km with global coverage, all data pairs separated by less than 12.5 km are included in the evaluation. ERA-interim is collocated with each H2SCAT wind vector cells (WVCs) by data pairs with temporal and spatial scales of 15 min and 6.75 km. The H2SCAT and ASCAT were collocated into data pairs with timespans of less than 1 h and distances less than 6.75 km. Similar to the collocated data between QuikSCAT and ASCAT in a 1-h span [22], the collocations of the two SCATs just cover the polar area in 1-h due to the large difference of the local time between them (see Figure 2a). When we expand the time span to 3-h, the collocations cover all over the world (see Figure 2b). Because of the high calculation cost, we sampled one out of every 50 of the collocated SCAT wind vector pairs. Considering the consistency of wind direction, we convert all the oceanographic convention data to the meteorological convention in this study. The CMORPH precipitation data, which have high spatial and temporal resolution, are collocated to the observation points already collocated between the buoys, ERA-Interim or ASCAT (3-h time span) and H2SCAT wind vectors, taking ±15 min and ±4 km around each point, respectively. Due to the coverage of the CMORPH data, the rain-effects on the retrieved wind vectors in the polar region are not discussed.

2.3. Statistical Methods

The statistical methods were those used by Pensieri [54] in their QuikSCAT assessment. The mean bias errors are calculated as
m e a n s p d = 1 N i = 1 N ( s p d _ h 2 i s p d _ r e f i )
and
m e a n d i r = 1 N i = 1 N ( d i r _ h 2 i d i r _ r e f i )
The root mean square errors (RMSEs) are given by
r m s s p d = 1 N i = 1 N ( s p d _ h 2 i s p d _ r e f i ) 2
and
r m s d i r = 1 N i = 1 N ( d i r _ h 2 i d i r _ r e f i ) 2
The standard deviations (STD) are
s t d s p d = 1 N i = 1 N ( s p d _ h 2 i s p d _ r e f i m e a n s p d ) 2
and
s t d d i r = 1 N i = 1 N ( d i r _ h 2 i d i r _ r e f i m e a n d i r ) 2
where m e a n s p d denotes the mean bias of all collocated wind speed pairs between H2SCAT and the other observations (buoys, ERA-Interim, ASCAT), N is the number of collocations, and s p d _ h 2 i and s p d _ r e f i denote the i th wind speed of H2SCAT and the other data, respectively. The wind direction counterparts are denoted by m e a n d i r ,   d i r _ h 2 i and _ r e f i . As the wind direction must be continuous at 0° and 360°, it is modified such that d i r _ r e f i =   d i r _ r e f i + 360 °   when d i r _ h 2 i d i r r e f i   > 180°, and d i r _ h 2 i =   d i r _ h 2 i + 360 °   when d i r _ h 2 i d i r _ r e f i < −180°. It is easy to prove that r m s s p d 2 = m e a n s p d 2 + s t d s p d 2 and r m s d i r 2 = m e a n d i r 2 + s t d d i r 2 .

3. Results

3.1. Comparison with TAO Moored Buoys

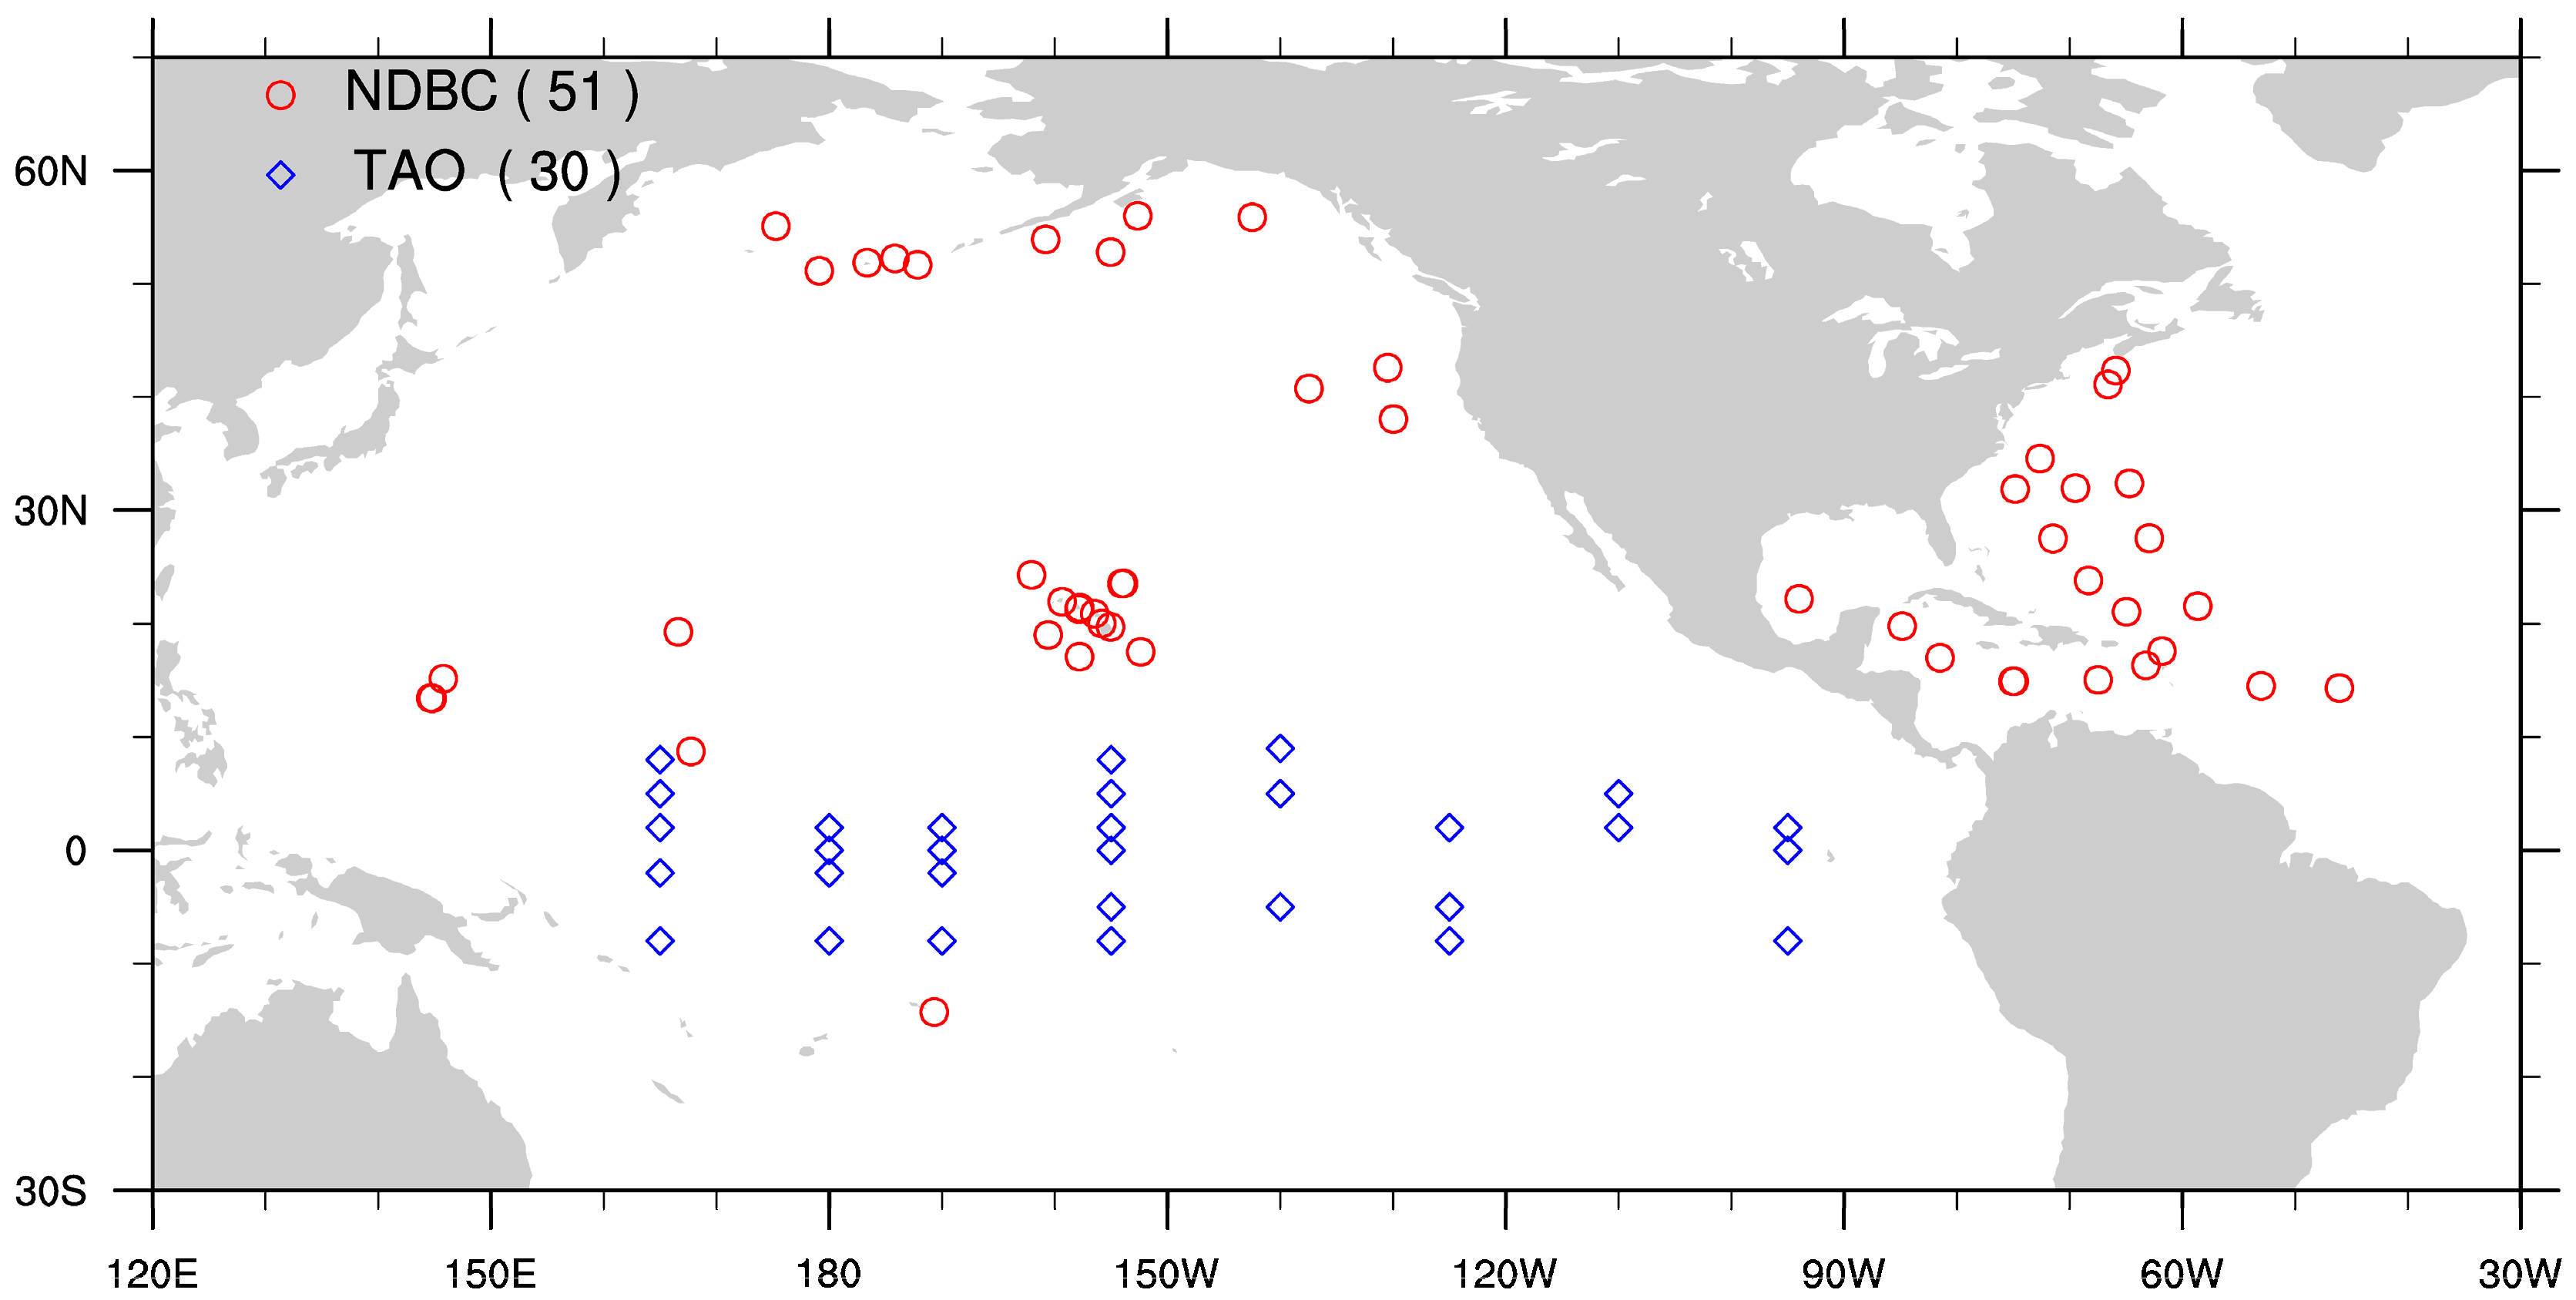
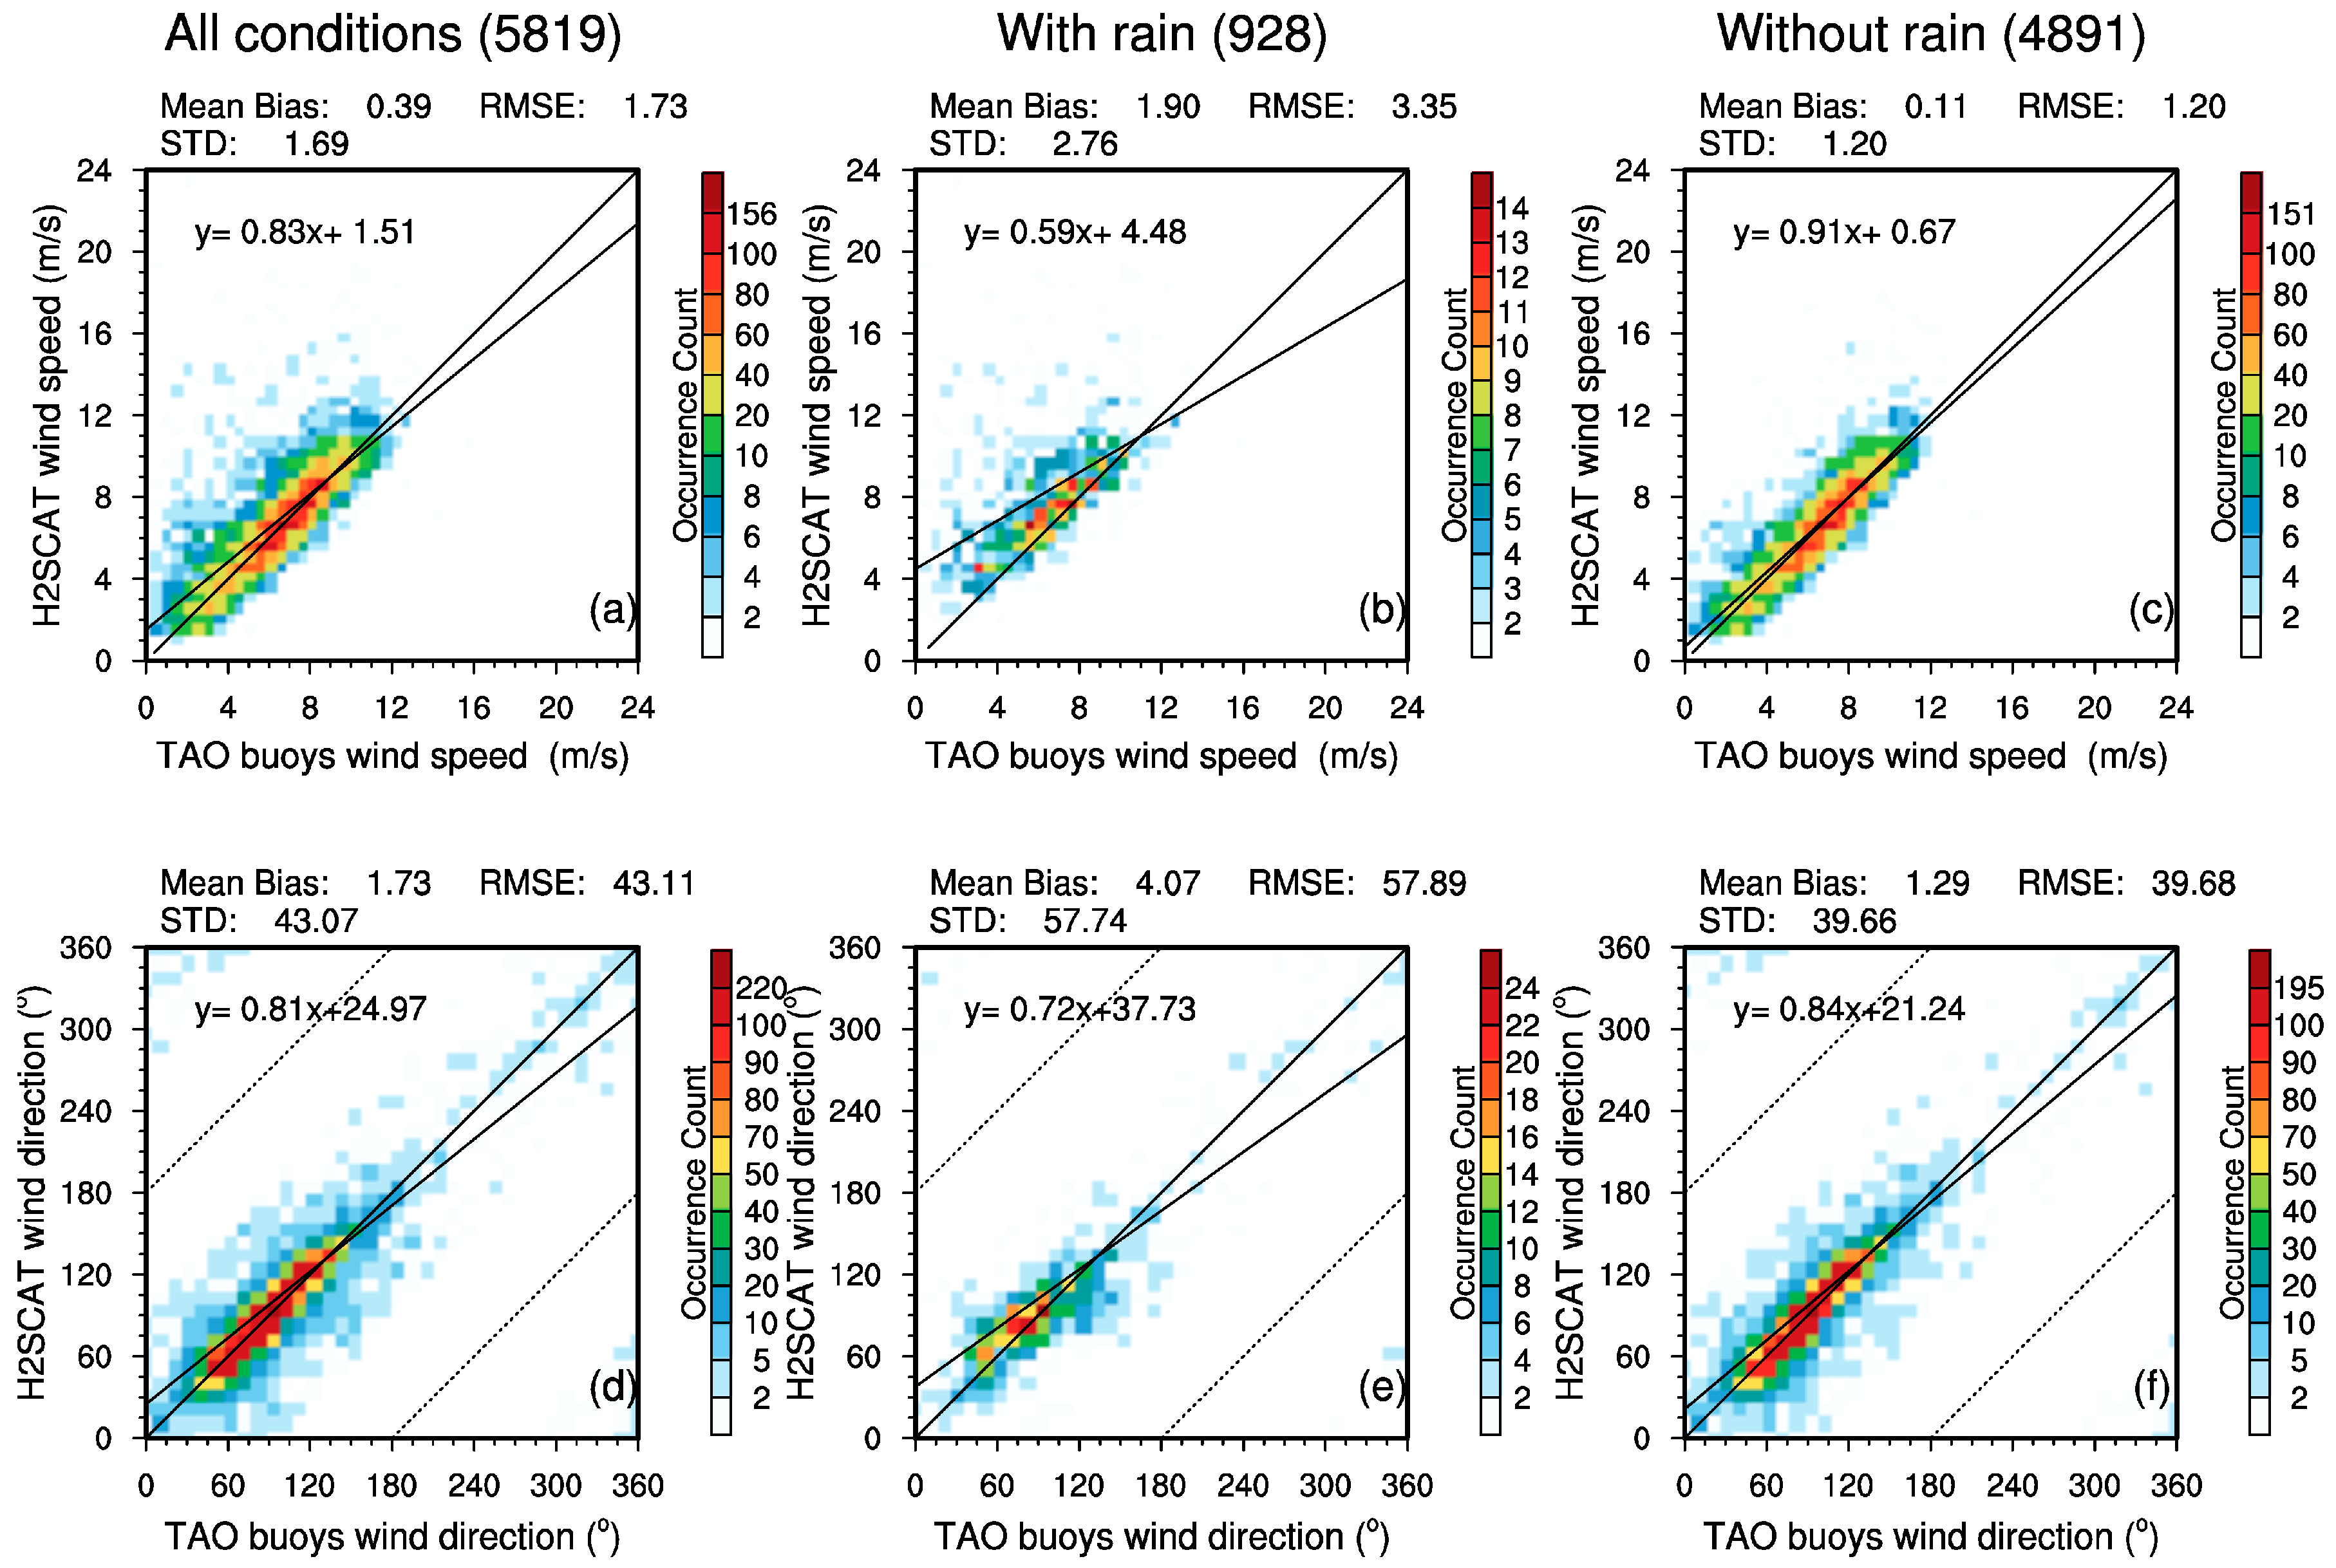
All of the TAO moored buoys are located near the equatorial Pacific. From January 2012 to December 2014, 5819 collocated pairs between the TAO buoys and H2SCAT were found. The 2-D histogram comparisons of the wind speeds and directions between TAO and H2SCAT under three conditions (all-weather, rain and rain-free) are presented in Figure 3. The linear regressions in the 2-D histograms (regression coefficients 0.83 and 0.91 under all-weather and no-rain conditions, respectively) demonstrate the accuracy of the H2SCAT data, especially the wind speed. H2SCAT slightly overestimated the wind speed (by 0.39 m·s−1) under the all-weather conditions. After the rain effect is rejected, the bias decreases to approximately 0.11 m·s−1. The RMSE of the wind speed was 1.73 m·s−1 overall, falling to 1.20 m·s−1 after rain exclusion. Under rainy conditions, the H2SCAT overestimated the wind speed by 1.90 m·s−1 and the RMSE increased to 3.35 m·s−1. Correspondingly, the linear regression coefficient reduced to 0.59 with a larger intercept of 4.48 m·s−1.
The linear regression coefficients of the wind directions between H2SCAT and TAO are about 0.8. H2SCAT shows a slightly positive bias ~1.73°, reducing to 1.29° under rain-free conditions. Under all-weather conditions, most of the H2SCAT wind directions were in good agreement with the TAO buoys, and the overall RMSE was 43.11°. The RMSE increased to 57.89° under rainy conditions, and reduced to 39.68° without rain. Under rainy conditions, the linear regression coefficient of the wind direction between H2SCAT and TAO reduced to 0.72 with an intercept of 37.73°. In general, rain increases the uncertainty in both the speed and direction of wind. The effects of rain on wind vector retrievals are obvious and consistent with those of the SeaWinds scatterometer [38].
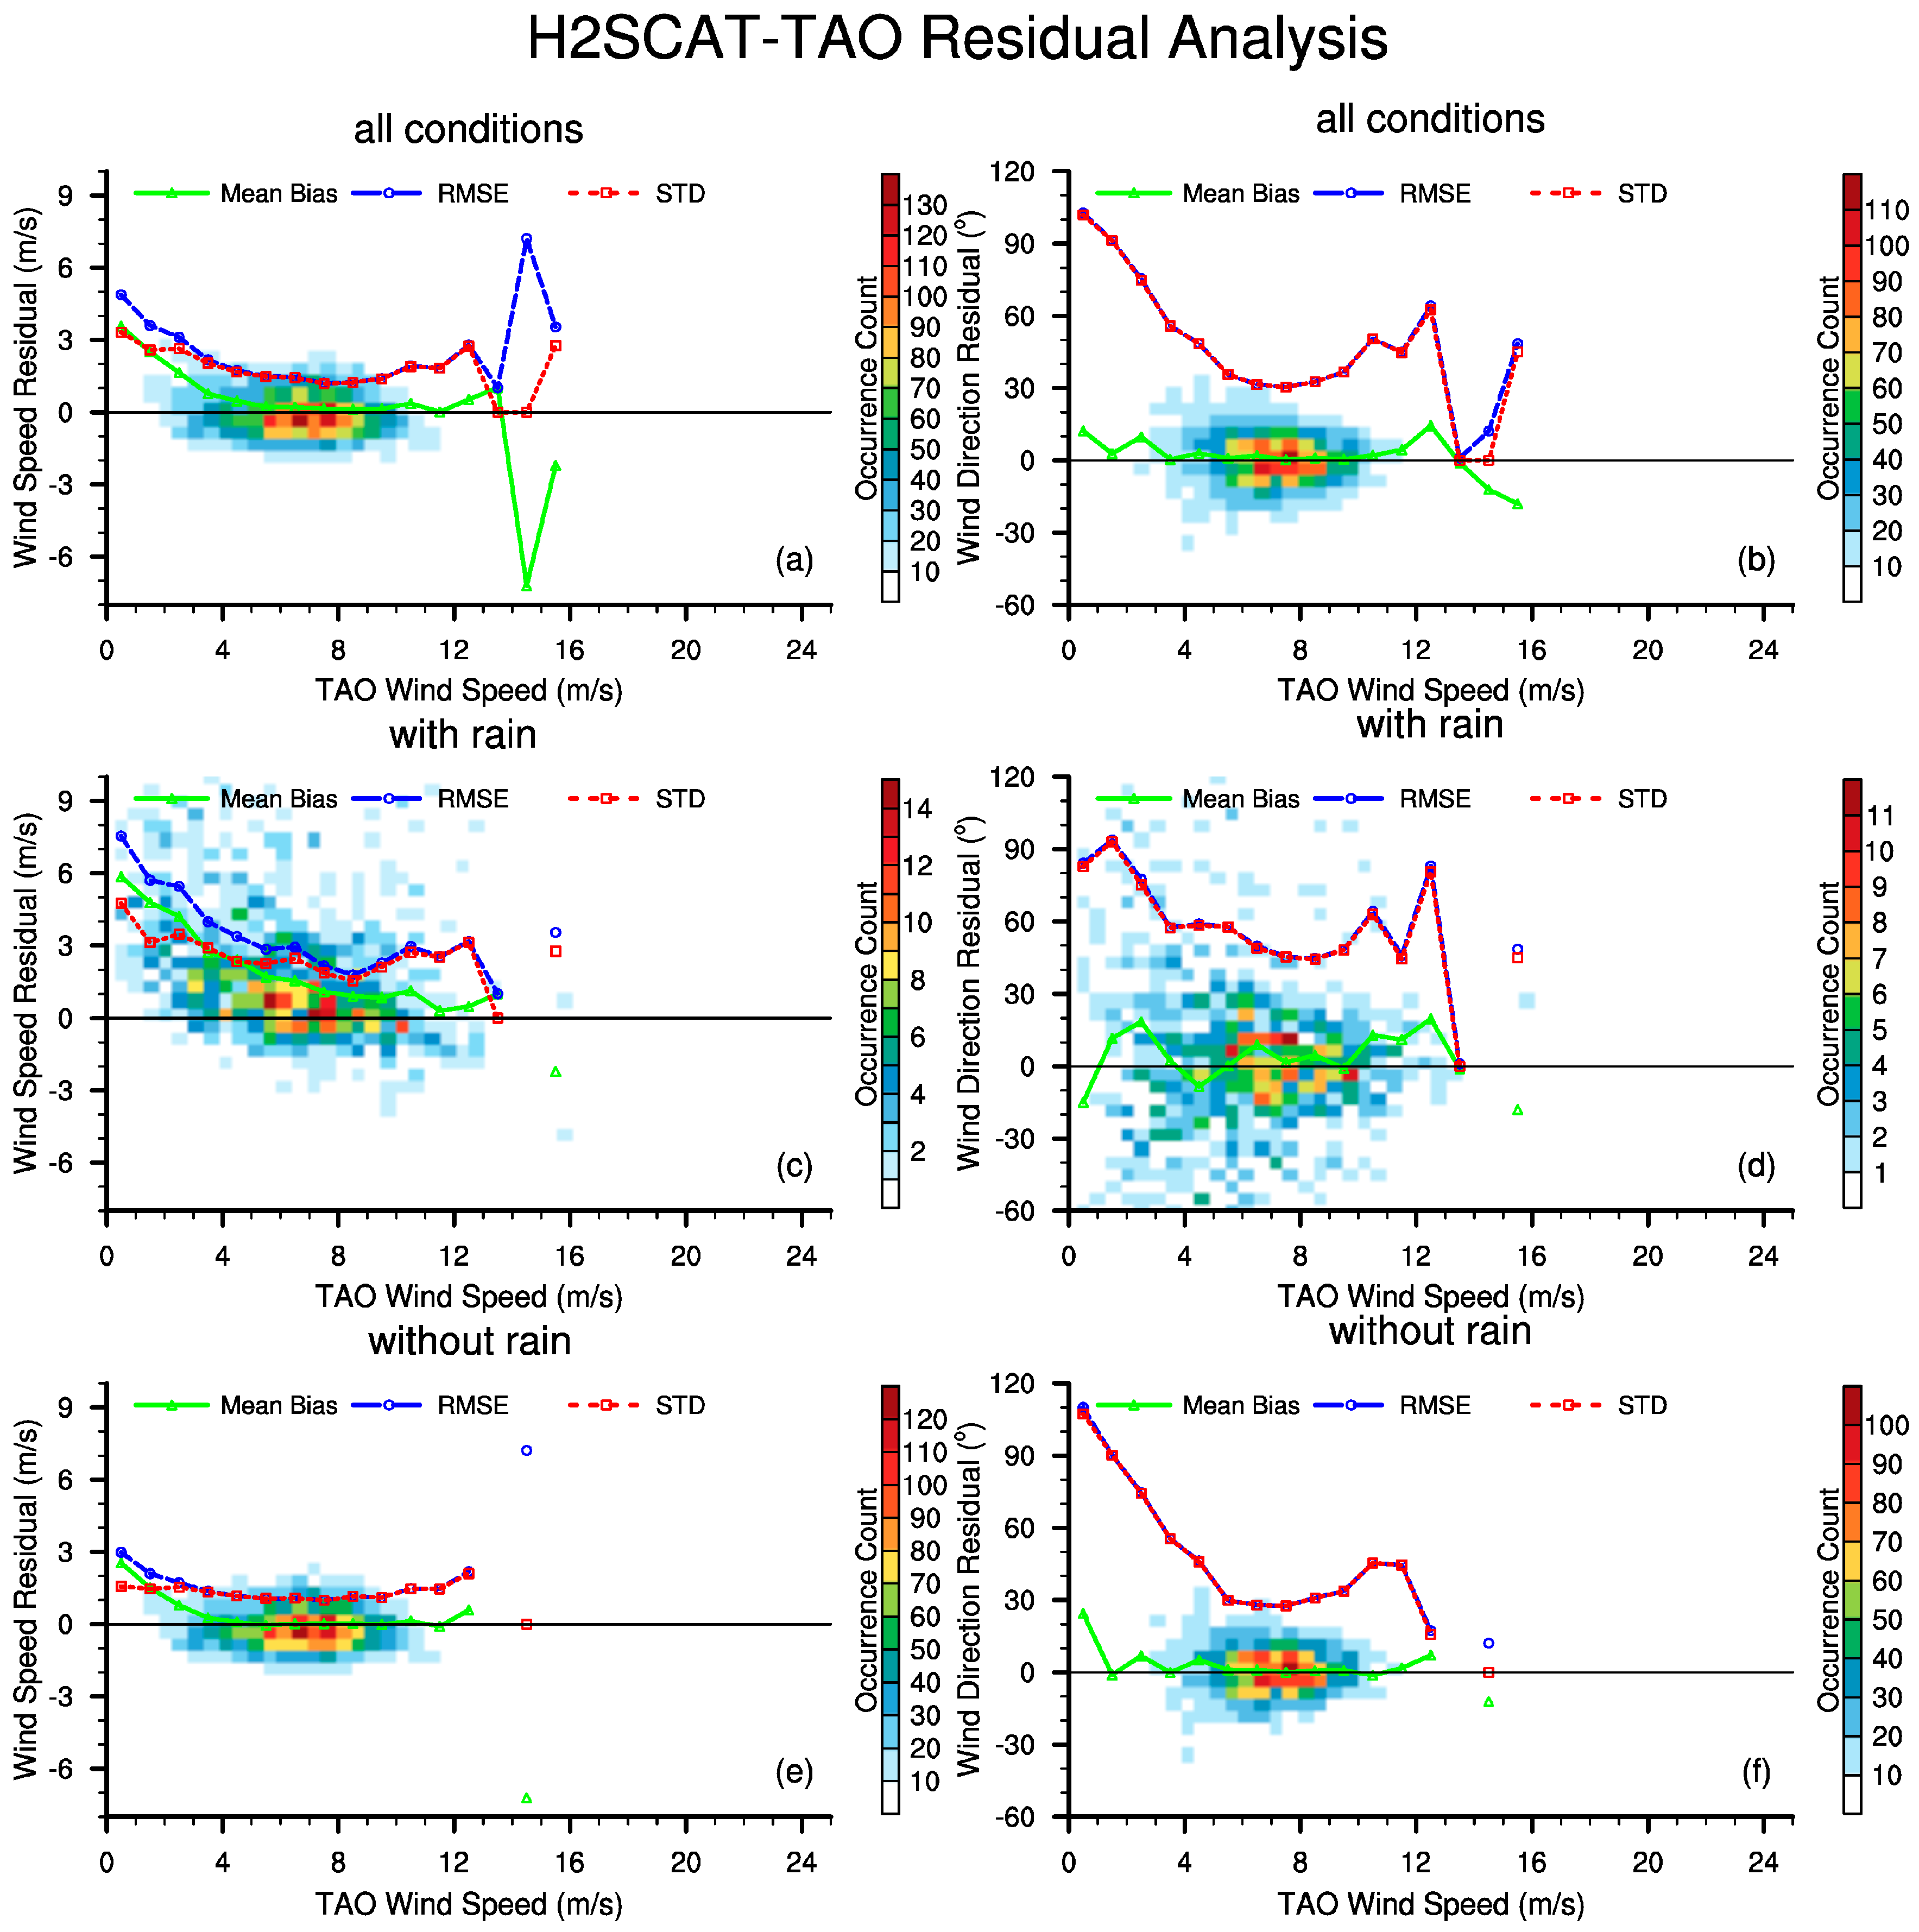
The wind speed and wind direction residuals (H2SCAT-TAO) under all-weather, rain and rain-free conditions, are presented in Figure 4. The residual are calculated for 1 m·s−1 bins of the TAO buoy wind speeds. Table 1 summarizes the statistical parameters of the wind speeds and directions between the H2SCAT and TAO buoys. Results are shown for the low, moderate, and high wind speed ranges under all-weather, rain, and no-rain conditions. Under all-weather conditions and moderate wind speeds (4–13 m·s−1, which includes more than 86% of the collocated data), the bias in the wind speed was nearly zero and the STD was below 2 m·s−1. At low wind speeds (<4 m·s−1, which includes less than 13% of the collocated data), the bias was positive and varied from 3.5 to 1 m·s−1. Correspondingly, the STD varied from 3.5 to 2.0 m·s−1. Only 93 pairs of collocated data were found in the high speed range (>13 m·s−1), and the bias in this range was large and irregular. The wind direction shows no obvious bias at all wind speeds. The bias was irregular at low and high wind speeds. The STD decreased from ~100° in the low wind-speed range to ~30° in the moderate wind-speed range (<7 m·s−1), and increased again to 60° at high wind speeds.
The precipitation more severely affected the H2SCAT data at low wind speeds than at high wind speeds. In most cases, the wind speed was overestimated under rainy conditions. The positive bias at low wind speed (<4 m·s−1) reached as high as 3–6 m·s−1. Similar effects of rain were reported for QuikSCAT winds [37]. Under rain-free conditions, the H2SCAT wind speed better matched the buoy wind speed in most ranges. The STDs of the wind speed were below 1.5 m·s−1, and the biases were generally negligibly small. Precipitation always worsened the wind direction products of H2SCAT, especially in the moderate wind speed range (4–10 m·s−1).

3.2. Comparison with NDBC Moored Buoys

Most of the NDBC buoys used in this study lie in the Mid-latitude Ocean. In the three-year observation period, 20,867 pairs of wind vectors were collocated between H2SCAT and the NDBC buoys. Figure 5 presents the 2-D histograms of wind speeds and directions between the H2SCAT and NDBC buoys under different conditions. Under the all-weather conditions, the H2SCAT wind speeds were consistently overestimated relative to the NDBC. The mean biases in the wind speed were 0.44 m s1 for all collocated data and 0.34 m·s1 without rain, but increased to approximately 1.58 m s1 under rainy conditions. The RMSE was 1.78 m·s1 without rain, increasing to 3.29 m·s1 under the rain effect. The overall average RMSE is 1.94 m·s1. The linear regression coefficient is 0.98 and 0.99 under all-weather and rain-free conditions, which also implies that the wind speed of H2SCAT agrees well with NDBC. Most of the points in the wind direction plots gather near the 1-to-1 slope. The wind directions of H2SCAT are slightly positive bias (0.56°) under all-weather conditions. The bias drops to 0.46° under rain-free. Overall, the average RMSE was about 46.63°, increasing to 55.39° and falling to 45.78° in the rainy and rain-free cases, respectively.
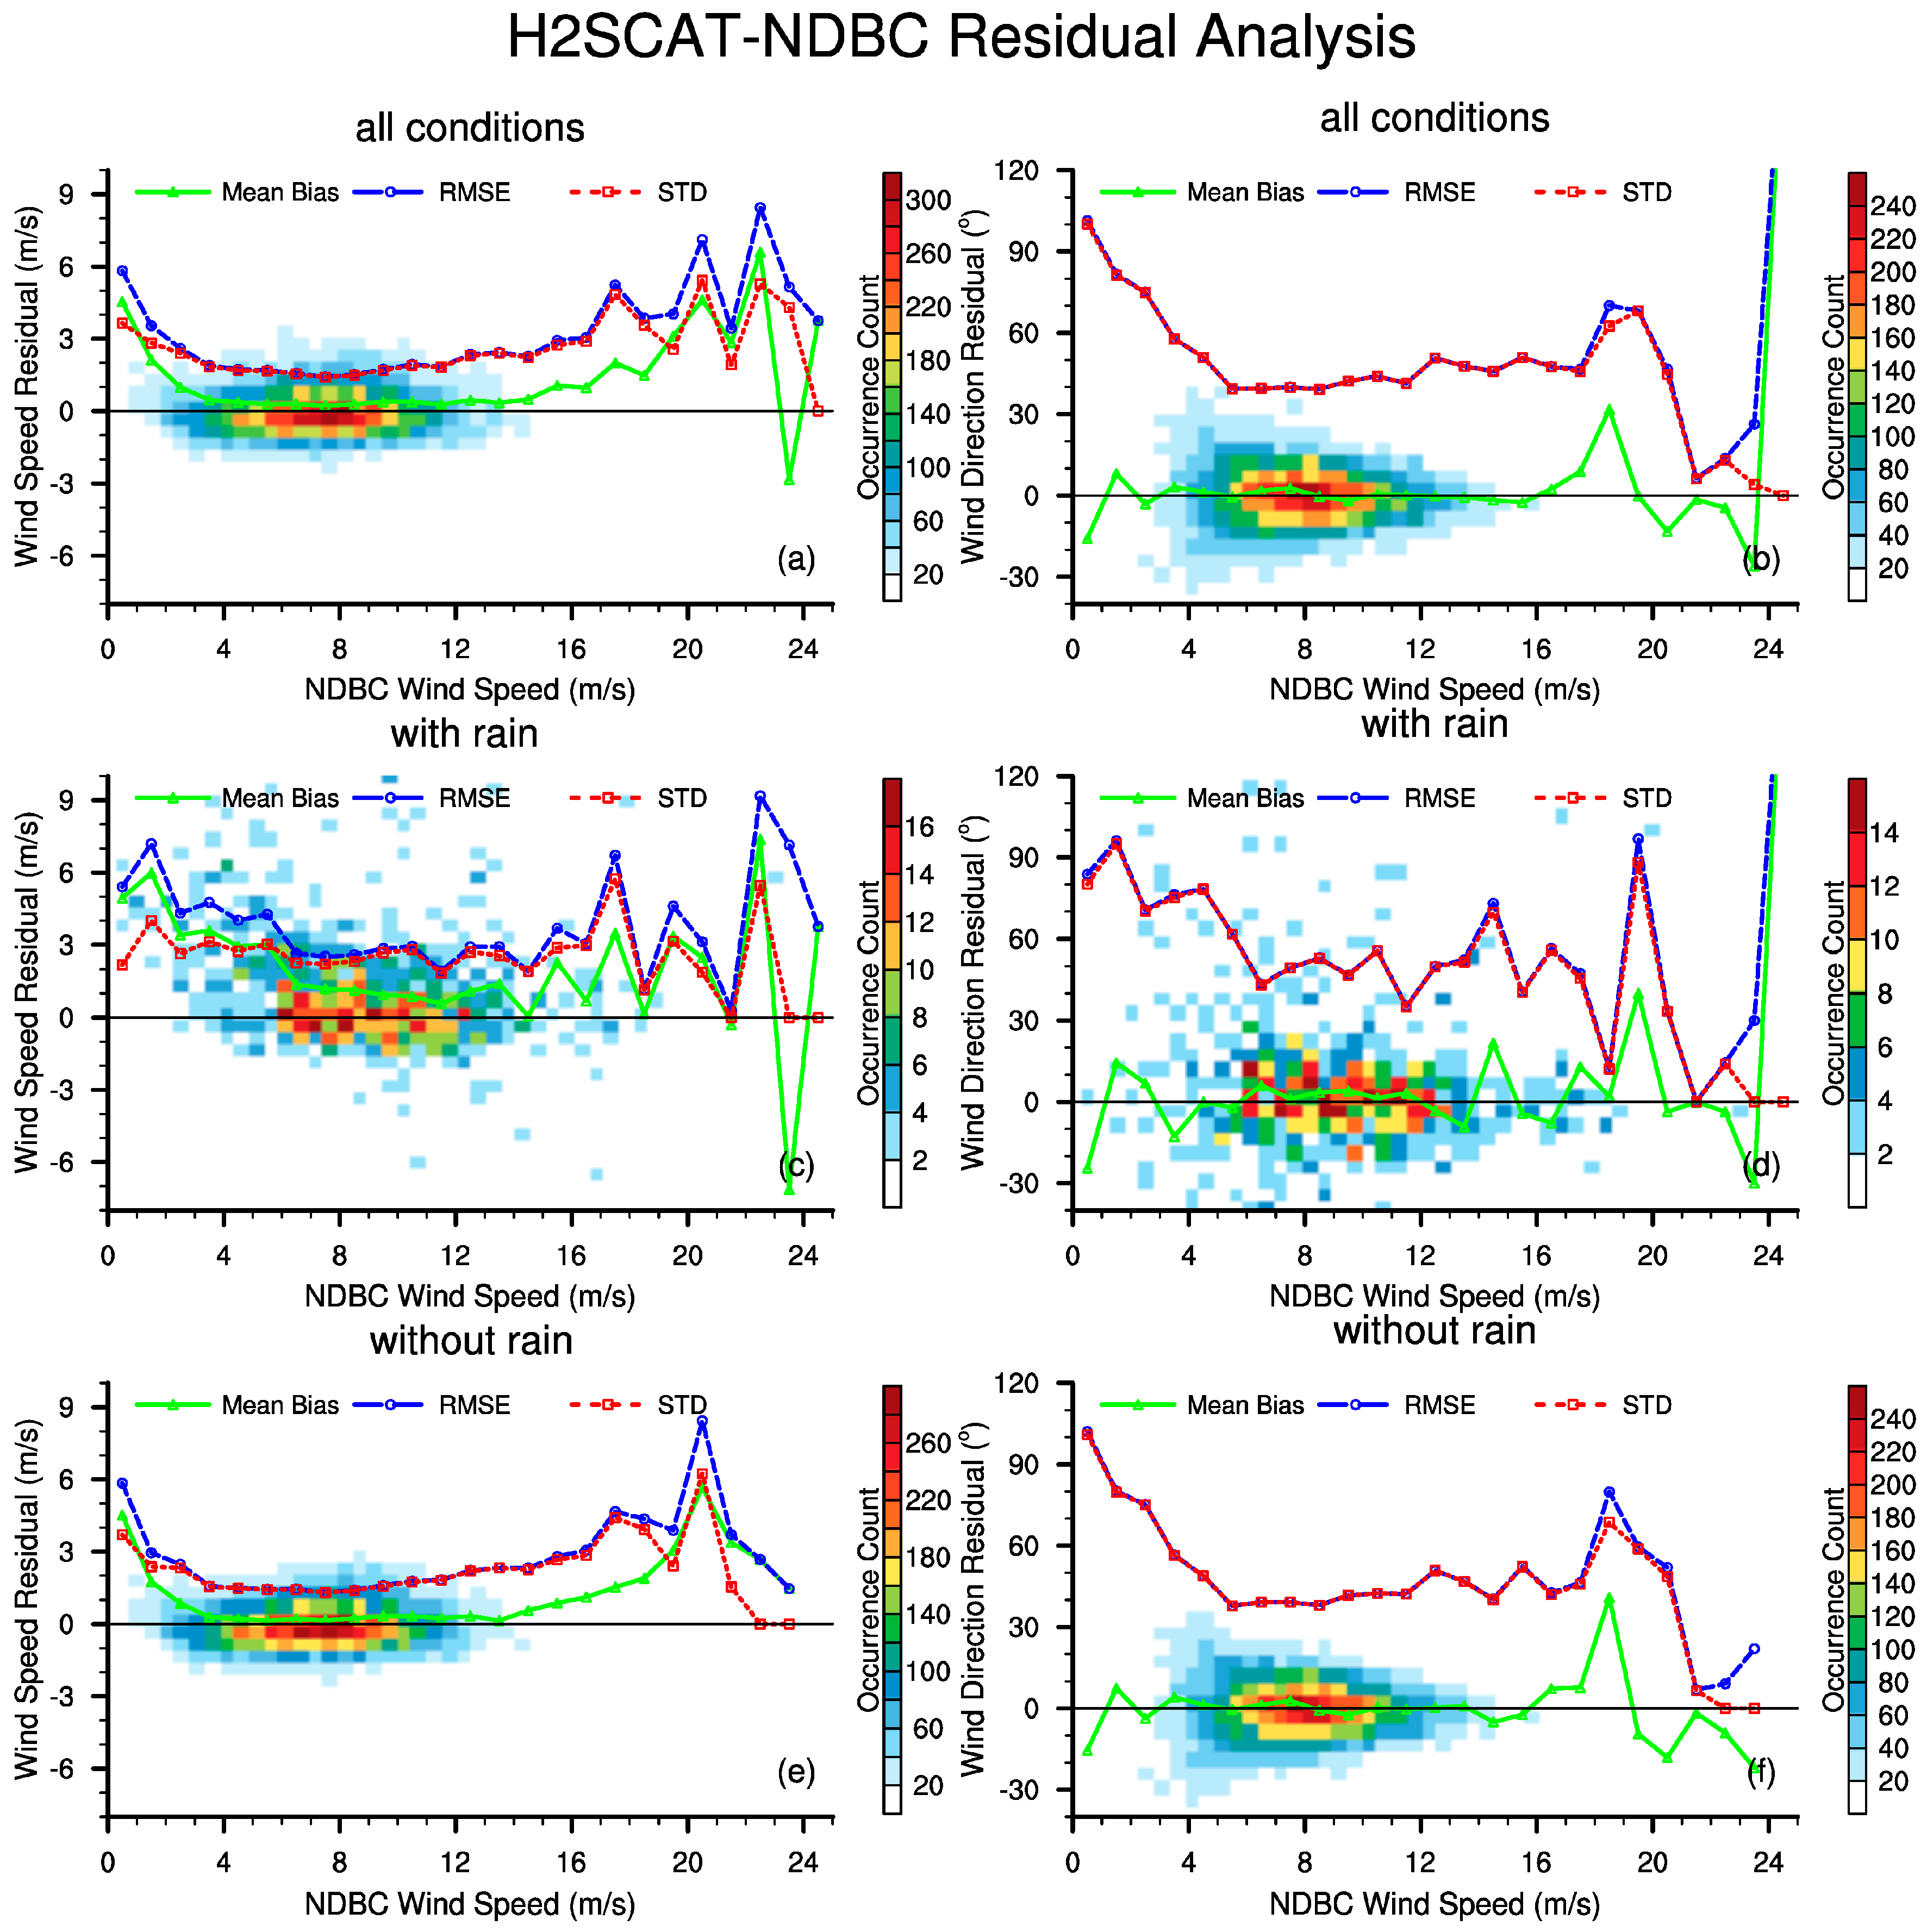
Figure 6 plots the residuals (H2SCAT-NDBC) of the two components of all collocated wind vectors under all-weather, rain and rain-free conditions. Table 2 summarizes the statistical parameters between the H2SCAT and NDBC buoys under all-weather, rain and no-rain conditions. Again, the results are separated into three ranges of wind speeds (low, moderate, and high). The H2SCAT wind speeds were consistently overestimated. The positive bias reached as high as 4–7 m·s1 especially at low (<4 m·s1) and high (>13 m·s1) wind speeds. The STD of the wind speed was 1.65 m·s1 in the moderate wind speed range (4–13 m·s1, which includes more than 90% wind data). At low (<4 m·s1) and high (>13 m·s1) wind speeds, the STD was approximately 2–3 m·s1 and up to 7 m·s−1, respectively. The wind direction exhibited almost no bias and the STD was about 42° at moderate wind speeds (4–13 m·s−1). At low and high wind speeds, the STD is large, up to 100°.
Under rainy conditions, the bias in the H2SCAT wind speed increases to 6 m·s−1, while the STD reached about 4 m·s−1. The increases were especially marked at low and high wind speeds. At moderate wind speeds (4–13 m·s−1) in rain-free conditions, the wind speed bias almost vanished and the STD fell to below 1.5 m·s−1. The bias and STD of wind speed were both highly reduced at low wind speeds (<4 m·s−1), but were slightly improved at high wind speeds (>13 m·s−1). Regarding the wind direction, the bias in rain-free condition was almost zero, but was slightly increased under rainy conditions in all speed range. The STD of the wind direction was relatively insensitive to rain, except at some low and moderate wind speeds. The STD of wind direction reached ~100° at low wind speeds (<4 m·s−1), regardless of rain. The STDs were more variable under rainy conditions than under rain-free conditions are high wind speed (>13 m·s−1).

3.3. Comparison with ERA-Interim Reanalysis

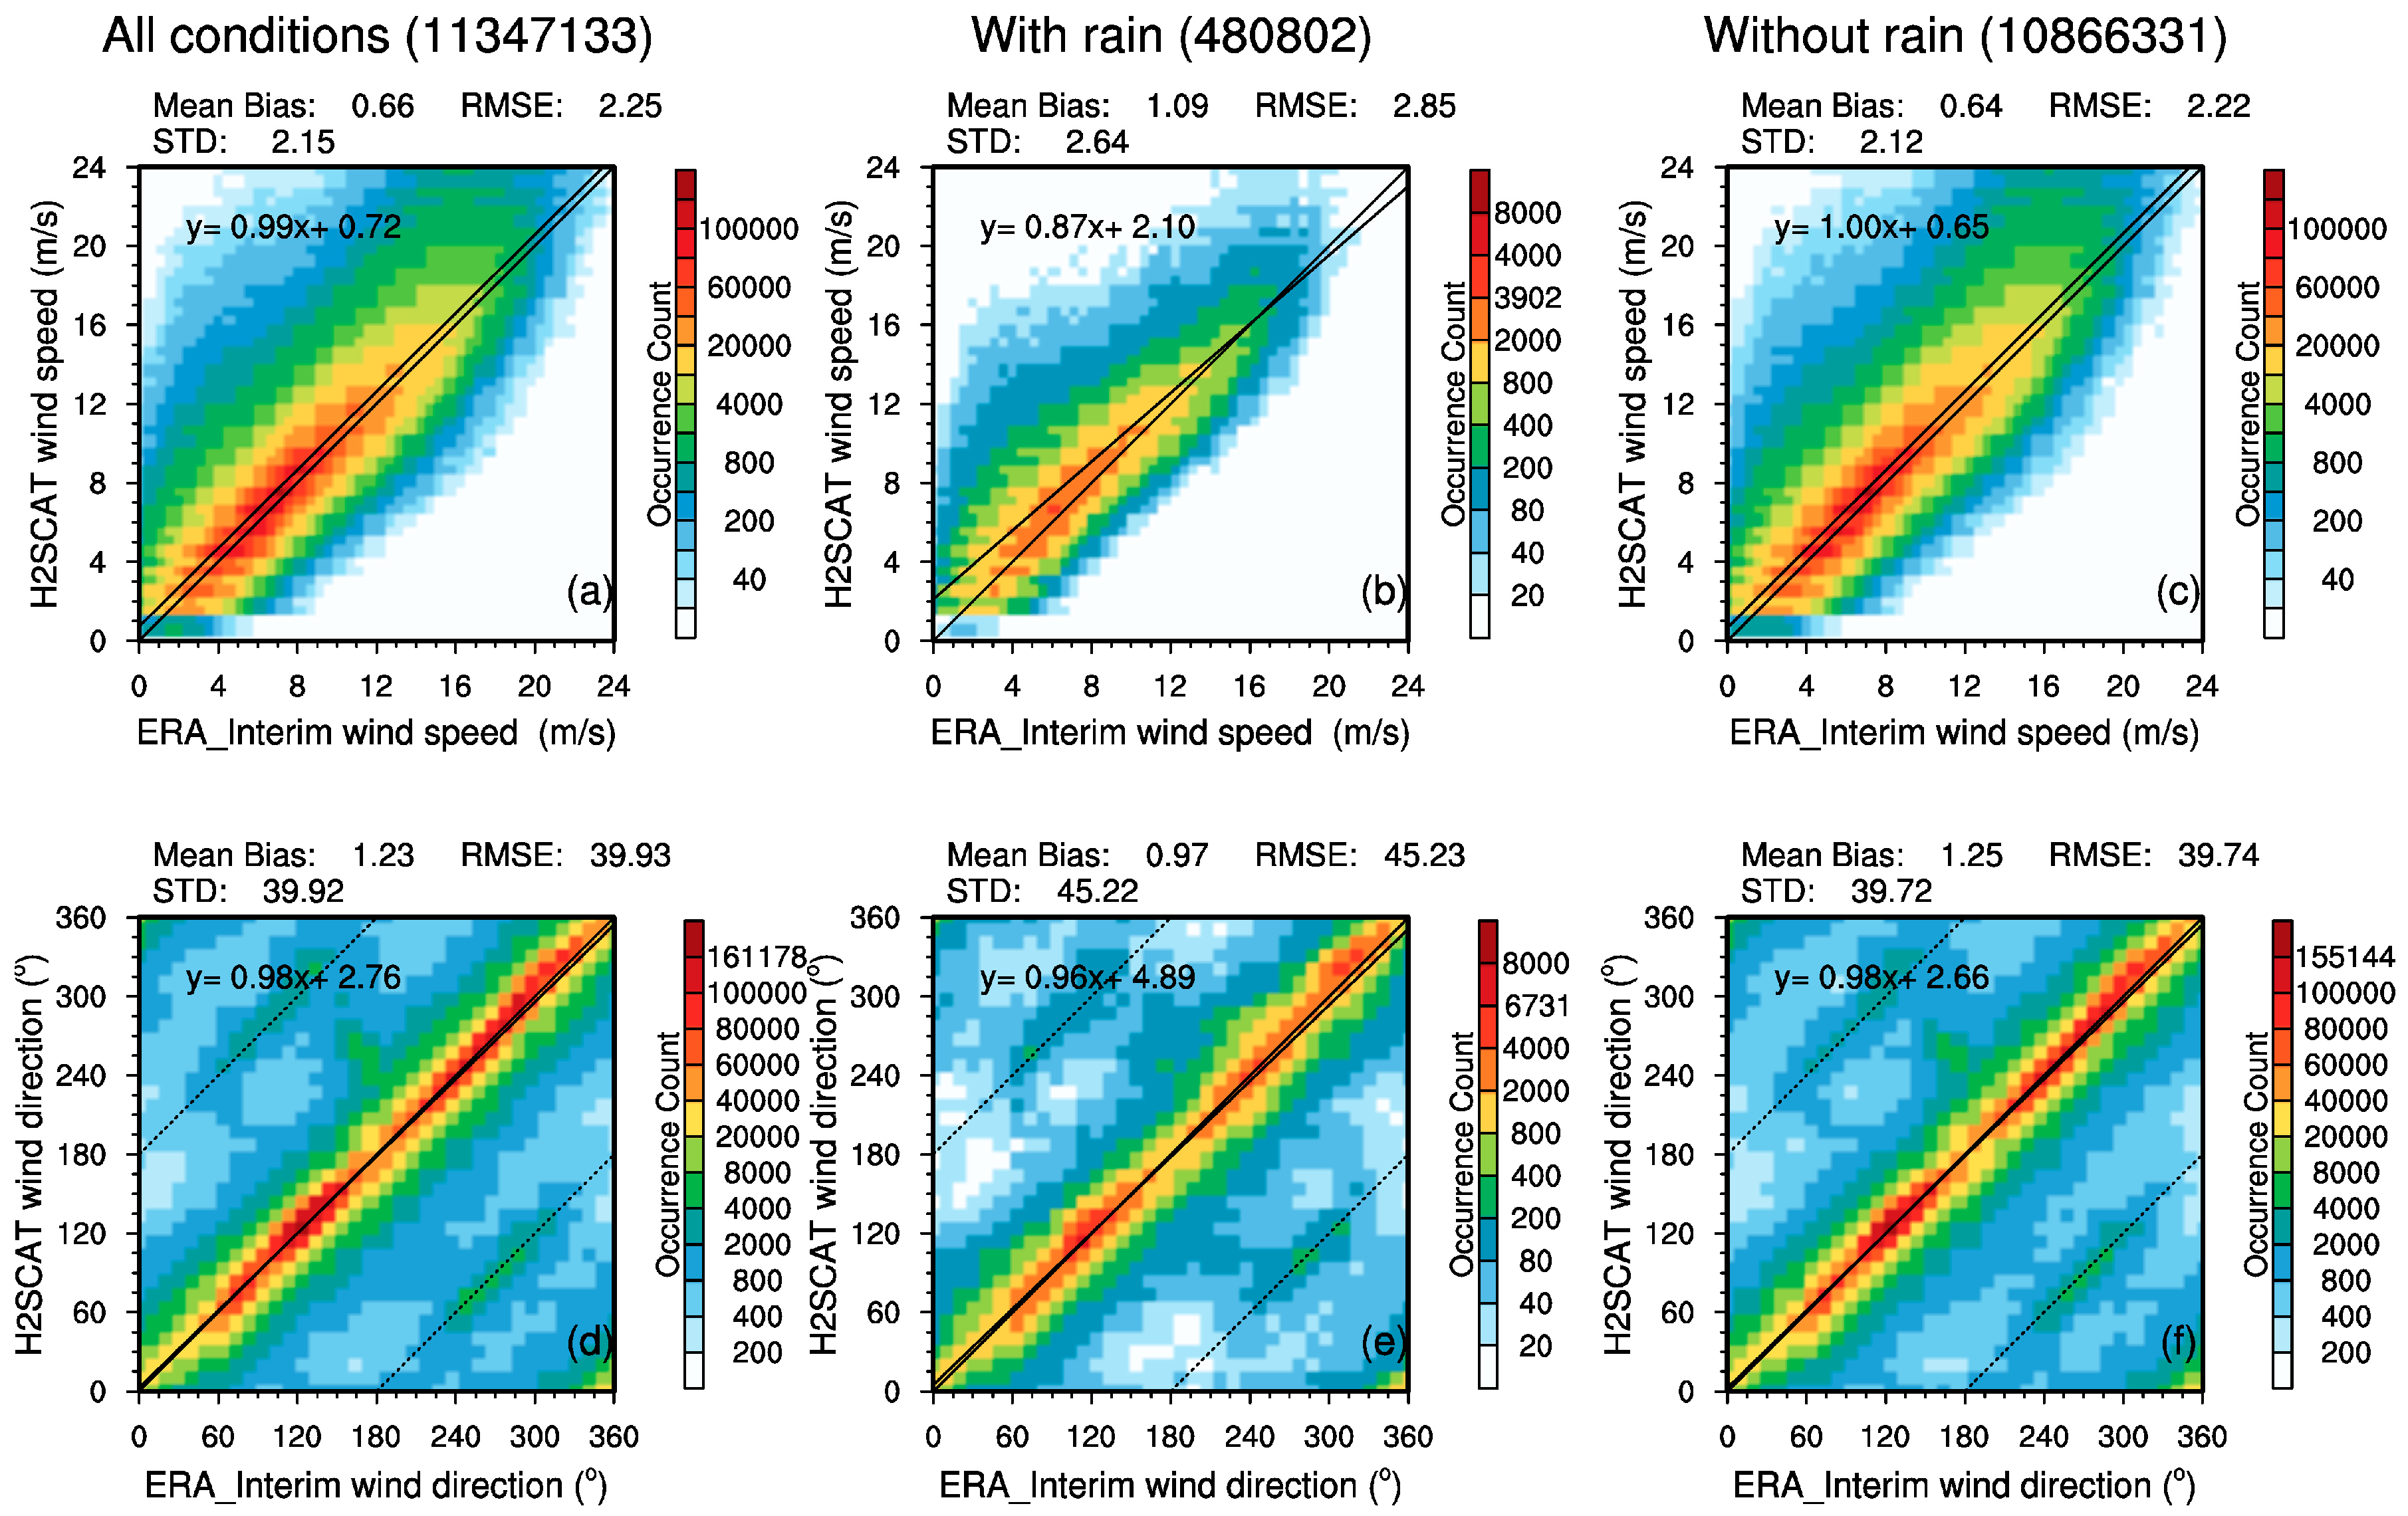
For each collocated pair, the U and V components of ERA-Interim reanalysis were converted to wind speeds and directions. The collocated data pairs for comparison numbered 11,347,133 over the three years, including 480,802 (4.24%) under rainy conditions and 10,866,331 (95.76%) under rain-free conditions. Figure 7 plots the 2-D histograms of the wind speeds and directions between H2SCAT and ERA-Interim. The H2SCAT shows higher accuracy against the ERA-Interim data than under the buoy data in Figure 3 and Figure 5. The linear regression coefficients, particularly for the wind speeds, are as high as 0.99 under the all-weather condition and 1.0 without rain, although systematic biases appear. The overall mean bias of the wind speed was approximately 0.66 m·s−1, reducing to 0.64 m·s−1 without rain. Accordingly, the RMSE reduces from 2.25 under all-weather conditions to 2.22 m·s−1 under rain-free condition, and the STD dropped from 2.15 to 2.12 m·s−1. The error statistics were higher under rainy conditions. The mean bias, RMSE, and STD in the wind speed were 1.09, 2.85, and 2.64 m·s−1, respectively. The mean bias in the wind direction was approximately 1.23° under all-weather conditions, improving to 0.97° under rainy conditions and slightly worsening to 1.25° under rain-free conditions. The RMSE and STD of all collocated pairs approximated 39.93°, slightly reducing to 39.74° under rain-free conditions, and rising to 45.23° with rain.
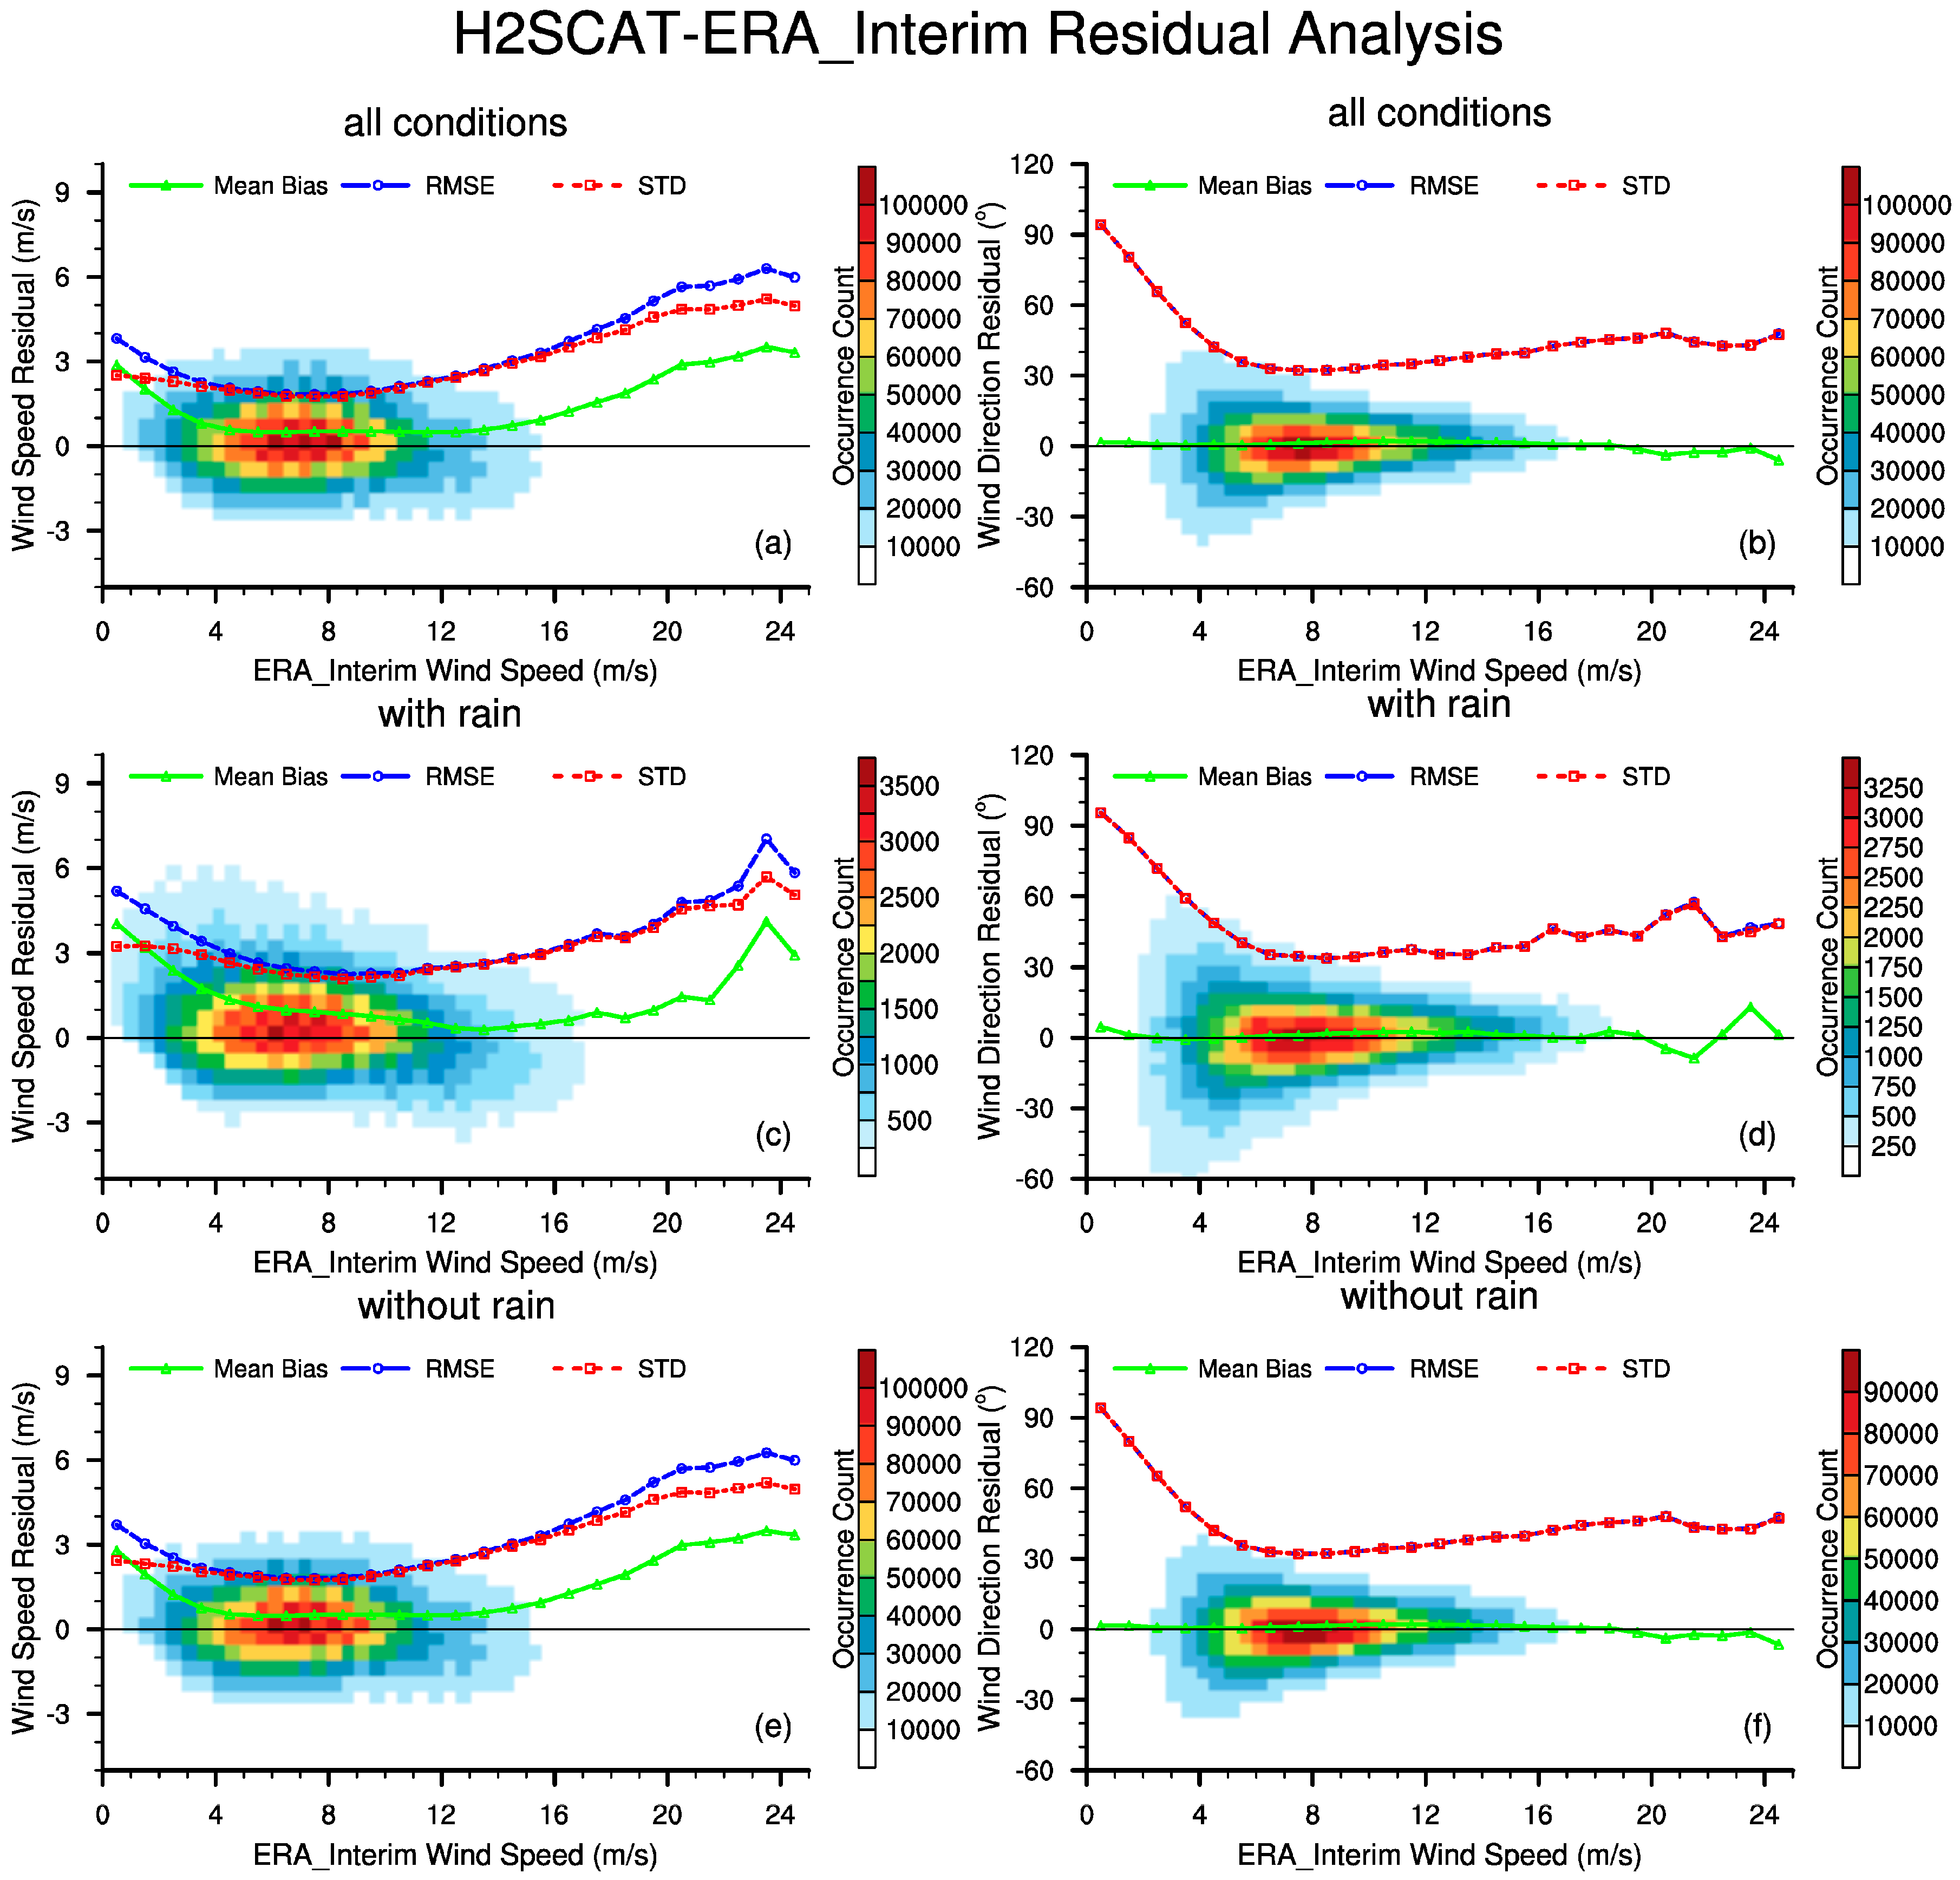
Figure 8 plots the residuals (H2SCAT-ERA-Interim) under the all-weather, rain and rain-free conditions. The residuals of all collocated pairs are similar to those under rain-free conditions. Table 3 summarizes the statistical parameters of wind speed and direction between H2SCAT and ERA-Interim reanalysis under the all-weather, rain and no-rain conditions. The wind speed biases were about 0.5 m·s−1 in the moderate speed range (4–13 m·s−1), where more than 90% of the data are located. The biases enlarged to 2.7–3 m·s−1 at lower (<4 m·s−1) and higher (>13 m·s−1) wind speeds. The STD decreased from 2.5 to 1.8 m·s−1 as the wind speed increased from 0 to 6 m·s−1, but increased to more than 4.0 m·s−1 at high wind speeds (>13 m·s−1). The wind direction shows almost no mean bias. The STD was below 40° at moderate wind speeds (4–13 m·s1) and slightly increased at high wind speed (>13 m·s1). The STD reached as large as 90° at low speed range (<4 m·s1).
Under rainy conditions, the mean biases in the wind speed were amplified to approximately 1 m·s1 at moderate speeds (4–13 m·s1) and to 2–4 m·s1 at low wind speeds (<4 m·s1). The STD was around 2 m·s1 at moderate speeds (4–13 m·s1), but exceeded 3 and 5 m·s1 at low and high wind speeds, respectively. Under the no-rain condition, the mean biases and STDs were small and similar to those under the all-weather condition. This result is attributed to the greater number of occurrences of rain-free pairs than the rainy pairs. The mean bias in the wind direction was very similar in the rainy and rain-free conditions, except for some irregular fluctuations at high speed under rainy conditions. Precipitation slightly degraded the STD of the wind direction at low (<4 m·s1) and high wind speeds (>13 m·s1).

3.4. Comparison with ASCAT Retrieved Wind Vectors

Figure 9 presents the 2-D histograms of wind speed and direction between ASCAT and H2SCAT within 1-h timespan. The H2SCAT show higher accuracy against the ASCAT data than under the buoy data in Figure 3 and Figure 5. The linear regression coefficients are as high as 1.05 for the wind speeds and 0.81 for directions. The wind speeds of both scatterometer data are consistent. The mean bias of the wind speed is almost zero, and the RMSE and STD both equal 1.62 m·s−1. However, the wind directions differ between the two datasets. Although the mean bias is small (0.68°), the RMSE and STD are relatively high (47.5°).
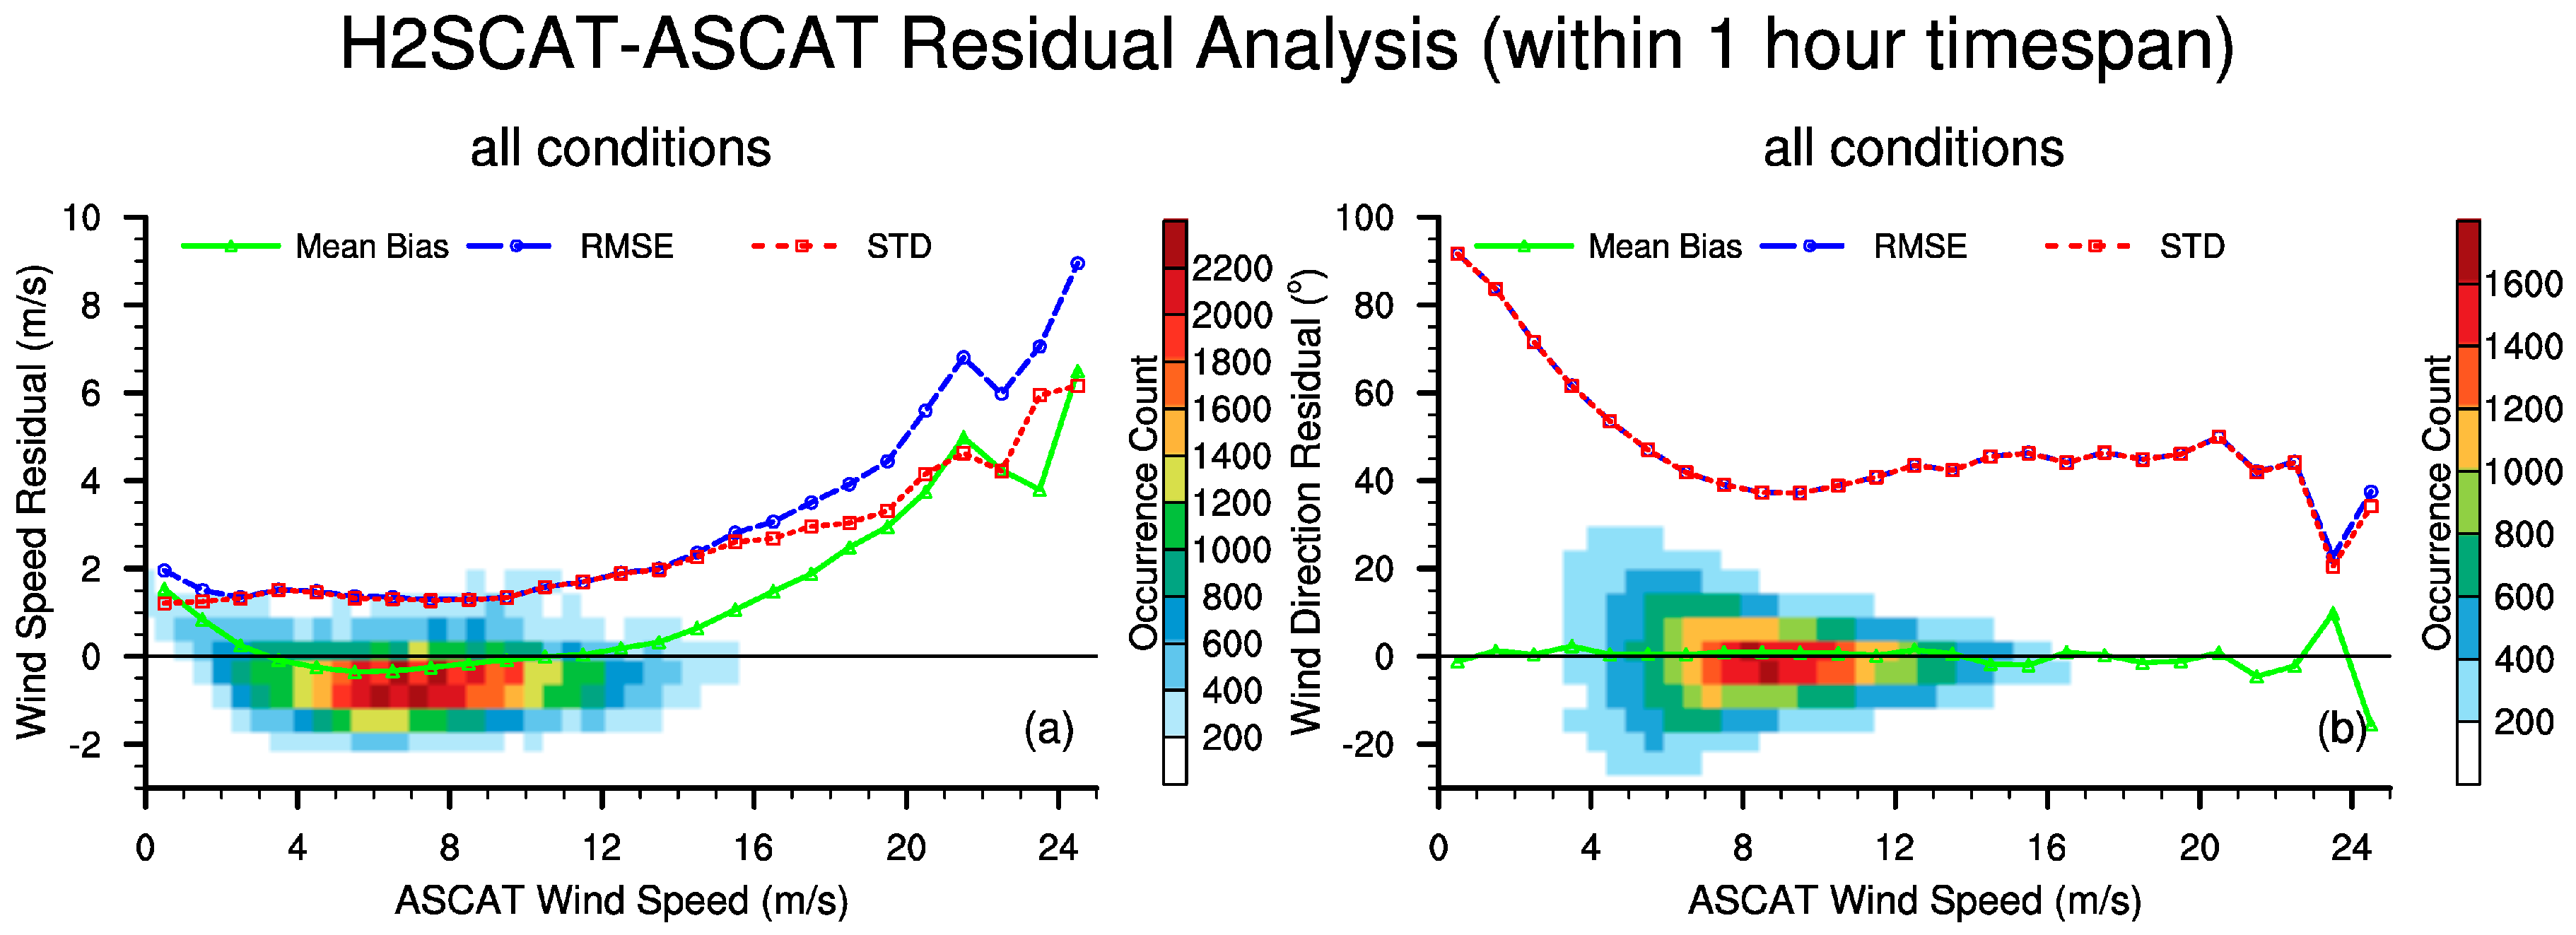
The residual analysis is shown in Figure 10. Table 4 summarizes the statistical parameters of wind speeds and directions between H2SCAT and ASCAT within 1-h timespan. At low (<4 m·s−1) and moderate wind speeds (4–13 m·s−1), the wind speed bias almost vanished and the STD was below 2 m·s−1. In contrast, at high wind speeds (>13 m·s−1), the bias dramatically increased to more than 5 m·s−1, and the STD was amplified up to 6 m·s−1. These results are probably due to the obvious underestimation of ASCAT at wind speed exceeding 20 m·s−1 [32]. The wind direction was negligibly biased by less than 2°, but the STD was increased to 50°–90° at low wind speeds (<4 m·s−1). At moderate (4–13 m·s−1) and high wind speeds (>13 m·s−1), the bias was close to 0°, whereas the STD was around 43°.
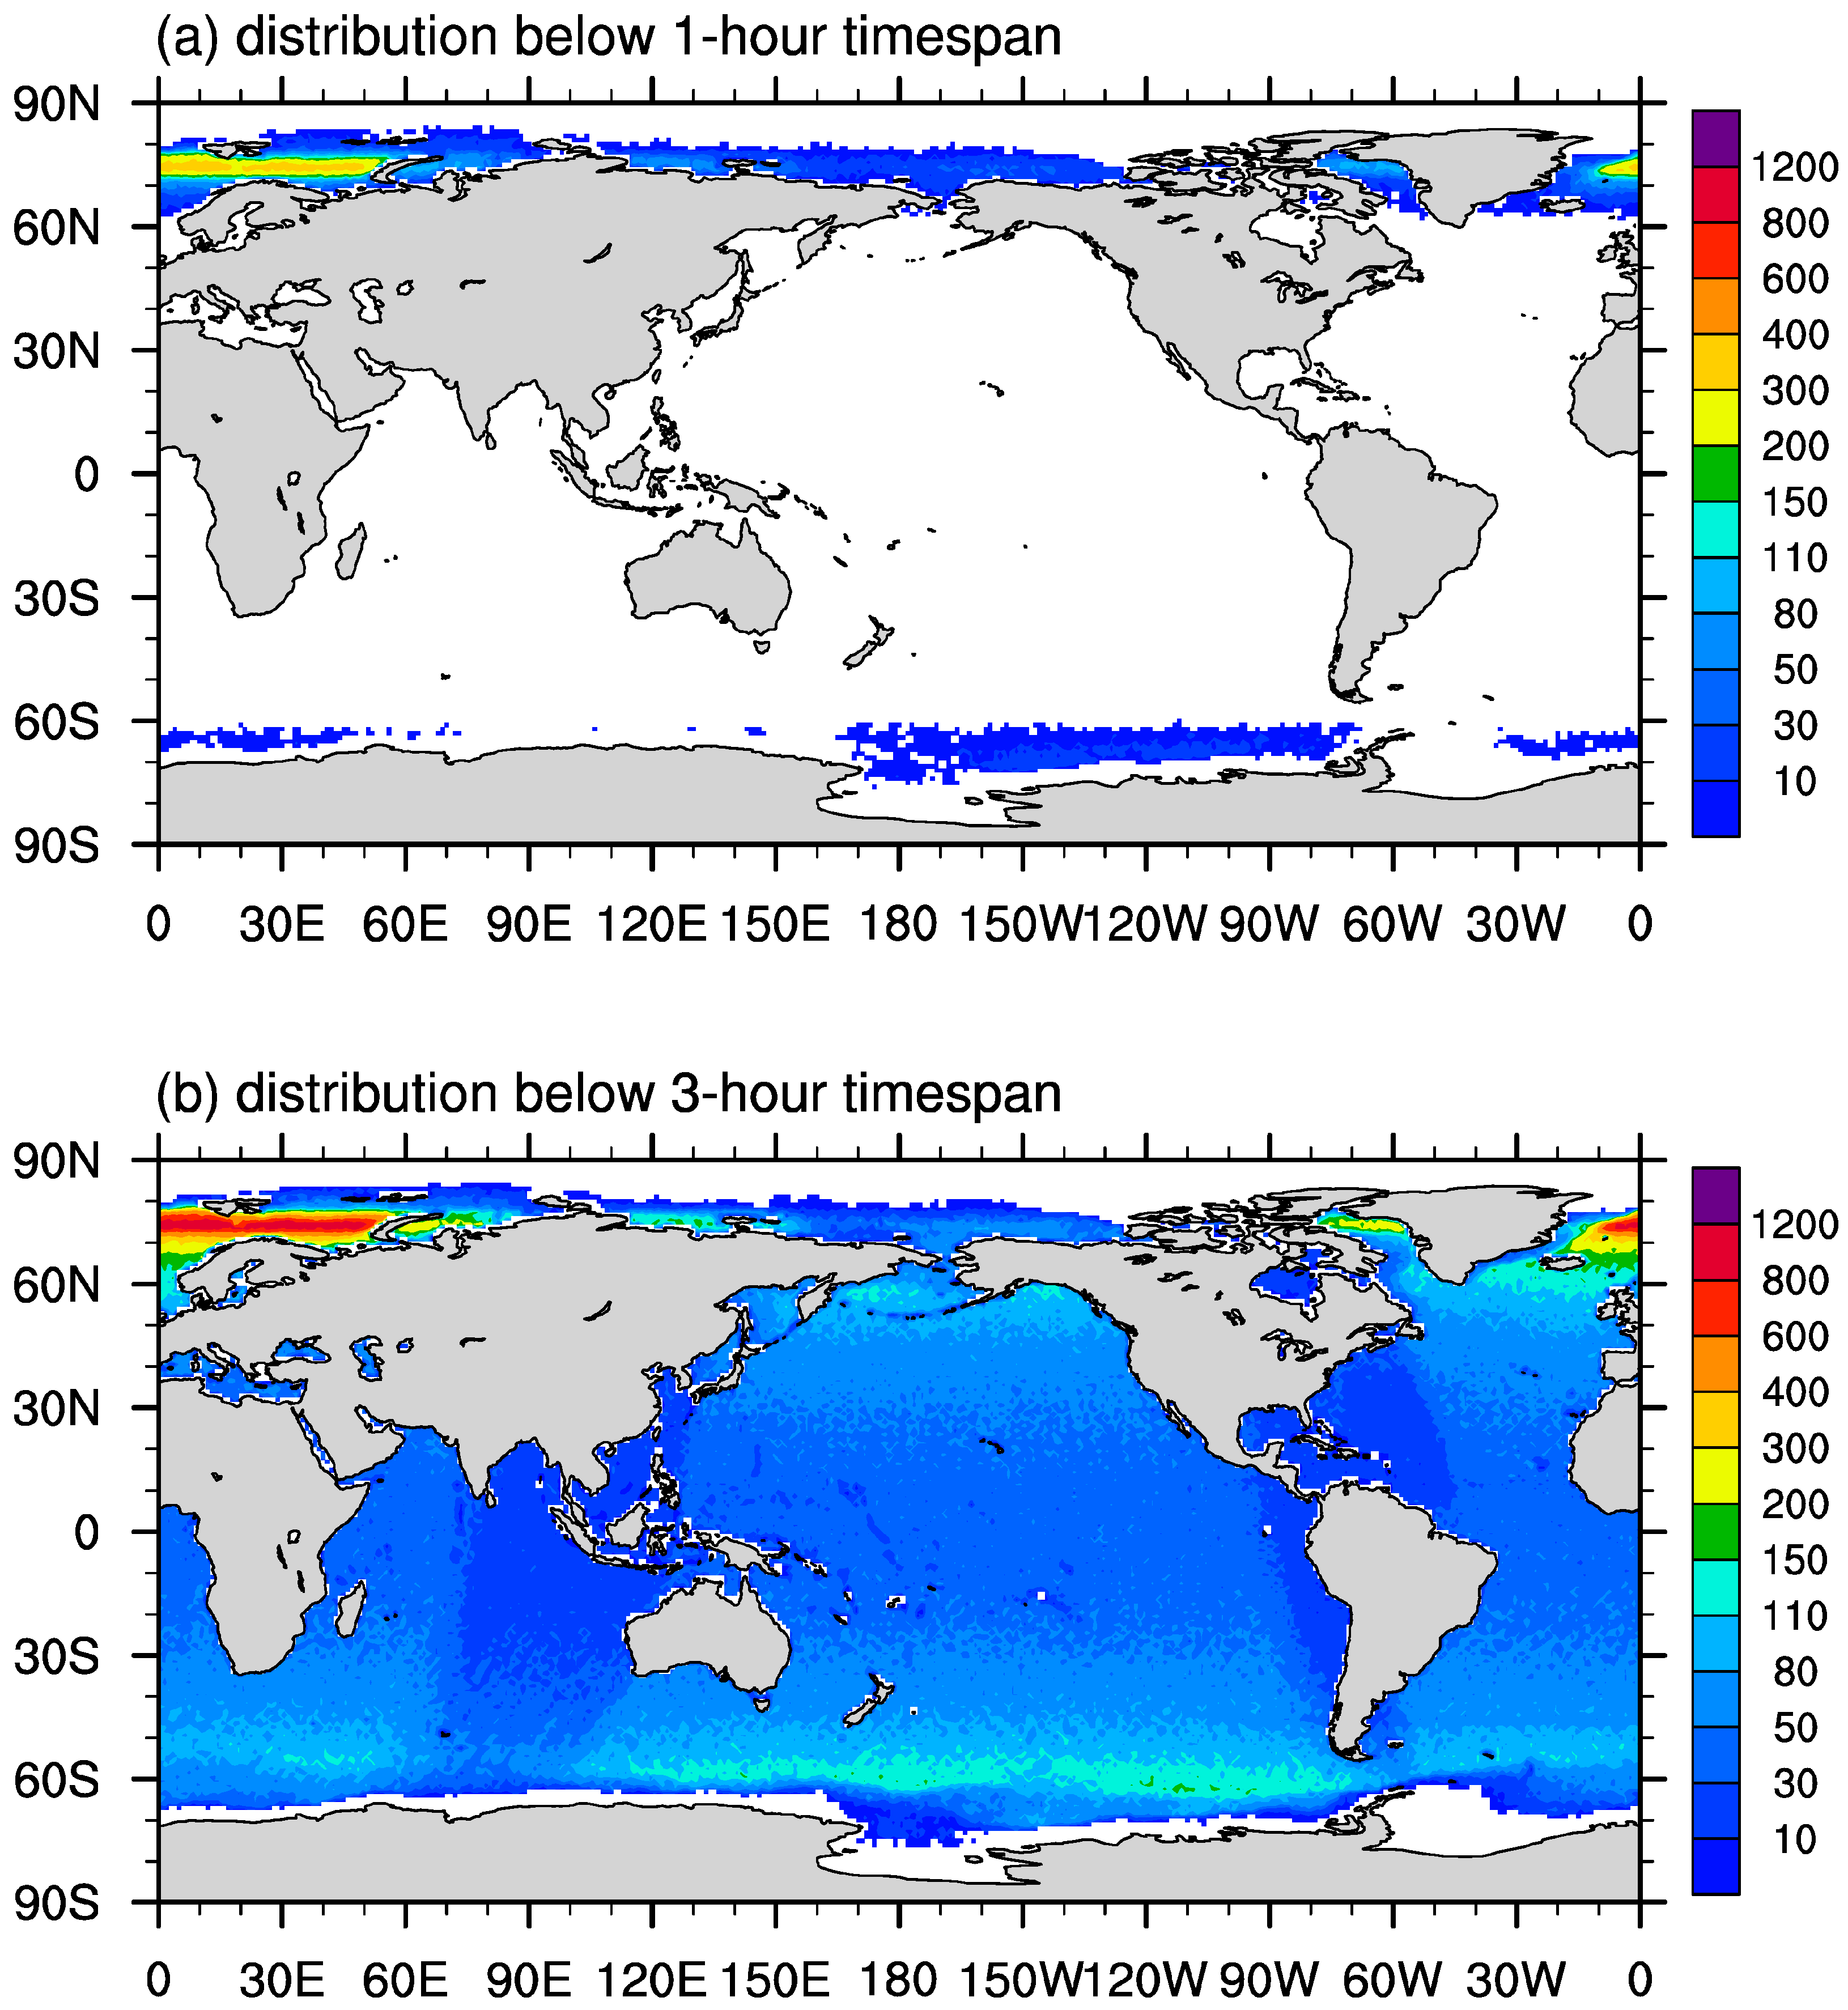
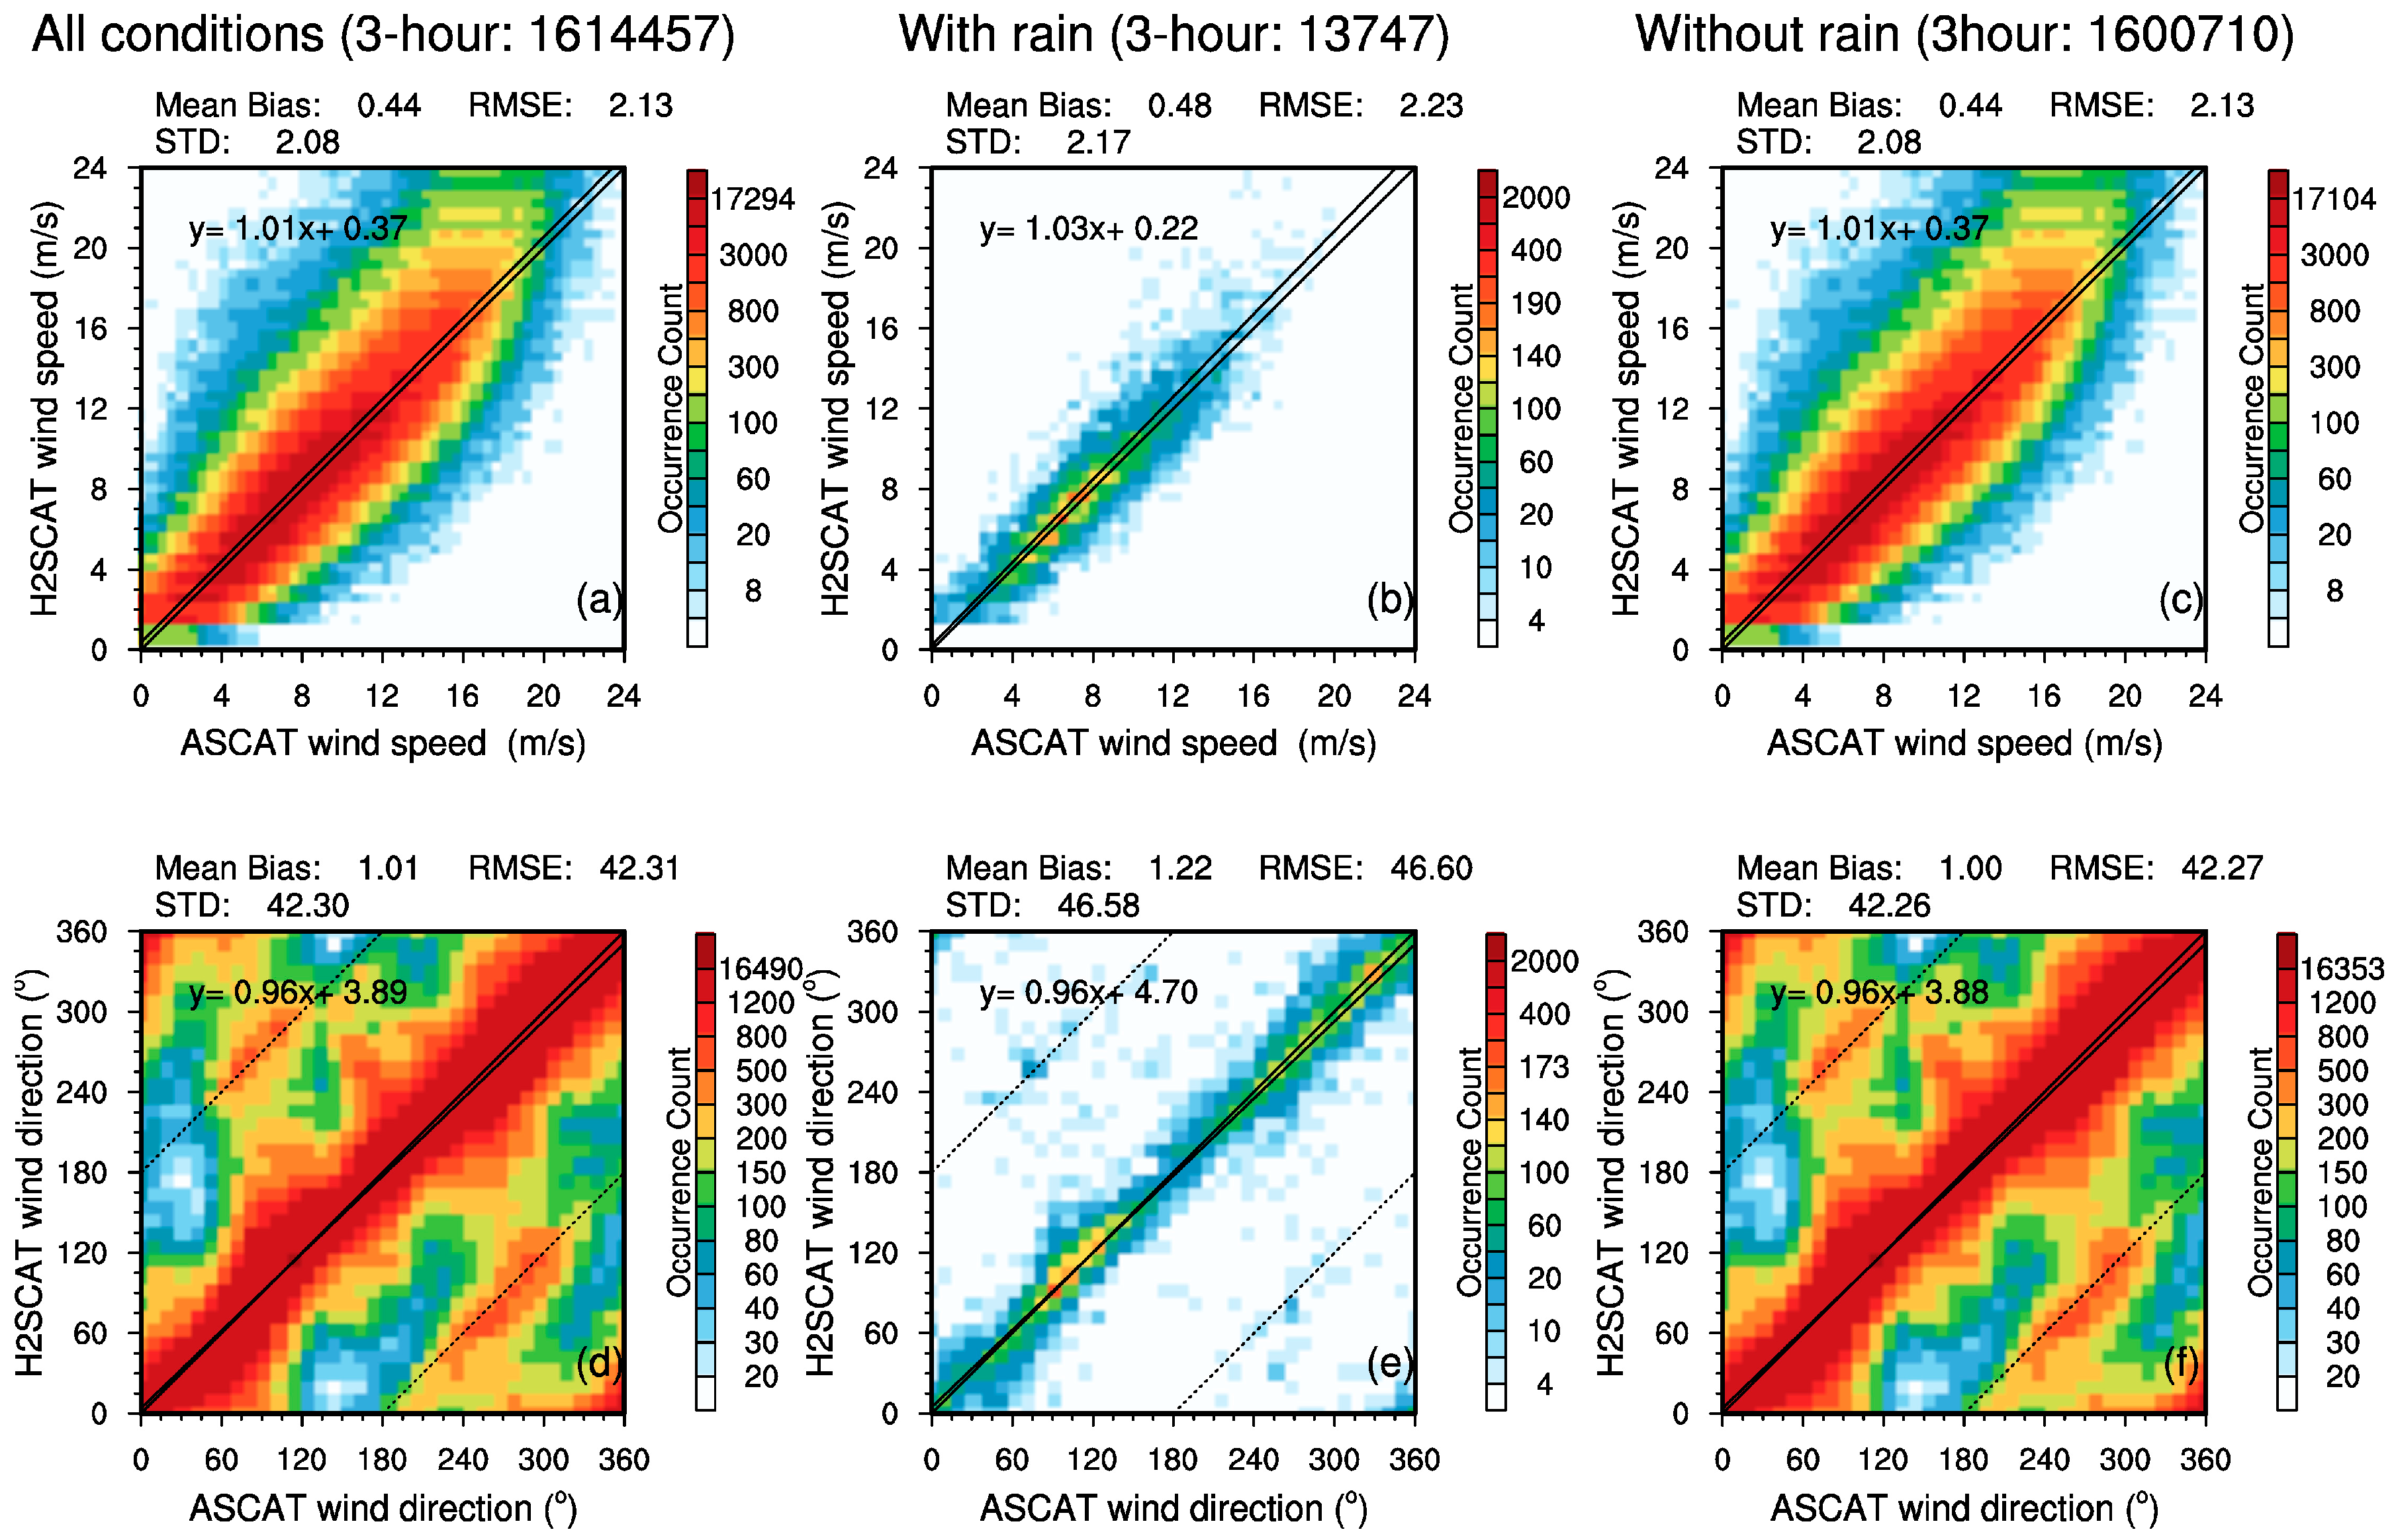
In order to check the difference between the two SCATs beyond the Polar zone, we use the 3-h collocations and discard the pairs located outside of 60°S–60°N. Figure 11 presents the 2-D histograms of wind speed and direction between ASCAT and H2SCAT within 3-h timespan. Unlike the comparison of 1-h timespan, the wind speed mean bias and RMSE increased to 0.44 and 2.13 m·s−1 under all conditions, however, the wind direction decreased to 42.31°. The degradation of wind speed was probably due to the expanded time interval, and the improved wind direction was caused by geographical position change. Under rain conditions, the mean bias and RMSE of wind speed and direction increased a little from 0.44 and 2.13 m·s−1 to 0.48 and 2.23 m·s−1 and from 1.01 and 42.31° to 1.22° and 46.6° respectively. The performance under rain-free are similar with all conditions, because of the number of collocations without rain is far more than with rain.
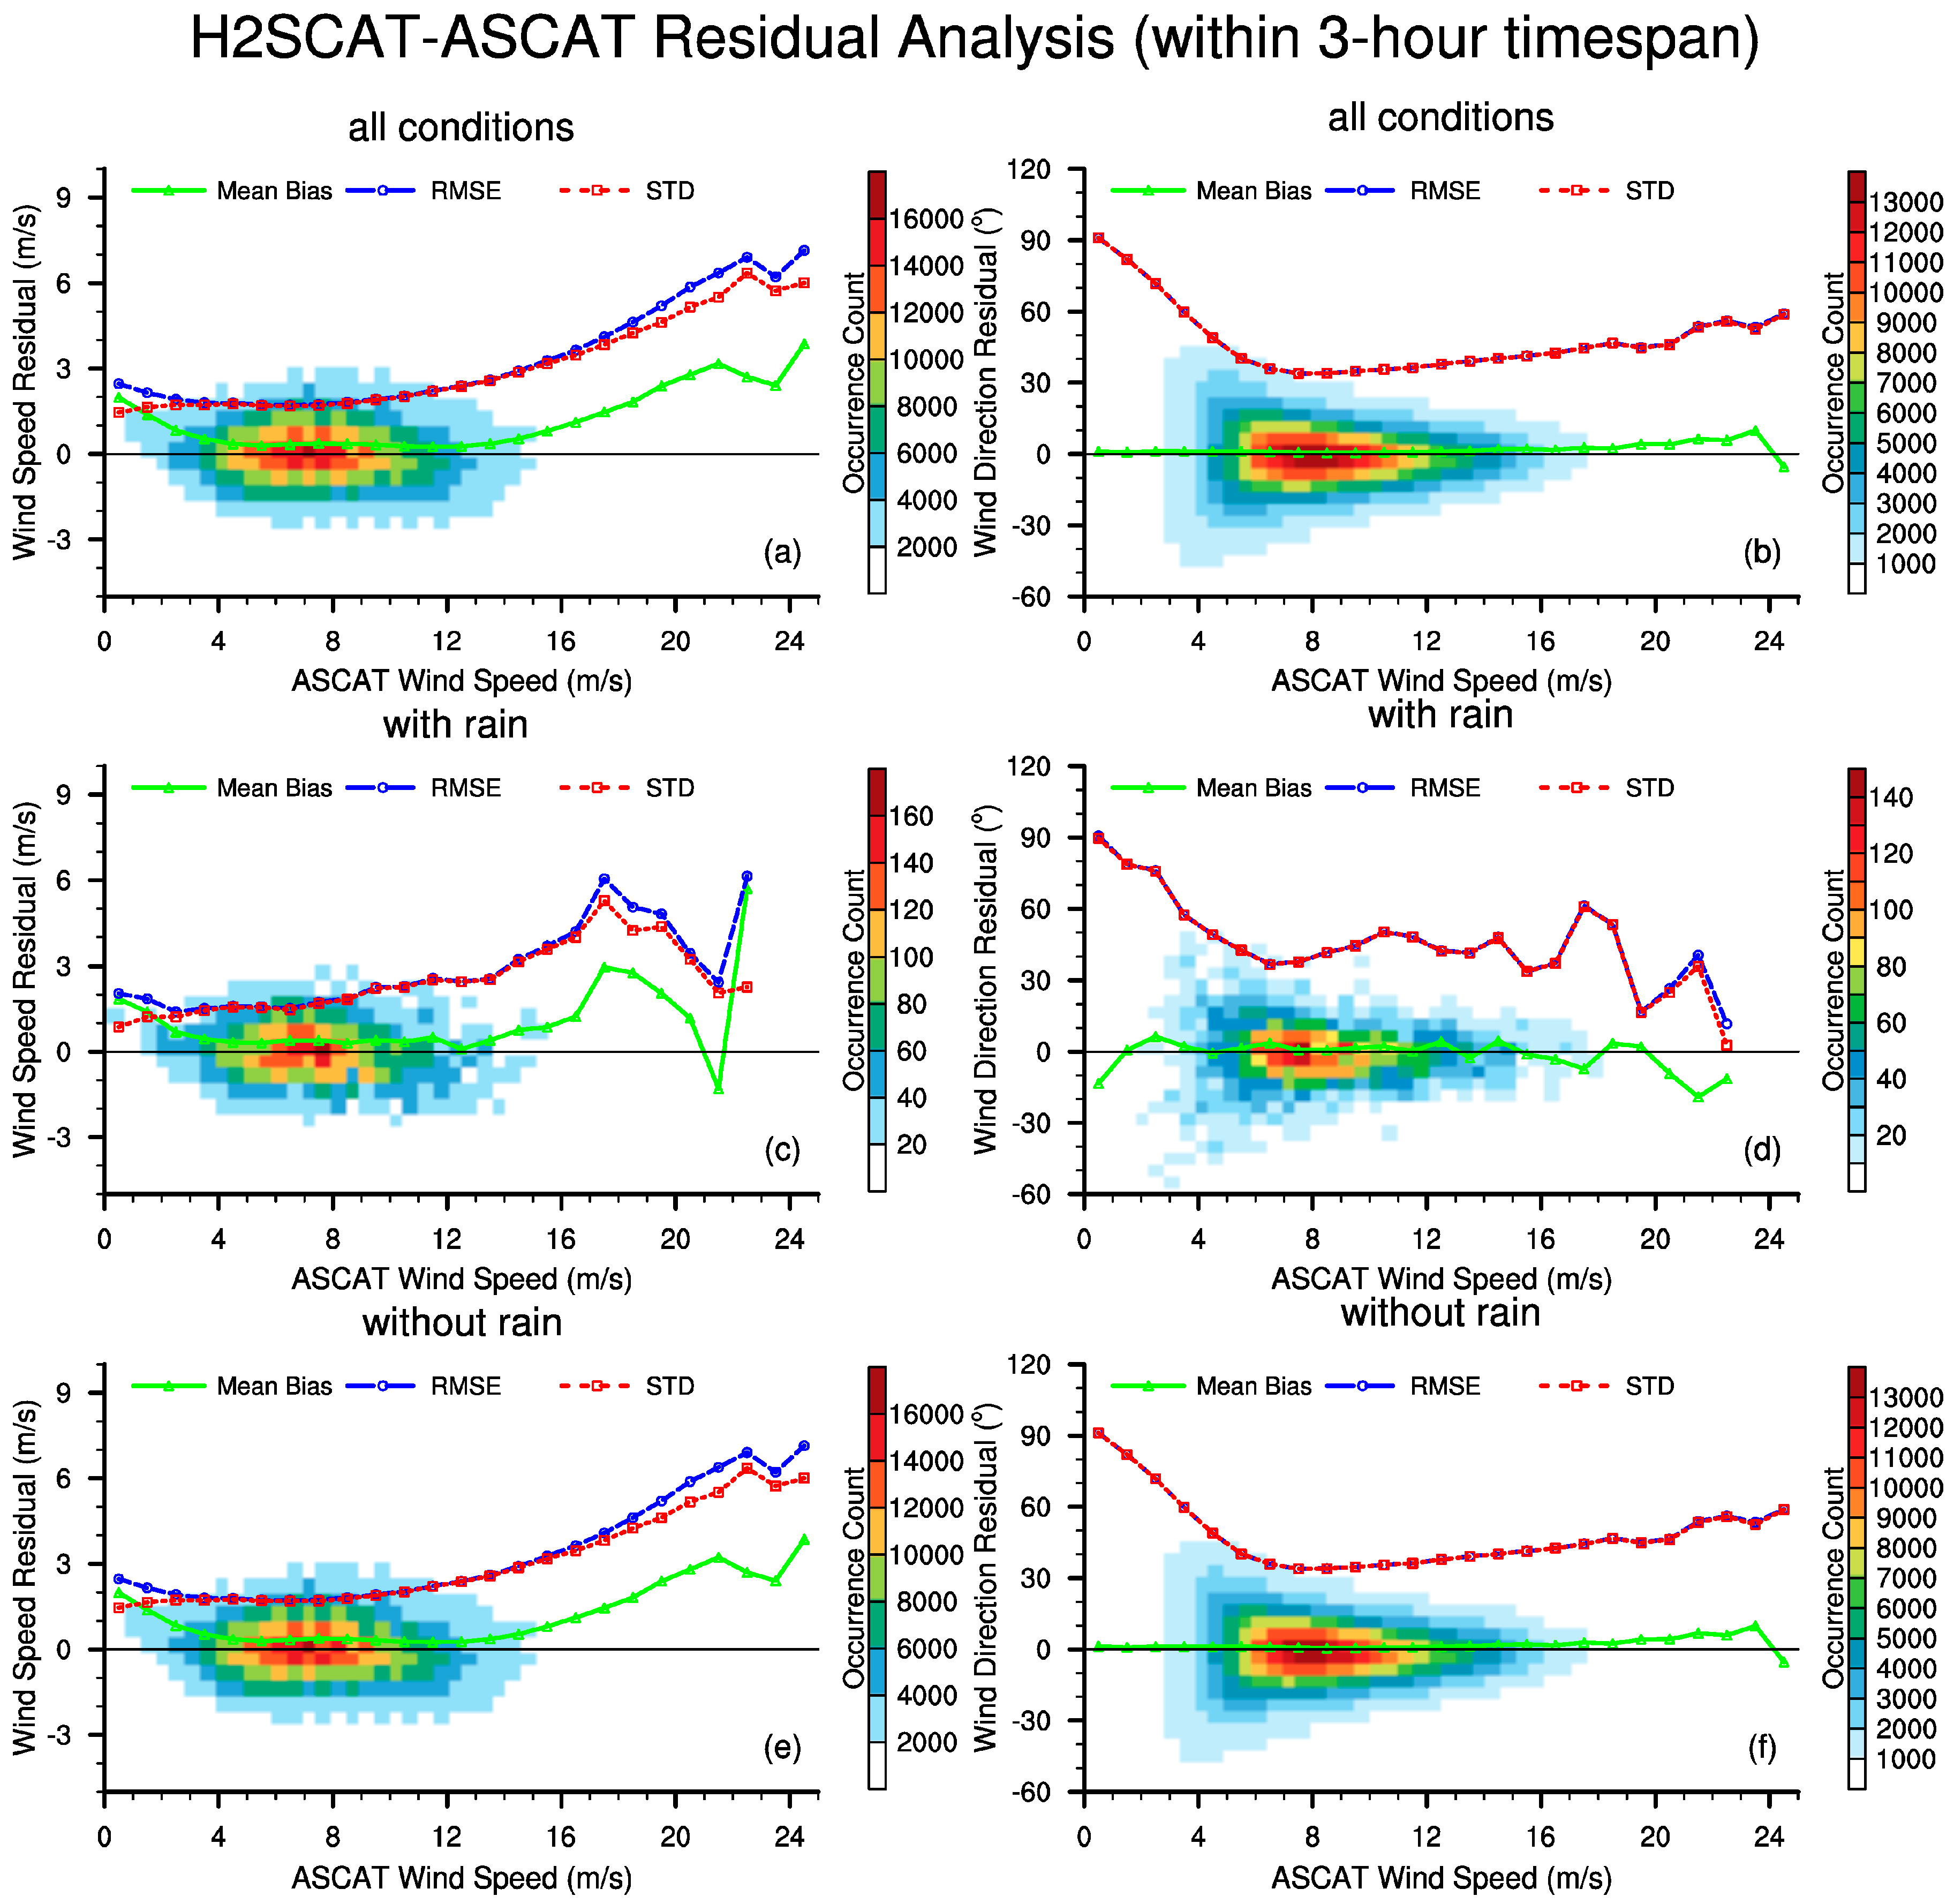
Figure 12 shows the residuals (H2SCAT-ASCAT within 3-h timespan) under the all-weather, rain and rain-free conditions. Table 5 summarizes the statistical parameters of wind speed and direction between H2SCAT and ASCAT within 3-h timespan under the all-weather, rain and no-rain conditions. Most of the collocated pairs (>77%) were in the moderate speed range (4–13 m·s−1), where the wind speed biases and RMSEs were about 0.3 and 1.9 m·s−1, and the wind direction biases and RMSEs were about 0.8° and 37°. At low speeds, the mean biases and RMSEs increased slightly to 0.9 and 2.0 m·s−1 for wind speed; but for wind direction, the RMSEs were up to 90°. In the high wind speed range, the wind direction STDs were about 40°–50°, while the wind speed STDs were higher as 3.0–7.0 m·s−1.
Under rainy conditions, the wind speed mean biases, STDs and RMSEs had not significantly changed in the moderate and low speed range (0–13 m·s−1), but resulted in some instable features at high wind speeds. For wind direction, the rain brought some irregular fluctuations for bias, especially at low and high speeds. Because of the considerable numbers of rain-free collocated pairs compared to rain conditions, the results of rain-free conditions were highly similar with all conditions.

3.5. Residual PDF Analysis of Different Data

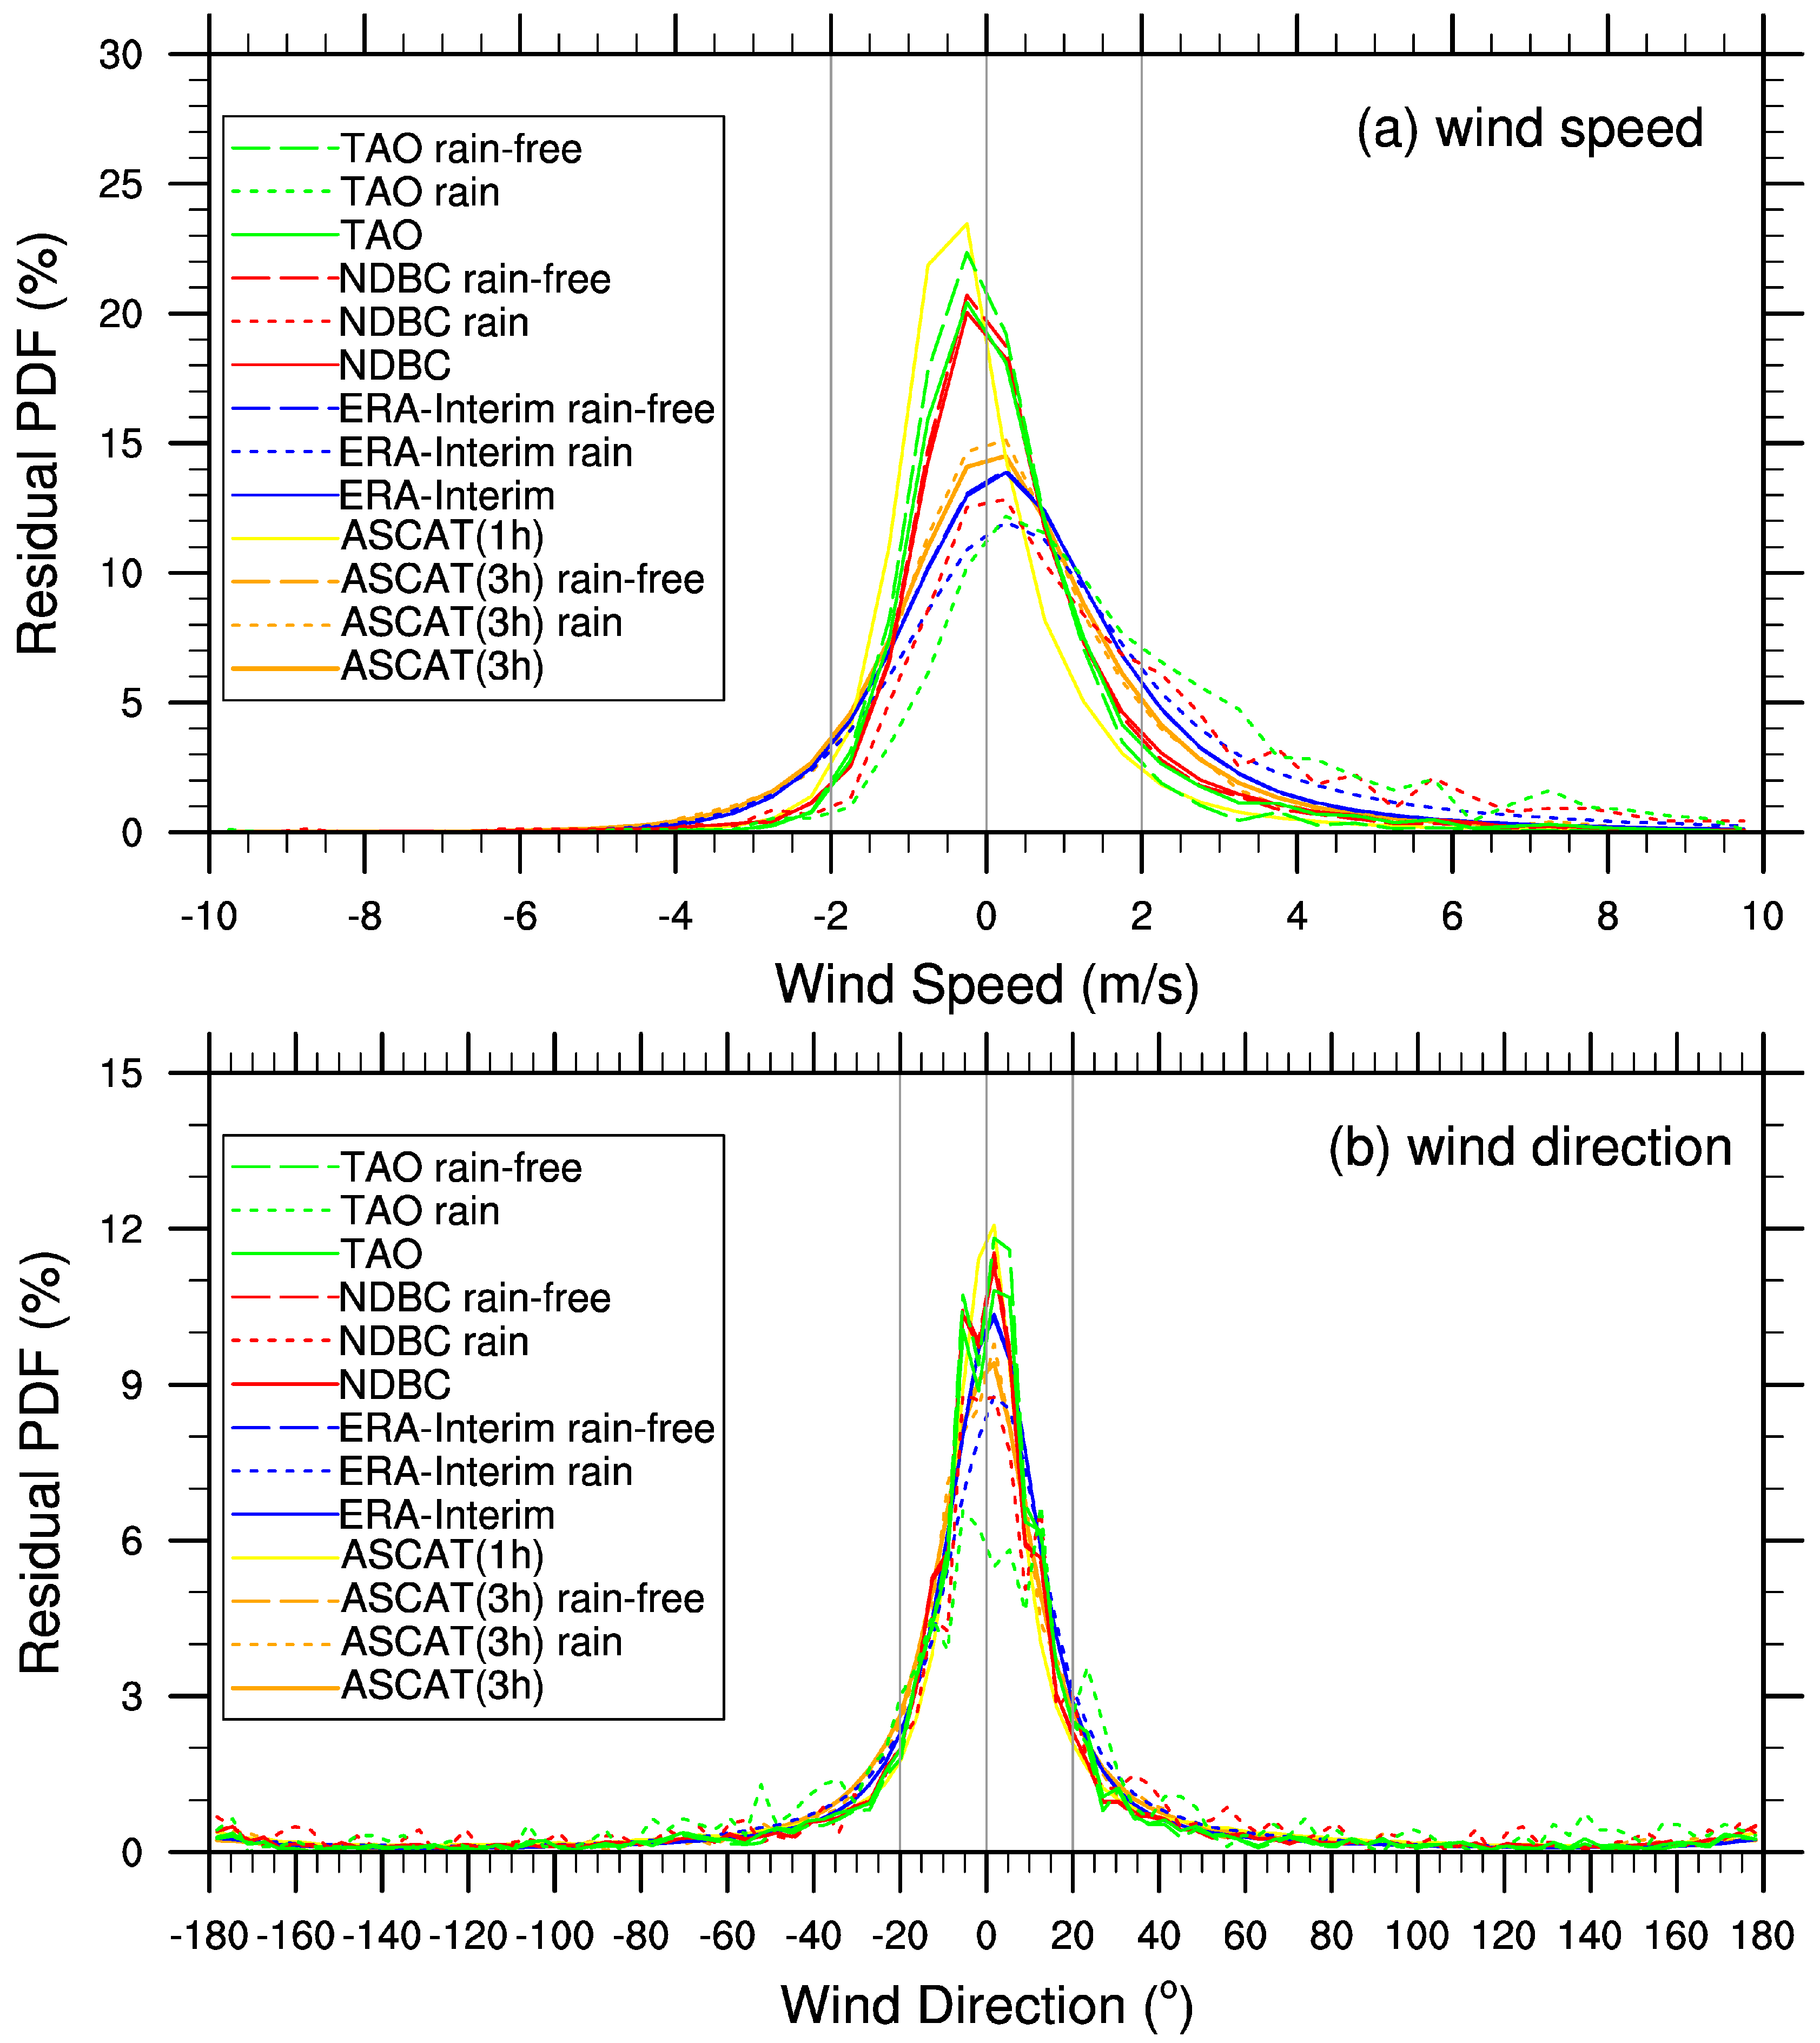
To investigate the distribution of the bias between the H2SCAT wind vectors and other observations, we plot the residual probability distribution functions (PDFs) of wind speeds and directions in Figure 13. The vertical lines at 2 m·s−1 and 20° highlight the designed precisions of the wind speed and direction in H2SCAT, respectively [2]. Table 6 summarizes the proportion of the wind speed and direction residuals within the designed precision. The wind speed residual distribution is approximately normal. ASCAT (1-h) shows the best performance, with a sharp peak reaching 23% near the zero line (0 m·s−1) and 91% of the distribution within the ±2.0 m·s−1 range. The PDF of the NDBC is approximately 20% near zero line at no-rain condition, reducing sharply to below 12% at rainy conditions. Meanwhile, the residual proportion between ±2.0 m·s−1 was degraded from 93.3% to 63.6%. The tightest distribution was exhibited by TAO, with 93.3% of the distribution in the ±2.0 m·s−1 range under rain-free conditions. Precipitation degraded the wind speed PDF of TAO to only 61.9% in the valid range.
Precipitation exerted similar effects on the wind direction. Under rain condition, only 55.1%, 61.4%, and 65.8% of TAO, NCBC, and ERA-Interim distributions are located in the ±20° range. In total, 69%–73% of the collocated data pairs in different comparisons are located within the designed precision range of wind direction.

4. Discussion

The retrieved wind vectors from H2SCAT were fully evaluated on various original datasets during the designed lifetime of the satellite (2012–2014). Table 7 lists the RMSEs of the wind speed and direction at seven levels (here, 2–24 m·s1 is the designed valid range of the wind speed [2]). The corresponding Beaufort wind scales are also shown.
The retrieved wind data are most favorably compared with the NDBC and TAO buoy observations. From 19 July 1999 to 31 December 2000, the RMSEs of QuikSCAT wind speeds and directions (relative to ocean buoys over the Pacific and Atlantic Oceans) were 1.01 m·s−1 and 23°, respectively [13]. In that evaluation, all of the flagged data (rain flagged, low wind speed flagged, and high wind speeds flagged) were excluded. In another near-shore study, the performance of QuikSCAT was even worse when data flagged for rain and light wind speeds (<3 m·s1) were excluded (the RMSEs of wind speed and direction were 1.4 m·s−1 and 37°, respectively) [14]. During 1 November–21 November 2009, the RMSEs of the wind speeds from QuikSCAT and OSCAT were 1.69 and 1.76 m·s−1, respectively (relative to buoy data), while the respective wind direction counterparts were 34.67° and 24.69° [24]. In comparisons of the QuikSCAT wind data with buoys observations from the Indian Ocean, the RMSEs of the wind speed and direction were 1.57 m·s−1 and 44.1°, respectively [16]. In the Black Sea, the RMSEs of the wind direction relative to buoy observations varies from 31.8° to 56.6°, depending on month [20]. In the Ligurian Sea, the RMSEs of wind speed and direction were 1.97 m·s−1 and 79.5°, respectively, under rain-free condition [54]. These studies indicate that the accuracy of the QuikSCAT wind vectors depends on different factors, such as periods, oceans and weather situations.
When compared with buoy data from the Pacific Ocean under no-rain conditions, the H2SCAT wind speed data performed similarly to QuikSCAT, but differed in the wind direction performance. The RMSE of wind speed and direction were 1.2–1.8 m·s−1 and 40°–45.7°, respectively. These results are consistent with the previous study, in which the RMSE of wind speed and direction from a four-month H2SCAT dataset were reported as 2.02 m·s−1 and 40.28°, respectively [34].
Although ocean buoy observations are widely applied in evaluations of scatterometers, and in quality adjustments and improvements of satellites, for the limitation of buoys, which are restricted to the Tropics and the coast of North America, the scatterometer data must be evaluated over the global scale using reanalysis data. In a comparison study of ECMWF and NCEP analysis data with QuikSCAT (2000 and 2002) and NSCAT (1997), QuikSCAT was found to outperform NSCAT [17]. The RMSE was 1.5–2 m·s−1 at low latitudes, increasing to more than 3 m·s−1 in mid and high latitudes. The RMSE of H2SCAT wind speed in the present study (relative to ERA-Interim) was 2.25 m·s−1 across the globe, slightly higher than in QuikSCAT. In the statistics comparisons, the improved performance of H2SCAT with TAO than with NDBC might be attributable to geographical differences. The TAO buoys are close to the equator but the NDBC buoys are at higher latitudes and mostly in the Northern Hemisphere. The RMSE of the wind direction (~40°) is consistent with Yang [34], who also adopted ERA-Interim data for comparison.
The quality of a new sensor may also be evaluated in scatterometer comparison. Collocated with ASCAT wind vectors, the H2SCAT data were located either below 50° S or above 50° N within 1-h timespan, where the RMSEs of the wind speeds and directions are 1.62 m·s−1 and 47.47°, respectively. The RMSEs were changed to 2.13 m·s1 and 42.31° when the time span was expanded to 3 h. Likewise, within a half-hour timespan in the polar zone (<55°S and >50°N), the proportion of collocated data between OSCAT and ASCAT is only 1.15%, and the RMSEs of the wind speed and direction were 1.47 m·s−1 and 26°, respectively [24]. On the other hand, collocations of QuikSCAT and ASCAT are found in the polar zone within 1-h timespan, and the STD between two scatterometers was approximately 1.5–2 m·s−1 [22].
H2SCAT always overestimates at low and high wind speeds, regardless of counterpart data used in the comparison. Previous studies similarly reported that QuikSCAT or other Ku-band scatterometers overestimate at low and high wind speeds [13,15,16,54]. The Ku-band is more sensitive to wind variation at low winds than C-band, because short ocean surface waves have stronger influence on backscatter at high frequencies at low wind speeds [1]. The overestimation of H2SCAT implied a defect of the GMF in HY-2A wind inversion. At high wind speed, the retrieval model functions are limited by the relationship between the wind speed and the backscattered power [55]. For wind direction, the joint histograms (see Figure 3, Figure 5, Figure 7, Figure 9 and Figure 11) show that there are some clusters around 180° off, which is due to an imperfect ambiguity selection process. Regarding the wind direction at low wind speeds, H2SCAT (similar to QuikSCAT) showed a decentralized distribution in the residual analysis, which is attributed to the incompleteness of the ambiguity removal algorithm using the median filter technique [34], together with errors in the geophysical model at low wind speeds [13]. Many factors including rain, increased local wind variability, confused sea state (waves), and land/ice contamination might induce poor quality of wind retrievals [44]. The H2SCAT showed its strongest performance at moderate speeds, especially in range 4–10.8 m·s−1 range (see Table 6).
Scatterometer wind retrievals tend to be contaminated by rain effects [1,35,38]. In this study, we evaluated the effects of rain on H2SCAT by employing CMORPH data and found overestimates of the H2SCAT wind speed under rainy conditions. The positive bias caused by rain is much higher at low wind speeds (~2–5 m·s−1) than at moderate and high wind speeds. Stiles and Yueh analyzed one year of QuikSCAT and SSM/I data and found that even light rain produces a higher backscatter than low-speed wind [37]. They also reported that at high wind speeds, rain does not significantly corrupt the measurement of wind-induced surface backscatter. Portabella and Stoffelen also reported higher rain sensitivity at low winds than at moderate and high winds [36]. In summary, the impact of rain on the wind speed retrievals decreases with increasing wind speed.
Information on wind direction is considered to be available in much of the rain-contaminated data [37]. Weissman [8] proposed that the azimuth variation in the wind-induced backscatter can still be detected and is useful for estimating the wind direction (provided that the rain attenuation is only moderately large). According to the residual analyses of different collocated data in the present study, the STDs and RMSEs of the wind direction in H2SCAT are slightly higher under rain conditions than under rain-free conditions, especially at low and moderate wind speeds.
Although several studies noted the rain effects on scatterometer wind data, and attempts to reduce these effects are numerous [8], the nonlinear relationship between the rain effects (attenuation and roughening) and wind retrieval model functions are difficult to elucidate. The effects of different rain rates on the wind retrieval ability of H2SCAT must be investigated in further study.

5. Conclusions

This study comprehensively verified the three-year (2012–2014) NRT Level-2 retrieval wind vectors from the scatterometer onboard the HY-2A satellite, the first Chinese operational ocean environmental dynamic satellite. Winds from four data sources (TAO and NDBC buoys, ERA-Interim reanalysis, and ASCAT) were employed in comparison studies. To investigate the influence of rain on the wind retrieval accuracy, we also collected rain data from the Climate Prediction Center morphing method (CMORPH) [45]. Data pairs between the HY-2A scatterometer wind retrievals and the comparison observations were collocated and evaluated by statistical variables (the mean bias, root mean square error, and standard deviation). The residual analyses of the wind speeds and directions in the different data comparisons were also presented, and the rain effects on the retrieval wind vectors were discussed. Finally, the residual probability distribution functions (PDFs) of the wind speeds and directions were computed for all comparisons.
Overall, the quality of the wind vectors of the HY-2A scatterometer (especially the wind speeds) favorably compared with those of other Ku-band scatterometers such as QuikSCAT. The RMSEs of the wind speeds and directions varied from 1.62 m·s−1 to 2.25 m·s−1 and from 39.23° to 47.47°, respectively, depending on the comparison. Low and high wind speeds were always overestimated; however, the vast majority of wind is at moderate speeds. At low wind speeds, the STD increased more rapidly in the wind direction than in the wind speed. On the contrary, at high wind speeds, the STD reduced more rapidly in the wind speed than in the wind direction. At moderate wind speeds (4.0–10.8 m·s−1), there were almost no biases in wind speed and direction. The RMSE reduced to 1.10–1.90 m·s−1 (in wind speed) and 32.32°–40.79° (in wind direction), depending on the comparison.
Rain exerted significant and robust effects on the wind retrievals from the HY-2A scatterometer. Positive biases in the wind speed, especially at low wind speeds, are attributed to attenuation of backscatter in the air and the increased surface roughness of the sea under falling raindrops. As the wind speed increased, rain exerted a weaker impact on the wind speed retrievals. The effects of rain on wind direction were always relatively weak, but were mainly observed at low and moderate wind speeds. In comparisons with the TAO-buoys data, the RMSE of the wind speed and direction reduced to 1.20 m·s−1 and 39.68°, respectively, under rain-free conditions.
In general, the accuracy of wind speed from the HY-2A scatterometer meets the designed quality (2 m·s−1 in the range of 2–24 m·s−1). In the ASCAT comparison, more than 91.1% of the residual wind speed data were located in the ±2.0 m·s−1 range. Moreover, more than 79% data pairs satisfied the designed precision of wind direction (±20°). We conclude that the NRT Level-2 retrieval wind data acquired from the HY-2A scatterometer in 2012–2014 are valuable for practical use, especially after controlling for the rain effect.

Acknowledgments

This study is sponsored by National Natural Science Foundation of China (2015CB953701 and Y5J0280057), the CAS/SAFEA international partnership program for creative research teams (KZZD-EW-TZ-09), and the National High Technology Research and Development Program of China (2013AA09A506-5). The authors wish to acknowledge the Chinese National Satellite Ocean Application Service (NSOAS) for the HY-2A wind products. The authors appreciate Minsen Lin and Qingtao Song in NSOAS for their useful suggestions, and would also like to thank the anonymous reviewers for their constructive comments.

Author Contributions

J.X. carried out the evaluations, analysis and wring in this paper; J.S. designed the schemes and led the main work in this study; Y.L. collected and analyzed the data and offered lots of valuable comments and considerations; and X.H. and Z.L. proposed several opinions and provided constructive suggestions and discussions.

Conflicts of Interest

The authors declare no conflict of interest.

References

  1. Liu, W.T. Progress in Scatterometer Application. J. Oceanogr. 2002, 58, 121–136. [Google Scholar] [CrossRef]
  2. Jiang, X.; Lin, M.; Liu, J.; Zhang, Y.; Xie, X.; Peng, H.; Zhou, W.; Xie, X.; Peng, H.; Zhou, W. The HY-2 satellite and its preliminary assessment. Int. J. Digit. Earth 2012, 5, 266–281. [Google Scholar] [CrossRef]
  3. Jiang, X.; Lin, M. The study on oceanic vector wind field retrieve technique of the HY-2 satellite. Eng. Sci. 2009, 11, 86–95. [Google Scholar]
  4. Bao, L.; Gao, P.; Peng, H.; Jia, Y.; Shum, C.K.; Lin, M.; Guo, Q. First accuracy assessment of the HY-2A altimeter sea surface height observations: Cross-calibration results. Adv. Space Res. 2015, 55, 90–105. [Google Scholar] [CrossRef]
  5. Lin, M.; Zou, J.; Xie, X.; Zhang, Y. HY-2A microwave scatterometer wind retrieval algorithm. Eng. Sci. 2013, 68, 68–74. [Google Scholar]
  6. Hoffman, R.N.; Leidner, S.M. An Introduction to the Near-Real-Time QuikSCAT Data. Weather Forecast. 2005, 20, 476–493. [Google Scholar] [CrossRef]
  7. Singh, R.; Kumar, P.; Pal, P.K. Assimilation of Oceansat-2-Scatterometer-Derived Surface Winds in the Weather Research and Forecasting Model. IEEE Trans. Geosci. Remote 2012, 50, 1015–1021. [Google Scholar] [CrossRef]
  8. Weissman, D.E.; Stiles, B.W.; Hristova-Veleva, S.M.; Long, D.G.; Smith, D.K.; Hilburn, K.A.; Jones, W.L. Challenges to Satellite Sensors of Ocean Winds: Addressing Precipitation Effects. J. Atmos. Ocean. Tech. 2012, 29, 356–374. [Google Scholar] [CrossRef]
  9. Figa-Saldaña, J.; Wilson, J.J.W.; Attema, E.; Gelsthorpe, R.; Drinkwater, M.R.; Stoffelen, A. The advanced scatterometer (ASCAT) on the meteorological operational (MetOp) platform: A follow on for European wind scatterometers. Can. J. Remote Sens. 2002, 28, 404–412. [Google Scholar] [CrossRef]
  10. SAF, O.S.I. ASCAT Wind Product User Manual; Version 1.13; KNMI: De Bilt, The Netherlands, 2013; p. 23. [Google Scholar]
  11. Wang, X.; Liu, L.; Shi, H.; Dong, X.; Zhu, D. In-orbit calibration and performance evaluation of HY-2 scatterometer. In Proceedings of the IEEE International Geoscience and Remote Sensing Symposium, Munich, Germany, 22–27 July 2012; pp. 4614–4616.
  12. Lungu, T.; Callahan, P.S. QuikSCAT Science Data Product User’s Manual: Overview & Geophysical Data Products.D-18053-Rev A, Ver.3.0; Jet Propulsion Lab: Pansadena, CA, USA, 2006.
  13. Ebuchi, N.; Graber, H.C.; Caruso, M.J. Evaluation of Wind Vectors Observed by QuikSCAT/SeaWinds Using Ocean Buoy Data. J. Atmos. Ocean. Tech. 2002, 19, 2049–2062. [Google Scholar] [CrossRef]
  14. Pickett, M.H.; Tang, W.; Rosenfeld, L.K.; Wash, C.H. QuikSCAT Satellite Comparisons with Nearshore Buoy Wind Data off the U.S. West Coast. J. Atmos. Ocean. Tech. 2003, 20, 1869–1879. [Google Scholar] [CrossRef]
  15. Tang, W.; Liu, W.T.; Stiles, B.W. Evaluation of High-Resolution Ocean Surface Vector Winds Measured by QuikSCAT Scatterometer in Coastal Regions. IEEE Trans. Geosci. Remote 2004, 42, 1762–1769. [Google Scholar] [CrossRef]
  16. Satheesan, K.; Sarkar, A.; Parekh, A.; Kumar, M.R.R.; Kuroda, Y. Comparison of wind data from QuikSCAT and buoys in the Indian Ocean. Int. J. Remote Sens. 2007, 28, 2375–2382. [Google Scholar] [CrossRef]
  17. Chelton, D.B.; Freilich, M.H. Scatterometer-Based Assessment of 10-m Wind Analyses from the Operational ECMWF and NCEP Numerical Weather Prediction Models. Mon. Weather Rev. 2005, 133, 409–429. [Google Scholar] [CrossRef]
  18. Accadia, C.; Zecchetto, S.; Lavagnini, A.; Speranza, A. Comparison of 10-m Wind Forecasts from a Regional Area Model and QuikSCAT Scatterometer Wind Observations over the Mediterranean Sea. Mon. Weather Rev. 2007, 135, 1945–1960. [Google Scholar] [CrossRef]
  19. Sousa, M.C.; Alvarez, I.; Vaz, N.; Gomez-Gesteira, M.; Dias, J.M. Assessment of Wind Pattern Accuracy from the QuikSCAT Satellite and the WRF Model along the Galician Coast (Northwest Iberian Peninsula). Mon. Weather Rev. 2013, 141, 742–753. [Google Scholar] [CrossRef]
  20. Slabakova, V.; Andreeva, N.; Eftimova, P.; Nedkov, R. Evaluation of QuikSCAT wind vector performance with respect to field measurements for the Bulgarian part of the Black Sea. In Proceedings of the 4th International Conference on Recent Advances in Space Technologies, Istanbul, Turkey, 11–13 July 2009; pp. 323–327.
  21. Mathew, T.; Chakraborty, A.; Sarkar, A.; Kumar, R. Comparison of oceanic winds measured by space-borne scatterometers and altimeters. Remote Sens. Lett. 2012, 3, 715–720. [Google Scholar] [CrossRef]
  22. Bentamy, A.; Grodsky, S.A.; Carton, J.A.; Croizé-Fillon, D.; Chapron, B. Matching ASCAT and QuikSCAT winds. J. Geophys. Res. 2012, 117, 15. [Google Scholar] [CrossRef]
  23. Chakraborty, A.; Kumar, R.; Stoffelen, A. Validation of ocean surface winds from the OCEANSAT-2 scatterometer using triple collocation. Remote Sens. Lett. 2013, 4, 84–93. [Google Scholar] [CrossRef]
  24. Kumar, R.; Chakraborty, A.; Parekh, A.; Sikhakolli, R.; Gohil, B.S.; Kiran Kumar, A.S. Evaluation of Oceansat-2-Derived Ocean Surface Winds Using Observations From Global Buoys and Other Scatterometers. IEEE Trans. Geosci. Remote 2013, 51, 2571–2576. [Google Scholar] [CrossRef]
  25. Misra, T.; Chakraborty, P.; Misra, A.; Rao, J.; Dave, D.B.; Rao, C.V.N.; Desai, N.M.; Arora, R. Oceansat-II Scatterometer: Sensor Performance Evaluation, Analyses, and Estimation of Biases. IEEE Trams. Geosci. Remote 2014, 52, 3310–3315. [Google Scholar] [CrossRef]
  26. Anderson, C.; Figa, J.; Bonekamp, H.; Wilson, J.J.W.; Verspeek, J.; Stoffelen, A.; Portabella, M. Validation of Backscatter Measurements from the Advanced Scatterometer on MetOp-A. J. Atmos. Ocean. Tech. 2012, 29, 77–88. [Google Scholar] [CrossRef] [Green Version]
  27. Bi, L.; Jung, J.A.; Morgan, M.C.; le Marshall, J.F. Assessment of Assimilating ASCAT Surface Wind Retrievals in the NCEP Global Data Assimilation System. Mon. Weather Rev. 2011, 139, 3405–3421. [Google Scholar] [CrossRef]
  28. Ebuchi, N. Self-Consistency of Marine Surface Wind Vectors Observed by ASCAT. IEEE Trans. Geosci. Remote 2012, 50, 2473–2480. [Google Scholar] [CrossRef]
  29. Hersbach, H. Comparison of C-Band Scatterometer CMOD5.N Equivalent Neutral Winds with ECMWF. J. Atmos. Ocean. Tech. 2010, 27, 721–736. [Google Scholar] [CrossRef]
  30. Sivareddy, S.; Ravichandran, M.; Girishkumar, M.S. Evaluation of ASCAT-Based Daily Gridded Winds in the Tropical Indian Ocean. J. Atmos. Ocean. Tech. 2013, 30, 1371–1381. [Google Scholar] [CrossRef]
  31. Verhoef, A.; Stoffelen, A. Validation of ASCAT 12.5-km Winds, Version 1.3; De Bilt, The Netherlands, 2013; p. 11. [Google Scholar]
  32. Bentamy, A.; Croize-Fillon, D.; Perigaud, C. Characterization of ASCAT measurements based on buoy and QuikSCAT wind vector observations. Ocean. Sci. 2008, 4, 265–274. [Google Scholar] [CrossRef]
  33. Wang, H.; Zhu, J.; Lin, M.; Huang, X.; Zhao, Y.; Chen, C.; Zhang, Y.; Peng, H. First six months quality assessment of HY-2A SCAT wind products using in situ measurements. Acta Oceanol. Sin. 2013, 32, 27–33. [Google Scholar] [CrossRef]
  34. Yang, X.; Liu, G.; Li, Z.; Yu, Y. Preliminary validation of ocean surface vector winds estimated from China’s HY-2A scatterometer. Int. J. Remote Sens. 2014, 35, 4532–4543. [Google Scholar] [CrossRef]
  35. Bliven, L.F.; Branger, H.; Sobieski, P.; Giovanangeli, J. An analysis of scatterometer returns from a water surface agitated by artificial rain: evidence that ring-waves are the main feature. Int. J. Remote Sens. 1993, 14, 2315–2329. [Google Scholar] [CrossRef]
  36. Portabella, M.; Stoffelen, A. Rain Detection and Quality Control of SeaWinds. J. Atmos. Ocean. Technol. 2001, 18, 1171–1183. [Google Scholar] [CrossRef]
  37. Stiles, B.W.; Yueh, S.H. Impact of rain on spaceborne Ku-band wind scatterometer data. IEEE Trans. Geosci. Remote 2002, 40, 1973–1983. [Google Scholar] [CrossRef]
  38. Weissman, D.E.; Bourassa, M.A.; Tongue, J. Effects of Rain Rate and Wind Magnitude on SeaWinds Scatterometer Wind Speed Errors. J. Atmos. Ocean. Technol. 2002, 19, 738–746. [Google Scholar] [CrossRef]
  39. Hilburn, K.A.; Wentz, F.J.; Smith, D.K.; Ashcroft, P.D. Correcting Active Scatterometer Data for the Effects of Rain Using Passive Radiometer Data. J. Appl. Meteorol. Clim. 2006, 45, 382–398. [Google Scholar] [CrossRef]
  40. Rebora, N.; Molini, L.; Casella, E.; Comellas, A.; Fiori, E.; Pignone, F.; Siccardi, F.; Silvestro, F.; Tanelli, S.; Parodi, A. Extreme Rainfall in the Mediterranean: What Can We Learn from Observations? J. Hydrometeorol. 2013, 14, 906–922. [Google Scholar] [CrossRef]
  41. Dhanya, M.; Chandrasekar, A. Improved Rainfall Simulation by Assimilating Oceansat-2 Surface Winds Using Ensemble Kalman Filter for a Heavy Rainfall Event over South India. IEEE Trans. Geosci. Remote 2014, 52, 7721–7726. [Google Scholar] [CrossRef]
  42. Ghosh, A.; Varma, A.K.; Shah, S.; Gohil, B.S.; Pal, P.K. Rain identification and measurement using Oceansat-II scatterometer observations. Remote Sens. Environ. 2014, 142, 20–32. [Google Scholar] [CrossRef]
  43. Tournadre, J. Impact of rain cell on scatterometer data: 1. Theory and modeling. J. Geophys. Res. 2003, 108. [Google Scholar] [CrossRef]
  44. Lin, W.; Portabella, M.; Stoffelen, A.; Vogelzang, J.; Verhoef, A. ASCAT wind quality under high subcell wind variability conditions. J. Geophys. Res. Oceans 2015, 120, 5804–5819. [Google Scholar] [CrossRef]
  45. Joyce, R.J.; Janowiak, J.E.; Arkin, P.A.; Xie, P. CMORPH: A Method that Produces Global Precipitation Estimates from Passive Microwave and Infrared Data at High Spatial and Temporal Resolution. J. Hydrometeorol. 2004, 5, 487–503. [Google Scholar] [CrossRef]
  46. Zou, J.; Xie, X.; Zhang, Y.; Lin, M. Wind retrieval processing for HY-2A microwave scatterometer. In Proceedings of the 2014 IEEE International Geoscience and Remote Sensing Symposium, Quebec City, QC, Canada, 13–18 July 2014; pp. 5160–5163.
  47. Meindl, E.A.; Hamilton, G.D. Programs of the National Data Buoy Center. Bull. Amer. Meteor. Soc. 1992, 73, 985–993. [Google Scholar] [CrossRef]
  48. Liu, W.T.; Katsaros, K.B.; Businger, J.A. Bulk Parameterization of Air-Sea Exchanges of Heat and Water Vapor Including the Molecular Constraints at the Interface. J. Atmos. Sci. 1979, 36, 1722–1735. [Google Scholar] [CrossRef]
  49. Fairall, C.W.; Bradley, E.F.; Hare, J.E.; Grachev, A.A.; Edson, J.B. Bulk Parameterization of Air–Sea Fluxes: Updates and Verification for the COARE Algorithm. J. Climate 2003, 16, 571–591. [Google Scholar] [CrossRef]
  50. Dee, D.P.; Uppala, S.M.; Simmons, A.J.; Berrisford, P.; Poli, P.; Kobayashi, S.; Andrae, U.; Balmaseda, M.A.; Balsamo, G.; Bauer, P.; et al. The ERA-Interim reanalysis: Configuration and performance of the data assimilation system. Q. J. Roy. Meteor. Soc. 2011, 137, 553–597. [Google Scholar] [CrossRef]
  51. Jamandre, C.A.; Narisma, G.T. Spatio-temporal validation of satellite-based rainfall estimates in the Philippines. Atmos. Res. 2013, 122, 599–608. [Google Scholar] [CrossRef]
  52. Salio, P.; Hobouchian, M.P.; García Skabar, Y.; Vila, D. Evaluation of high-resolution satellite precipitation estimates over southern South America using a dense rain gauge network. Atmos. Res. 2015, 163, 146–161. [Google Scholar] [CrossRef]
  53. Dinku, T.; Ruiz, F.; Connor, S.J.; Ceccato, P. Validation and Intercomparison of Satellite Rainfall Estimates over Colombia. J. Appl. Meteorol. Clim. 2010, 49, 1004–1014. [Google Scholar] [CrossRef]
  54. Pensieri, S.; Bozzano, R.; Schiano, M.E. Comparison between QuikSCAT and buoy wind data in the Ligurian Sea. J. Marine Syst. 2010, 81, 286–296. [Google Scholar] [CrossRef]
  55. Donnelly, W.J.; Carswell, J.R.; McIntosh, R.E.; Chang, P.S.; Wilkerson, J.; Marks, F.; Black, P.G. Revised ocean backscatter model at c and ku- band under high wind conditions. J. Geophys. Res. 1999, 104, 11485–11497. [Google Scholar] [CrossRef]
Figure 1. Locations of the National Data Buoy Center (NDBC) and the Tropical Atmospheric Ocean project (TAO) moored buoys. Red circles and blue diamonds indicate the NDBC and TAO buoys, respectively.
Remotesensing 08 00390 g001
Figure 2. Number of collocated HY-2A Scatterometer (H2SCAT) and the advanced scatterometer (ASCAT) with below 1-h (a) and 3-h (b) timespans on 1° × 1° grid.
Remotesensing 08 00390 g002
Figure 3. 2-D histogram comparisons of wind speeds (ac) and wind directions (df) between TAO buoys and H2SCAT from January 2012 to December 2014. Panels (a) and (d), (b) and (e), and (c) and (f) were collocated under all-weather conditions, rain conditions, and rain-free conditions according to the Climate Prediction Center morphing method (CMORPH) precipitation data, respectively. Raster colors represent the occurrence in wind-speed bins of 0.5 m·s−1 × 0.5 m·s−1 and wind-direction bins of 10° × 10°.
Remotesensing 08 00390 g003
Figure 4. Residuals (H2SCAT-TAO buoys) of wind speeds (left) and wind directions (right) under all-weather, rain and rain-free conditions, calculated in 1 m·s−1 wind speed bins of TAO buoys. Green, blue and red lines represent the mean bias, the root mean square error (RMSE) and the standard deviations (STD), respectively. The raster colors represent residual distributions in 2-D wind-speed bins of 0.5 m·s−1 × 0.5 m·s−1 and wind-direction bins of 0.5 m·s−1 × 5°.
Remotesensing 08 00390 g004
Figure 5. 2-D histogram comparisons of wind speeds (ac) and wind directions (df) between NDBC buoys and H2SCAT from January 2012 to December 2014. Panels (a) and (d), (b) and (e), and (c) and (f) were collocated under all-weather conditions, rain conditions, and rain-free conditions according to CMORPH precipitation data, respectively. Raster colors represent the occurrence in wind-speed bins of 0.5 m·s−1 × 0.5 m·s−1 and wind-direction bins of 10° × 10°.
Remotesensing 08 00390 g005
Figure 6. Residuals (H2SCAT-NDBC buoys) of wind speeds (left) and wind directions (right) under all-weather, rain and rain-free conditions, calculated in 1 m·s1 wind speed bins of NDBC buoys. Green, blue and red lines represent the mean bias, RMSE and STD, respectively. The raster colors represent residual distributions in 2-D wind-speed bins of 0.5 m·s−1 × 0.5 m·s−1 and wind-direction bins of 0.5 m·s−1 × 5°.
Remotesensing 08 00390 g006
Figure 7. 2-D histogram comparisons of wind speeds (ac) and wind directions (df) between the European Centre for Medium Range Weather Forecasting (ECMWF) reanalysis data (ERA-Interim) and H2SCAT from January 2012 to December 2014. Panels (a) and (d), (b) and (e), and (c) and (f) were collocated under all-weather conditions, rain conditions, and rain-free conditions according to CMORPH precipitation data, respectively. Raster colors represent the occurrence in wind-speed bins of 0.5 m·s−1 × 0.5 m·s−1 and wind-direction bins of 10° × 10°.
Remotesensing 08 00390 g007
Figure 8. Residuals (H2SCAT-NDBC buoys) of wind speeds (left) and wind directions (right) under all-weather, rain and rain-free conditions, calculated in 1 m·s−1 wind speed bins of NDBC buoys. Green, blue and red lines represent the mean bias, RMSE and STD, respectively. The raster colors represent residual distributions in 2-D wind-speed bins of 0.5 m·s−1 × 0.5 m·s−1 and wind-direction bins of 0.5 m·s−1 × 5°.
Remotesensing 08 00390 g008
Figure 9. 2-D histogram comparisons (within 1-h timespan) of wind speeds (a) and wind directions (b) between ASCAT and H2SCAT from January 2012 to December 2014. Raster colors represent the occurrence in bins of 0.5 m·s−1 × 0.5 m·s−1 for wind speed and 10° × 10° for wind direction.
Remotesensing 08 00390 g009
Figure 10. Residuals (H2SCAT–ASCAT, within 1-h timespan) of wind speed (a) and wind direction (b), calculated in 1 m·s−1 bins of ASCAT wind speeds. Green, blue and red lines represent the mean bias, RMSE, and STD, respectively. Raster colors represent residual distribution in 2-D bins of 0.5 m·s−1 × 0.5 m·s−1 for wind speed and 0.5 m·s−1 × 5° for wind direction.
Remotesensing 08 00390 g010
Figure 11. 2-D histogram comparisons (within 3-h timespan) of wind speeds (ac) and wind directions (df) between ASCAT and H2SCAT from January 2012 to December 2014. Panels (a) and (d), (b) and (e), and (c) and (f) were collocated under all-weather conditions, rain conditions, and rain-free conditions according to CMORPH precipitation data, respectively. Raster colors represent the occurrence in wind-speed bins of 0.5 m·s−1 × 0.5 m·s−1 and wind-direction bins of 10° × 10°.
Remotesensing 08 00390 g011
Figure 12. Residuals (H2SCAT–ASCAT, within 3-h timespan) of wind speeds (left) and wind directions (right) under all-weather, rain and rain-free conditions, calculated in 1 m·s−1 wind speed bins of NDBC buoys. Green, blue and red lines represent the mean bias, RMSE and STD, respectively. The raster colors represent residual distributions in 2-D wind-speed bins of 0.5 m·s−1 × 0.5 m·s−1 and wind-direction bins of 0.5 m·s−1 × 5°.
Remotesensing 08 00390 g012
Figure 13. Residual probability distribution functions (PDFs) of wind speed (a) and direction (b). Colored and dashed lines represent the comparisons between H2SCAT and different alternative observations.
Remotesensing 08 00390 g013
Table 1. Summary of statistical parameters for wind speed (m·s−1) and wind direction (°) between HY-2A Scatterometer (H2SCAT) and the Tropical Atmospheric Ocean project (TAO) moored buoys under all, rain and no-rain conditions.
Mean BiasStandard DeviationRMSEOccurrence
SpeedDirectionSpeedDirectionSpeedDirection
TAO wind speed < 4 m·s−1
All1.393.992.4870.162.8570.28705
Rain3.748.543.3772.965.0373.4644
No Rain0.662.581.5269.211.6669.26661
TAO wind speed 4–13 m·s−1
All0.221.341.4336.161.4436.195021
Rain1.372.842.2852.492.6652.57826
No Rain0.021.091.1132.571.1132.594195
TAO wind speed > 13 m·s−1
All−2.65−12.283.5332.574.4234.8093
Rain−1.13−12.332.7237.612.9539.5858
No Rain−7.21−12.10----7.2112.1035
All TAO wind speed
All0.391.731.6943.071.7343.115819
Rain1.904.072.7657.743.3557.89928
No Rain0.111.291.2039.661.2039.684891
Table 2. Summary of statistical parameters of wind speed (m·s−1) and wind direction (°) between H2SCAT and the National Data Buoy Center (NDBC) buoys under all-weather, rain and no-rain conditions.
Mean BiasStandard DeviationRMSEOccurrence
SpeedDirectionSpeedDirectionSpeedDirection
NDBC wind speed < 4 m·s−1
All1.110.802.5370.212.7770.212317
Rain4.12−1.993.3479.885.3079.9133
No Rain0.920.972.3569.562.5369.572284
NDBC wind speed 4–13 m·s−1
All0.320.481.6542.121.6842.1216,722
Rain1.342.092.6052.072.9352.111272
No Rain0.230.351.5241.171.5441.1815,450
NDBC wind speed > 13 m·s−1
All0.911.223.0049.543.1449.551812
Rain1.471.763.4155.703.7155.73373
No Rain0.781.102.8948.062.9948.071439
All NDBC wind speed
All0.440.561.8946.631.9446.6320,851
Rain1.581.712.8955.373.2955.391678
No Rain0.340.461.7445.781.7845.7819,173
Table 3. Summary of statistical parameters of wind speed (m·s1) and wind direction (°) between H2SCAT and the European Centre for Medium Range Weather Forecasting (ECMWF) reanalysis data (ERA-Interim) under all-weather, rain and no-rain conditions.
Mean BiasStandard DeviationRMSEOccurrence
SpeedDirectionSpeedDirectionSpeedDirection
ERA-Interim wind speed < 4 m·s−1
All1.230.802.3163.822.6263.831,517,883
Rain2.320.083.1570.443.9270.4480,600
No Rain1.170.852.2363.432.5263.431,437,283
ERA-Interim wind speed 4–13 m·s−1
All0.521.301.9234.881.9934.918,616,174
Rain0.901.132.3338.012.5038.03343,070
No Rain0.501.311.9034.751.9734.778,273,104
ERA-Interim wind speed > 13 m·s−1
All0.981.273.2640.403.4040.421,213,076
Rain0.521.233.0740.273.1140.2857,132
No Rain1.001.273.2740.403.4240.421,155,944
All ERA-Interim wind speed
All0.661.232.1539.922.2539.9311,347,133
Rain1.090.972.6445.222.8545.23480,802
No Rain0.641.252.1239.722.2239.7410,866,331
Table 4. Summary of statistical parameters of wind speed (m·s−1) and wind direction (°) between H2SCAT and the advanced scatterometer (ASCAT) (within 1-h timespan).
ASCAT SpeedMean BiasStandard DeviationRMSDOccurrence
SpeedDirectionSpeedDirectionSpeedDirection
<4 m·s−10.321.271.4871.761.5171.7721,311
4–13 m·s−1−0.180.721.4342.171.4442.18114,516
>13 m·s−10.94−0.502.5644.472.7344.4714,309
All speed0.000.681.6247.471.6247.47150,136
Table 5. Summary of statistical parameters of wind speed (m·s−1) and wind direction (°) between H2SCAT and ASCAT (within 3-h timespan).
Mean BiasStandard DeviationRMSEOccurrence
SpeedDirectionSpeedDirectionSpeedDirection
ASCAT wind speed < 4 m·s−1
All0.88 1.13 1.75 70.23 1.96 70.24 167,929
Rain0.79 1.62 1.39 69.84 1.60 69.86 1403
No Rain0.88 1.13 1.75 70.24 1.96 70.25 166,526
ASCAT wind speed 4–13 m·s−1
All0.32 0.84 1.86 37.37 1.89 37.38 1,244,211
Rain0.35 1.52 1.91 43.13 1.94 43.16 10,628
No Rain0.32 0.83 1.86 37.32 1.89 37.33 1,233,583
ASCAT wind speed > 13 m·s−1
All0.80 1.95 3.23 41.27 3.33 41.32 202,317
Rain1.06 −0.96 3.62 43.95 3.77 43.96 1716
No Rain0.80 1.97 3.23 41.25 3.32 41.30 200,601
All ASCAT wind speed
All0.44 1.01 2.08 42.30 2.13 42.31 1,614,457
Rain0.48 1.22 2.17 46.58 2.23 46.60 13,747
No Rain0.44 1.00 2.08 42.30 2.13 42.30 1,600,710
Table 6. Proportions of wind speed residuals located in ±2.0 m·s−1 and wind direction residuals located in ±20° (units: %)
TAONDBCERA-InterimASCAT (1-h)ASCAT (3-h)
All88.3/73.182.2/69.877.0/72.091.1/69.378.7/68.5
Rain61.9/55.163.6/61.469.3/65.8--78.2/68.1
Rain-Free93.3/76.583.8/70.577.3/72.3--78.7/68.5
Table 7. RMSEs of wind speed (m·s1) and direction (°, in gray) retrieved from H2SCAT during 2012–2014.
Beaufort Wind ScaleWind Speed Range (m/s)NDBCTAOERA-INTERIMASCAT (1-h)ASCAT (3-h)
AllRainRain-freeAllRainRain-freeAllRainRain-freeAllAllRainRain-free
0–10.0–4.02.775.32.532.855.031.662.623.922.521.511.961.601.96
70.2179.9169.5770.2873.4669.2663.8370.4463.4371.7770.2469.8670.25
2–54.0–10.81.633.011.481.422.651.11.932.51.91.371.811.811.81
41.8754.440.7935.6451.4732.3234.7838.2234.6342.3137.4542.6437.40
6–710.8–17.12.222.712.132.192.891.712.732.692.742.072.642.952.64
45.3548.0244.8753.0166.914437.537.9137.4842.6938.6444.2938.59
8–917.1–24.45.015.514.81------4.693.954.734.224.805.144.79
56.8252.8758.17------45.1845.5545.1545.3946.2350.5146.18
≥10≥24.49.12.7312.57------5.845.775.857.177.46--7.46
26.163512------47.9154.9247.4436.9456.20--56.20
--2–241.853.161.681.633.121.172.242.762.211.612.122.232.12
45.1954.0744.3340.7255.337.4338.6342.7538.4445.4140.6845.3240.63
AllAll1.943.291.781.733.351.22.252.852.221.622.132.232.13
46.6355.3945.7843.1157.8939.6839.9345.2339.7447.4742.3146.6042.30

