Article

Vineyard Detection and Vine Variety Discrimination from Very High Resolution Satellite Data

by
Christina Karakizi
*,
Marios Oikonomou
and
Konstantinos Karantzalos
*
Remote Sensing Laboratory, National Technical University of Athens, Heroon Polytechniou 9, Zographos 15780, Greece
*
Authors to whom correspondence should be addressed.
Remote Sens. 2016, 8(3), 235; https://doi.org/10.3390/rs8030235
Submission received: 10 December 2015 / Revised: 23 February 2016 / Accepted: 29 February 2016 / Published: 12 March 2016
(This article belongs to the Special Issue Remote Sensing in Precision Agriculture)

Abstract

:
In order to exploit remote sensing data operationally for precision agriculture applications, efficient and automated methods are required for the accurate detection of vegetation, crops and different crop varieties. To this end, we have designed, developed and evaluated an object-based classification framework towards the detection of vineyards, the vine canopy extraction and the vine variety discrimination from very high resolution multispectral data. A novel set of spectral, spatial and textural features, as well as rules, segmentation scales and a set of parameters are proposed based on object-based image analysis. The validation of the developed methodology was carried out on multitemporal WorldView-2 satellite data at four different viticulture regions in Greece. Concurrent in situ canopy reflectance observations were acquired from a portable spectroradiometer during the field campaigns. The performed quantitative evaluation indicated that the developed approach managed in all cases to detect vineyards with high completeness and correctness detection rates, i.e., over 89%. The vine canopy extraction methodology was validated with overall accuracy (OA) rates of above 96%. The quantitative evaluation regarding the vine variety discrimination task, including experiments with up to six different varieties, reached OA rates above 85% at the parcel level. The combined analysis of the experimental results with the spectral signatures from the in situ reflectance data indicated that certain vine varieties (e.g., Merlot) presented distinct spectral patterns across the VNIR spectrum.

Graphical Abstract

1. Introduction

Multispectral sensors onboard satellite, aerial and UAV platforms are nowadays the main source of remote sensing information for precision agriculture and environmental monitoring applications. Due to certain key factors, like aerial flight regulations and cost, satellite remote sensing is, still, providing operationally cost-effective geospatial vegetation maps with up to thirty centimeters of spatial resolution. At the same time, open data policies both in the USA and EU and commercial Earth observation satellite missions are delivering an unprecedented volume of data with an increasing level of detail and accuracy.
In order to exploit such Earth observation big data operationally, for agriculture and environmental applications, efficient and automated processing methodologies are required that can accurately detect vegetation, crops and crop varieties in remote sensing images. To this end, recent studies have employed high and very high resolution satellite imagery towards vegetation, forest/tree mapping [1,2,3,4], biomass and structural parameters estimation [5,6,7] and crop type mapping and identification [8,9]. Moreover, crop-based and variety-based data analysis can create valuable validated agricultural maps and products for the implementation of effective management decisions [10,11]. In particular, for viticulture applications, the detection of vineyards from satellite remote sensing data and the remote discrimination of vine varieties, including numerous Vitis vinifera L. varieties that are cultivated worldwide, is of major importance both for farmers and government activities.
For more than a decade now [12,13,14,15,16], research efforts have been focusing on the exploitation of satellite image data at different spatial, spectral and temporal resolutions towards the efficient analysis and monitoring of vine crops through remote sensing sensors and techniques. In particular, apart from the within-field crop analysis and the estimation of the spatial variability in wine-grape composition and yield [17,18,19,20,21,22,23], there is plenty of research towards the classification, identification and delineation of crops in remote sensing data [24,25,26,27]. However, despite recent research efforts towards the detection and delineation on medium [28,29,30] and high resolution [31,32] spatial scales, the development and validation of efficient classification frameworks for operational vineyard detection in high resolution data and over large agricultural regions still remain a challenge.
Concurrently, another more complex problem is the accurate discrimination of vine varieties from remote sensing data, a task of significant importance for farmers, wine producers, agronomists, geospatial engineers and public agencies for numerous reasons, such as the production of variety-specific maps, misplanting detection, certification labeling, vine-variety database creation, planning, etc. Therefore, along with the in-field analysis, the different mapping products (like canopy, vigor, maturity, etc.) must take into account and be optimized according to the variety [33,34,35,36,37,38], since the overall management, grape/wine quality potential and respective economic value is variety dependent [39,40]. To this end, apart from the conventional analytical techniques employed to discriminate several vine or other plant varieties, such as ampelometry [41], wet chemistry methods or DNA analysis [42], the exploitation and validation of non-destructive remote sensing tools has not been much studied. Laboratory experiments based on leaf/fruit reflectance spectroscopy and statistical analysis indicated that certain vine [40] and strawberry [43] varieties were detected and separated among other ones.
Most other studies have mainly employed aerial hyperspectral datasets from manned aircrafts. Lacar et al. [44] experimented with the discrimination of two different vine varieties i.e., Cabernet Sauvignon and Syrah. Using CASI (Compact Airborne Spectrographic Imager) hyperspectral data over a vineyard in the Barossa Valley in South Australia and the spectral statistical analysis from image sampling results, this study indicated a certain variation in the spectral signatures of the two varieties in the visible region. Classification results employing 12 spectral bands from the VNIR resulted in high discrimination rates between the two varieties. Under a similar experimental set-up, Ferreiro-Arman et al. [45] employed a CASI hyperspectral dataset with spatial resolution at 3 m and 144 spectral bands over the Domain Château Luchey-Halde (Bordeaux, France). Different supervised classification techniques were tested for the discrimination of two vine varieties (i.e., Merlot Noir and Cabernet Sauvignon) and also the classes of soil and trees, resulting in high OA rates, i.e., around 90%. Moreover, based on a CASI-2 aerial hyperspectral dataset over the Pessac-Léognan region (Bordeaux, France) and on a supervised classification procedure, several discrimination experiments were performed under constant and varying within-scene illumination conditions [46]. The overall evaluation indicated high (above 82%) OA rates for binary classification between pairs of, i.e., Merlot Noir, Cabernet Sauvignon and Cabernet Franc.
Towards the same direction, but addressing the problem for very high resolution satellite data, we have designed, developed and validated a remote sensing classification procedure towards the efficient vineyard detection and vine variety discrimination. We have employed an object-based classification framework [47,48] and developed an efficient set of features and rules that are able to effectively identify vineyards in high resolution multispectral pan-sharpened data in different viticulture regions. Moreover, the developed framework was validated for the extraction of the vine canopy and the discrimination of vine varieties through numerous experiments towards the separation of three and up to six different vine varieties/clones.

Contribution

Regarding the developed vineyard detection methodology, in contrast to similar research efforts towards vineyard and/or other crop identification tasks [8,9,15,22,23,24,27,30], the proposed approach employs very high resolution multispectral data, along with a specific set of features, rules, segmentation scales and a set of parameters that deliver relatively higher detection rates. Instead of employing only spectral features (e.g., [8,22,23,27]), we employ, as in [9,24], textural features, as well. However, we solve the problem for very high resolution pan-sharpened data (at 50 cm) instead of the significantly coarser Landsat 8 and ASTER data (15 m/30 m).
Regarding the developed canopy extraction methodology in contrast to similar efforts that are based on (e.g., NDVI) thresholds and/or line detection/fitting [28,32,49], we formulate the problem under a supervised object-based classification framework and propose a set of spectral and spatial features that can extract the canopy (not just lines, center-lines, etc.) while addressing different in-between the rows materials, like soil, weeds, rock, etc.
Last, but not least, we propose a novel framework for vine variety discrimination based on a fine segmentation scale and a set of spectral features that can discriminate different varieties in very high resolution multispectral data. It is worth mentioning that similar efforts [44,45,46] were based on airborne hyperspectral data and focused on discriminating two vine varieties through classification.

2. Materials and Methods
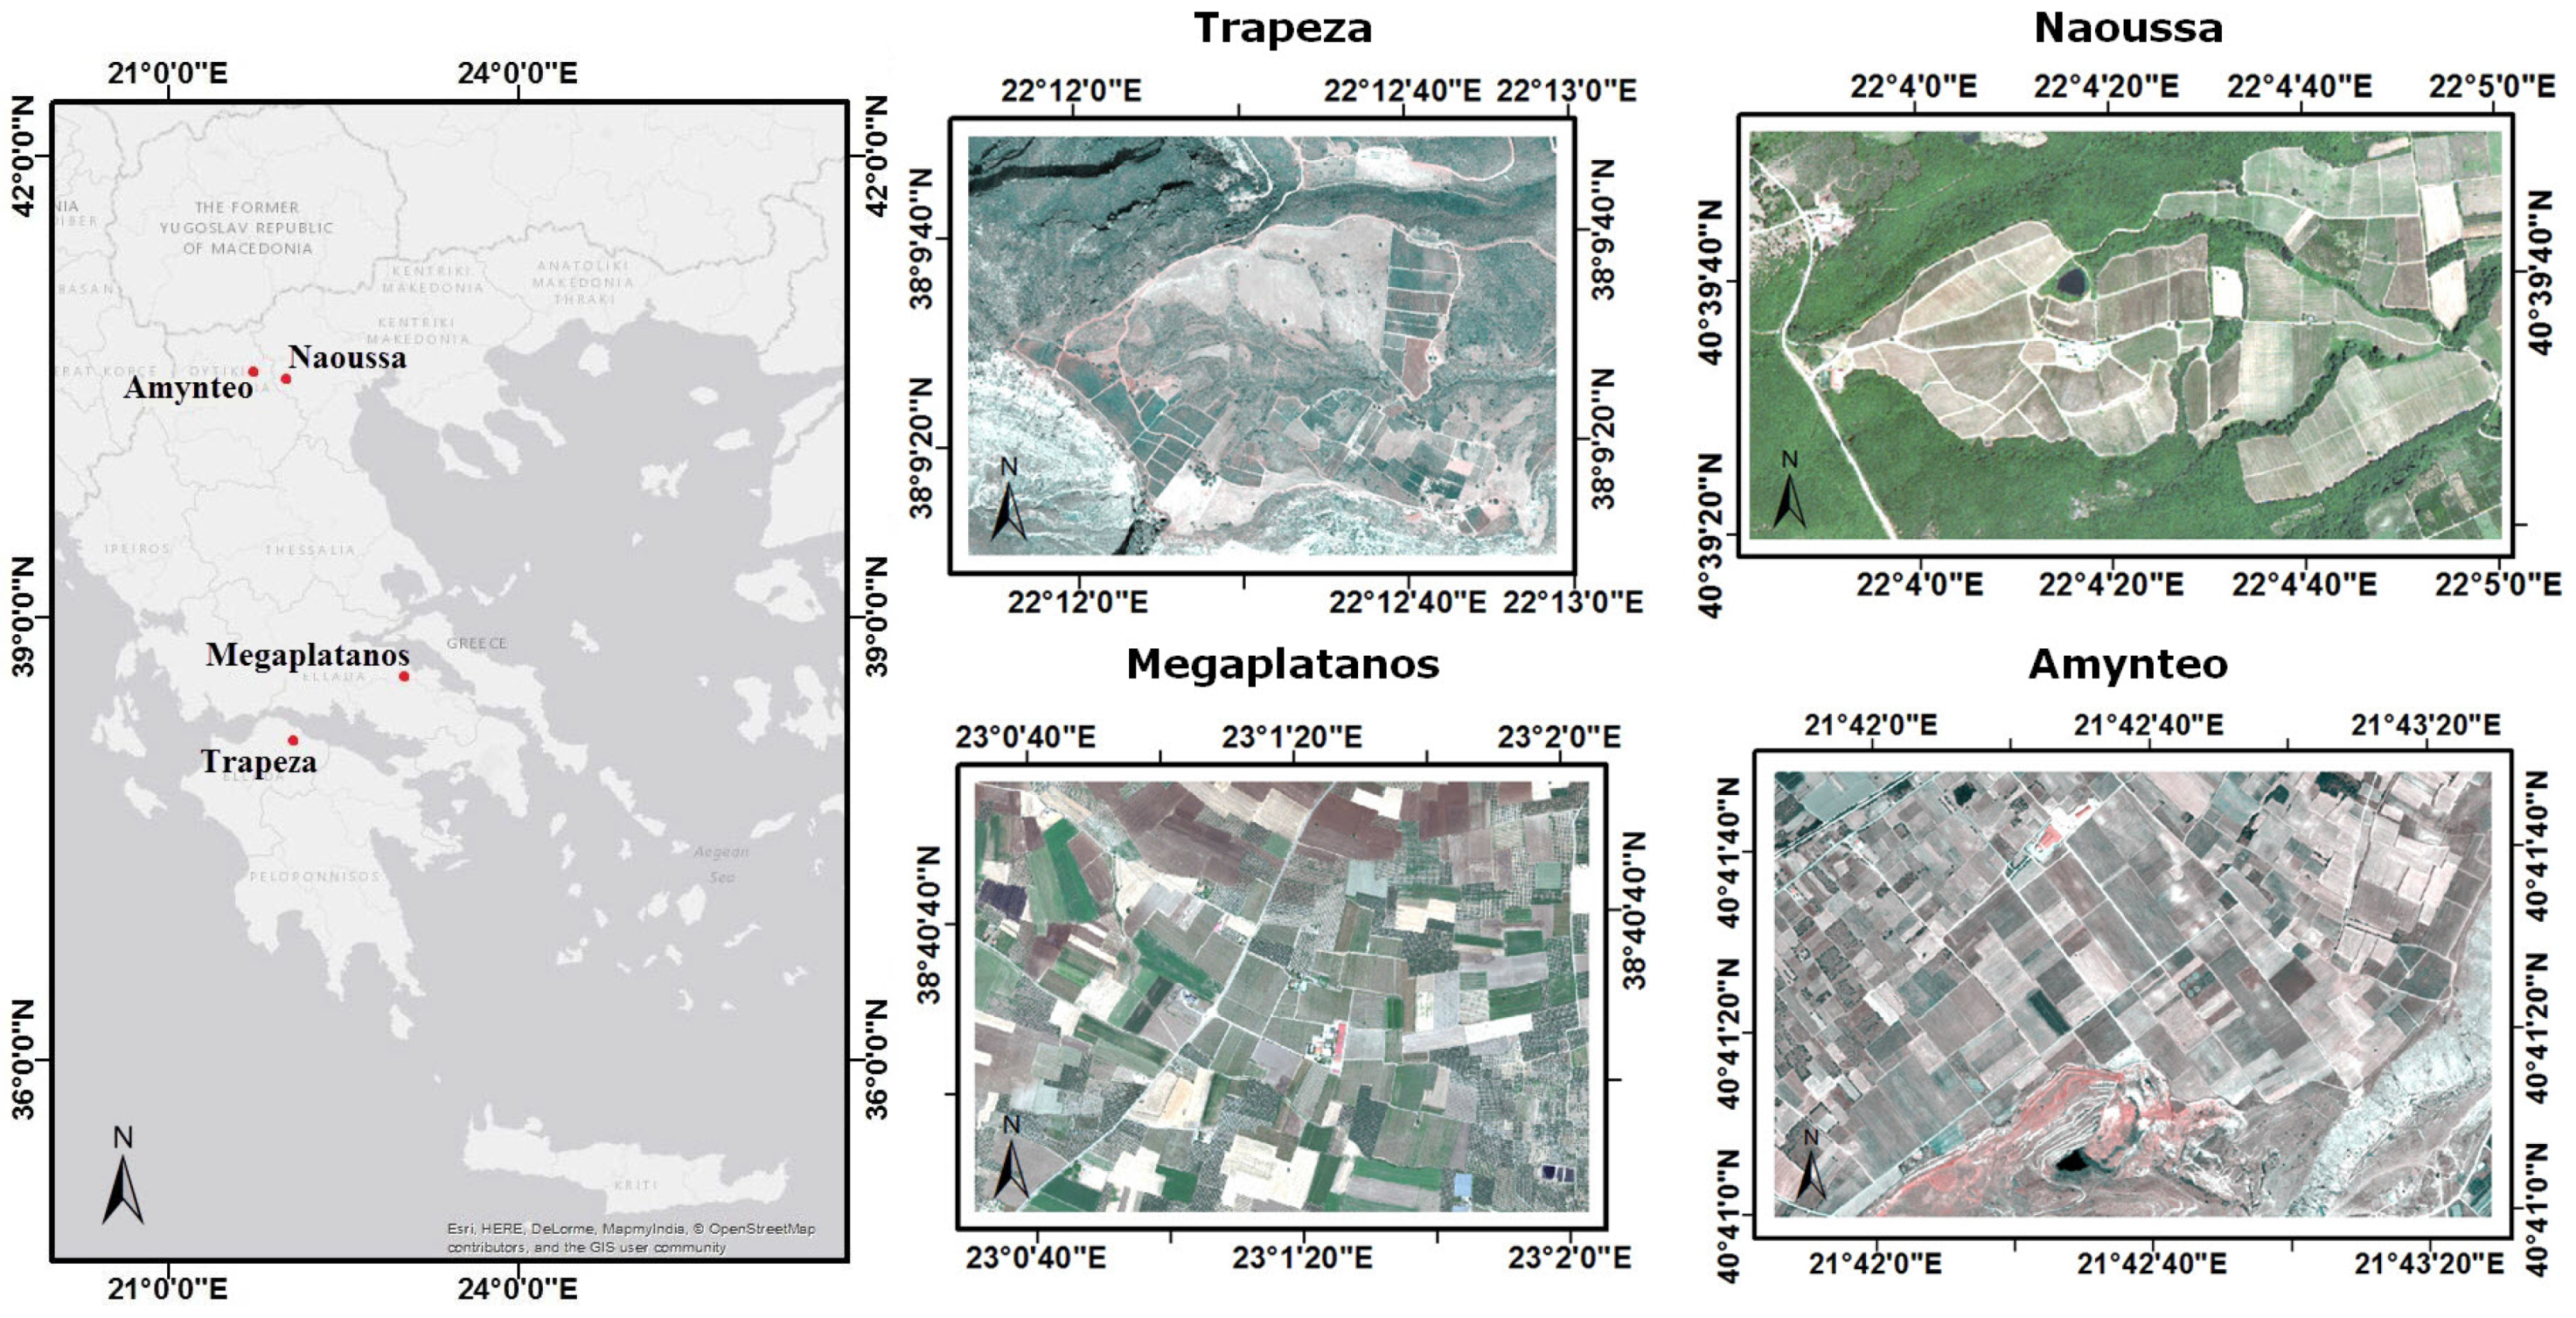
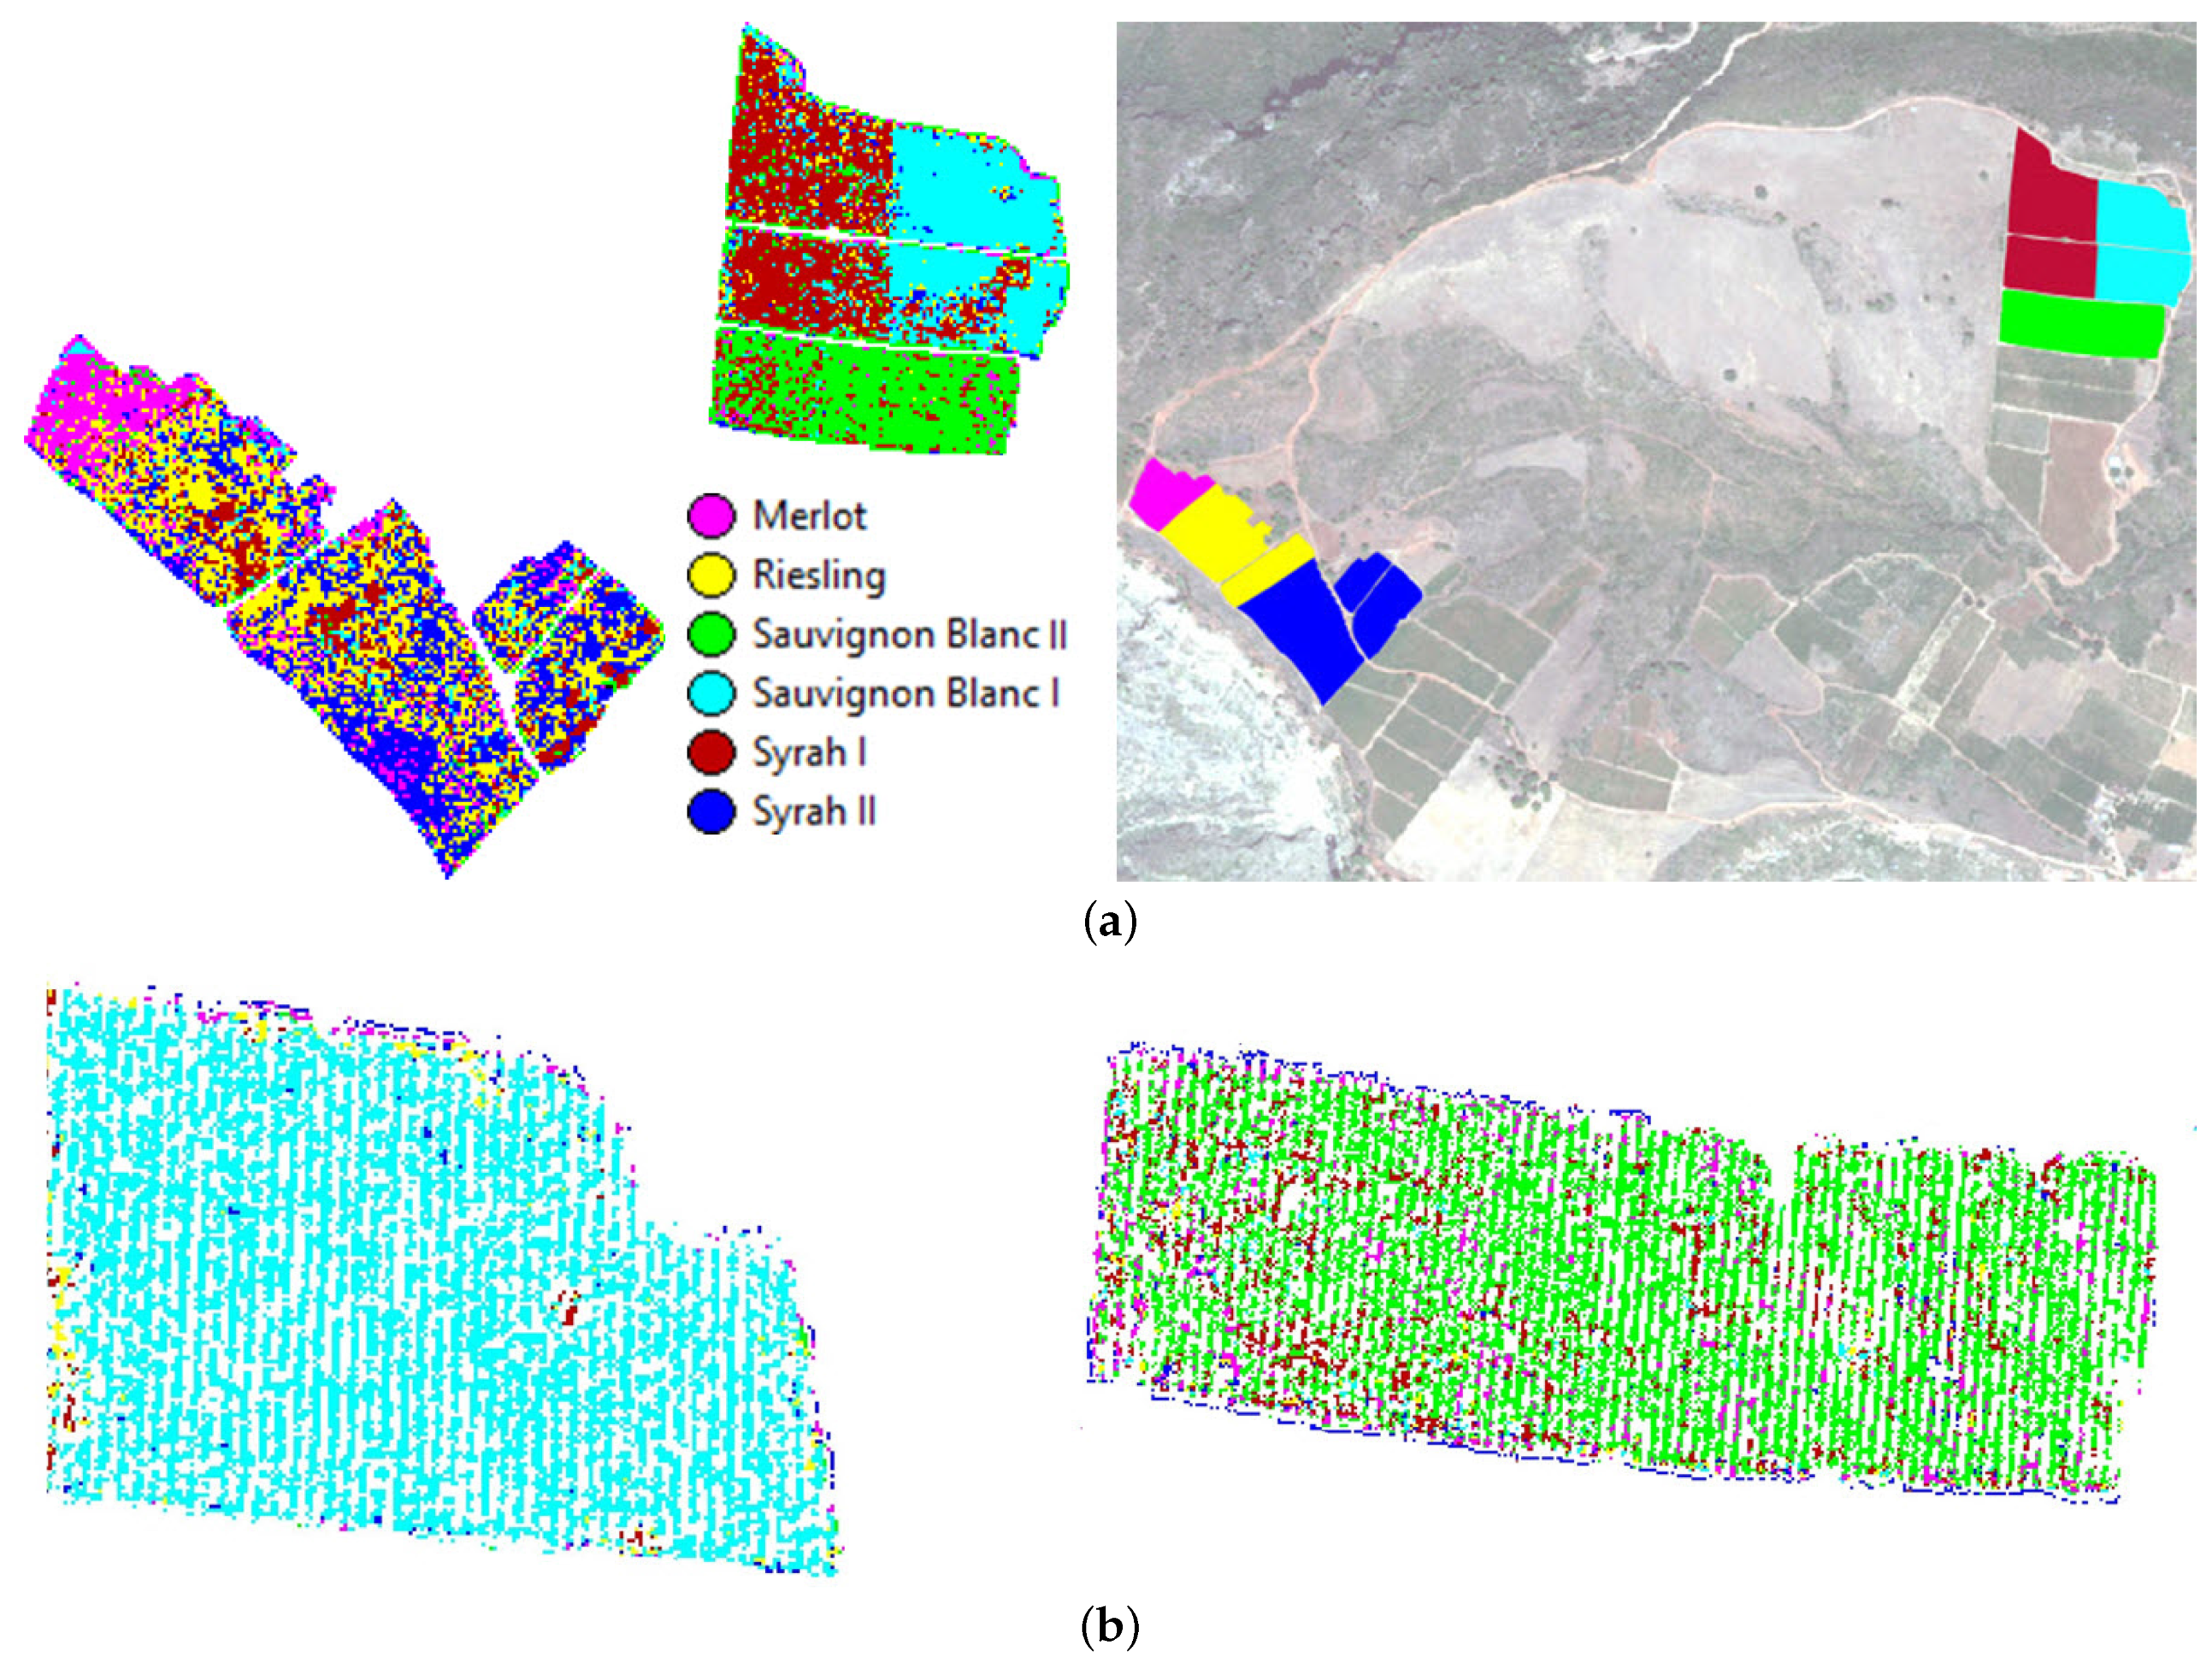
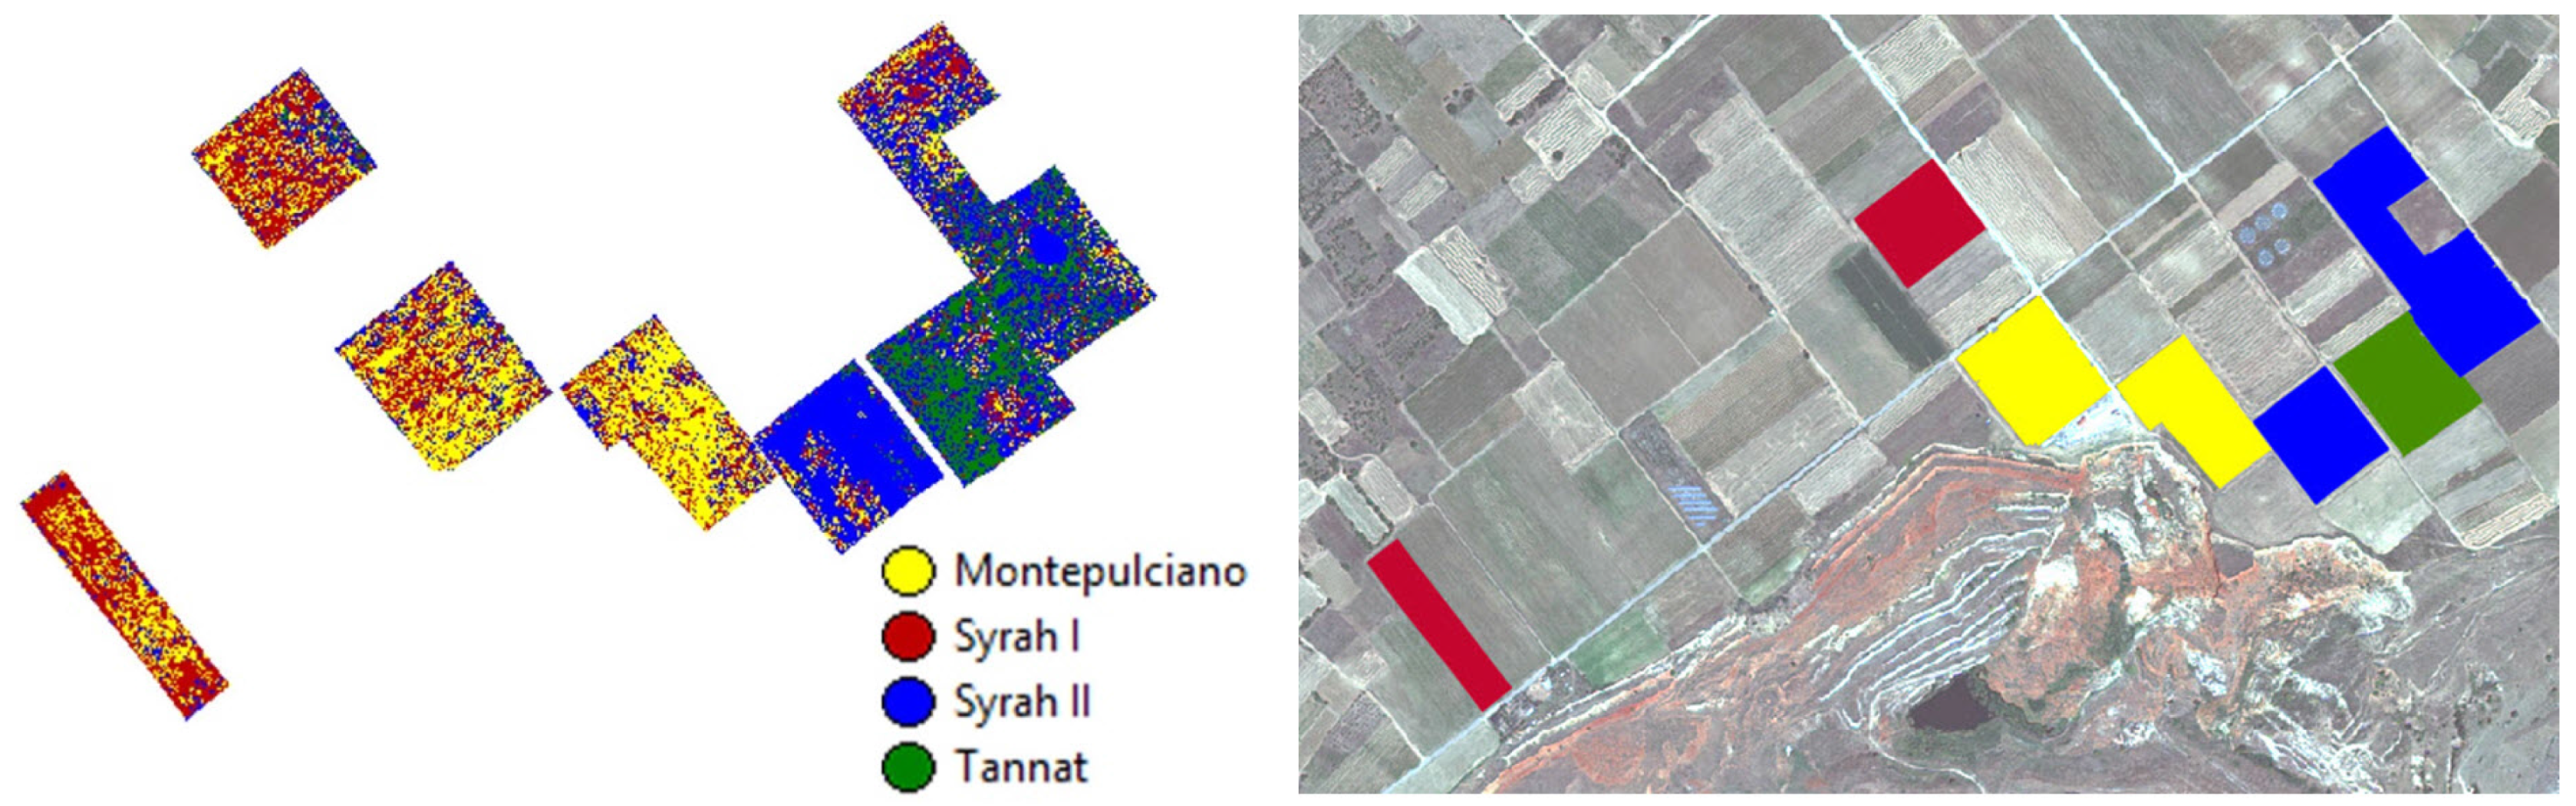
2.1. Study Areas

Data acquisition campaigns were conducted in four different viticulture regions in Greece (from the central to north regions) all belonging to local Protected Geographical Indication (PGI) zones (Figure 1). Concurrent satellite and field campaigns were scheduled during the veraison period, from early July to early August, for the years 2012 and 2013.
The first study area, Trapeza, is located in the Northern Peloponnese, inside the PGI zone Plagies Aigialeias, at an altitude of about 800 m, over the Trapeza village. Eight different vine varieties are cultivated in this particular region with Syrah, Stafida and Sauvignon Blanc among the most important for winemaking. The second region, Megaplatanos, is located in Central Greece, inside the PGI zone Koilada Atalantis, at an altitude of about 60 m above sea level. More than 20 different vine varieties are cultivated in this area. During this work, we focused mainly on the study of six of those, including Chardonnay, Robola and Cabernet Sauvignon. The third study area, Naoussa, is located in Western Macedonia, inside the PGI zone Naoussa and more specifically near the Giannakochori village. The altitude of the region is about 200 m above sea level. More than nine different varieties are cultivated in the region. Xinomavro, Merlot and Syrah are the dominating varieties for winemaking purposes. The forth study area, Amynteo, is located in Western Macedonia, inside the PGI zone Florina near the Amynteo village, at an altitude of about 600 m above sea level. Various varieties are cultivated in the region. During this study, we focused mainly on the Syrah, Tannat and Montepulciano varieties.

2.2. Satellite and Field Campaigns

Very high resolution panchromatic and multispectral satellite imagery was acquired from the WorldView-2 ( WV-2) satellite sensor, in GeoTIFF format of 16-bit color radiometric resolution. Images were acquired during the veraison period and in particular on 31 July 2012 for the Trapeza and Megaplatanos regions, on 29 July 2013 for the Naoussa study area and on 1 August 2013 for the Amynteo region. The WorldView-2 satellite carries an imaging instrument containing a high resolution panchromatic band with a reduced infrared and blue response and eight lower spatial resolution spectral bands. WorldView-2 captures panchromatic imagery of 0.5-m spatial resolution and 8-band multispectral imagery of 2-m resolution. Apart from the standard RGB and near infrared (NIR) spectral bands, four additional bands were available in all cases i.e., the coastal (centered at 425 nm), the yellow (centered at 605 nm), the red-edge (centered at 725 nm), which is on the onset of the high reflectivity portion of vegetation response, and a second NIR (centered at 950 nm).
In all study areas, concurrently with the satellite campaigns, intensive field campaigns were conducted in order to collect reference/ground truth data including the precise location, boundaries, variety and clone of each parcel. Existing maps with geographic information and varietal plantation were verified or updated during field surveys, with the aid of the farmers and agronomists in charge. In situ reflectance was also obtained using the GER 1500 (Spectra Vista Corporation) portable spectroradiometer, which provides spectra with 512 spectral bands, distributed in the spectral region from 350 nm to 1050 nm with 3.2-nm FWHM. More than a thousand measurements were acquired, while each measurement was the average of three successive ones, computed internally by the instrument. The instrument was held approximately 1 m above the vine canopy, resulting in an effective scene size of about 190 cm2. For each series of measurements, the irradiance was also obtained through measurements on a Lambertian reference panel. The position of each measurement was recorded using a portable GPS.

2.3. Data Pre-Processing
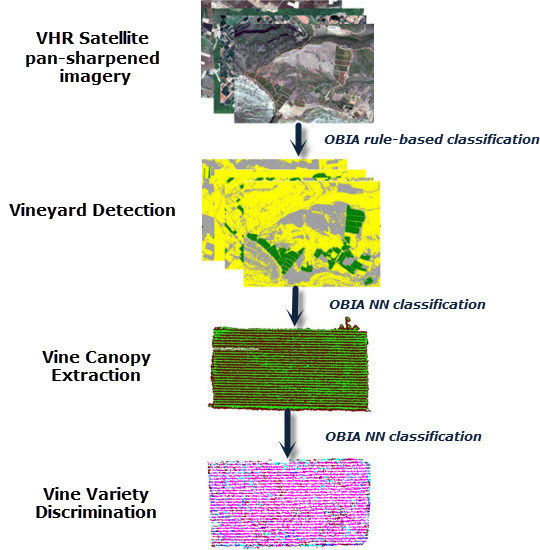
Radiometric and atmospheric corrections were performed on the satellite imagery towards the elimination of solar illumination, atmospheric and terrain effects. Digital numbers of relative radiance were converted to absolute radiance using the absolute radiometric calibration factors and effective bandwidths for each band. Atmospheric correction was conducted through ENVI’s (ed. 5.0) Fast Line-of-sight Atmospheric Analysis of Hypercubes (FLAASH). Moreover, the high resolution panchromatic data were fused with the lower resolution multispectral data through a pan-sharpening procedure. The high pass filter (HPF) [50] and the hyperspherical color sharpening (HCS) [51] algorithms were employed. HPF is based on transferring high spatial details extracted from the panchromatic to the re-sampled multispectral image [52,53], while the HCS algorithm, which can handle any number of input bands, is based on the transformation from the native color space to the hyperspherical color space. In all of our experiments the pan-sharpened data from the HPF algorithm were used since the algorithm managed to enhance, slightly more effectively, the linear pattern of the vineyards.
In addition, the spectral readings, from the portable spectroradiometer, were taken with nadir view in the principal plane, while absolute bi-directional reflectance was obtained by normalizing the readings with the reference panel. More precisely, bi-directional reflectance was calculated by:
R T = L T / L R * k
where R T is the absolute spectral reflectance of the target, L T the radiance of the target, L R the relative irradiance value of the reference panel and k the panel’s reflectance spectrum, as a calibrating factor, measured in the laboratory. The reflectance values for each variety’s canopy were depicted through reflectance charts, within the range 0 to 1, forming the corresponding spectral signatures.

3. Methodology

Motivated by the successful application of object-based image analysis (OBIA) in very high resolution satellite data [3,4,9,47,48,54,55], the developed methodology was based on OBIA principles, while it was designed to address vineyard detection, vine canopy extraction and vine variety discrimination. In particular, for every processing step, several experiments were performed based on features employed from the literature on similar crop identification/detection studies (e.g., [8,9,16,22,23,24,27,30]), while the optimal ones for all datasets were selected from a larger pool, through several experiments, feature analysis tools (assessing how each feature contributes to the discrimination task) and a trial and error procedure for fine tuning their parameters. To this end, Trimble’s eCognition Developer (ed.8), MathWorks’ MATLAB (2015b) and in-house developed software were employed.

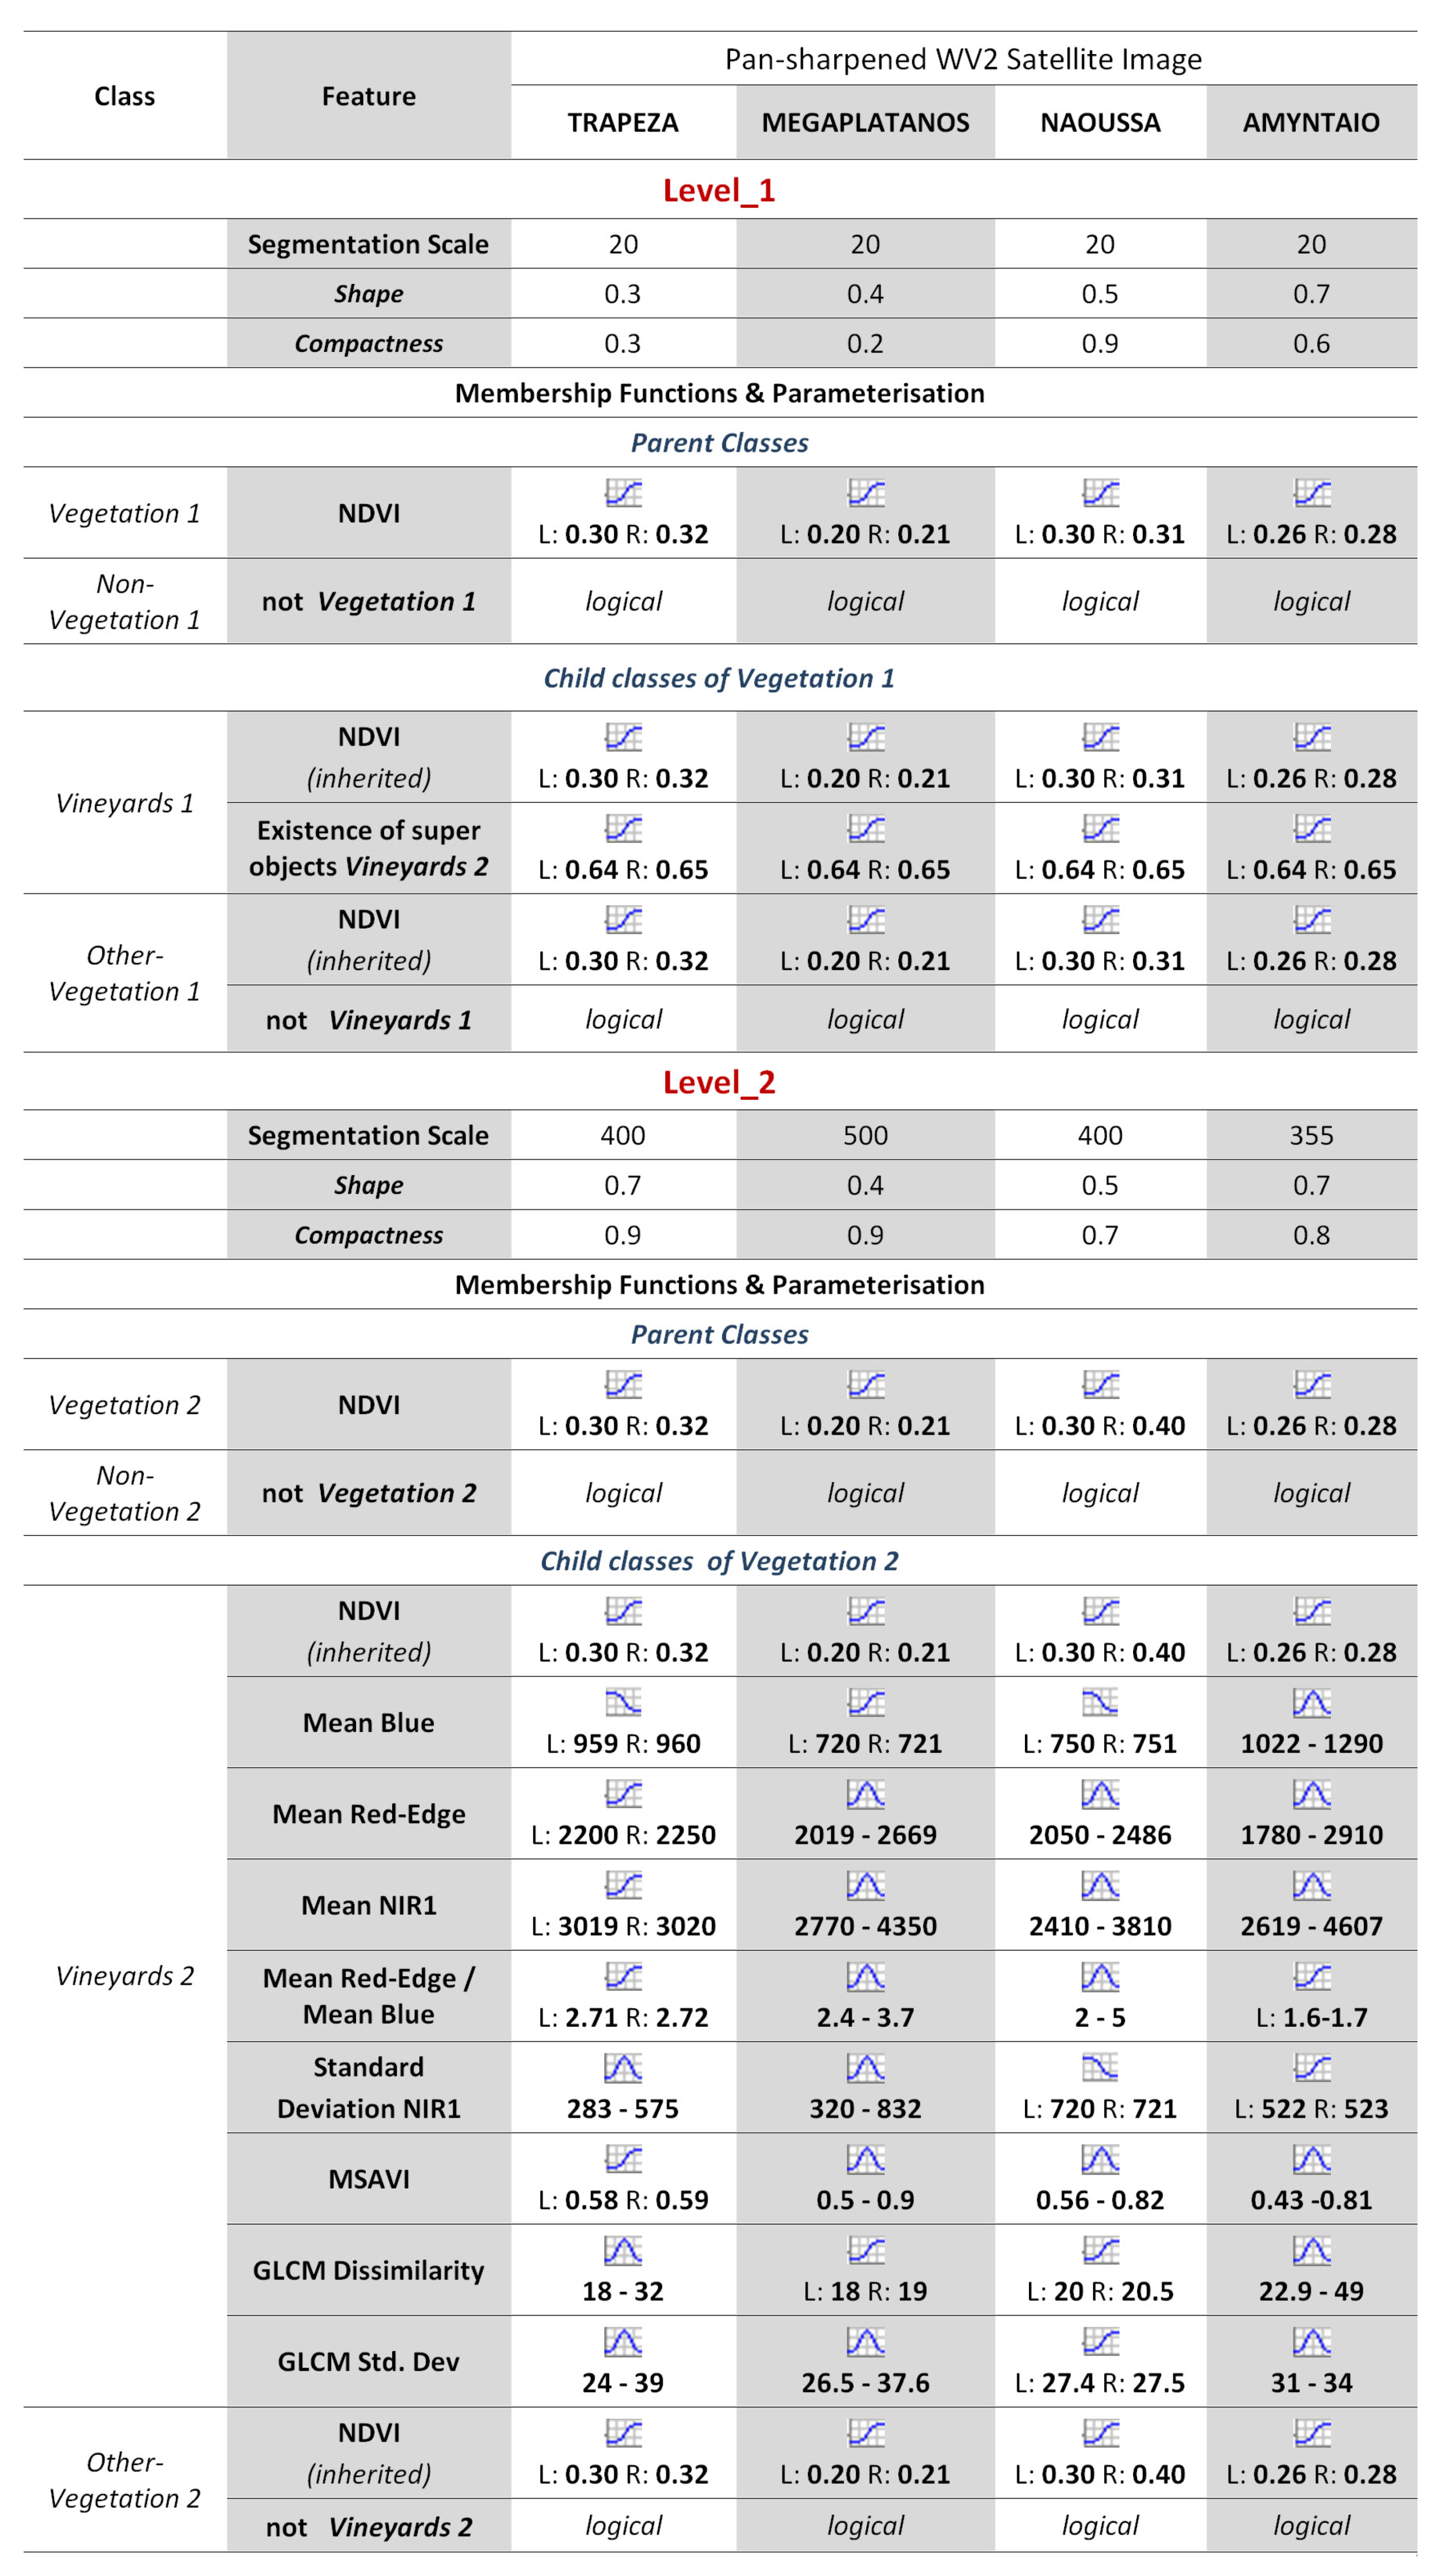
3.1. Vineyard Detection

The first goal was to design and develop a generic classification framework for the detection of vineyards in very high resolution multispectral pan-sharpened data. A multi-scale classification procedure along with fuzzy logic and knowledge-based rule sets [47,54] were employed. Firstly, image objects were created on several scales using a multi-resolution segmentation algorithm, based on a region-merging procedure. By minimizing the average heterogeneity and maximizing their respective homogeneity, this algorithm consecutively merges pixels or existing image objects. The procedure was based on certain user-defined parameters, like scale, color/shape and smoothness/compactness, that were weighted together to define a homogeneity criterion [48,56]. The classification scheme was based on two segmentation levels, i.e., Level 1 and Level 2 (Figure 2), while the core classification was conducted at Level 2, and then, the final classification maps were derived from the finer scale Level 1.
The class hierarchy was formed including at the top level two classes, i.e., Vegetation and Non-Vegetation areas (Figure 2). Then, the Vegetation parent class was split into two child classes: Vineyards and Other-Vegetation. For the class description, certain features and rules were combined and associated with each class. Membership functions were used based on fuzzy logic associated with the class description. These functions defined the relationship between feature values and the degree of membership to the classes, e.g., : Remotesensing 08 00235 i001 “larger than”, defined by left and right border values; Remotesensing 08 00235 i002 “smaller than”, defined by left and right border values; Remotesensing 08 00235 i003 “full range” of values.
Both at Level 1 and Level 2, the class Vegetation was associated with the Normalized Difference Vegetation Index (NDVI) [57] and the membership function “larger than”. Class Non-Vegetation was associated with a logical rule in order to contain every object that was not classified as Vegetation. At this point, our goal was to separate scene’s vineyards from the other vegetation types. This was accomplished at the much coarser Level 2 based on a combination of eight features (Table 1, left), which were able under a fruitful synergy to highlight the distinctive properties of the Vineyards 2 and Other-Vegetation 2 subclasses. A large set of features was considered, while through several experiments and feature analysis, the optimum for all datasets of features, rules and parameters was formed (Table 1 left; Figure 2). In particular, certain spectral features, like mean blue, mean red-edge, band ratios and indices, e.g., mean red-edge/mean blue, and the modified Soil-Adjusted Vegetation Index (MSAVI) [58], were employed. Moreover, similar to [9,24], we employed two textural features (i.e., GLCM dissimilarity and GLCM standard deviation), but on very high resolution pan-sharpened data (at 50 cm) instead of the significantly coarser ASTER and Landsat 8 data.
During the last processing step, the classification result was refined at Level 1 (at a significantly finer segmentation scale) in order to approximate the correct object boundaries that were smoothed at the much coarser Level 2. A class-related feature (i.e., existence of super objects) was used to project class Vineyards 2 to class Vineyards 1, and class Other-Vegetation 1 was also described by the logical rule not Vineyards 1. Based on the developed class hierarchy and rule-set, the various image objects of all images were classified through a hierarchical classification procedure ensuring that, e.g., (i) classes that contain applicable child classes are not taking part in the classification of image objects; (ii) parent classes pass on their attributes to their child classes; and (iii) classes are only applied to classification of image objects, if all contained classifiers are applicable.

3.2. Vine Canopy Extraction

For any further analysis on the pan-sharpened data, the detection of vine canopy was required in order to separate the canopy from the material in-between the rows, like soil, weeds or other crop coverage. Another segmentation level was computed on the Vineyards class, creating a new, finer segmentation level over Level 1. The goal was to create small compact (with a size of about 2 to 3 pixels) image objects.
These image objects were, then, classified based on a nearest neighbor (NN) classifier. A membership value (between zero and one) was assigned according to the distance of object’s feature space to its nearest neighbor. During the training stage, a similar number of image objects was given as samples for both the canopy and the other in-between the rows materials. Training samples were covering approximately 0.01% to 0.03% of the total area in every dataset. Different features were explored for the feature space of the classifier, while the final combination (Table 1, middle) was derived through several experiments in all datasets and feature analysis tools, indicating which features contribute more to the discrimination. The set of features that worked optimally in all datasets included both spectral (e.g., mean band intensity values, NDVI) and spatial features, e.g., mean difference (diff.) to neighbors and mean difference to brighter/darker neighbors. In particular, the spatial features describe the relations between image objects and their neighbor image objects in terms of mean band intensity values, e.g., :
  • Mean diff. to neighbors (red, NIR1): the mean band intensity value difference between an image object and its neighbor image objects (within a radius of 4 pixels) for bands red and NIR1.
  • Mean diff. to brighter/darker neighbors (red, NIR1): the mean band intensity value difference between an image object and its brighter/darker direct neighbor (with a common border) image objects for bands red and NIR1.
  • Number of brighter/darker objects (red, NIR1): the number of direct neighboring (with a common border) objects with higher/lower mean band intensity values for bands red and NIR1.
  • Relative border to brighter objects (red, NIR1): the ratio of the shared image border of an image object with direct neighbor brighter objects to the total border, for bands red and NIR1.

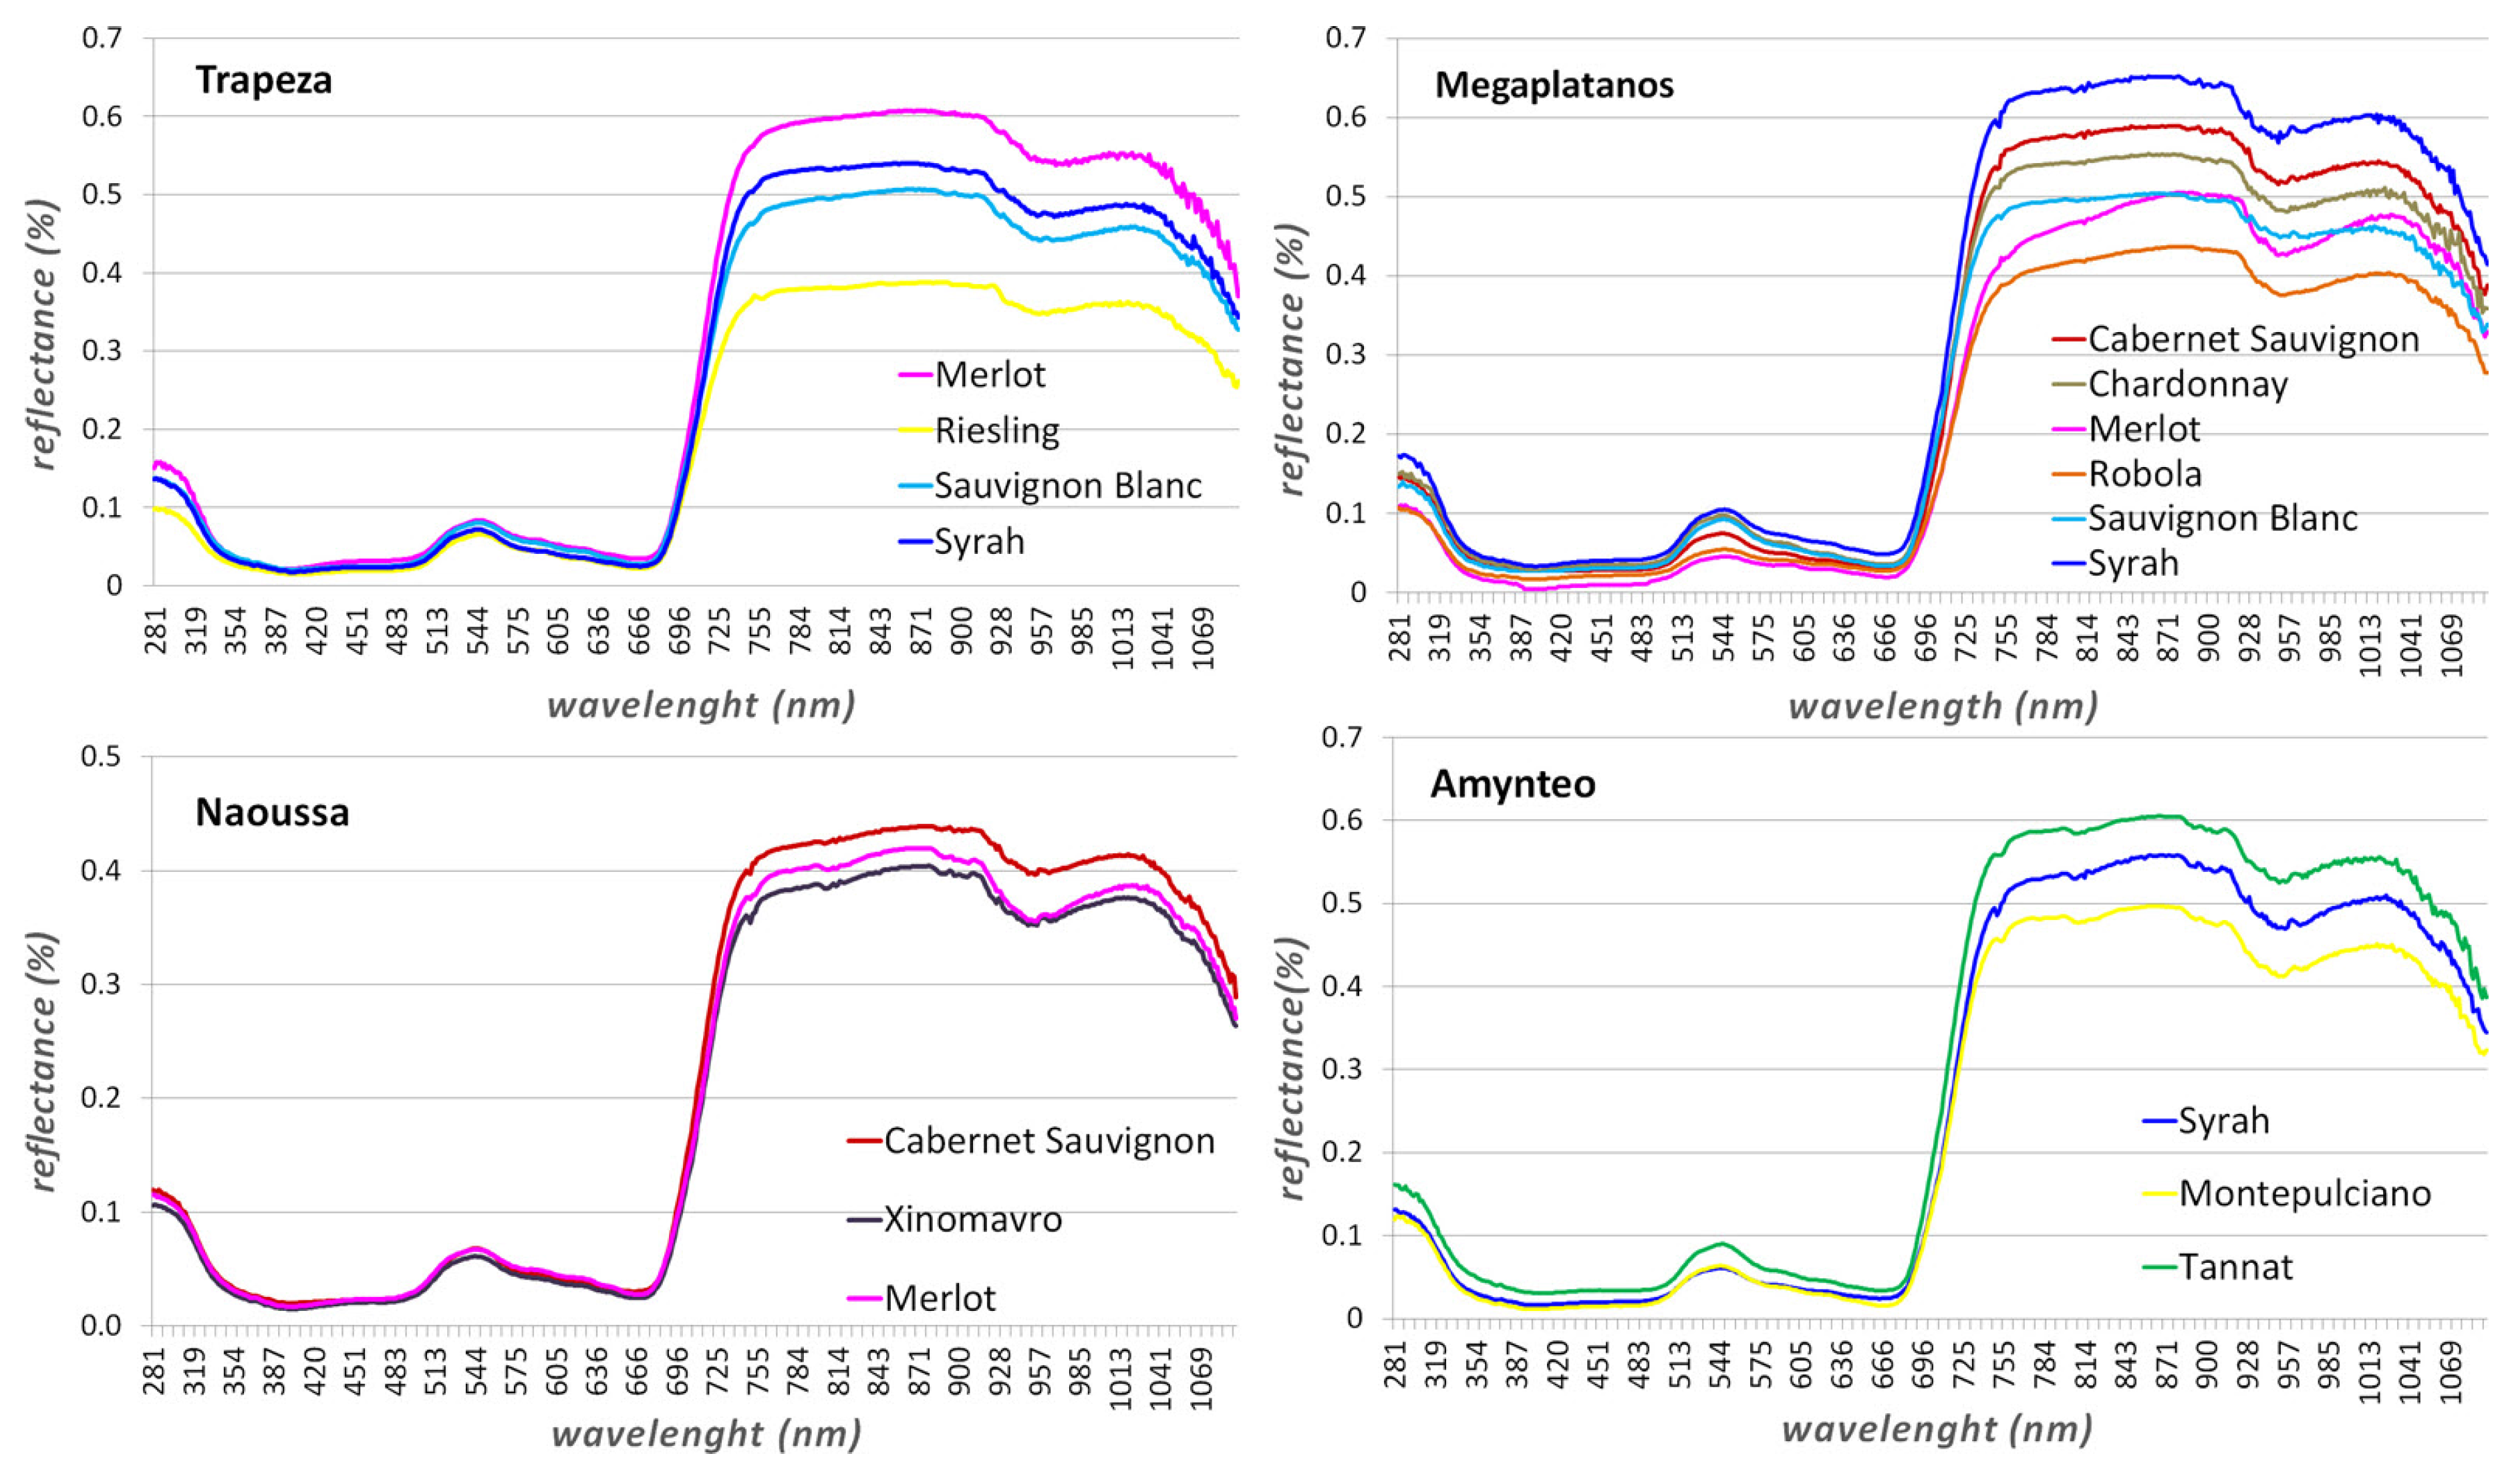
3.3. Vine Variety Discrimination

For the vine variety discrimination, which was the most challenging task of this study, a two-step methodology was developed based on supervised object-based classification and on a majority voting post-classification process. In particular, during the first step, a supervised classification procedure using the nearest neighbor (NN) classifier was applied on the detected canopy objects from the previous step. Training image objects were given as samples based on the reference/ground truth data obtained from the field campaigns. For each dataset, the area of samples to the ground truth area per class/variety varied from 0.5% to 1%.
Based on intensive experiments on all datasets and the evaluation from the feature space analysis, a group of features was formed (Table 1, right) that exploited optimally the distinctive spectral properties of vine varieties across the VNIR spectrum, e.g.,:
  • Mean (coastal blue, red, red-edge, NIR1, NIR2): mean band intensity values of an image object for coastal blue, red, red-edge, NIR1, NIR2 bands.
  • Ratio: the amount that a given image band contributes to the total brightness of an image object for all 8 bands.
  • Mean NIR1/mean red: The ratio of mean band intensity values of band NIR1 to band red of an image object.
  • Mean NIR2/mean blue: The ratio of mean band intensity values of band NIR2 to band blue of an image object.
In particular, as can be observed (Table 1, right), the majority of the spectral features incorporate the two NIR bands (of the multispectral WV-2 sensor) covering approximately the range of 760 nm to 1050 nm. This implied that these were the crucial wavelengths where the different varieties possess detectable spectral differences. The latter was also supported by the analysis of the in situ reflectance signatures (Section 4.2), which indicated that the studied varieties present discrete differences beyond 750 nm.
The second step of the variety discrimination task consisted of a post-classification procedure based on a majority voting process [59] towards associating a single variety with a certain parcel. In particular, based on the polygons of plots, a priori known from the ground truth data, each parcel was labeled according to the dominating variety, i.e., the variety in which the majority of pixels was classified within this parcel.
More than twenty different vine varieties and clones were present in these study areas and recorded in the corresponding reference/ground truth data. The ones that were more broadly cultivated or/and appeared in more than one study area were selected to participate in the experimental validation. Overall, thirteen vine varieties/clones were finally chosen to participate in the validation procedures. Experiments with three and up to six different varieties/clones were performed.
In addition, for a more throughout validation of the developed framework, we employed exactly the same supervised classification scheme initially applied on the pan-sharpened datasets (50-cm spatial resolution), on the atmospherically-corrected multispectral (2-m spatial resolution) ones. Our goal was to evaluate the effect and contribution of the pan-sharpening process and the canopy extraction procedure for the vine variety discrimination task. Generally speaking, the discrimination directly on the vine canopy is expected to result in lower classification errors by eliminating the influence of the in-between the vine rows materials. On the other hand, the pan-sharpening procedure distorts, at a greater or lesser degree, the initial reflectance values. For these classification experiments, a fine segmentation was computed on the multispectral images (scale parameter: 2; shape and compactness: 0.5), and samples were collected for each variety/clone from the same areas as in the pan-sharpened datasets. The standard NN classifier employed exactly the same features for the discrimination as in the classification of the pan-sharpened images, described in the previous paragraphs.

4. Experimental Results and Validation

In order to validate the developed framework, a comprehensive quantitative assessment was performed based on reference/ground truth data, which was produced using the available geospatial maps of varietal plantations and on data collected during multiple field campaigns, along with an intensive and laborious manual annotation procedure over all vine parcels in all study areas. It should be noted that the reference data, including the vector boundaries per vine parcel and the corresponding planted variety or clone, were available and/or created for all (100%) of the vine parcels studied. Regarding the vine canopy extraction, experimental results were validated based on manually-collected testing samples, since the annotation of every single vine row in all study areas was not practically feasible. Moreover, the proposed object-based framework was evaluated against a pixel-based support vector machine (SVM) classification scheme. In particular, recent studies targeting the classification of agricultural landscapes or different crop types [8,22,23,26,56], different tree species [60] and different vine varieties [45,46] were based on SVM classifiers with quite promising results. To this end, we employed a linear SVM classifier from the LIBSVM [61] library and performed similar experiments with exactly the same training samples as in the proposed object-based NN classification process.

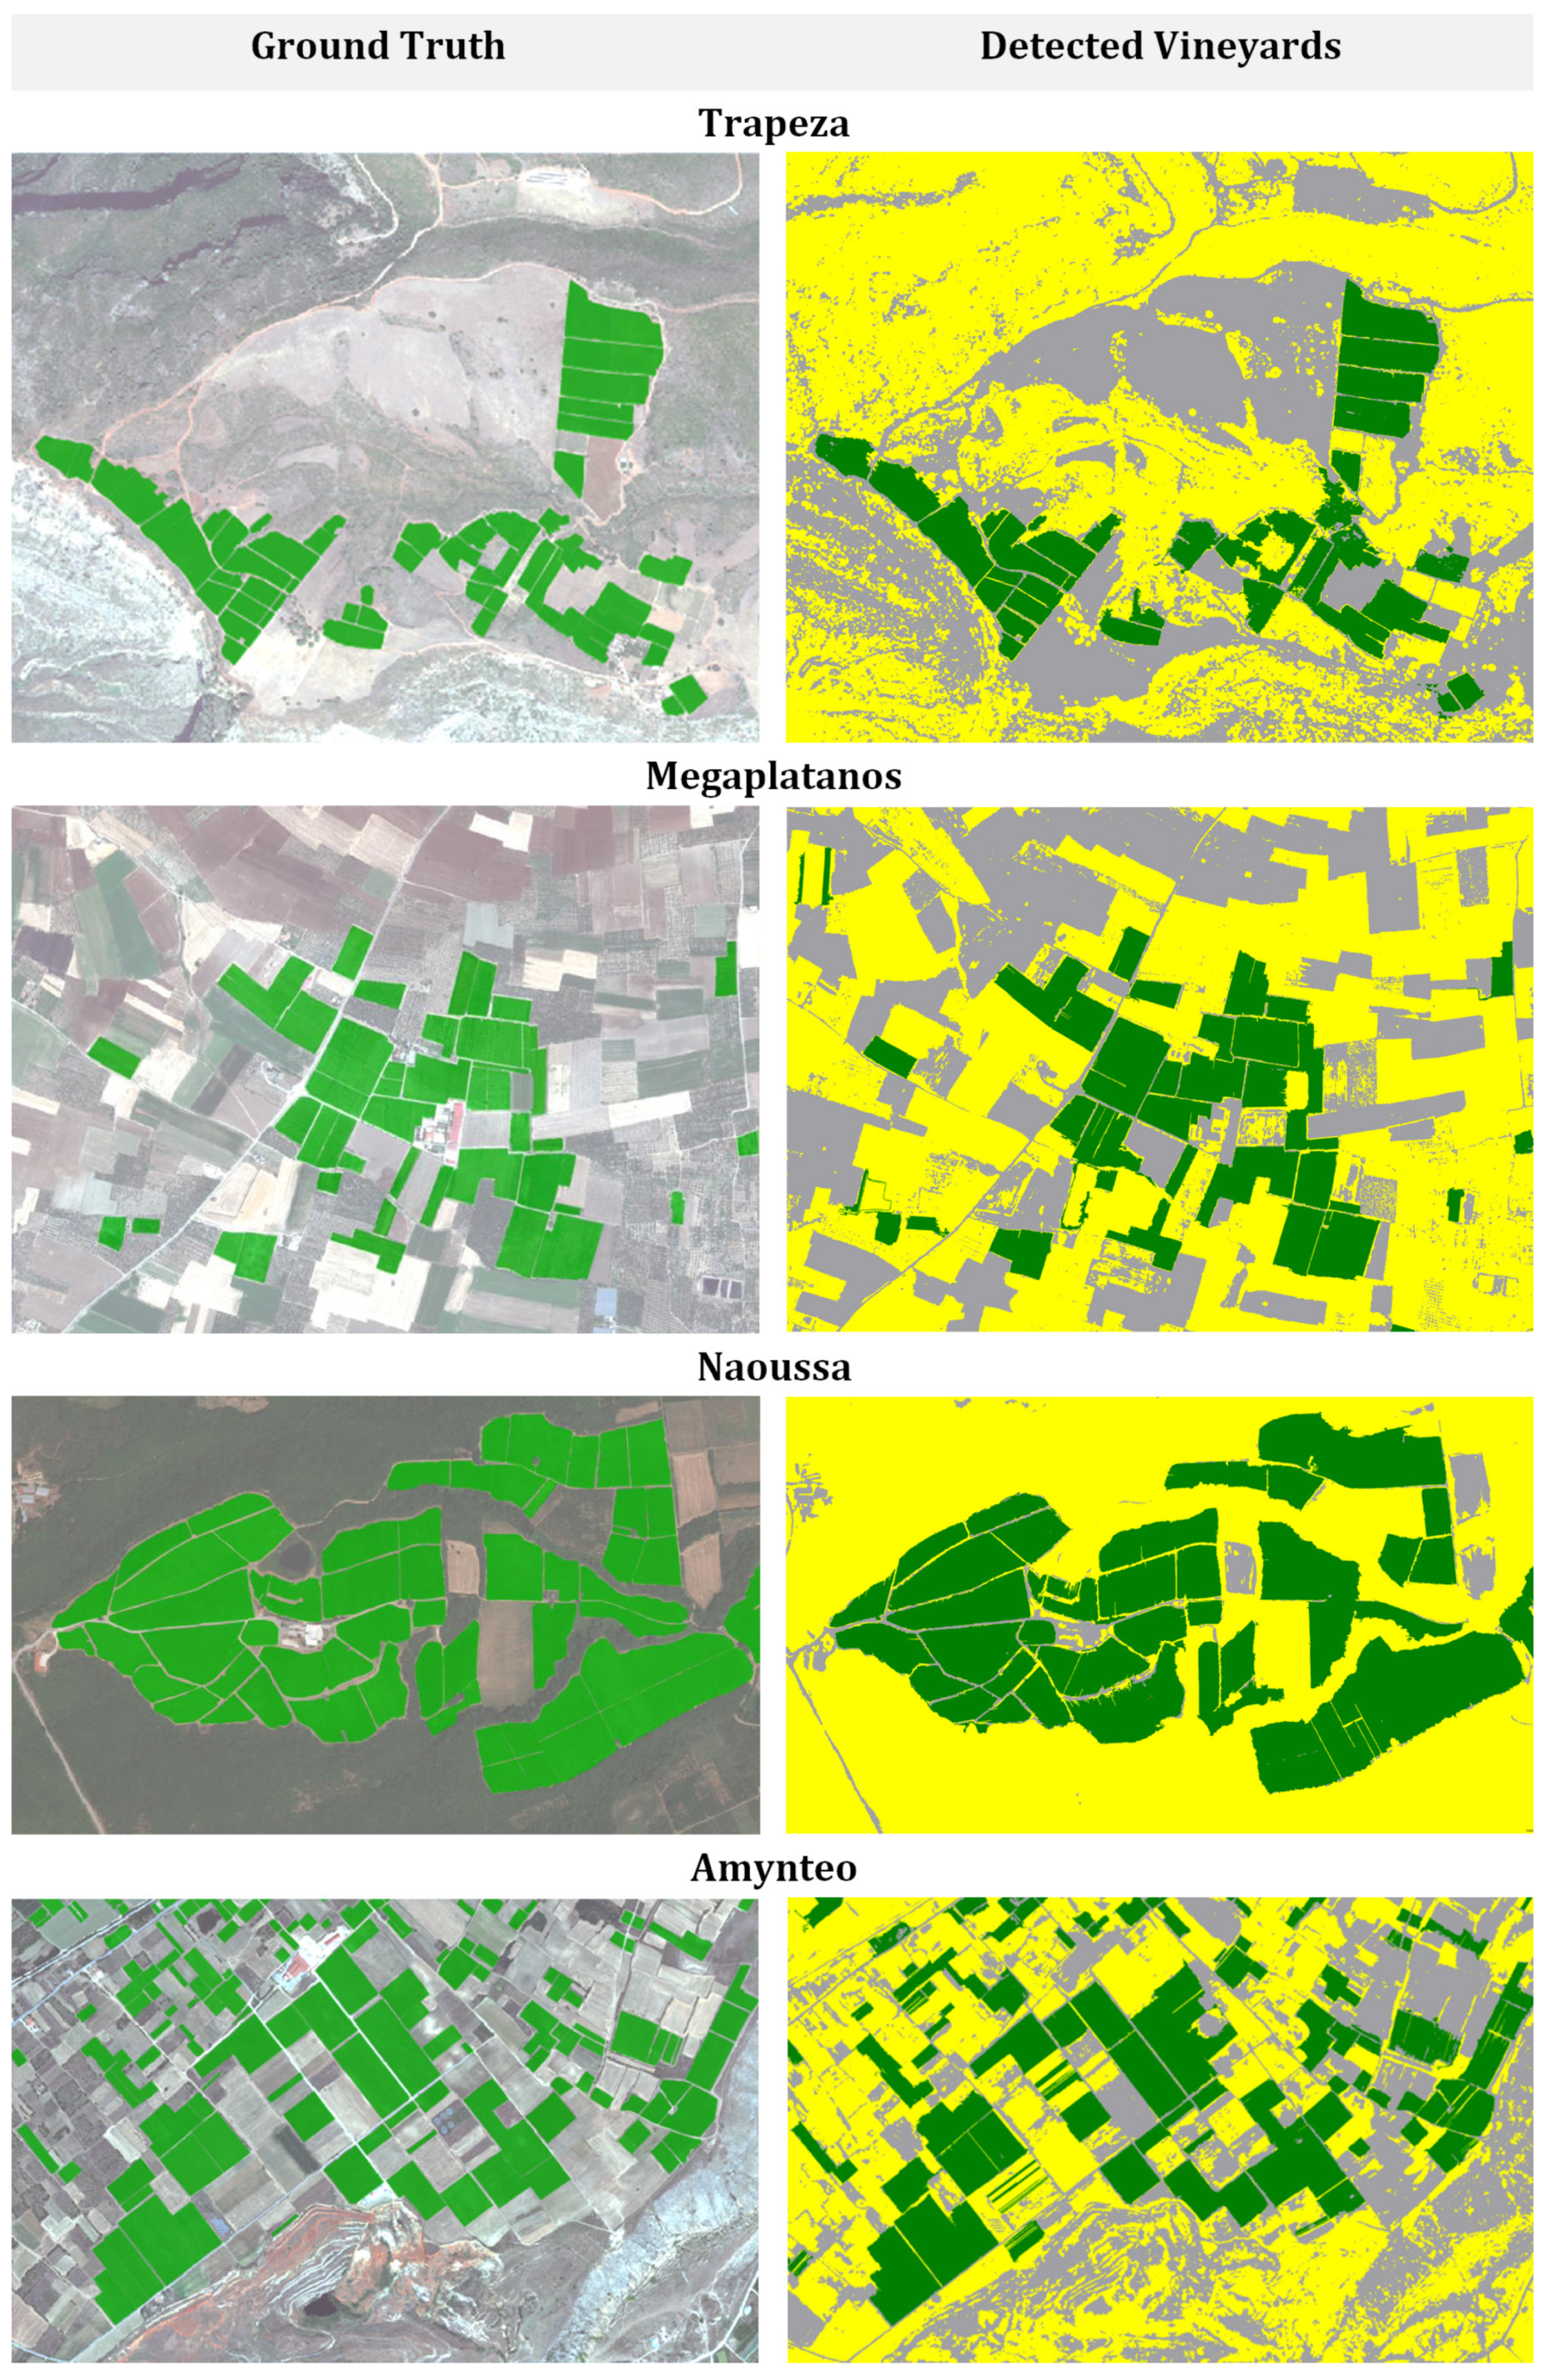
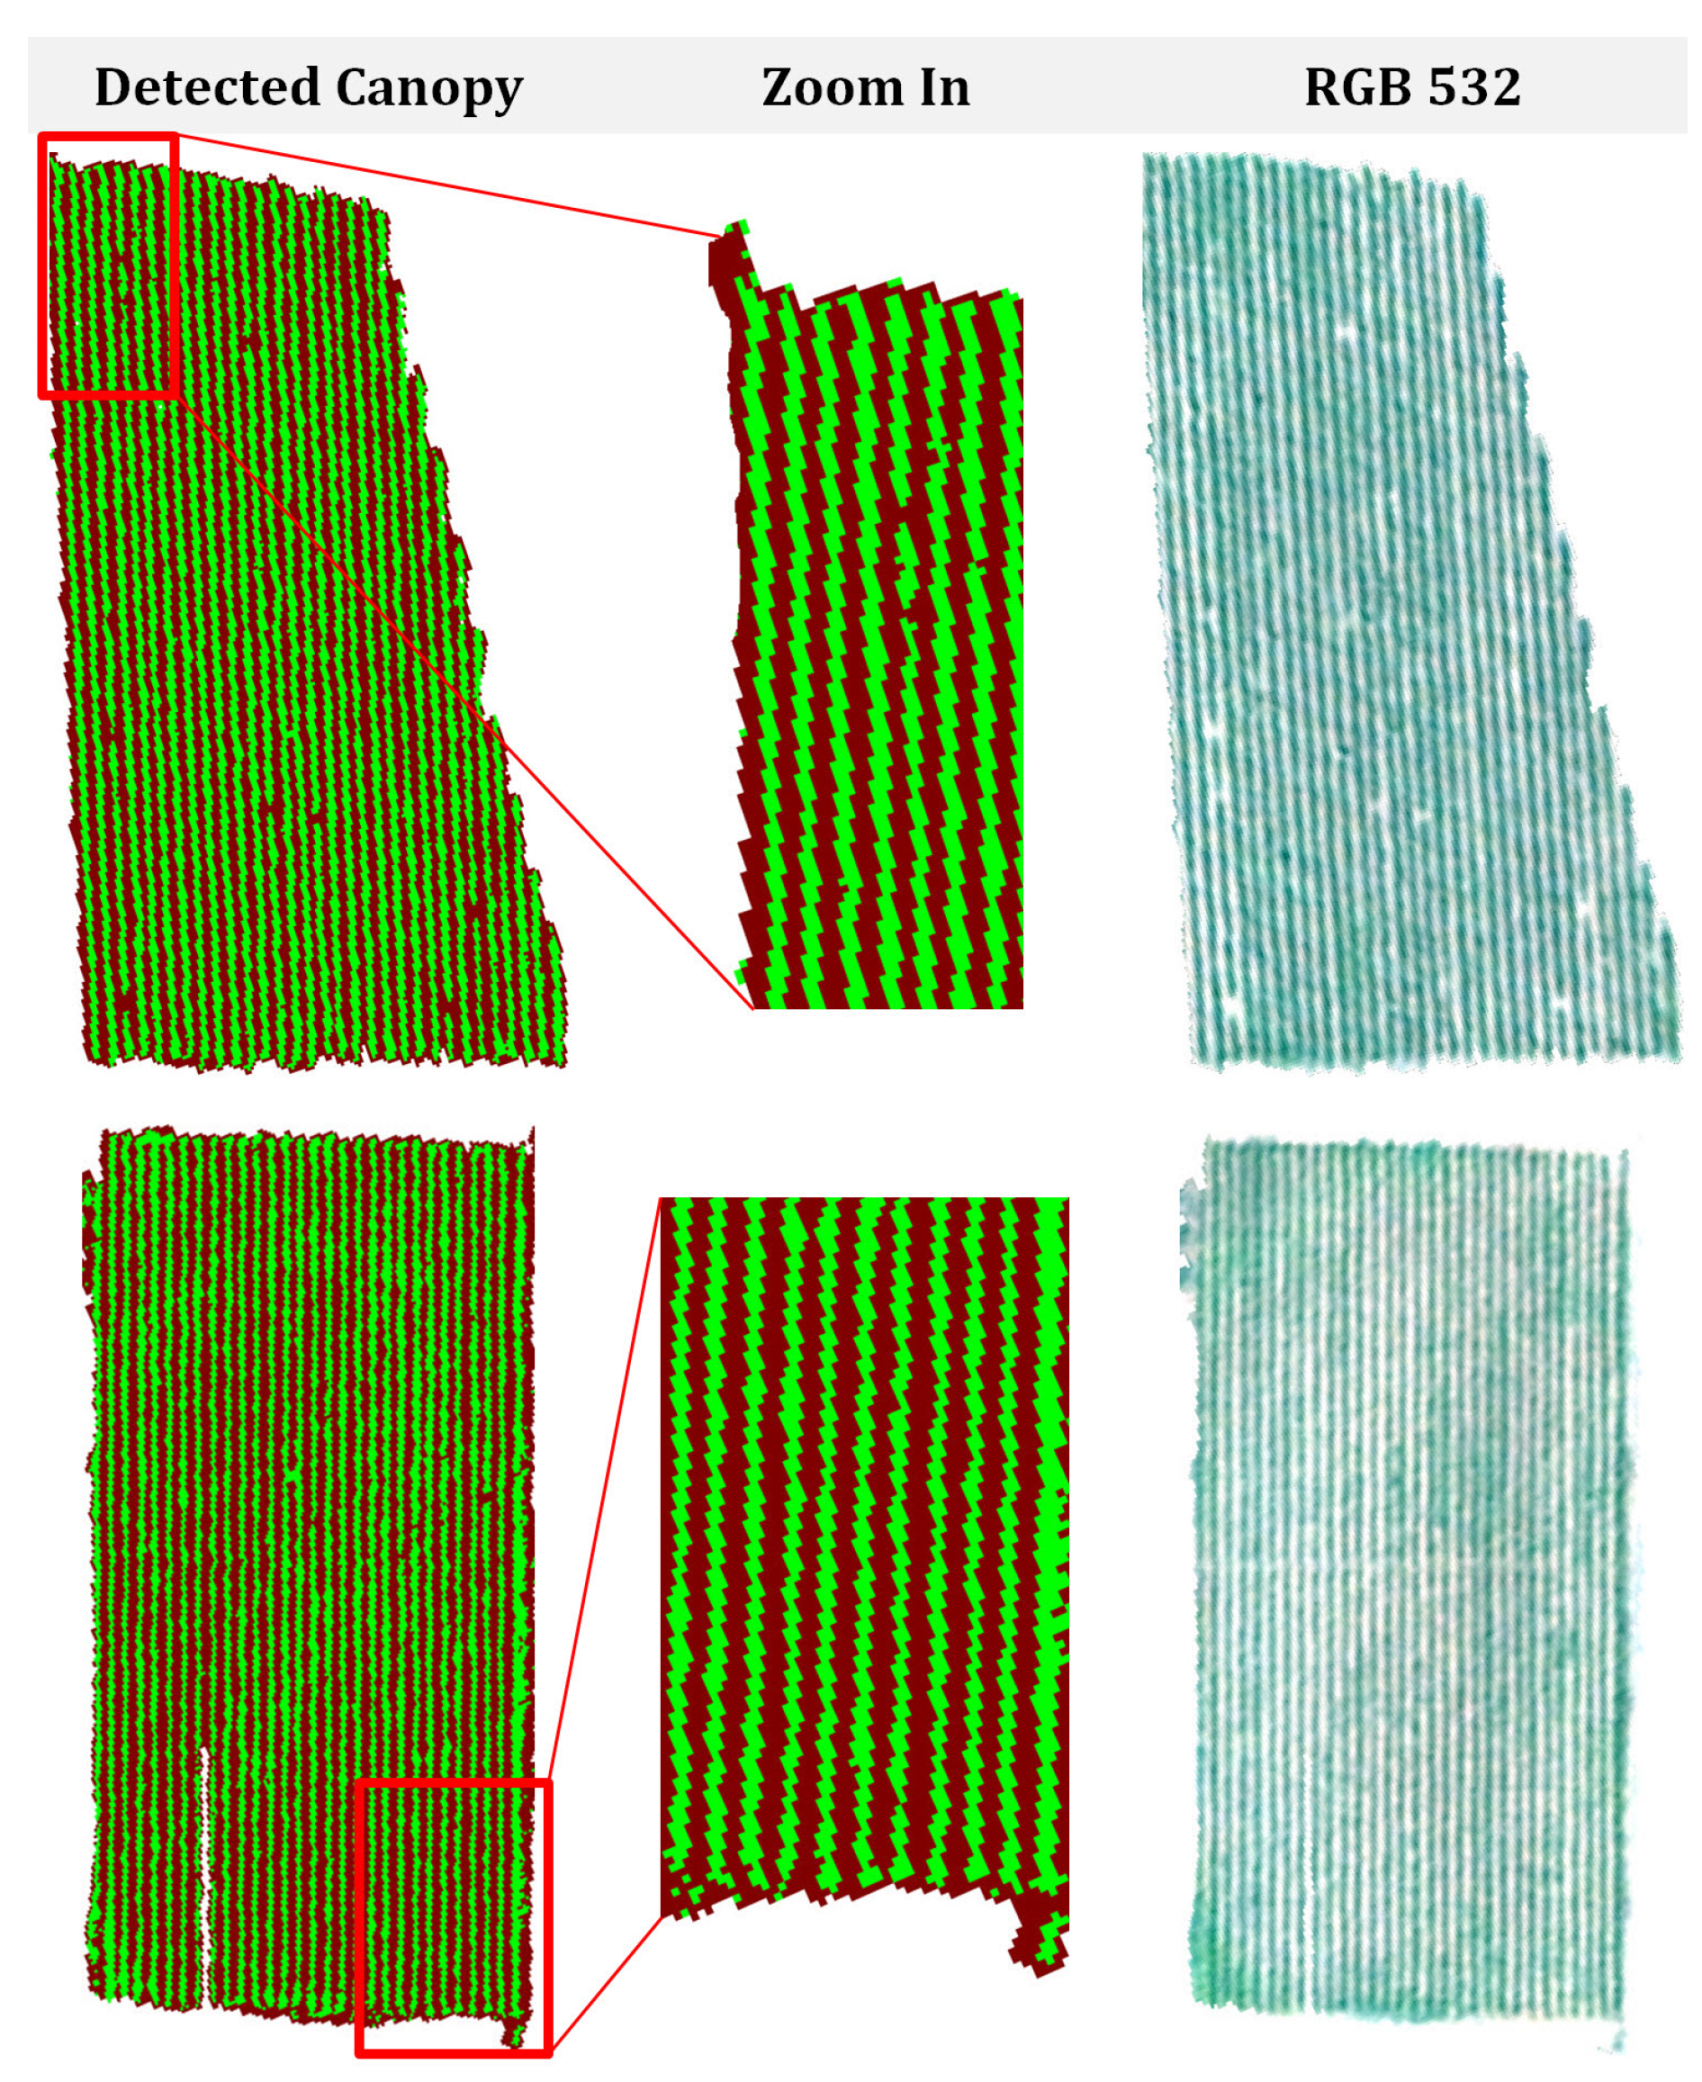
4.1. Vineyard Detection and Canopy Extraction

During the first processing step of vineyard detection, the classification procedure classified the image objects into three different classes: (i) Vineyards; (ii) Other-Vegetation types; and (iii) Non-Vegetation. In Figure 3, the resulting classification maps along with the reference/ground truth data are presented for all study areas. The detected Vineyards are shown with green color (both in the ground truth and the resulted map), the Non-Vegetation with gray color and the Other-Vegetation types with yellow color. After a close look at Figure 3, one can observe that in all study, areas the developed framework managed to detect successfully the vast majority of vineyards. Errors included the misclassification of image objects belonging to the Other-Vegetation class as Vineyards, like in the upper left region in the Megaplatanos study area, and to a lesser extent, the misclassification of image objects belonging to Vineyards as Non-Vegetation, either due to the existence of very young vine plants (i.e., less or sparser canopy) or due to stress (e.g., water, disease), which reduces the reflectance of the green and near-infrared bands.
A quantitative evaluation was performed based on the calculation of the standard metrics of completeness, correctness and overall quality [62,63] using the ground truth data, which included 100% of the vine parcels. In order to assess the accuracy metrics, the measures of true positives (TP), false positives (FP) and false negatives (FN) were calculated:
C o m p l e t e n e s s = a r e a   o f   c o r r e c t l y     d e t e c t e d   o b j e c t s   a s   V i n e y a r d s   ( T P ) a r e a   o f   t h e   g r o u n d   t r u t h   ( T P   +   F N )
C o r r e c t n e s s = a r e a   o f   c o r r e c t l y   d e t e c t e d   o b j e c t s   a s   V i n e y a r d s   ( T P ) a r e a   o f   a l l   o b j e c t s   d e t e c t e d   a s   V i n e y a r d s   ( T P + F P )
O v e r   a l l   Q u a l i t y = T P T P + F P + F N
The quantitative evaluation indicated that the developed methodology resulted in high levels of accuracy in all study areas. More specifically, in all cases, the detection completeness and correctness was above 89% with an average at 93% and 92%, respectively (Table 2).
During the next processing step, the canopy of the detected vineyards was extracted, based on the developed object-based procedure described in Section 3.2. In Figure 4, examples of the detected canopy are shown. In particular, the detected canopy is shown with a green color and the other materials (e.g., soil) in-between the rows with brown. After a closer look, one can observe that the employed features managed to separate the vine canopy from the other parts effectively, although the materials in between the rows presented significant spectral variations, as can be observed in the corresponding natural color composites. Certain parts are covered with just soil and present relatively high brightness values, while other regions present darker intensities and colors. The quantitative validation was performed based on a sampling set of objects as test area (TTA) masks. The TTA area varied from 0.01% to 0.02% of the total area classified. The calculated producer, user and overall accuracy (Table 3) indicated high rates of above 96% for all datasets.

Canopy Extraction Using a Pixel-Based Linear SVM

By employing exactly the same training and testing samples, vine canopy extraction was, also, performed using a pixel-based linear SVM classifier. The features used for the SVM classification were the eight spectral bands of the WV-2 data and the NDVI. Quantitative results are presented in Table 3 along with the corresponding ones from the proposed framework. The object-based framework resulted in higher accuracy rates regarding the average of all three metrics. In particular, OA reached 98.2% (object-based NN) compared to the 95.9% from the pixel-based SVM (Table 3). Generally speaking, however, one can observe that both classification schemes delivered high accuracy rates, i.e., the calculated producer, user and overall accuracy rates were above 88.0% in all cases. Although SVM can be consider a more efficient classifier, the object-based framework managed to deliver slightly better results mainly due to (i) the process at the object level, which can to a certain extent address the within-field variability; and (ii) the employed spatial features, which express the spectral relations between a specific image object and its neighbor ones. In particular, these spatial features were crucial, as they exploited the alternation between the foliage and the in-between the rows materials.

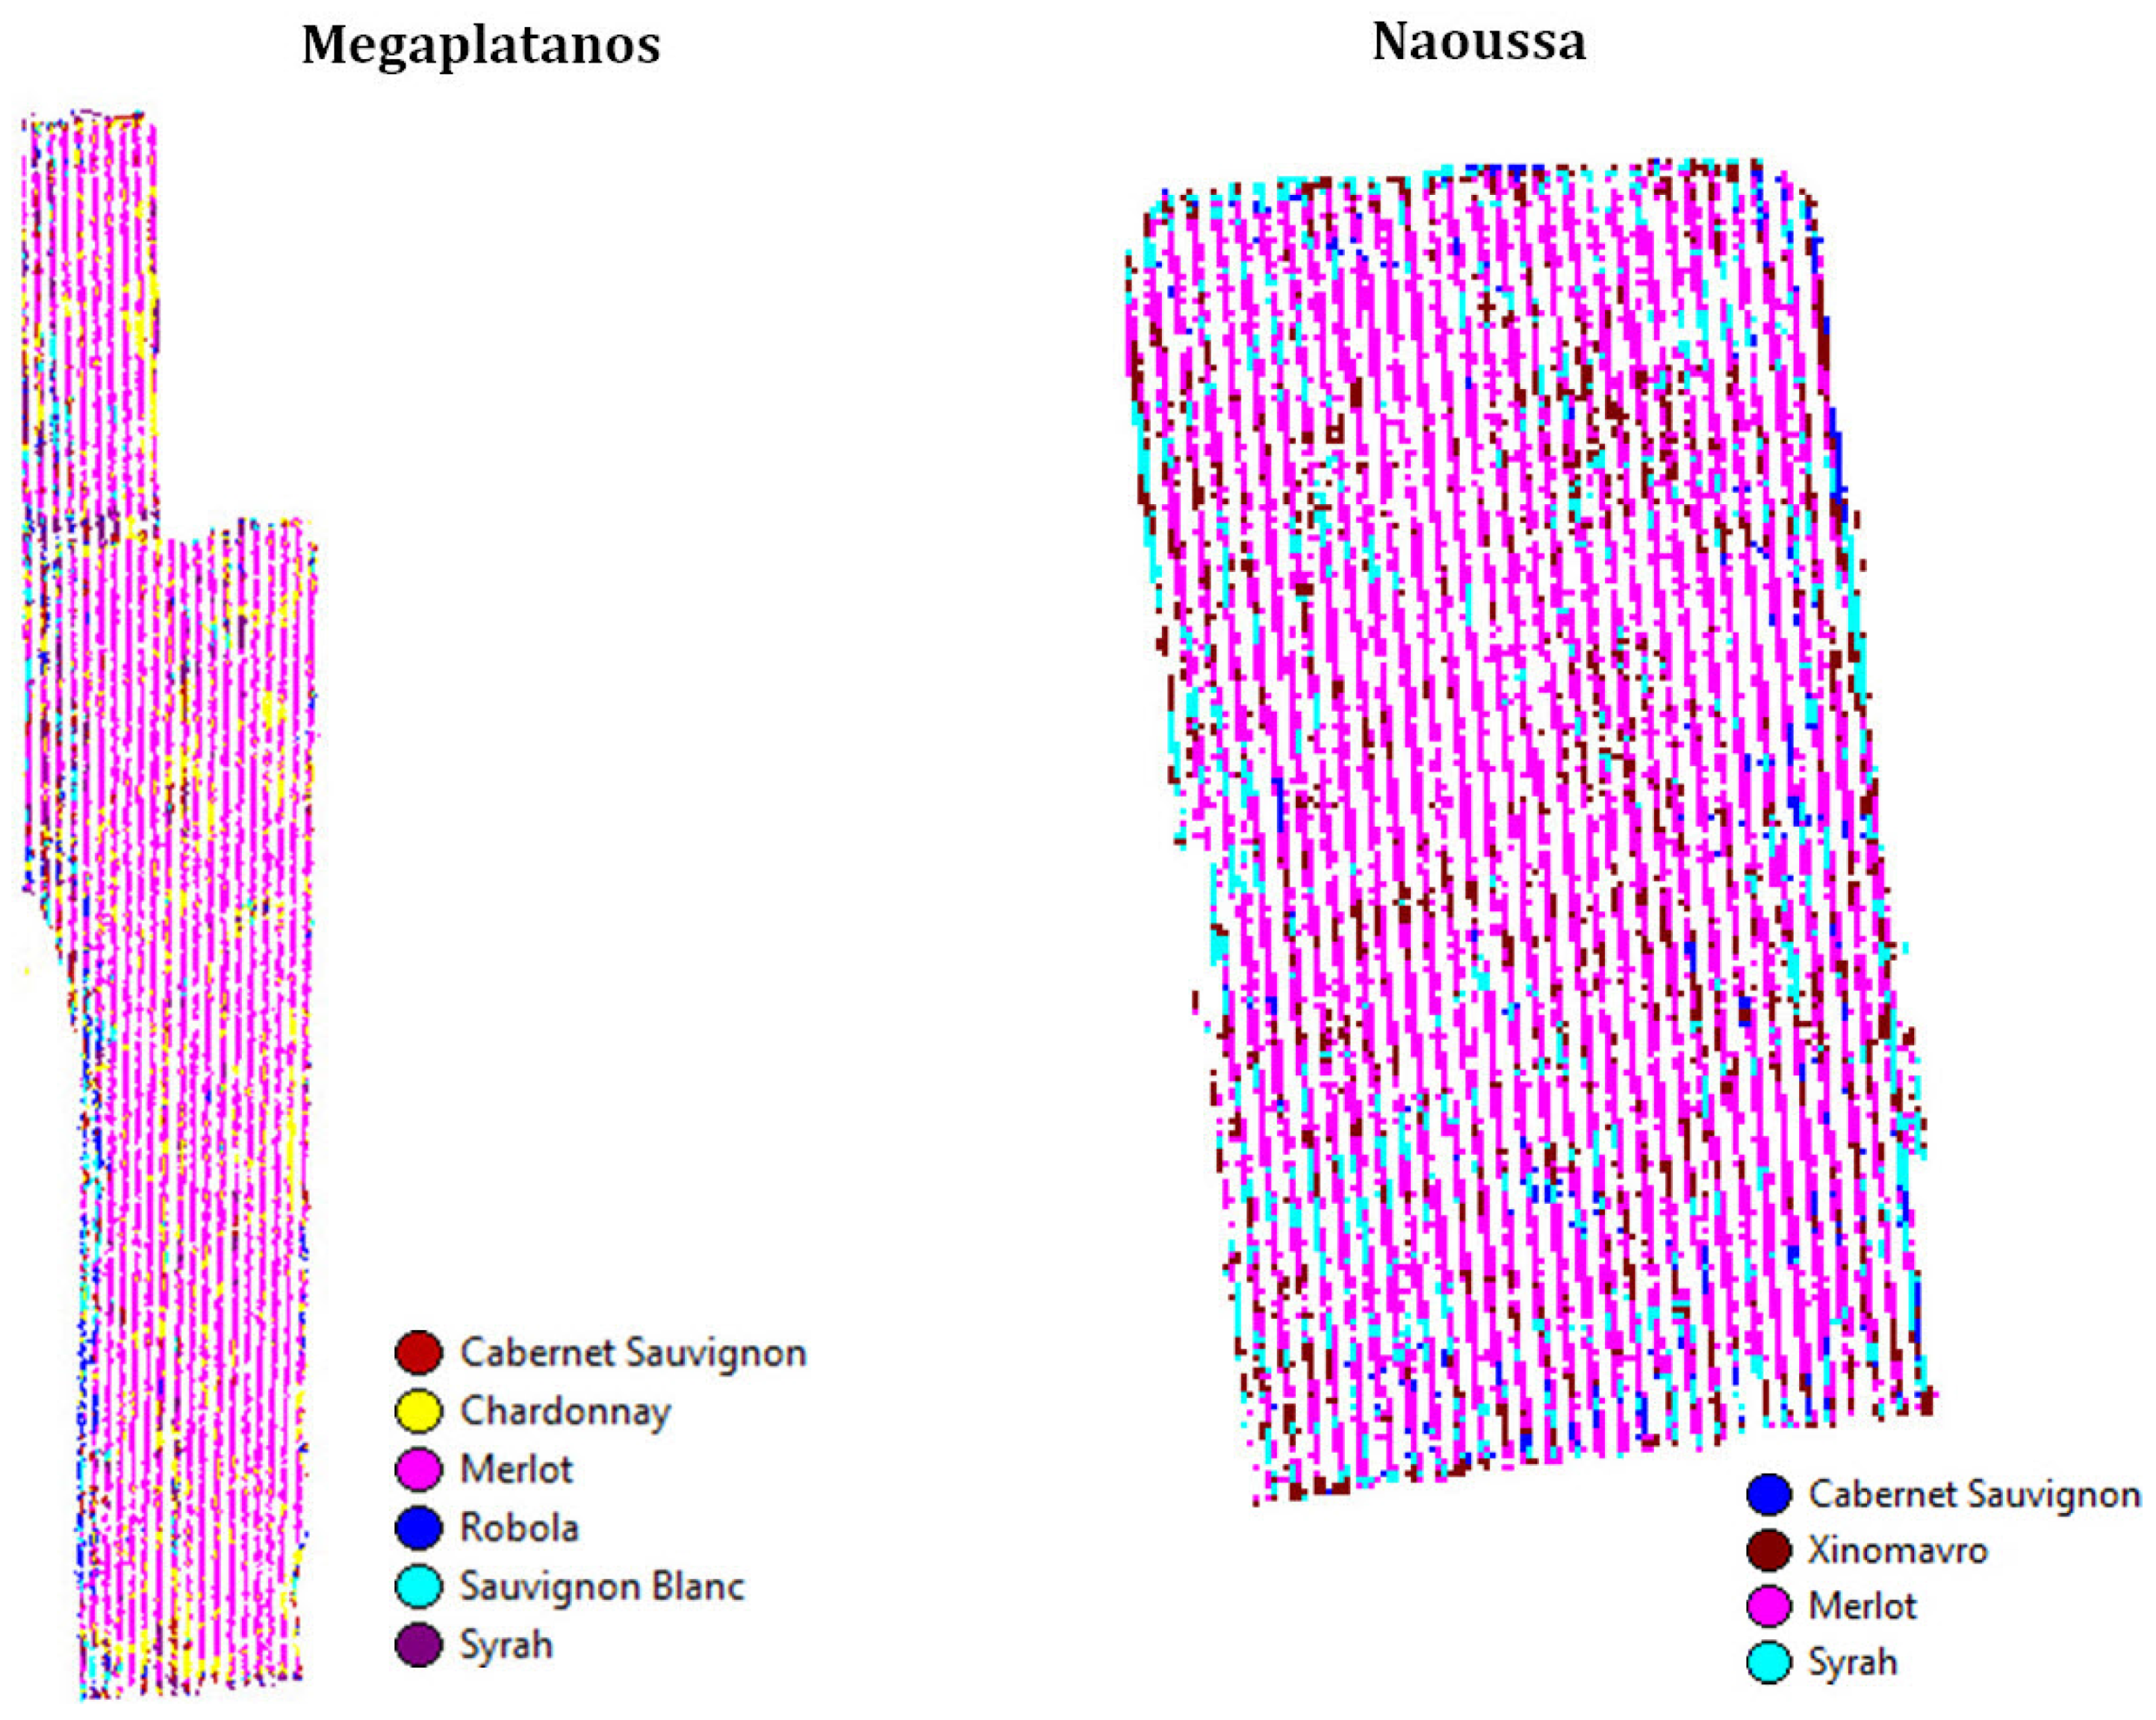
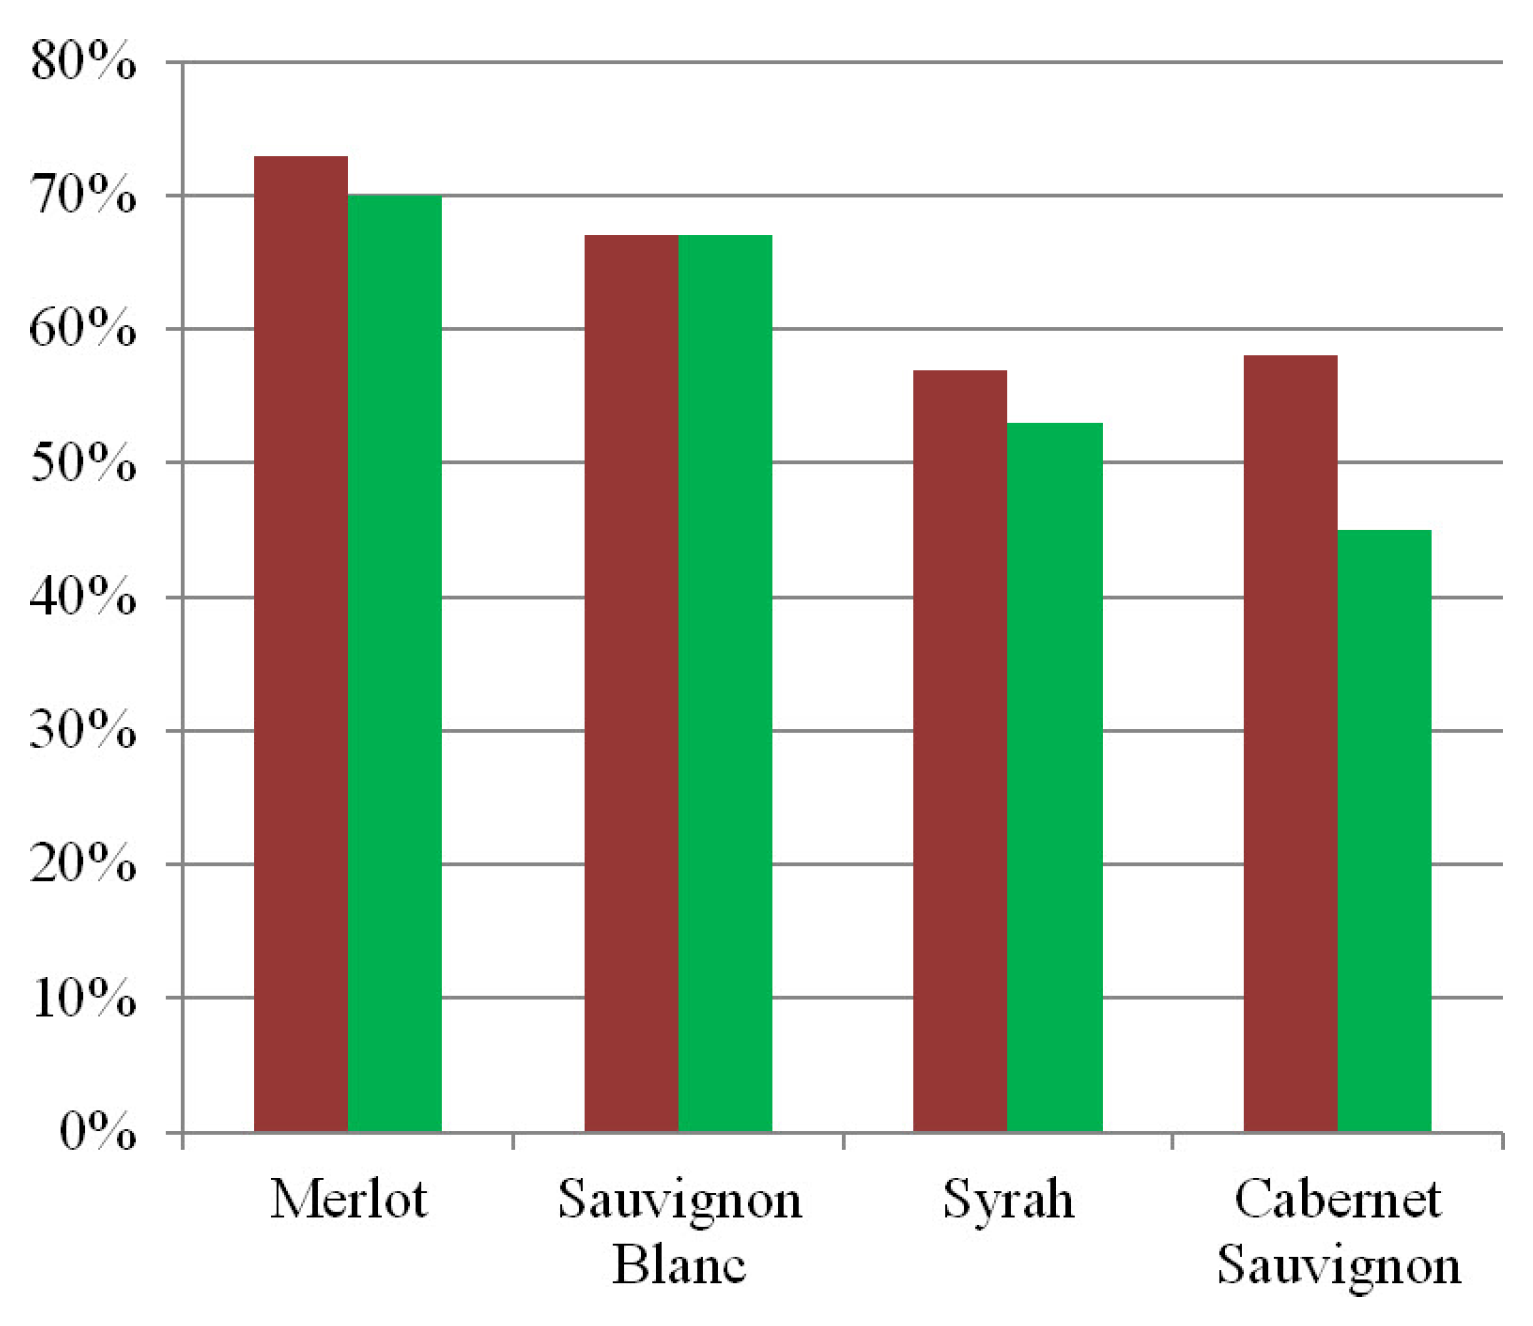
4.2. Vine Variety Discrimination

For the validation of the developed vine variety discrimination framework, several experiments were performed with attempts to discriminate 3, 4, 5 and 6 different varieties/clones per experiment. The same experiments were performed both on the atmospherically-corrected multispectral (2-m resolution) and the pan-sharpened (50-cm resolution, at the extracted canopy) data. A quantitative evaluation was performed based on the reference/ground truth (GT) data, which contained 100% of the vine parcels studied. The quantitative evaluation was calculated at the pixel level, based on the calculated confusion matrices between the classification maps and the GT. For an easier interpretation of the results, the number of classified pixels for each class/variety on the confusion matrices was expressed as a percentage on the GT pixels of the corresponding variety. Thus, the diagonal of the matrix expressed the producer accuracy (PA) for each variety. The evaluation of the second step of the discrimination experiments, after the post-classification majority voting process, was performed at the parcel level.
Table 4 presents the overall accuracy (OA) rates after the validation of the developed vine variety discrimination framework on both multispectral and pan-sharpened datasets. The quantitative evaluation indicated that the variety discrimination was performed with high OA rates at the parcel level (i.e., above 83%). In particular, the vast majority of parcels were associated with the correct variety in all of our experiments. It is also worth mentioning that the vine variety discrimination on the pan-sharpened (50-cm resolution) and the multispectral (2-m resolution) data resulted in similar OA rates, presenting both an average at 96%. At the pixel level, five out of 10 experiments indicated higher OA rates on the multispectral datasets, i.e., average OA of 61%, in contrast to an average OA of 56% for the pan-sharpened ones. Generally speaking, the important spectral correlation among different vine varieties/clones and, thus, the difficulty that the classifier confronts, either based on the detected canopy (pan-sharpened data) or the multispectral data, are apparent, since the higher OA classification rate reached a 75% maximum (Table 4, Trapeza study area, experiment with four varieties). The lower rate at the pixel level was 38% (Megaplatanos, experiment with six varieties on the pan-sharpened image), while as expected, the higher the number of competing varieties, the lower the classification rates in most cases. In the following sub-sections, these results are further analyzed and assessed for each study area based on the quantitative evaluation, the vine variety misclassification cases and the study of the spectral signatures of the in situ reflectance from the portable spectroradiometer.
Trapeza study area: In the study area of Trapeza, six different vine varieties and clones (i.e., Merlot, Riesling, Sauvignon Blanc Clone I, Sauvignon Blanc Clone II, Syrah Clone I and Syrah Clone II) took part in the discrimination procedures. Various experiments with four, five and six varieties were performed. The quantitative evaluation on both datasets (pan-sharpened at 50 cm, multispectral at 2 m) resulted in the same quantitative OA rates (Table 4). In all cases, the correct vine variety was assigned to the corresponding parcels (i.e., 100% OA at the parcel level).
In Figure 5, experimental results after the application of the developed discrimination framework in the Trapeza study area are presented. The resulting classification maps based on the multispectral data (Figure 5, top left) and the ground truth data (Figure 5, top right) are shown. Two vine parcels with Sauvignon Blanc Clone I (Figure 5, bottom left) and Sauvignon Blanc Clone II (Figure 5, bottom right) on the pan-sharpened image are also presented. After a close look, one can observe that for the multispectral data, most objects of Merlot, Sauvignon Blanc (both clones) and Syrah Clone I have been correctly classified. The two parcels with Sauvignon Blanc Clone I and Sauvignon Blanc Clone II in the bottom of Figure 5 demonstrate a typical example of correctly-detected varieties. In this particular area, vineyards with Riesling and Syrah Clone II were the ones presenting many misclassified objects.
The above observations can be also verified by the corresponding confusion matrices presented in Table 5. In particular, for the experiments on the multispectral data (Table 5, top) Sauvignon Blanc Clone II, Sauvignon Blanc Clone I, Syrah Clone I and Merlot presented higher PA rates (above 65%), while Riesling and Syrah Clone II were lower, i.e., below 50%. In a similar way, classification experiments on the detected canopy (pan-sharpened data, Table 5, bottom) indicated the same OA performance, with Sauvignon Blanc (both clones) and Merlot achieving the highest PA rates. It should be noted that after the per-parcel majority voting, the discrimination procedure managed to associate all vine parcels with the correct varieties, even for the varieties that presented low classification rates, e.g., Riesling and Syrah Clone II. To sum up, based on all of the experiments performed in the Trapeza study area, Merlot and both Sauvignon Blanc clones presented a distinguishable behavior with high PA rates. It is also important to mention that in between the two different clones of Sauvignon Blanc and Syrah, relatively low classification errors (<15%) were reported.
The aforementioned results were compared to the spectral signatures of the in situ reflectance from the portable spectroradiometer. All varieties presented discrete differences beyond 750 nm (Figure 6, top left). In particular, the average reflectance indicated that the canopy of the Merlot vines differed from all others, since it presented the highest reflectance values across the spectrum. This particular variety presented high PA rates on the performed classification experiments as well (Table 5). The Sauvignon Blanc I and the Syrah I varieties presented relatively lower reflectance levels. Riesling also presented discrete differences compared to the other varieties and the lowest values at the NIR. However, on the image classification experiments, Riesling resulted in having generally low PA rates.
Megaplatanos study area: In the Megaplatanos study area, six different vine varieties, namely Sauvignon Blanc, Syrah, Chardonnay, Merlot, Robola and Cabernet Sauvignon, took part in the experiments. Four, five and six different varieties were employed under the same discrimination procedure on both datasets. In general, the PA rates for each variety were higher for the classification on the multispectral image. As in the Trapeza study area, Merlot was among the most separable varieties, presenting the highest PA rates at the pixel level, of above 86% in the multispectral dataset and over 75% in the pan-sharpened data.
A typical example is presented in Figure 7 (left) for a Merlot parcel, where most of the image objects were correctly classified as class Merlot during an experiment with six competing varieties on the pan-sharpened image. Moreover, in this study area, Syrah and Sauvignon Blanc were, also, classified with relatively high PA rates, while both of them presented misclassifications mainly as Cabernet Sauvignon with rates from 15% to 30%. Chardonnay vines were mainly confused with the Cabernet Sauvignon, the Sauvignon Blanc and the Robola varieties. Among all, Robola presented the lowest PA rates (<45%) in all performed experiments. The discrimination rates (OA > 92%) for the parcel-based evaluation indicated that the vast majority of parcels was correctly labeled, apart from few Robola and Cabernet Sauvignon parcels.
The in situ reflectance data indicated that the Robola vine canopy possessed the lowest reflectance levels compared to the other varieties in both the visible and the NIR spectrum (Figure 6, top right). This characteristic, apparently, was not exploited by the classifier or the proximate observations over the Robola canopy could not simulate their spatial and spectral characteristics as they were recorded by the satellite sensor. Moreover, Syrah presented the highest reflectance values, while Sauvignon Blanc, Cabernet Sauvignon and Chardonnay presented similar reflectance values, which was also reported by their misclassification rates during the classification experiments. The spectral signature of Merlot followed a relatively different pattern across the spectrum and, in particular, in regions between 380 to 500 nm and 800 to 1000 nm. This was also in accordance with the results from the classification experiments, as Merlot resulted in being the most distinguishable variety during the discrimination procedures.
Naoussa study area: In the study area of Naoussa, four different vine varieties (i.e., Syrah, Merlot, Cabernet Sauvignon and Xinomavro) producing red wine took part in the experiments towards the discrimination of three or four different vine varieties each time. The quantitative evaluation (Table 4) indicated that the discrimination experiments in this study area resulted in having lower OA rates compared to the other three. The classification evaluation resulted in OA rates from 50% to 59%, while the discrimination task at the parcel level reached OA rates from 83% to 91%.
In general several misclassification errors were reported in all experiments. The PA rates for the variety classification were slightly higher for the pan-sharpened data. Again, the Merlot variety achieved the highest PA rates compared to the other varieties. A typical example is presented in Figure 7 (right) with the resulting classification map calculated on the detected canopy (pan-sharpened data) during an experiment with four competing varieties. Here, most objects have been correctly classified as Merlot with a relatively small number of errors. In all experiments performed, Xinomavro reported several misclassification errors, mixing with all of the other varieties, with rates of 11% to 26% at the pixel level. Cabernet Sauvignon and Syrah appeared correlated (with mixing rates of about 20%), while both varieties presented misclassification errors to Merlot (20% to 25%). Due to these increased misclassification errors, the final result after the majority voting processing step presented some wrongly labeled parcels, concerning mainly the Cabernet Sauvignon and the Xinomavro varieties. However, the majority of parcels were correctly labeled in all cases, and the OA rates at parcel level stayed above 83%.
In the Naoussa study area, the in situ canopy reflectance was obtained for the Merlot, Xinomavro and Cabernet Sauvignon varieties. In general, the reflectance levels were relatively lower than those in the other three study areas (Figure 6, bottom left). In particular, the spectral signatures indicated only slight differences mainly in the NIR region (after 740 nm). Cabernet Sauvignon presented slightly higher reflectance levels, while Merlot and Xinomavro presented high similarity in their reflectance values.
Amynteo study area: In the Amynteo study area, four vine varieties and clones, namely Tannat, Montepulciano, Syrah Clone I and Syrah Clone II, took part in the discrimination experiments. Classification procedures were employed for the discrimination between three and four varieties per time. Although, the OA from the classification step presented relatively low rates, the final discrimination at the parcel level was 100% accurate in all cases.
In particular, between the two Syrah clones, the confused by the classifier pixels were relatively low, with about 15% being confused on the multispectral dataset and 22% on the pan-sharpened one. Syrah Clone I presented mixings, of rates between 22% and 36%, with Montepulciano. During the classification experiment between four competing varieties, Tannat was significantly confused (42%) with Syrah Clone II on the multispectral data, but still class Tannat gained the majority of the pixels with a 43% percentage. In a similar way, Tannat was confused with Syrah Clone II and Syrah Clone I, on the pan-sharpened data, but with relatively lower rates at 28% and 18%, respectively. In Figure 8, the resulting classification map is shown for an experiment on the multispectral dataset with four different varieties/clones in the Amynteo study area. After a closer look, one can observe that all parcels present many classification errors, while about half of Tannat parcel objects appear to be classified as Syrah Clone II.
The analysis of the in situ reflectance indicated that all varieties presented discrete differences beyond 750 nm (Figure 6, bottom right). Tannat was the variety with the highest reflectance levels followed by Syrah and Montepulciano. Although for Tannat, the average in situ reflectance in both the visible and NIR spectrum stayed consistently at higher levels, differing from the two other, during the classification procedures class Tannat resulted in numerous misclassification errors. As in the previous case studies, the classifier and employed features did not manage to model this difference or the canopy in situ reflectance for Tannat could not be observed at the particular spatial scale of WV-2. Syrah and Montepulciano possessed similar reflectance values before 730 nm, while in the classification procedures, Syrah Clone I presented many misclassification errors with Montepulciano.

Variety Discrimination Using a Pixel-Based Linear SVM

The same experiments were also conducted using a pixel-based linear SVM classifier and exactly the same training samples. The features used for the pixel-based SVM framework included the eight WV-2 spectral bands, the NDVI and four band ratios, i.e., NIR1/red, NIR2/red, NIR1/blue, NIR2/blue, that had been also employed in the object-based NN framework. Quantitative results from the performed experiments are presented in Table 6 comparing the outcome from both the proposed object-based NN and pixel-based SVM framework. As has been already mentioned, the quantitative evaluation was performed based on reference data, including 100% of the vine parcels studied. In a similar way as in Table 4, the evaluation was performed at the pixel level (after the NN or the SVM classifier) and at the parcel level (after the majority voting process). Results indicated that the object-based framework outperformed the pixel-based SVM one, both at the pixel and the parcel level. In particular, after majority voting, the proposed object-based approach managed to score above 90% regarding the average OA rates. The difference in the calculated average OA at the pixel level was lower than 10%. These results are in accordance with similar studies that report on the successful application of object-based frameworks for crop type [9,24,26,27] or vegetation/tree species [1,3,4] classification. Classifying (even with a relatively small size of foliage segments) canopy objects instead of pixels can provide a more compact representation regarding the distinctive properties between different varieties/classes that a classifier searches for decision making. Thus, misclassification errors at the pixel level potentially caused due to the within-field variability can be tackled to a certain extent through object-based approaches.

5. Discussion

Regarding the vineyard detection task, results reached high completeness (average at 93%) and correctness (average at 92%) rates, based on the experiments from all datasets in different viticultural zones and terroirs (covering more than 1200 ha) with more than 20 vine varieties/clones and reference/ground truth data containing 100% of all vineyards in the study areas. These quantitative results are similar or better than those that have been reported in the literature [8,9,23,24,28,30] for vineyards or similar crop detection studies. It should be also noted that in the EU (in particular, in Greece), the terroirs are significantly smaller in size, usually covering non-flat viticulture regions with highly complex terrain, and thus, their detection is significantly more challenging than, e.g., in Australia, California, Chile. Moreover, the vine planting density worldwide is pretty much standard based mainly on the commercial agriculture machinery/tractors, and therefore, the textural features that map their pattern at this particular spatial resolution are expected to work equally effectively in different terroirs.
Regarding the spatial resolution of the employed satellite data, the quantitative results previously mentioned in Section 4 highlighted certain points for further discussion. Firstly, for the vineyard detection task, the pan-sharpening processing step (delivering a 50-cm spatial resolution) was absolutely required since, along with the spectral, the textural features managed to adequately describe the linear planting pattern, resulting in high detection rates. Therefore, the spatial resolution of the data during the vineyard detection step is critical. However, the pan-sharpening procedure affects the reflectance values of the initial lower resolution (2 m) multispectral bands due mainly to the applied bilinear interpolation and employed edge maps.
The performed quantitative evaluation (Table 4) showed that the pan-sharpening procedure did not impede the variety discrimination OA rates, implying that the radiometric shift (due to the pan-sharpening) did not alter or smooth the distinctive properties of the initial 2D signal (reflectance values of the multispectral bands). In particular, although the evaluation at the pixel level (after the supervised classification) resulted in slightly higher OA rates at the coarser (2-m spatial resolution) multispectral datasets (61% the average OA; Table 4), the final discrimination results at the parcel level (after the majority voting) delivered similar quantitative rates on both datasets (96% the average OA; Table 4). Therefore, one can claim that since the pan-sharpening significantly contributed to the vineyard detection task and did not have a negative impact on the discrimination procedure, then it should be included in the processing chain of the same or similar applications.
Moreover, the comparison of the proposed object-based framework with the pixel-based SVM one indicated that for both tasks of canopy extraction and variety discrimination, the classification of objects (even with a relatively small size) delivered higher accuracy rates during experiments using similar features and the same training and testing samples. This is, also, in accordance with similar studies [3,4,9,24,26,27] suggesting that one would expect lower misclassification errors when classifying foliage segments than single pixels with high and very high resolution satellite data.
Furthermore, regarding the vine variety discrimination, the developed framework delivered similar or better OA rates compared to similar studies, which employed airborne hyperspectral data and conducted experiments towards the separation of two competing varieties [44,45,46]. One should, furthermore, note the low percentage of samples that were required during the canopy extraction (less than 0.03% of all objects to be classified) and the variety discrimination (less than 1% of the GT for each variety) procedures. This difference appears normal considering the difficulty of each problem. Moreover, for the samples’ selection, we did experiments by randomly selecting different groups of samples during the training procedure, both for canopy extraction and variety discrimination. However, the overall accuracy rates were similar, and their difference was lower than 1% at the pixel level.
It is worth mentioning here that the experimental results are based on satellite data acquired around the veraison period, and therefore, the performance of the proposed framework in the beginning of the growth cycle or near its end has not been evaluated. However, veraison is considered the optimal period for data acquisition when addressing such vine/variety detection tasks, since the plant reaches a stable state regarding the development of the foliage/canopy, spending the next period on fruit ripening.
Last, but not least, through the analysis of the quantitative results from the variety classification, certain aspects were highlighted regarding the spectral behavior of the studied varieties. Merlot was the variety that achieved the highest PA rates (Figure 9) in the classification experiments. Sauvignon Blanc presented in most cases a distinguishable behavior and scored in average PA rates above 65% at the pixel level (Figure 9). Syrah generally resulted in medium PA rates and, in most cases, was discriminated from the other varieties. Moreover, the two studied clones (I and II) of Syrah were not much confused between each other, as the experiments in both Trapeza and Amynteo indicated. Furthermore, Cabernet Sauvignon presented differences (>10%) in PA rates at the pixel level between the coarser multispectral and the pan-sharpened data (Figure 9). Robola and Riesling were the varieties that in all our experiments resulted in lower PA rates. In general, classification errors largely depend on the specific varieties that are competing during the classification. If these varieties do not possess any distinctive features across the spectrum, then even under a binary classification problem, the errors will be significant.

6. Conclusions

In this study, an object-based framework was developed that is able to detect vineyards, extract vine canopy and discriminate several varieties from very high resolution satellite data. For the validation of the developed framework, intensive experiments were carried out, employing WorldView-2 data over four viticulture regions in Greece, along with concurrent in situ canopy reflectance observations from a portable spectroradiometer. The performed quantitative evaluation indicated that the developed approach managed in all cases to detect vineyards with high completeness and correctness rates (above 89%) on the pan-sharpened imagery. The vine canopy extraction methodology was validated with OA rates of above 96%. The various experiments for the discrimination of vine varieties, i.e., discriminating between three, four, five and six competing varieties/clones, indicated that at the parcel level the OA rates were in all study areas above 85% (average at 96%; Table 4). The comparison between the proposed object-based framework and a pixel-based one, applying a linear SVM classifier, indicated that both for the canopy extraction and the variety discrimination, the object-based approach resulted in lower misclassification errors. Last, but not least, the observations concerning the spectral characteristics and behavior of the different varieties during the classification experiments on the satellite data were in most cases in agreement with the analysis of the in situ reflectance data and the derived spectral signatures. In particular, this combined study indicated that certain vine varieties, like Merlot and Sauvignon Blanc, possess distinct spectral properties and distinguishable behavior. The overall validation and quite promising experimental results indicate that a thorough per-satellite sensor sensitivity analysis can set the basis for efficient operational tools for variety-based data analysis in viticulture. Among the future work are the integration of more efficient classifiers, experiments with more varieties and the development of a fully-automated processing framework.

Acknowledgments

We gratefully acknowledge support from the State Scholarships Foundation (IKY) of Greece and the “ IKY Fellowships of Excellence for post-graduate studies in Greece - Siemens Program”.

Author Contributions

C. Karakizi and K. Karantzalos conceived and designed the experiments; C. Karakizi and M. Oikonomou performed the experiments; C. Karakizi, M. Oikonomou and K. Karantzalos analyzed the data; C. Karakizi and K. Karantzalos wrote the paper.

Conflicts of Interest

The authors declare no conflict of interest.

References

  1. Rapinel, S.; Clément, B.; Magnanon, S.; Sellin, V.; Hubert-Moy, L. Identification and mapping of natural vegetation on a coastal site using a Worldview-2 satellite image. J. Environ. Manag. 2014, 144, 236–246. [Google Scholar] [CrossRef] [PubMed] [Green Version]
  2. Lottering, R.; Mutanga, O. Optimizing the spatial resolution of WorldView-2 imagery for discriminating forest vegetation at subspecies level in KwaZulu-Natal, South Africa. Geocarto Int. 2015. [Google Scholar] [CrossRef]
  3. Immitzer, M.; Atzberger, C.; Koukal, T. Tree Species Classification with Random Forest Using Very High Spatial Resolution 8-Band WorldView-2 Satellite Data. Remote Sens. 2012, 4, 2661–2693. [Google Scholar] [CrossRef]
  4. Pu, R.; Landry, S. A comparative analysis of high spatial resolution IKONOS and WorldView-2 imagery for mapping urban tree species. Remote Sens. Environ. 2012, 124, 516–533. [Google Scholar] [CrossRef]
  5. Ozdemir, I.; Karnieli, A. Predicting forest structural parameters using the image texture derived from WorldView-2 multispectral imagery in a dryland forest, Israel. Int. J. Appl. Earth Obs. Geoinform. 2011, 13, 701–710. [Google Scholar] [CrossRef]
  6. Eckert, S. Improved Forest Biomass and Carbon Estimations Using Texture Measures from WorldView-2 Satellite Data. Remote Sens. 2012, 4, 810–829. [Google Scholar] [CrossRef]
  7. Mutanga, O.; Adam, E.; Cho, M.A. High density biomass estimation for wetland vegetation using WorldView-2 imagery and random forest regression algorithm. Int. J. Appl. Earth Obs. Geoinform. 2012, 18, 399–406. [Google Scholar] [CrossRef]
  8. Upadhyay, P.; Kumar, A.; Roy, P.S.; Ghosh, S.K.; Gilbert, I. Effect on specific crop mapping using WorldView-2 multispectral add-on bands: soft classification approach. J. Appl. Remote Sens. 2012, 6, 063524. [Google Scholar] [CrossRef]
  9. Schultz, B.; Immitzer, M.; Formaggio, A.R.; Del’ Arco Sanches, I.; Luiz, A.J.B.; Atzberger, C. Self-Guided Segmentation and Classification of Multi-Temporal Landsat 8 Images for Crop Type Mapping in Southeastern Brazil. Remote Sens. 2015, 7, 14482–14508. [Google Scholar] [CrossRef]
  10. Justice, C.; Becker-Reshef, I. Report from the Workshop on Developing a Strategy for Global Agricultural Monitoring in the Framework of Group on Earth Observations (GEO). In Proceedings of the SPIE Remote Sensing and Modeling of Ecosystems for Sustainability IV. UN FAO, Rome, Italy, 16–18 July 2007.
  11. Urretavizcaya, I.; Santesteban, L.; Tisseyre, B.; Guillaume, S.; Miranda, C.; Royo, J. Oenological significance of vineyard management zones delineated using early grape sampling. Precis. Agric. 2014, 15, 111–129. [Google Scholar] [CrossRef]
  12. Bramley, R.; Proffitt, A. Managing variability in viticultural production. Grapegrower and Winemaker. Grapegrow. Winemak. 1999, 427, 11–16. [Google Scholar]
  13. Hall, A.; Lamb, D.; Holzapfel, B.; Louis, J. Optical remote sensing applications in viticulture - a review. Aust. J. Grape Wine Res. 2002, 8, 36–47. [Google Scholar] [CrossRef]
  14. Johnson, L.F.; Roczen, D.E.; Youkhana, S.K.; Nemani, R.R.; Bosch, D.F. Mapping vineyard leaf area with multispectral satellite imagery. Comput. Electron. Agric. 2003, 38, 33–44. [Google Scholar] [CrossRef]
  15. Karakizi, C.; Karantzalos, K.; Kandylakis, Z.; Makris, G.; Georgopoulos, A. Vineyard detection and vine variety discrimination from high resolution satellite data. In Proceedings of the 9th European Conference on Precision Agriculture, la Seu Vella, Barcelona, 8–11 July 2013.
  16. Karakizi, C.; Oikonomou, M.; Karantzalos, K. Spectral Discrimination and Reflectance Properties of Various Vine Varieties from Satellite, UAV and Proximate Sensors. In Proceedings of the 36th Inter-national Symposium on Remote Sensing of Environment on International Archives of the Photogrammetry, Remote Sensing and Spatial Information Sciences, Berlin, Germany, 11–15 May 2015.
  17. Bramley, R.; Hamilton, R. Understanding variability in winegrape production systems. Aust. J. Grape Wine Res. 2004, 10, 32–45. [Google Scholar] [CrossRef]
  18. Zarco-Tejada, P.; Berjon, A.; Lopez-Lozano, R.; Miller, J.R.; Martin, P.; Cachorro, V.; González, M.R.; Frutos, A. Assessing vineyard condition with hyperspectral indices: Leaf and canopy reflectance simulation in a row-structured discontinuous canopy. Remote Sens. Environ. 2005, 99, 271–287. [Google Scholar] [CrossRef]
  19. Acevedo-Opazo, C.; Tisseyre, B.; Guillaume, S.; Ojeda, H. The potential of high spatial resolution information to define within-vineyard zones related to vine water status. Precis. Agric. 2008, 9, 285–302. [Google Scholar] [CrossRef]
  20. Meggio, F.; Zarco-Tejada, P.; Núnez, L.; Sepulcre-Cantó, G.; González, M.; Martín, P. Grape quality assessment in vineyards affected by iron deficiency chlorosis using narrow-band physiological remote sensing indices. Remote Sens. Environ. 2010, 114, 1968–1986. [Google Scholar] [CrossRef]
  21. Hall, A.; Lamb, D.W.; Holzapfel, B.P.; Louis, J.P. Within-season temporal variation in correlations between vineyard canopy and winegrape composition and yield. Precis. Agric. 2011, 12, 103–117. [Google Scholar] [CrossRef]
  22. Yang, C.; Everitt, J.H.; Murden, D. Evaluating high resolution SPOT 5 satellite imagery for crop identification. Comput. Electron. Agric. 2011, 75, 347–354. [Google Scholar] [CrossRef]
  23. Zheng, B.; Myint, S.W.; Thenkabail, P.S.; Aggarwal, R.M. A support vector machine to identify irrigated crop types using time-series Landsat NDVI data. Int. J. Appl. Earth Obs. Geoinform. 2015, 34, 103–112. [Google Scholar] [CrossRef]
  24. Pena-Barragán, J.M.; Ngugi, M.K.; Plant, R.E.; Six, J. Object-based crop identification using multiple vegetation indices, textural features and crop phenology. Remote Sens. Environ. 2011, 115, 1301–1316. [Google Scholar] [CrossRef]
  25. Cruz-Ramírez, M.; Hervás-Martinez, C.; Jurado-Expósito, M.; López-Granados, F. A multi-objective neural network based method for cover crop identification from remote sensed data. Expert Syst. Appl. 2012, 39, 10038–10048. [Google Scholar] [CrossRef]
  26. Löw, F.; Michel, U.; Dech, S.; Conrad, C. Impact of feature selection on the accuracy and spatial uncertainty of per-field crop classification using Support Vector Machines. ISPRS J. Photogramm. Remote Sens. 2013, 85, 102–119. [Google Scholar] [CrossRef]
  27. Conrad, C.; Dech, S.; Dubovyk, O.; Fritsch, S.; Klein, D.; Löw, F.; Schorchtd, G.; Zeidlerb, J. Derivation of temporal windows for accurate crop discrimination in heterogeneous croplands of Uzbekistan using multitemporal RapidEye images. Comput. Electron. Agric. 2014, 103, 63–74. [Google Scholar] [CrossRef]
  28. Delenne, C.; Durrieu, S.; Rabatel, G.; Deshayes, M. From pixel to vine parcel: A complete methodology for vineyard delineation and characterization using remote-sensing data. Comput. Electron. Agric. 2010, 70, 78–83. [Google Scholar] [CrossRef] [Green Version]
  29. Pedroso, M.; Taylor, J.; Tisseyre, B.; Charnomordic, B.; Guillaume, S. A segmentation algorithm for the delineation of agricultural management zones. Comput. Electron. Agric. 2010, 70, 199–208. [Google Scholar] [CrossRef]
  30. Vaudour, E.; Carey, V.; Gilliot, J. Digital zoning of South African viticultural terroirs using bootstrapped decision trees on morphometric data and ultitemporal SPOT images. Remote Sens. Environ. 2010, 114, 2940–2950. [Google Scholar] [CrossRef]
  31. Rabatel, G.; Delenne, C.; Deshayes, M. A non-supervised approach using Gabor filters for vine-plot detection in aerial images. Comput. Electron. Agric. 2008, 62, 159–168. [Google Scholar] [CrossRef]
  32. Comba, L.; Gay, P.; Primicerio, J.; Aimonino, D.R. Vineyard detection from unmanned aerial systems images. Comput. Electron. Agric. 2015, 114, 78–87. [Google Scholar] [CrossRef]
  33. Pérez-Lamela, C.; García-Falcón, M.S.; Simal-Gándara, J.; Orriols-Fernández, I. Influence of grape variety, vine system and enological treatments on the colour stability of young red wines. Food Chem. 2007, 101, 601–606. [Google Scholar] [CrossRef]
  34. Bramley, R. Precision Viticulture: Managing vineyard variability for improved quality outcomes. In Managing Wine Quality: Viticulture and Wine Quality; Reynolds, A.G., Ed.; Woodhead Publishing: Cambridge, UK, 2010; pp. 445–480. [Google Scholar]
  35. Clavijo, A.; Calderón, I.; Paneque, P. Diversity of Saccharomyces and non-Saccharomyces yeasts in three red grape varieties cultured in the Serrania de Ronda (Spain) vine-growing region. Int. J. Food Microbiol. 2010, 143, 241–245. [Google Scholar] [CrossRef] [PubMed]
  36. Santesteban, L.; Guillaume, S.; Royo, J.; Tisseyre, B. Are precision agriculture tools and methods relevant at the whole-vineyard scale? Precis. Agric. 2013, 14, 2–17. [Google Scholar] [CrossRef]
  37. Ramos, M.; Martinez-Casasnovas, J. Soil water variability and its influence on transpirable soil water fraction with two grape varieties under different rainfall regimes. Agric. Ecosyst. Environ. 2014, 185, 253–262. [Google Scholar] [CrossRef]
  38. Song, J.; Smart, R.; Dambergs, R.; Sparrow, A.; Wells, R.B.; Wang, H.; Qian, M.C. Pinot Noir wine composition from different vine vigour zones classified by remote imaging technology. Food Chem. 2014, 153, 52–59. [Google Scholar] [CrossRef] [PubMed]
  39. Clarke, O.; Rand, M. Grapes Wines: A Comprehensive Guide to Varieties and Flavours; Sterling Epicure: New York, NY, USA, 2010. [Google Scholar]
  40. Diago, P.; Fernandes, A.; Millan, B.; Tardaguila, J.; Melo-Pinto, P. Identification of grapevine varieties using leaf spectroscopy and partial least squares. Comput. Electron. Agric. 2013, 99, 7–13. [Google Scholar] [CrossRef]
  41. Galet, P. A Practical Ampelography: Grapevine Identification; Comstock Publishing (Cornell University Press): Ithaca, NY, USA, 1979. [Google Scholar]
  42. Sefc, K.; Lefort, F.; Grando, M.; Scott, K.; Steinkellner, H.; Thomas, M. Microsatellite markers for grapevine: A state of the art. In Molecular Biology Biotechnology of Grapevine; Roubelakis-Angelakis, K.A., Ed.; Kluwer Academic Publishers: New York, USA, 2001. [Google Scholar]
  43. Sanchez, M.; De la Haba, J.; Benitez-Lopez, M.; Fernandez-Novales, J.; Garrido-Varo, A.; Perez-Marin, D. Non-destructive characterization and quality control of intact strawberries based on NIR spectral data. J. Food Eng. 2012, 110, 102–108. [Google Scholar] [CrossRef]
  44. Lacar, F.; Lewis, M.; Grierson, I. Use of hyperspectral imagery for mapping grape varieties in the Barossa Valley, South Australia. In Proceedings of the International Geoscience and Remote Sensing Symposium, Sydney, Australia, 9–13 July 2001; Volume 6, pp. 2875–2877.
  45. Ferreiro-Arman, M.; Da Costa, J.P.; Homayouni, S.; Martin-Herrero, J. Hyperspectral image analysis for precision viticulture. Lect. Notes Comput. Sci. 2006, 4142, 730–741. [Google Scholar]
  46. Ferreiro-Arman, M.; Alba-Castro, J.L.; Homayouni, S.; Da Costa, J.P.; Martin-Herrero, J. Vine variety discrimination with airborne imaging spectroscopy. In Proceedings of the SPIE Remote Sensing and Modeling of Ecosystems for Sustainability IV. SPIE, San Diego, CA, USA, 26 August 2007; Volume 667909.
  47. Blaschke, T. Object based image analysis for remote sensing. ISPRS J. Photogramm. Remote Sens. 2010, 65, 2–16. [Google Scholar] [CrossRef]
  48. Tzotsos, A.; Karantzalos, K.; Argialas, D. Object Based Image Analysis through Nonlinear Scale Space Filtering. ISPRS J. Photogramm. Remote Sens. 2011, 66, 2–16. [Google Scholar] [CrossRef]
  49. Hall, A.; Louis, J.; Lamb, D. A method for extracting detailed information from high resolution multispectral images of vineyards. In Proceedings of the 6th International Conference on Geocomputation, ISBN 1864995637, University of Queensland, Brisbane, Australia, 24–26 September 2001.
  50. Wald, L.; Ranchin, T.; Mangolini, M. Fusion of satellite images of different spatial resolutions: assessing the quality of resulting images. Photogramm. Eng. Remote Sens. 1997, 63, 691–699. [Google Scholar]
  51. Padwick, C.; Deskevich, M.; Pacifici, F.; Smallwood, S. WorldView-2 Pan-Sharpening. In Proceedings of the Annual Conference of the American Society of Photogrammetry and Remote Sensing, San Diego, CA, USA, 26–30 April 2010.
  52. Schowengerdt, R. Reconstruction of multispatial, multispectral image data using spatial frequency content. Photogramm. Eng. Remote Sens. 1998, 46, 1325–1334. [Google Scholar]
  53. Yuhendra; Alimuddin, I.; Sumantyo, J.T.S.; Kuze, H. Assessment of pan-sharpening methods applied to image fusion of remotely sensed multi-band data. Int. J. Appl. Earth Obs. Geoinform. 2012, 18, 165–175. [Google Scholar] [CrossRef]
  54. Tzotsos, A.; Karantzalos, K.; Argialas, D. Multiscale Segmentation and Classification of Remote Sensing Imagery with Advanced Edge and Scale-Space Features (ed Q. Weng). In Scale Issues in Remote Sensing; John Wiley and Sons, Inc.: Hoboken, NJ, USA, 2014. [Google Scholar]
  55. Jawak, S.D.; Devliyal, P.; Luis, A.J. A Comprehensive Review on Pixel Oriented and Object Oriented Methods for Information Extraction from Remotely Sensed Satellite Images with a Special Emphasis on Cryospheric Applications. Adv. Remote Sens. 2015, 4, 177–195. [Google Scholar] [CrossRef]
  56. Duro, D.; Franklin, S.; Dube, M.G. A comparison of pixel-based and object-based image analysis with selected machine learning algorithms for the classification of agricultural landscapes using SPOT-5 HRG imagery. Remote Sens. Environ. 2012, 118, 259–272. [Google Scholar] [CrossRef]
  57. Rouse, J.W., Jr.; Haas, R.H.; Schell, J.A.; Deering, D.W. Monitoring Vegetation Systems in the Great Plains with Erts; NASA: Washington, DC, USA, 1974; Volume 351, p. 309. [Google Scholar]
  58. Qi, J.; Chehbouni, A.; Huete, A.; Keer, Y.H.; Sorooshian, S. A modified soil vegetation adjusted index. Remote Sens. Environ. 1994, 48, 119–126. [Google Scholar] [CrossRef]
  59. Huang, X.; Lu, Q.; Zhang, L.; Plaza, A. New Postprocessing Methods for Remote Sensing Image Classification: A Systematic Study. IEEE Trans. Geosci. Remote Sens. 2014, 52, 7140–7159. [Google Scholar] [CrossRef]
  60. Dalponte, M.; Ene, L.T.; Marconcini, M.; Gobakken, T.; Næsset, E. Semi-supervised SVM for individual tree crown species classification. ISPRS J. Photogramm. Remote Sens. 2015, 110, 77–87. [Google Scholar] [CrossRef]
  61. Chang, C.C.; Lin, C.J. LIBSVM: A library for support vector machines. ACM Trans. Intell. Syst. Technol. 2011, 2, 27:1–27:27. Software Available online: http://www.csie.ntu.edu.tw/~cjlin/libsvm (accessed on 10 January 2016). [Google Scholar] [CrossRef]
  62. Wiedemann, C.; Heipke, C.; Mayer, H.; Hinz, S. Automatic extraction and evaluation of road networks from MOMS-2P imagery. Int. Arch. Photogramm. Remote Sens. 1998, 30, 285–291. [Google Scholar]
  63. Karantzalos, K.; Paragios, N. Large-Scale Building Reconstruction through Information Fusion and 3-D Priors. IEEE Trans. Geosci. Remote Sens. 2010, 48, 2283–2296. [Google Scholar] [CrossRef]
Figure 1. Data acquisition campaigns were conducted in four different viticulture regions in Greece, in Protected Geographical Indication ( PGI) zones. The campaigns were scheduled during the veraison period, conducted in 2012 and 2013, from late July to early August.
Remotesensing 08 00235 g001
Figure 2. The classification features and rules of the developed vineyard detection framework.
Remotesensing 08 00235 g002
Figure 3. Experimental results after the application of the developed vineyard detection methodology. The detected vineyards (with green color) and the ground truth are shown for all study areas. The Other-Vegetation class is presented with yellow color.
Remotesensing 08 00235 g003
Figure 4. The extracted vine canopy with green color and the detected in-between the rows materials, e.g., soil, with brown on two vine parcels. The corresponding natural color composites are also presented (right).
Remotesensing 08 00235 g004
Figure 5. Experimental results from the supervised classification in the Trapeza study area for the discrimination of six different varieties. The overall classification accuracy at the pixel level (first processing step) was just above 60%, while after the majority voting (second processing step), the OA reached 100% at the parcel level (Table 4). (a) The resulting classification map based on the multispectral data (2-m resolution, left) and the ground truth data (right); (b) the resulting classification map based on the detected canopy (pan-sharpened data at 50-cm resolution) for vine parcels with Sauvignon Blanc Clone I (left) and Sauvignon Blanc Clone II (right).
Remotesensing 08 00235 g005
Figure 6. The in situ reflectance spectral signatures of different varieties for the four study areas.
Remotesensing 08 00235 g006
Figure 7. Typical examples of classification results based on the detected canopy (50-cm spatial resolution) over two Merlot vine parcels.
Remotesensing 08 00235 g007
Figure 8. The classification result (left) in an experiment on the multispectral dataset (2-m resolution) with four varieties, in the Amynteo study area, and the corresponding ground truth data (right).
Remotesensing 08 00235 g008
Figure 9. The average PA rates, at the pixel level, for the four most commonly-used varieties in the discriminative classification experiments. Quantitative results on the multispectral (2-m resolution) datasets are given with brown color, while the ones for the pan-sharpened (50-cm resolution) with green.
Remotesensing 08 00235 g009
Table 1. The spectral, spatial and textural features that were associated with the developed rule-set hierarchy for the (i) vineyard detection; (ii) vine canopy extraction and (iii) vine variety discrimination tasks.
Vineyard DetectionVine Canopy ExtractionVine Variety Discrimination
Mean blueMean (all 8 bands)Mean (coastal blue, red, red-edge, NIR1, NIR2)
Mean red-edgeRatio (all 8 bands)Ratio (all 8 bands)
Mean NIR1NDVIMean NIR1/mean red
Mean red-edge/ mean blueMin. pixel value (red, NIR1)Mean NIR2/mean red
Standard deviation NIR1Mean diff.to neighbors (red, NIR1)Mean NIR1/mean blue
MSAVIMean diff. to brighter/darker neighbors (red, NIR1)Mean NIR2/mean blue
GLCM DissimilarityNumber of brighter/darker objects (red, NIR1)NDVI
GLCM Standard DeviationRel.border to brighter objects (red, NIR1)
Table 2. The developed framework managed in all cases to detect vineyards with high detection rates; completeness and correctness rates stayed above 89% in all study areas.
Quantitative Evaluation for the Vineyard Detection Task
Quality MeasuresTrapezaMegaplatanosNaoussaAmynteo
Completeness91%96%94%89%
Correctness94%93%93%89%
Overall Quality86%90%88%80%
Table 3. Comparing results obtained from the proposed object-based NN classification framework and the pixel-based SVM classifier for vine canopy extraction.
TrapezaMegaplatanosNaoussaAmynteoAverage
Accuracy MetricNNSVMNNSVMNNSVMNNSVMNNSVM
Overall Accuracy97.2%97.8%99.5%98.9%100%89.5%96.2%97.5%98.2%95.9%
Producer Accuracy97.7%96.6%99.0%97.9%100%88.0%96.2%98.7%98.2%95.3%
User Accuracy96.6%98.8%100%100%100%90.0%96.2%96.3%98.2%96.3%
Table 4. Quantitative evaluation results after the application of the developed vine variety discrimination framework.
Study Areas
(acquisition year)
Trapeza
(2012)
Megaplatanos
(2012)
Naoussa
(2013)
Amynteo
(2013)
number of varieties/clones4564563434Average
Multispectral Data (2-m resolution)
Discrimination: OA at parcel level100%100%100%94%96%94%91%83%100%100%96%
Classification: OA at pixel level75%72%61%69%56%45%56%50%62%64%61%
Pan-sharpened Data (50-cm resolution)
Discrimination: OA at parcel level100%100%100%100%100%92%86%85%100%100%96%
Classification: OA at pixel level75%72%61%56%47%38%59%51%50%52%56%
Table 5. The resulting confusion matrices for the vine variety discrimination between six different vine varieties/clones in the Trapeza study area.
Multispectral Data (2-m resolution)
Evaluation at the pixel levelClassified as
Ground TruthSyrah ISyrah IIMerlotSauvignon Blanc IISauvignon Blanc IRiesling
Syrah I67%3%1%10%12%7%
Syrah II10%45%8%2%4%31%
Merlot4%5%65%6%3%17%
Sauvignon Blanc II16%1%4%78%1%0%
Sauvignon Blanc I9%4%2%5%76%4%
Riesling14%27%10%1%5%43%
Overall Accuracy61%
Pan-sharpened Data (50-cm resolution)
Evaluation at the pixel levelClassified as
Ground TruthSyrah ISyrah IIMerlotSauvignon Blanc IISauvignon Blanc IRiesling
Syrah I55%4%1%11%18%11%
Syrah II11%49%7%1%4%28%
Merlot4%8%68%7%1%12%
Sauvignon Blanc II13%3%8%72%2%2%
Sauvignon Blanc I6%3%1%1%83%6%
Riesling15%32%3%0%1%49%
Overall Accuracy61%
Table 6. Comparing results from the proposed object-based NN framework with a pixel-based SVM classifier for the variety discrimination task.
TrapezaMegaplatanosNaoussaAmynteo
number of varieties/clones4564563434Average
Overall accuracy (OA) at the parcel level
Object-based NN and majority voting100%100%100%100%100%92%86%85%100%100%96%
Pixel-based SVM and majority voting75%78%55%74%56%54%48%63%50%43%60%
Overall accuracy (OA) at the pixel level
Object-based NN75%72%61%56%47%38%59%51%50%52%56%
Pixel-based SVM56%53%45%52%45%38%54%43%46%41%47%

