Abstract
Light availability is an important factor driving primary productivity in benthic ecosystems, but in situ and remote sensing measurements of light quality are limited for coral reefs and seagrass beds. We evaluated the productivity responses of a patch reef and a seagrass site in the Lower Florida Keys to ambient light availability and spectral quality. In situ optical properties were characterized utilizing moored and water column bio-optical and hydrographic measurements. Net ecosystem productivity (NEP) was also estimated for these study sites using benthic productivity chambers. Our results show higher spectral light attenuation and absorption, and lower irradiance during low tide in the patch reef, tracking the influx of materials from shallower coastal areas. In contrast, the intrusion of clearer surface Atlantic Ocean water caused lower values of spectral attenuation and absorption, and higher irradiance in the patch reef during high tide. Storms during the studied period, with winds >10 m·s−1, caused higher spectral attenuation values. A spatial gradient of NEP was observed, from high productivity in the shallow seagrass area, to lower productivity in deeper patch reefs. The highest daytime NEP was observed in the seagrass, with values of almost 0.4 g·O2·m−2·h−1. Productivity at the patch reef area was lower in May than during October 2012 (mean = 0.137 and 0.177 g·O2·m−2·h−1, respectively). Higher photosynthetic active radiation (PAR) levels measured above water and lower light attenuation in the red region of the visible spectrum (~666 to ~699 nm) had a positive correlation with NEP. Our results indicate that changes in light availability and quality by suspended or resuspended particles limit benthic productivity in the Florida Keys.
1. Introduction
Tropical coral reefs and seagrass beds are shallow-water benthic communities of particular interest due to their high productivity and biodiversity, diverse environments, and high ecological and economic value [1,2,3]. These ecosystems are an integral component of global climate and biogeochemical processes, and are simultaneously impacted by large changes in the biogeochemistry of the ocean. The productivity and biodiversity of these ecosystems relies on the photosynthetic activity of many benthic organisms that utilize available sunlight that passes through the water column [4]. The underwater light environment in these habitats is a complex function of variations in the percentage of sunlight reaching the ocean’s surface, light reflected and absorbed by water by diverse types of suspended living and detrital matter, dissolved substances, and by the benthos [5,6,7,8,9]. These changes in the underwater light field affect the productivity and ecological structure of these communities [10,11,12,13,14]. Higher concentrations of suspended materials for example are associated with lower reef biodiversity, less live coral, lower coral growth rates, reduced light available for photosynthesis, and decreased net productivity [15]. The nature of the sediments entering the coral ecosystem is also important, as suspended terrigenous sediments such as silt and clay can reduce light penetration and coral photosynthesis more than reef-derived carbonate silt [16].
Light reaching the bottom is a fundamental factor driving primary productivity and growth in coral reefs and seagrass beds [4,17,18,19,20,21,22]. Primary producers use a range of the visible light from 400 to 700 nm known as photosynthetically active radiation (PAR) [4,19]. Suspended materials loaded with organic and inorganic components can change the chemical composition of the water column in coral reefs and seagrasses, modifying light spectral properties and PAR [23,24,25,26]. Different studies have demonstrated that photosynthetic rates (hence primary productivity and calcification) in corals vary depending on PAR intensity [21,27,28,29]. Even though light is a fundamental factor for these ecosystems, studies of the spectral quality of light (light intensity at specific wavelengths) in the water column are scarce for coral and seagrass [24,30,31,32]. The majority of previous studies on spectral quality have focused on controlled laboratory measurements to determine better lighting conditions for captive corals. While corals show higher growth and survival rates under high irradiance around 400–450 nm [27,28,29,33], natural coral communities contain multiple light-absorbing pigments that may allow them to take advantage of variations in the quality of the light spectrum [34].
Light from the sun entering the ocean’s water column undergoes spectrally dependent absorption and scattering of photons, resulting in the optical properties of the water column. These optical properties of water are divided into two classes: inherent and apparent optical properties (IOPs and AOPs, respectively) [35]. IOPs depend on the amount and biogeochemical characteristics of the dissolved and particulate materials in the water, as well as the water itself. Two fundamental IOPs in marine optics are the absorption (a) and the scattering (b) coefficient functions [35,36] (Table 1 numerates symbols used and their dimension). Total absorption in the water column is the sum of the individual absorption coefficients of water constituents, including absorption by water, sea salts, dissolved organic matter, live phytoplankton, nonalgal particles, and the remaining parts such as air bubbles [35,37]. Total scattering coefficient is also the sum of the mentioned water constituents, except for the dissolved fraction [35]. In order to identify the concentration and physical characteristics of materials in the water column limiting light availability, spectral absorption (a) and scattering (b) must be determined. Once these parameters have been measured or calculated, the total attenuation of light (cT) can be determined by the addition of aT and bT. Apparent optical properties (AOPs), like IOPs, depend on the materials in the water and also depend on the geometrical structure of the light field (directional beam of light). AOPs take into account radiance (L) and irradiance (E), which are radiometric measurements of the light field in the water [35,37].
The combination of in situ IOP and AOP measurements with remote sensing analysis has facilitated the identification of water components and the classification of water masses in the open ocean and coastal systems [9,13,38]. The combined use of in situ and remotely sensed optics has advanced the understanding and monitoring of coastal processes. Spatial and temporal analyses of satellite data have also helped in studying the interactions and connectivity of coastal processes with the open ocean and adjacent coastal regions. Connectivity is a process that links different ecosystems such as coral reefs with seagrass beds, either physically through motion of water masses, or through the migration of organisms. This process includes fish and fish larval distribution, plankton, biogeochemical quantities, and other ecological processes. Such connectivity may be traced using changes in bio-optical properties of the water with in situ and remote sensors (e.g., [39,40]). Satellite data have shown the effects of land processes such as runoff on the color of the water in the Florida Keys. Inputs of organic matter from land are usually loaded with nutrients, promoting the development of algal blooms with particular optical signatures detectable from space [41,42,43]. Water masses carrying organic matter have been tracked moving south from the west coast of Florida to the Dry Tortugas National Park [41], and consequently contributing to the development of higher phytoplankton densities, including harmful algae species. These phytoplankton blooms can negatively affect coral reef and seagrass productivity, as our in situ optical results indicated.

Table 1.
Description of parameters used, their symbol and dimensions.
| Symbol | Description | Dimension |
|---|---|---|
| NEP | Net ecosystem productivity | g O2 m−2·h−1 |
| PARw | Photosynthetic active radiation (underwater) | W·m−2 |
| PARsurf | Photosynthetic active radiation (above water) | W·m−2 |
| cT | Total attenuation (including water) | m−1 |
| aT | Total absorption (including water) | m−1 |
| bT | Total scattering | m−1 |
| ct | Total attenuation (without water absorption) | m−1 |
| cw | Attenuation by pure water | m−1 |
| cp | Attenuation by particles | m−1 |
| at | Total absorption (without water absorption) | m−1 |
| ag | Absorption by the dissolved fraction | m−1 |
| ap | Absorption by particles | m−1 |
| aw | Absorption by pure water | m−1 |
| bp | Particle scattering | m−1 |
| bbp | Particle backscattering | m−1 |
| Ed | Downwelling irradiance | W m−2·nm−1 |
| Chl(m) | Moored chlorophyll-a fluorescence | Counts |
| CDOM(m) | Moored colored dissolve organic matter fluorescence | Counts |
| Turb(m) | Moored turbidity | Counts |
| Chl(FlowT) | Flow-through chlorophyll-a fluorescence | Counts |
| CDOM(FlowT) | Flow-through colored dissolve organic matter fluorescence | Counts |
| Turb(FlowT) | Flow-through turbidity | Counts |
In situ measurements of light availability and quality, in combination with ecosystem productivity measurements, will help develop algorithms for future satellite missions that include benthic community assessments as standard high-level derived products. In this study, we discuss field observations of light quality and coral reef and seagrass productivity made in the Sugarloaf Key area, Lower Florida Keys, USA, in May and October 2012. The objective of the study was to evaluate the responses in productivity of these communities to variability in the ambient spectral quality of light. Studied environmental factors affecting light availability included suspended particulate and dissolved materials, and turbidity events due to storms and tidal currents.
2. Data and Methodology
2.1. Study Area
The Florida Keys are the only coral reef ecosystem in the continental US and represents one of the largest barrier reefs in the world [44]. This system of reefs is bathed intermittently by waters from the west Florida Shelf and from the Florida Current which originates in the Caribbean Sea [45]. Winds and tides play an important role in the direction and flow of the regional currents [45,46]. In the Upper Keys, seasonal winds are particularly important in defining the direction of water movement. In the Middle and Lower Keys, tidal currents are important in controlling water motion between the islands and the transport of suspended materials between the Gulf of Mexico, the Everglades, Florida Bay, and the Atlantic.
For this project, field measurements were obtained during May and October 2012. Work was conducted in a patch reef and a seagrass area ~4 km apart located off Sugarloaf Key, in the Lower Florida Keys (LFK) (Figure 1A). In May 2012, sampling in the patch reef was conducted at an average depth of ~−8 m, and at a seagrass site located at ~−4 m depth. In October, we sampled the patch reef at an average depth of ~−6 m, and the seagrass bed at ~−5 m (Table 2). The tidal range for both sites was ~0.7 m over the duration of both field deployments. The seagrass area was dominated by Thalassia testudinum. Benthic coverage in the adjacent patch reef featured corals predominantly from the genera Diploria, Montastraea and Orbicella, seagrass, sand patches, and a variety of sea fans and octocorals.

Figure 1.
(A) Study area; bathymetric isobaths are shown in meters; SG = seagrass, PR = patch reef; (B) Current speed and direction for the patch reef in May 2012; and for (C) the patch reef in October; and (D) the seagrass site in October. Abscissa shows day of the month; (E) Wind speed and direction between 15 and 17 October at the seagrass site, and 19–20 October at the patch reef area (direction is represented as that toward which wind and currents are going to); (F) Air temperature in October 2012.
Previous studies of currents in the LFK have observed a net flow from the Gulf of Mexico to the Atlantic through the passes between the Florida Keys. Smith [47] reported a mean flow from the Gulf to the Atlantic of ~3–5 cm∙s−1. This is similar to the mean southwestward currents we measured in the seagrass bed and near the patch reef at Sugarloaf Key (Table 2).
Table 2.
Patch reef and seagrass site location, approximate average depth, and average currents over each study period. Depth is referenced to tidal level = 0 m. Water level range corresponds to the measured tidal range at each site. Current speed and direction are the mean values over each study period.
| Study Site | Date (mm/dd/yy) | Latitude (Deg.) | Longitude (Deg.) | Depth (m) | Water Level Range (m) | Currents Direction (Deg.) | Currents Speed (cm∙s−1) |
|---|---|---|---|---|---|---|---|
| Patch Reef | 05/15/12–05/23/12 | 24.5616 | -81.5557 | 8 | 0.7 | 187 | 3.92 |
| 10/15/12–10/20/12 | 24.5615 | -81.5548 | 6 | 0.8 | 223 | 8.88 | |
| Seagrass | 05/15/12–05/23/12 | 24.6006 | -81.5531 | 4 | -- | -- | -- |
| 10/15/12–10/20/12 | 24.5999 | -81.5544 | 5 | 0.7 | 201 | 4.63 |
2.2. Optical and Hydrographic Data Collection and Processing
Moored optical and hydrographic instruments were deployed in the coral and seagrass areas for eight days in May 2012 and five days in October 2012. The moorings included WETLabs Inc. (Philomath, OR, USA). ECO sensors configured to measure chlorophyll-a (Chl(m)) fluorescence, colored dissolved organic matter fluorescence (CDOM(m)), and turbidity (Turb(m)). All sensors were moored at approximately half a meter from the bottom in a horizontal position. Data were logged internally for 10 min every hour. All ECO sensors were equipped with “bio-wipers” to mitigate biological fouling and sediment deposition in the optical windows. Measurements from the ECO sensors were reported in counts. Temperature and conductivity were recorded for the same time interval with moored Seabird Inc. (Bellevue, WA, USA) SBE 37-SM MicroCAT C-T sensors. Water column motion (current speed and direction), bottom water temperature, and pressure were continuously measured in the patch reefs with a SonTek Inc. (San Diego, CA, USA) Argonaut-XR ADCP instrument. In October 2012, currents in the seagrass bed were measured with an Aanderaa Inc. RDCP-600 m. All the optical and physical instruments were within 3 m of each other at each location. Moored data are not reported for the seagrass area in May due to unforeseen problems with the internal logging of the sensors.
Profiles of bio-optical measurements were collected from a boat at each of the sites several times per day. Measurements included beam attenuation (cT) and absorption (aT) measured with a WETLabs AC-s spectrophotometer at 81 wavelengths from 400 to 750 nm, with a spectral resolution ~4 nm. Light backscattering by particles (bbp) was measured at 470, 532, and 650 nm with a WETLabs BB3 sensor. Underwater spectral downwelling irradiance (Ed) was measured with a Satlantic HyperOCR radiometer (136 wavelengths from 350 to 803 nm, resolution ~3 nm). Temperature, conductivity and pressure profiles were collected with a Seabird SBE-49 FastCAT CTD sensor. Duplicate profiles were collected within ~5 min several times per day. The second profile for each set was done with a 0.2 μm filter placed at the AC-s intake to enable calculation of total and dissolved attenuation and absorption. All data were processed according to the manufacturer’s recommendations. The AC-s instrument was calibrated with ultrapure deionized water at the beginning, middle, and at the end of each field campaign. Measured aT corresponds to the sum of the absorption by the dissolved (ag), particulate (ap), and water (aw) fractions:
The absorption coefficient due to dissolved matter ag was measured using the 0.2 μm filter at the intake of the absorption tube. Pure water absorption (aw) and attenuation (cw) of water were subtracted from the measurements during data processing. Therefore, the reported total attenuation (ct) and absorption (at) correspond to total attenuation and absorption minus the water fraction.
Data from the AC-s instrument were collected at 4 Hz. A median value was obtained for each one-second interval. Temperature and salinity corrections were performed according to Sullivan et al. [48]. The proportional method [49] was used for scattering corrections of the absorption values, with 750 nm as the reference wavelength for absorption and scattering (750 nm showed a low temperature effect and is instrument specific). Total scattering (bt) was computed by subtracting at from the corresponding ct. We report this bt as particulate scattering (bp) since particles are the main contributor to light scattering. The remaining contribution due to the particulate fraction was calculated as follows:
A Davis Instruments Corp. (Vernon Hills, IL, USA) Vantage Pro2-Plus weather station was deployed in October 2012 aboard a boat anchored next to the seagrass area during the first half of the study period, and next to the patch reef during the second half. This station logged wind speed and direction, air temperature, humidity, rainfall, solar radiation (300–1100 nm), and UV radiation (290–390 nm) at a frequency of 30 min.
Spatial grids of near-surface data used to assess the spatial distribution of hydrographic properties were sampled during the transition from high to low tide in May 2012, and from low to high tide in October 2012. This spatial distribution was obtained with a flow-through system operated aboard a 21 ft work boat for both deployments, with a water intake just below the water surface (~−0.3 m deep). This system integrated a set of sensors similar to the moored packages including a SeaBird SBE 21 SeaCAT Thermosalinograph for measuring water temperature and salinity, and WETLabs WETStar fluorometers for measuring chlorophyll-a (Chl(FlowT)), CDOM (CDOM(FlowT)) fluorescence, and turbidity (Turb(FlowT)). Four surveys were made in May and three in October 2012, following a grid pattern from the seagrass to the patch reef at an average speed of 10 knots over a period of approximately 2 h. Position and time were obtained by GPS, and hydrographic and optical measurements were time-stamped and post-processed following the standard manufacturer’s recommendations. Spatial distribution maps were generated in ArcGIS (ESRI®) using the interpolation method of Natural Neighbors.
2.3. Net Benthic Productivity
Benthic productivity was estimated for the seagrass and patch reef using large incubation chambers called Submersible Habitat for Analyzing Reef Quality (SHARQ, U.S. Patent # 6,467,424 B1). The methodology for using the SHARQ was described by Yates & Halley [20,50,51] to estimate benthic ecosystem productivity, respiration, and calcification. In this study, we only report productivity. The SHARQ chamber is a 4.9 × 2.4 × 1.2-m aluminum frame placed on top of the benthic area of interest. This frame is covered with a translucent vinyl tent extending to the bottom and secured with sand bags to follow the substrate profile and seal the system. A submersible pump is placed inside the tent to run continuously and warrant a moderate water flow inside the chamber. An outflow hose connected next to the pump system passed water from inside the chamber to a surface analytical flow-through system (Falmouth Scientific ETSG) located in an adjacent anchored working boat to measure dissolved oxygen (DO; ±0.1 mg·L−1) at 1-min intervals. Water is returned to the chamber though an inflow hose. Net benthic productivity (NEP) was calculated from the changes in DO concentration in the chamber at 15-min intervals following the methods by Yates & Halley [20]:
where ∆DO is the dissolved O2 concentration change inside the chamber over 15-min intervals (mmol O2 m−3·15 min−1), and SHARQvolume (m3) and SHARQarea (m2) are the final measurements of the chamber. Final data are reported as positive NEP (productivity during daylight) in g O2 m−2·h−1.
Two incubation chambers were deployed in the seagrass area from 17 to 19 May 2012 and moved to the patch reef area from 20 to 23 May. The same chambers were re-deployed in the seagrass area from 16 to 17 October 2012. They were moved to the patch reef from 19 to 21 October. All chambers were within ~10 m from the optical sensors moored in each area. All optical profiles were also conducted adjacent to the tents and moorings. Measurements of DO with the flow-through system were performed aboard the boat carrying the weather station.
2.4. Photosynthetic Active Radiation (PAR)
PAR data were collected every minute, continuously during the May and October deployments using moored LI-COR spherical quantum sensors located inside and outside each incubation chamber (PARw). A third PAR sensor (LI-COR quantum sensor) (PARsurf) was placed above the water surface next to the weather station at the anchored boat used to tend the chambers. PAR measurements were converted from µEinstein m−2∙s−1 to W·m−2 using the relation by Morel & Smith [52] Q:W = 2.77 × 10¹⁸ quanta∙s−1·W−1 as per Equation (5) below (an Einstein is the energy in one mole of photons (6.022 × 10²³) quanta). This empirical relationship was developed by Morel & Smith using samples from clear waters, similar to the conditions in the Florida Keys.
2.5. Statistical Analyses
Normality of all the datasets was verified using the Shapiro-Wilk Test. Measurements did not follow a normal distribution, thus statistical significance of spatial and temporal changes of measured parameters was tested using a Wilcoxon signed-ranks nonparametric paired t-test. Correlations among parameters for different areas and months were performed with a Spearman test (S). For this purpose, data were centered and standardized to zero mean and unit variance to give equal weight to the optical variables and NEP observations. A significant level of p = 0.05 was used for all analyses. Analyses were performed using the JMP® (SAS Institute Inc., Cary, NC, USA) software.
3. Results
3.1. Temporal Variations of Hydrographic and Meteorological Parameters
During the May 2012 deployment, currents at the patch reef site were predominantly to the south and southwest (Table 2, Figure 1B), with some periods of strong northeastward currents on 18 and 20 May. In October 2012, currents at the patch reef were predominantly to the west from 16 to 18 October, and weaker but to the northeast from 19 to 20 October (Figure 1C). Currents at the seagrass site in October were variable, with some general south-southwest direction from 16 to 19 October, and north-northwestward 19–20 October (Figure 1D).
Wind direction at the seagrass site was primarily to the northeast from 15 to 17 October, with a strong southward event caused by thunderstorms between 17 and 19 October (Figure 1E). Winds at the patch reef were predominantly to the south from 19 to 20 October. Air temperature dropped on 17 and 19 October during storms (Figure 1F). The first storm reached wind speeds >20 knots with rainfall >102 mm·h−1 registered by our meteorological station.
Water temperature and salinity decreased from about 28.6 °C to 28.2 °C, and >36.2 to 36.0, respectively, between mid-May and the end of May 2012 at the coral patch (Figure 2A). Temperature showed two quick drops of about half a degree, one early 18 May, and the second early 20 May. These two events corresponded to strong shoreward tidal currents (i.e., to the north-northwest; Figure 1B). During the October deployment, temperature increased from ~27.5 °C to 28.5 °C while salinity decreased from 36.5 to 36 in both the patch reef and seagrass areas, except during the storms of 17 and 18 October, when both temperature and salinity decreased (Figure 2B,C).

Figure 2.
Temperature-Salinity (T-S) plots during sampling at (A) patch reef site in May 2012; (B) patch reef in October 2012; and (C) seagrass in October 2012. Arrows in (A) indicate shoreward currents, and (B,C) indicate a storm. Color bars indicate days.
3.2. Moored Optical Observations
Bio-optical moorings collected CDOM fluorescence (CDOM(m)), chlorophyll-a fluorescence (Chl(m)), and turbidity data at the patch reef site in both May and October 2012, but only at the seagrass site in October. At the patch reef, CDOM(m), Chl(m) and turbidity were all higher in May 2012 compared to October 2012 (Figure 3A,B,D,E,G,H). Chl(m) showed a diurnal pattern with lower values around local noon (Figure 3D,E). This cycle was more pronounced in May than in October and is due to non-photochemical quenching of phytoplankton exposed to high light [53,54]. In both May and October deployments, CDOM(m), Chl(m), and turbidity in the coral patch decreased from the beginning to the end of the study period. The turbidity peak observed on 17 October coincided with the high wind event experienced on that day (Figure 3H).

Figure 3.
Count values for the moored optical instruments from the patch reef and seagrass sites deployed off Sugarloaf Key for May and October 2012. CDOM fluorescence (A–C); chlorophyll-a fluorescence (D–F); and turbidity (G–I). Note different y-axis scale for the seagrass (SG) site.
At the seagrass site, CDOM(m) showed a decrease on 19 October (Figure 3C) at the same time that Chl(m) showed a short peak (Figure 3F). Two spikes in turbidity at the seagrass site, one on 17 October and the other at the beginning of 18 October, coincide with the storms that went through this area (Figure 3I).
3.3. Water Column Optical Observations
Water column particulate beam attenuation (cp) and absorption (ap) coefficients were higher in the seagrass area than over the patch reef during both May and October, except during the strong storm of 17 October (Figure 4). Particulate and dissolved absorption coefficients were also usually higher in the seagrass area (Figure 4C–F). This effect was most apparent at shorter wavelengths, where ag(400) > 0.4 m−1 in the seagrass area. Particulate backscattering (bbp) at the three wavelengths collected (470, 532, and 650 nm) was also higher in the seagrass area than the patch reef (Figure 4G–H). Conversely, spectral downwelling irradiance (Ed) was higher at the patch reef area than at the seagrass area for both May and October (Figure 4I–J), except for 17 October at the patch reef (Figure 4J).

Figure 4.
Spectral curves of optical observations averaged vertically in the water column for the different study sites: (A,B) particulate beam attenuation (cp); (C,D) particulate absorption (ap); (E,F) dissolved absorption (ag); (G,H) particulate backscattering (bbp); and (I,J) downwelling irradiance (Ed) in the water column for May (left column) and October (right column) off Sugarloaf Key. Patch reef site: solid line. Seagrass site: dotted lines. (*) in panels A and J indicates values observed on 17 October.
Time-series of water column optical data at the patch reef showed the effects of tidal variations on light availability and quality. High values for cp and bp, and low values for Ed were recorded during high/medium (H-M) tide on 18 May (Figure 5A,E,I). The strong current to the northeast (Figure 1B), which coincided with cooler bottom temperatures and lower salinities (Figure 2A) over the patch reef on 18 May, suggested the presence of upwelling and shoreward advection of those waters to the coral reef site. In contrast, during high/medium tide on 20 May, cp and bp were lower and Ed was higher than at low tide during that day. This suggested the intrusion of clearer surface oceanic water onto the reef (Figure 5A,E,I). Particulate absorption also showed lower values during low tide on 18 May, but very similar spectra between tides for 20 May (Figure 5C). The dissolved absorption coefficient at 400 nm (~ag(400)) was similar throughout the tidal cycle during both days (Figure 5G). High values of cp, ap, and bp, and low Ed values were recorded on 17 October during high tide after a storm (Figure 5B,D,F,J). However, the storm did not have much of an effect on ag values (Figure 5H).

Figure 5.
Variations of spectral optical observations averaged over particular tidal cycle periods in the patch reef area (see legend): (A,B) particulate beam attenuation (cp); (C,D) particulate absorption (ap); (E,F) particle scattering (bp); (G,H) dissolved absorption (ag); and (I,J) downwelling irradiance (Ed) in the water column for May (left column) and October (right column). H: High tide; M: Medium tide; L: Low tide. Note differences in the y-axis scale between May and October for cp and bp.
3.4. Spatial Distribution of Hydrographic Parameters at the Surface
Chl(FlowT), CDOM(FlowT), and turbidity were generally higher close to the coast towards the seagrass area on all days sampled (Figure 6). During the May survey, Chl(FlowT) and turbidity values at the seagrass were nearly double than those at the patch reef. In October Chl(FlowT) distribution was more uniform between areas, while CDOM(FlowT), and turbidity were markedly lower at the patch reef. This suggested the intrusion of clearer surface oceanic water to the area.
Lower Chl(FlowT) values were observed during May than during the October survey across the surveyed area. Conversely, CDOM(FlowT) values were close to double in May than in October for both areas, especially for the patch reef. The seagrass area presented rather high turbidity compared to the patch reef area in both May and October (Figure 6).

Figure 6.
Horizontal distribution of hydrographic parameters in the study area for May and October 2012. Top panels: Chlorophyll-a; middle panels: CDOM; lower panels: Turbidity. SG = seagrass, PR = patch reef.
3.5. Net Benthic Productivity
Average daytime net benthic productivity (NEP) at the patch reef area measured with the SHARQ system was significantly lower during the May survey than during October 2012 (mean = 0.137 and 0.177 g O2 m−2·h−1, respectively) (Figure 7, Table 3), and significantly lower at the patch reef than the seagrass area in October.
Table 3.
Wilcoxon signed-ranks nonparametric paired t-test results for temporal and spatial variation of NEP. PR: patch reef; SG: seagrass. Temporal comparison was conducted only for the patch reef, and the spatial comparison was conducted only in October 2012.
| Level | N | Mean | S.D. | df | Z | p | |
|---|---|---|---|---|---|---|---|
| Temporal (PR) | |||||||
| May | 53 | 0.137 | 0.060 | 1 | 2.859 | 0.004 | |
| October | 42 | 0.177 | 0.107 | ||||
| Spatial (Oct) | |||||||
| PR | 42 | 0.177 | 0.107 | 1 | −3.054 | 0.002 | |
| SG | 44 | 0.241 | 0.071 | ||||
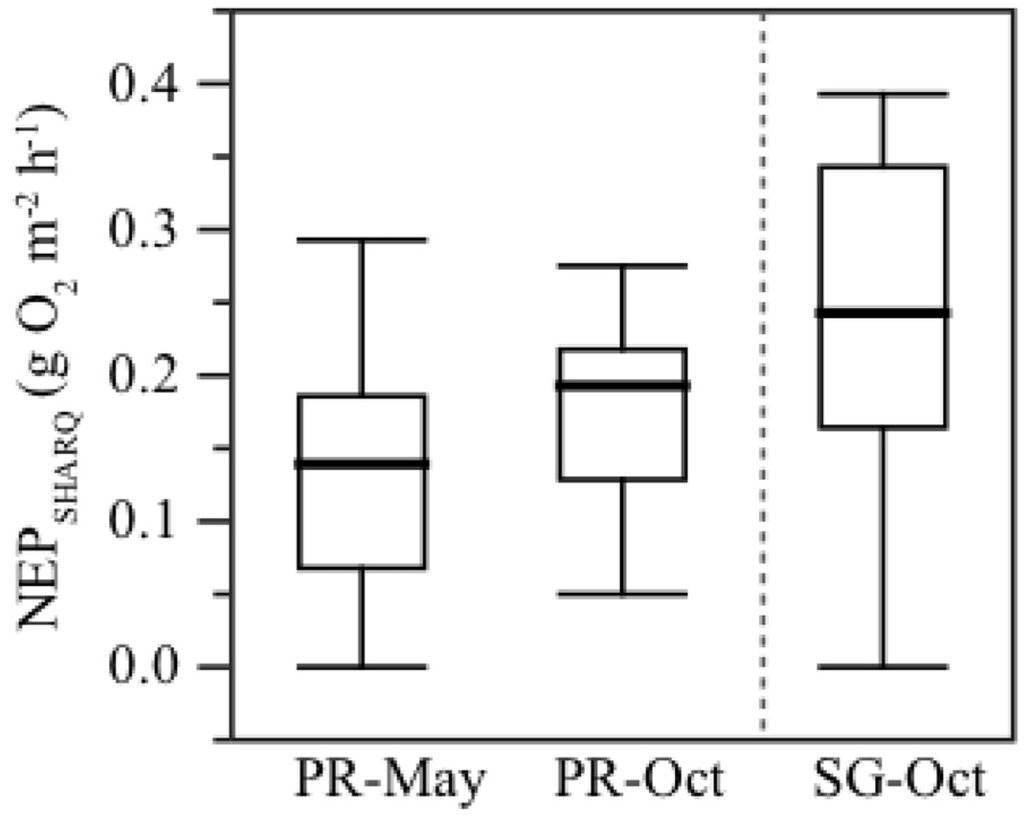
Figure 7.
Net benthic productivity (NEP) during daylight at the patch reef in May and October 2012, and at the seagrass area in October 2012, measured with the SHARQ enclosures. Dark horizontal lines are the mean values, boxes represents interquartile values (25% and 75%), and whiskers represent the minimum and maximum values of NEP observed in each area.
The highest NEP was observed in the seagrass area, with values of almost 0.4 g O2 m−2·h−1 (Figure 7). NEP was positively correlated with surface PAR (PARsurf) for both areas during the study in May and October (Spearman test S > 0.3, p < 0.05; Table 4). NEP and underwater PAR (PARw) were positively correlated in May at the patch reef and October for the seagrass area (both S > 0.3, p < 0.05). NEP was inversely correlated with moored chlorophyll-a (Chl(m)) in May 2012 at the patch reef where S = −0.3 (p = 0.01), but no statistical correlation was found with moored CDOM or turbidity observations.
Table 4.
Spearman (S) correlations between NEP and moored parameters in the patch reef (PR) and seagrass (SG) sites, and between NEP and water column parameters in the patch reef for May 2012.
| Area/Month | Variables | N | S | p | |||
|---|---|---|---|---|---|---|---|
| Moored Variables | |||||||
| PR (May) | NEPSHARQ | CDOM(m) | 53 | 0.05 | 0.727 | ||
| Chl(m) | 53 | −0.34 | 0.013 * | ||||
| Turb(m) | 53 | −0.18 | 0.204 | ||||
| PARw | 53 | 0.29 | 0.036 * | ||||
| PARsurf | 53 | 0.28 | 0.043 * | ||||
| PR (Oct) | NEPSHARQ | CDOM(m) | 42 | −0.18 | 0.249 | ||
| Chl(m) | 42 | 0.21 | 0.181 | ||||
| Turb(m) | 42 | 0.15 | 0.334 | ||||
| PARw | 42 | 0.21 | 0.191 | ||||
| PARsurf | 42 | 0.42 | 0.005 * | ||||
| SG (Oct) | NEPSHARQ | CDOM(m) | 44 | 0.12 | 0.423 | ||
| Chl(m) | 44 | −0.27 | 0.073 | ||||
| Turb(m) | 44 | −0.15 | 0.335 | ||||
| PARw | 37 | 0.78 | < | 0.001 * | |||
| PARsurf | 37 | 0.71 | < | 0.001 * | |||
| Water Column Variables | |||||||
| PR (May) | NEPSHARQ | aT(406-487) | 5 | >0.80 | > | 0.104 | |
| aT(492-512) | 5 | 0.90 | 0.037 * | ||||
| aT(517-546) | 5 | 1.00 | < | 0.0001 * | |||
| aT(551) | 5 | 0.90 | 0.037 * | ||||
| aT(556-591) | 5 | 0.70 | 0.188 | ||||
| aT(595-614) | 5 | 1.00 | < | 0.0001 * | |||
| aT(619-661) | 5 | 0.70 | 0.188 | ||||
| aT(666-699) | 5 | −0.50 | 0.391 | ||||
| ap(402-438) | 5 | 0.90 | 0.037 * | ||||
| ap(443-587) | 5 | 0.70 | 0.188 | ||||
| ap(591) | 5 | 0.90 | 0.037 * | ||||
| ap(595-699) | 5 | <−0.10 | > | 0.624 | |||
| ag(402-699) | 5 | <0.70 | > | 0.104 | |||
| Ed(402-700) | 5 | 0.90 | 0.037 * | ||||
* indicates a significant correlation.
The relationship between NEP and light quality observations from light and constituent bio-optical profile samples was studied for the patch reef area in May, when more coinciding data between these parameters were available. Concurring data for the seagrass site were scarce (N<5) and thus were not considered for a similar analysis. NEP was highly correlated with particulate absorption (ap) from 402 to 438 nm, and at 591 nm (S > 0.9, p < 0.05) (Table 4), but not with the dissolved absorption (ag) (p > 0.05) at any wavelength. There was a positive correlation of NEP with particulate and absorbed absorption together (total absorption—aT) at wavelengths between 492–551 and 595–614 nm (S > 0.9, p < 0.05). NEP was also well correlated with all the water column irradiance (Ed) wavelengths analyzed at the patch reef site (S > 0.9, p < 0.05).
4. Discussion
Shallow coastal environments are optically complex areas, where a variety of dissolved and particulate materials contribute to the visible spectral characteristics of the water [5,6,7,8,9]. Coastal regions are often highly dynamic due to physical processes that include tides, wind driven circulation and eddies [55,56]. Specifically at Sugarloaf Key in the Lower Florida Keys, tides and associated tidal currents, storms, and upwelling events led to short-term increases in turbidity and in spectral particulate absorption, attenuation and scattering in the patch reef and seagrass sites. Tides and circulation dynamics in coastal waters can resuspend sediments and dissolved compounds changing the chemical composition of the water column when organic and inorganic materials trapped in the sediments are released [23,24,25,26,57,58,59].
The effects of upwelling and resuspension events on the water column optical properties were evident during our May survey. Pulses of cooler, deeper oceanic water onto the shelf, such as those observed on 18 May (Figure 2A), were associated with an increase in CDOM(m) and turbidity (Figure 3A,G). Upwelling and tidal bores accompanied by a decrease in temperature (>5 °C) have been previously described in the Florida Keys lasting up to about 4 h [60,61]. Our observations show that these upwelling events can result in a quick change in IOPs, with higher spectral cp, ap, bp, and lower Ed in the water column over the patch reef during high tide (solid blue lines in Figure 5A,C,E,I). These effects were also evident at the surface across the studied area, where a more homogenous distribution of CDOM and turbidity was observed from the patch reef to the seagrass site (Figure 6I,P). Conversely, during periods of no upwelling events (20 May), lower values of spectral cp, ap, bp, and higher Ed were observed during flooding tide (red solid lines in Figure 5A,C,E,I). These results corresponded to the intrusion of clearer surface Atlantic Ocean water toward the coast, supporting previous reports of lower concentrations of suspended inorganic and organic components in adjacent open ocean waters than in coastal areas and coral reefs [7,62]. In general, lower values for surface CDOM and turbidity were also recorded near the patch reef than in the seagrass area during our spatial distribution survey on 20 May (Figure 6J,Q).
Distinct water sources with different biogeochemical signatures can be identified with optical measurements in coastal waters [13,24]. In our study, attenuation, absorption, and backscattering were generally higher over the seagrass site than in the patch reef (Figure 4). Higher spectral cp, ap, bp, and lower Ed were observed during low tide in the patch reef (red dotted lines in Figure 5A,C,E,I), indicating the influx of water with higher concentrations of suspended and dissolved materials from shallower coastal areas to the patch reef. These observations corresponded to previous studies in the Florida Keys that showed higher turbidity and lower light intensity nearshore the Keys [63,64].
The dissolved absorption fraction (ag) served as an index for CDOM concentration in the water. This index was more than double the values for particulate absorption at wavelengths around 400 nm, at both the patch reef and seagrass areas (Figure 4C,D,E,F). We found relatively high values of total absorption (ap + ag) (May at(443) > 0.21 m−1, Oct. at(443) > 0.14 m−1; Figure 4) compared to previously reported values near the Upper Florida Keys at the Atlantic side in much deeper water (~−17 m) during summer (at(440) < 0.1 m−1) [32]. In general, the Lower Keys have higher turbidity compared to the Upper Keys [64], although higher productivity has been observed in seagrass and crustose coralline algae communities in the Lower Keys [65,66]. This may be due in part to higher nutrient concentrations in shallow waters around the Lower Keys from land-based sources [64]. Additional research is needed to determine the effects of nutrient loads on combined benthic and water column productivity in the Florida Keys.
In addition to nutrients, light availability is a fundamental factor for productivity on seagrass and other benthic communities [4,67]. The effects of full spectrum light have been widely reported for coral reef and seagrass areas [17,68,69], showing higher productivity and health with better illumination conditions. Light availability decreases with water depth in coral reefs of Florida [63], with a marked reduction in daily doses of solar radiation from 2 to 24 m depth. Our benthic productivity results were correlated to the total amount of available light reported as PAR and as downwelling irradiance from 402 to 700 nm, suggesting that in fact light is one of the most important drivers for benthic productivity in the Sugarloaf area.
A previous analysis of community metabolism that included productivity and calcification of the same patch reef and seagrass areas [70] showed that lower PAR values during storms can lower these metabolic rates for hours, while during periods of higher daylight illumination, calcification and productivity rates increased. Our surveys captured the impact of two strong thunderstorms in October, which limited light reaching the ocean’s surface and also increased the concentration of suspended materials in the water. Particulate attenuation coefficients were higher at the patch reef after the storm of 17 October, when winds >10 m·s−1 occurred. Dierssen et al. [31] concluded that winds >7.35 m·s−1 can trigger resuspension of sediments over the Bahamas Banks at depths of about 5 m. Lapointe et al. [71] also proposed that winds play an important role in the dynamics of nutrients and chlorophyll concentrations by changing advection patterns in the Lower Florida Keys. Our results show high turbidity and cp conditions due to suspended sediments under these short high wind events, which are quite common in Florida during summer. High turbidity due to winds was observed more frequently over the shallower seagrass areas.
Our productivity observations are the results of a community response to light availability in the visible spectrum. These communities included different species of corals, seagrass, crustose coralline algae, and benthic foraminifera, each one with particular light requirements and productivity rates. A detailed observation of photosynthetic responses and productivity of individual species was outside the scope of this study. In general, productivity in turf algae and seagrass beds can be higher than in adjacent coral areas. For example Jantzen et al. [72] found turf algae productivities two to four times higher than the productivity of corals during experiments in Thailand. Similarly, Naumann et al. [73] found that seagrasses contributed >50% of the lagoon-wide productivity in a Mexican reef, while corals contributed <1%. Mean net benthic productivity in our studied seagrass site at Sugarloaf Key was also higher compared to our studied patch reef (Figure 7). The depth difference between the seagrass site at a shallower depth (about −5 m deep) and the deeper patch reef (about −6 m deep) in October could have also contributed to the observed higher seagrass productivity. Fourqurean et al. [65] reported an increase of seagrass productivity with depth in the Florida Keys, from ~−2 m to ~−12 m, at a rate of 0.60 ± 0.02 mg g−1·day−1·m−1. Our studied seagrass was not a shallow site, which can help to explain the higher productivity compared to the patch reef.
In addition to total available light, we examined the relationship between water column light absorption at different wavelengths and productivity. Controlled laboratory studies have shown that captive corals subjected to shorter wavelengths in the ~blue region (~400 to ~500 nm) have high growth and photosynthesis rates [28,29]. As previously mentioned, we found relatively high values of total absorption (ap + ag) in the water column at shorter wavelengths (~400 to ~500 nm) for our study sites, resulting in lower light levels at these wavelengths reaching the coral community. Our results showed that higher total absorption at a range of wavelengths in the red region of the spectrum (666–699 nm) had a negative relationship with NEP, thus limiting NEP in the patch reef site (Table 4). These results indicate that the studied benthic coral community may utilize more red light than blue for photosynthesis, as previously reported by Mass et al. [74] for shallow water (~−3 m depth) corals in the Red Sea. Phytoplankton in the water column absorbing near 675 nm limits the amount of light at those wavelengths reaching the benthos. Chlorophyll-a has an absorbing peak at ~675 nm [75,76], and is a common pigment in phytoplankton and benthic organisms including seagrasses and zooxanthellae associated with corals [4]. The idea of light limitation by phytoplankton is also supported by our moored observations. A negative correlation was observed between productivity and moored chlorophyll-a fluorescence measurements for the patch reef in May and the seagrass in October. These results suggest that, although productivity in Sugarloaf Key is linked to the total amount of light, the availability of light in the red region of the visible spectrum (~675 nm) may limit NEP rates.
Empirical algorithms for remote sensing analyses are based on in situ data sets of inherent and apparent optical properties such as our observations in Sugarloaf Key. Although these algorithms have been tested widely [77,78,79,80], additional calibrations with in situ time series measurements during different tides and seasons are needed for improved remotely sensed water and bottom retrievals. Multispectral high-resolution satellite imagery has led to better coral reef maps [81,82,83] and successful estimations of coral reefs’ gross primary production [84], which provides an important geospatial tool for biodiversity and productivity assessments. Algorithms and models used for these purposes need to account for bottom depth, either measured or modeled [84,85,86]. Our results indicate that tides not only change water depth, but also the optical properties of the water when shallower or oceanic particulate and dissolved constituents are brought to coral reefs. Higher temporal resolution satellite sensors, with close to daily revisit times, may help improving these models by accounting for depth variations due to tides. In addition, higher spectral resolution satellite sensors can better “un-mix” optical signals in order to discriminate between oceanic and terrestrial organic matter sources, suspended materials, phytoplankton functional types, and shallow bottom types at different depths [86,87]. New satellite sensors expected to be launched in the next decade, including NASA’s PACE, Geo-CAPE and HyspIRI missions, will better fulfill the need for higher spectral, spatial and temporal resolution measurements for coastal zones.
5. Conclusions
Changes in the underwater light field can affect the productivity of coastal ecosystems. Yet, studies of the spectral quality of light reaching coral and seagrass ecosystems are scarce. We characterized the spectral quality of available light reaching the seafloor in a patch reef and a nearby seagrass site off Sugarloaf Key in the Florida Keys in May and October, 2012. Overall, using optical and hydrographic measurements, we found that higher sediment concentrations associated with resuspension by tidal currents and by winds during storms, and higher phytoplankton concentration associated with upwelling modified the light field in these areas, changing turbidity and chlorophyll-a concentration in the water column. These changes in light availability and spectral quality are important limiting factors of benthic productivity at Sugarloaf Key. These results indicate that ecosystems in the lower Florida Keys may be highly susceptible to natural or anthropogenic sources of suspended sediments and increased phytoplankton concentrations due to eutrophication events.
Acknowledgments
This research was funded by the NASA’s Airborne Science program for UAS Enabled Earth Science Program (NASA grant NNH10ZDA001NRA-UAS—High Resolution Assessment of Carbon Dynamics in Seagrass and Coral Reef Biomes), and by the Coastal and Marine Geology Program of the U.S. Geological Survey. We thank our project collaborators from the University of South Florida, the U.S. Geological Survey, the Florida Fish and Wildlife Conservation Commission, NOAA, NASA, and the Institute of Marine Affairs in Trinidad and Tobago. We also thank I. Romero for comments and support with statistical analysis, N. Smiley and M. Blouin for field support, and the R/V Playmate crew.
Author Contributions
Gerardo Toro-Farmer was the primary analyst and author for this work, designing and performing the optical and hydrographic experiments. Frank E. Muller-Karger conceived and designed the experiments, and supervised the research and writing of the paper. Maria Vega-Rodríguez and Sergio Cerdeira-Estrada performed the moored optical and hydrographic experiments, and analyzed the data. Nelson Melo conceived and performed the spatial distribution of hydrographic parameters at the surface experiment, and analyzed the data. Kimberly Yates conceived and performed the NEP experiments, and analyzed the data. Stanley R. Herwitz conceived and supervised the overall research and writing of the paper.
Conflicts of Interest
The authors declare no conflicts of interest.
References
- Paulay, G. Diversity and distribution of reef organisms. In Life and Death of Coral Reefs; Birkeland, C., Ed.; Chapman & Hall: New York, NY, USA, 1997; pp. 298–353. [Google Scholar]
- Costanza, R.; D’Arge, R.; de Groot, R.; Farber, S.; Grasso, M.; Hannon, B.; Limburg, K.; Naeem, S.; O’Neill, R.V.; Paruelo, J.; et al. The value of the world’s ecosystem services and natural capital. Nature 1997, 387, 253–260. [Google Scholar] [CrossRef]
- Short, F.; Carruthers, T.; Dennison, W.; Waycott, M. Global seagrass distribution and diversity: A bioregional model. J. Exp. Mar. Biol. Ecol. 2007, 350, 3–20. [Google Scholar] [CrossRef]
- Kirk, J.T.O. Light and Photosynthesis in Aquatic Ecosystems, 2nd ed.; Cambridge University Press: Cambridge, UK, 1994; p. 509. [Google Scholar]
- Morel, A.; Prieur, L. Analysis of variations in ocean color. Limnol. Oceanogr. 1977, 22, 709–722. [Google Scholar] [CrossRef]
- Morel, A. Optical Modeling of the Upper Ocean in Relation to Its Biogenous Matter Content (Case I Waters). J. Geophys. Res. 1988, 93, 10749–10768. [Google Scholar] [CrossRef]
- Coble, P.G.; Hu, C.; Gould, R.W., Jr.; Chang, G.; Wood, A.M. Colored Dissolved Organic in the Coastal Ocean: An Optical Tool for Coastal Zone Environmental Assessment and Management. Oceanography 2004, 17, 50–59. [Google Scholar] [CrossRef]
- Mobley, C.D.; Stramski, D.W.; Bissett, P.; Boss, E. Optical Modeling of Ocean Waters: Is the Case 1-Case 2 Classification Still Useful? Oceanography 2005, 17, 60–67. [Google Scholar] [CrossRef]
- Schofield, O.; Bergmann, T.; Oliver, M.J.; Irwin, A.; Kirkpatrick, G.; Bissett, W.P.; Moline, M.A.; Orrico, C. Inversion of spectral absorption in the optically complex coastal waters of the Mid-Atlantic Bight. J. Geophys. Res. 2004, 109, C12S04. [Google Scholar] [CrossRef]
- Boss, E.; Pegau, W.S.; Zaneveld, J.R.V.; Barnard, A.H. Spatial and temporal variability of absorption by dissolved material at a continental shelf. J. Geophys. Res. 2001, 106, 9499–9507. [Google Scholar] [CrossRef]
- Fortes, M.D. Wetland conservation and management in the Philippines: Where are we now? The Case of Seagrass and Mangrove. In Wetlands Ecosystems in Asia; Wong, H.W., Ed.; Elsevier: Amsterdam, The Netherlands, 2004; pp. 233–262. [Google Scholar]
- Chen, Z.; Hu, C.; Muller-Karger, F.E.; Luther, M.E. Short-term variability of suspended sediment and phytoplankton in Tampa Bay, Florida: Observations from a coastal oceanographic tower and ocean color satellites. Estuar. Coast. Shelf Sci. 2010, 89, 62–72. [Google Scholar] [CrossRef]
- Jones, B.H.; Lee, C.M.; Toro-Farmer, G.; Boss, E.S.; Gregg, M.C.; Villanoy, C.L. Tidally driven exchange in an Archipelago Strait: Biological and optical responses. Oceanography 2011, 24, 142–155. [Google Scholar] [CrossRef]
- Farfán, L.; D’Sa, E.; Liu, K.; Rivera-Monroy, V. Tropical cyclone impacts on coastal regions: The case of the Yucatán and the Baja California Peninsulas, Mexico. Estuaries Coasts 2014, 37, 1388–1402. [Google Scholar] [CrossRef]
- Edinger, E.N.; Jompa, J.; Limmon, G.V.; Widjatmoko, W.; Risk, M.J. Reef degradation and coral biodiversity in indonesia: Effects of land-based pollution, destructive fishing practices and changes over time. Mar. Pollut. Bull. 1998, 36, 617–630. [Google Scholar] [CrossRef]
- Te, F.T. Turbidity and its effects on corals: A model using the extinction coefficient (k) of photosynthetic active radiance (PAR). In Proceedings of the 8th International Coral Reef Symposium, Panama City, Panama, 24–29 June 1996; Volume 2, pp. 1899–1904.
- Carpenter, R.C. Relationships between primary production and irradiance in coral reef algal communities. Limnol. Oceanogr. 1985, 30, 784–793. [Google Scholar] [CrossRef]
- Barnes, D.J.; Chalker, B.E. Calcification and photosynthesis in reef-building corals and algae. In Ecosystems of the World 25: Coral Reefs; Dubinsky, Z., Ed.; Elsevier: Amsterdam, The Netherlands, 1990; pp. 109–131. [Google Scholar]
- Falkowski, P.G.; Jokiel, P.L.; Kinzie, R.A.I. Irradiance and corals. In Ecosystems of the World 25: Coral Reefs; Dubinsky, Z., Ed.; Elsevier: Amsterdam, The Netherlands, 1990; pp. 89–107. [Google Scholar]
- Yates, K.K.; Halley, R.B. Measuring coral reef community metabolism using new benthic chamber technology. Coral Reefs 2003, 22, 247–255. [Google Scholar] [CrossRef]
- Falter, J.L.; Lowe, R.J.; Atkinson, M.J.; Cuet, P. Seasonal coupling and de-coupling of net calcification rates from coral reef metabolism and carbonate chemistry at Ningaloo Reef, Western Australia. J. Geophys. Res. 2012, 117, C05003. [Google Scholar] [CrossRef]
- Venti, A.; Andersson, A.; Langdon, C. Multiple driving factors explain spatial and temporal variability in coral calcification rates on the Bermuda platform. Coral Reefs 2014, 33, 1–19. [Google Scholar]
- Larcombe, P.; Ridd, P.V.; Prytz, A.; Wilson, B. Factors controlling suspended sediment on inner-shelf coral reefs, Townsville, Australia. Coral Reefs 1995, 14, 163–171. [Google Scholar] [CrossRef]
- Boss, E.; Zaneveld, J.R.V. The effect of bottom substrate on inherent optical properties: Evidence of biogeochemical processes. Limnol. Oceanogr. 2003, 48, 346–354. [Google Scholar] [CrossRef]
- Ogston, A.S.; Storlazzi, C.D.; Field, M.E.; Presto, M.K. Sediment resuspension and transport patterns on a fringing reef flat, Molokai, Hawaii. Coral Reefs 2004, 23, 559–569. [Google Scholar]
- Piniak, G.A.; Storlazzi, C.D. Diurnal variability in turbidity and coral fluorescence on a fringing reef flat: Southern Molokai, Hawaii. Estuar. Coast. Shelf Sci. 2008, 77, 56–64. [Google Scholar] [CrossRef]
- Rocha, R.J.M.; Calado, R.; Cartaxana, P.; Furtado, J.; Serôdio, J. Photobiology and growth of leather coral Sarcophyton cf. glaucum fragments stocked under low light in a recirculated system. Aquaculture 2013, 414–415, 235–242. [Google Scholar] [CrossRef]
- Rocha, R.J.M.; Pimentel, T.; Serôdio, J.; Rosa, R.; Calado, R. Comparative performance of light emitting plasma (LEP) and light emitting diode (LED) in ex situ aquaculture of scleractinian corals. Aquaculture 2013, 402–403, 38–45. [Google Scholar] [CrossRef]
- Wijgerde, T.; van Melis, A.; Silva, C.I.F.; Leal, M.C.; Vogels, L.; Mutter, C.; Osinga, R. Red light represses the photophysiology of the scleractinian coral Stylophora pistillata. PLoS ONE 2014, 9, e92781. [Google Scholar]
- Blondeau-Patissier, D.; Brando, V.E.; Oubelkheir, K.; Dekker, A.G.; Clementson, L.A.; Daniel, P. Bio-optical variability of the absorption and scattering properties of the Queensland inshore and reef waters, Australia. J. Geophys. Res. 2009, 114, C05003. [Google Scholar] [CrossRef]
- Dierssen, H.M.; Zimmerman, R.C.; Burdige, D.J. Optics and remote sensing of Bahamian carbonate sediment whitings and potential relationship to wind-driven Langmuir circulation. Biogeosciences 2009, 6, 487–500. [Google Scholar] [CrossRef]
- McPherson, M.; Hill, V.; Zimmerman, R.; Dierssen, H. The optical properties of Greater Florida Bay: Implications for seagrass abundance. Estuaries Coasts 2011, 34, 1150–1160. [Google Scholar] [CrossRef]
- Schlacher, T.A.; Stark, J.; Fischer, A.B.P. Evaluation of artificial light regimes and substrate types for aquaria propagation of the staghorn coral Acropora solitaryensis. Aquaculture 2007, 269, 278–289. [Google Scholar] [CrossRef]
- Hochberg, E.J.; Atkinson, M.J.; Apprill, A.; Andréfouët, S. Spectral reflectance of coral. Coral Reefs 2004, 23, 84–95. [Google Scholar] [CrossRef]
- Mobley, C.D. Light and Water: Radiative Transfer in Natural Waters; Academic Press: San Diego, CA, USA, 1994; p. 592. [Google Scholar]
- Zaneveld, J.R.V.; Twardowski, M.J.; Barnard, A.; Lewis, M.R. Introduction to radiative transfer. In Remote Sensing of Coastal Aquatic Environments; Miller, R.L., del Castillo, C.E., Mckee, B.A., Eds.; Springer Netherlands: Dordrecht, The Netherlands, 2005; pp. 1–20. [Google Scholar]
- Woźniak, B.; Dera, J. Light Absorption in Sea Water; Springer: New York, NY, USA, 2007. [Google Scholar]
- Arnone, R.A.; Wood, M.; Gould, R.W., Jr. The Evolution of Optical Water Mass Classification. Oceanography 2004, 17, 14–15. [Google Scholar] [CrossRef]
- Andréfouët, S.; Mumby, P.; McField, M.; Hu, C.; Muller-Karger, F. Revisiting coral reef connectivity. Coral Reefs 2002, 21, 43–48. [Google Scholar] [CrossRef]
- Hu, C.; Hackett, K.E.; Callahan, M.K.; Andréfouët, S.; Wheaton, J.L.; Porter, J.W.; Muller-Karger, F.E. The 2002 ocean color anomaly in the Florida Bight: A cause of local coral reef decline? Geophys. Res. Lett. 2003, 30, 1151. [Google Scholar] [CrossRef]
- Hu, C.; Muller-Karger, F.E.; Vargo, G.A.; Neely, M.B.; Johns, E. Linkages between coastal runoff and the Florida Keys ecosystem: A study of a dark plume event. Geophys. Res. Lett. 2004, 31, L15307. [Google Scholar] [CrossRef]
- Olascoaga, M.J.; Beron-Vera, F.J.; Brand, L.E.; Kocak, H. Tracing the early development of harmful algal blooms on the West Florida Shelf with the aid of Lagrangian coherent structures. J. Geophys. Res. 2008, 113, C12014. [Google Scholar] [CrossRef] [PubMed]
- Cannizzaro, J.P.; Hu, C.; English, D.C.; Carder, K.L.; Heil, C.A.; Müller-Karger, F.E. Detection of Karenia brevis blooms on the west Florida shelf using in situ backscattering and fluorescence data. Harmful Algae 2009, 8, 898–909. [Google Scholar] [CrossRef]
- Spalding, M.D.; Ravilious, C.; Green, E.P. World Atlas of Coral Reefs; Universtity of California Press: Berkeley, CA, USA, 2001; p. 416. [Google Scholar]
- Lee, T.N.; Smith, N. Volume transport variability through the Florida Keys tidal channels. Cont. Shelf Res. 2002, 22, 1361–1377. [Google Scholar] [CrossRef]
- Smith, N.P.; Lee, T.N. Volume transport through tidal channels in the Middle Florida Keys. J. Coast. Res. 2003, 19, 254–260. [Google Scholar]
- Smith, N.P. Long-Term gulf-to-Atlantic transport through tidal channels in the Florida Keys. Bull. Mar. Sci. 1994, 54, 602–609. [Google Scholar]
- Sullivan, J.M.; Twardowski, M.S.; Zaneveld, J.R.V.; Moore, C.M.; Barnard, A.H.; Donaghay, P.L.; Rhoades, B. Hyperspectral temperature and salt dependencies of absorption by water and heavy water in the 400–750 nm spectral range. Appl. Opt. 2006, 45, 5294–5309. [Google Scholar] [CrossRef] [PubMed]
- Zaneveld, J.R.V.; Kitchen, J.C.; Moore, C.C. Scattering error correction of reflecting-tube absorption meters. Proc. SPIE 1994, 2258. [Google Scholar] [CrossRef]
- Yates, K.K.; Halley, R.B. CO32− concentration and pCO2 thresholds for calcification and dissolution on the Molokai reef flat, Hawaii. Biogeosciences 2006, 3, 357–369. [Google Scholar] [CrossRef]
- Yates, K.K.; Halley, R.B. Diurnal variation in rates of calcification and carbonate sediment dissolution in Florida Bay. Estuaries Coasts 2006, 29, 24–39. [Google Scholar] [CrossRef]
- Morel, A.; Smith, R.C. Relation between total quanta and total energy for aquatic photosynthesis. Limnol. Oceanogr. 1974, 19, 591–600. [Google Scholar] [CrossRef]
- Cullen, J.J.; Lewis, M.R. Biological processes and optical measurements near the sea surface: Some issues relevant to remote sensing. J. Geophys. Res. 1995, 100, 13255–13266. [Google Scholar] [CrossRef]
- Sackmann, B.S.; Perry, M.J.; Eriksen, C.C. Seaglider observations of variability in daytime fluorescence quenching of chlorophyll-a in Northeastern Pacific coastal waters. Biogeosci. Discuss 2008, 5, 2839–2865. [Google Scholar] [CrossRef]
- Sponaugle, S.; Lee, T.; Kourafalou, V.; Pinkard, D. Florida current frontal eddies and the settlement of coral reef fishes. Limonol. Oceanogr. 2005, 50, 1033–1048. [Google Scholar] [CrossRef]
- Monismith, S.G. Hydrodynamics of Coral Reefs. Annu. Rev. Fluid Mech. 2006, 39, 37–55. [Google Scholar] [CrossRef]
- Boss, E.; Pegau, W.S.; Gardner, W.D.; Zaneveld, J.R.V.; Barnard, A.H.; Twardowski, M.S.; Chang, G.C.; Dickey, T.D. Spectral particulate attenuation and particle size distribution in the bottom boundary layer of a continental shelf. J. Geophys. Res. 2001, 106, 9509–9516. [Google Scholar] [CrossRef]
- Otis, D.B.; Carder, K.L.; English, D.C.; Ivey, J.E. CDOM transport from the Bahamas Banks. Coral Reefs 2004, 23, 152–160. [Google Scholar] [CrossRef]
- Ouillon, S.; Douillet, P.; Lefebvre, J.P.; le Gendre, R.; Jouon, A.; Bonneton, P.; Fernandez, J.M.; Chevillon, C.; Magand, O.; Lefevre, J.; et al. Circulation and suspended sediment transport in a coral reef lagoon: The south-west lagoon of New Caledonia. Mar. Pollut. Bull. 2010, 61, 269–296. [Google Scholar] [CrossRef] [PubMed]
- Leichter, J.J.; Wing, S.R.; Miller, S.L.; Denny, M.W. Pulsed delivery of subthermocline water to Conch Reef (Florida Keys) by internal tidal bores. Limnol. Oceanogr. 1996, 41, 1490–1501. [Google Scholar] [CrossRef]
- Leichter, J.J.; Stewart, H.L.; Miller, S.L. Episodic nutrient transport to Florida coral reefs. Limnol. Oceanogr. 2003, 48, 1394–1407. [Google Scholar] [CrossRef]
- Jouon, A.; Ouillon, S.; Douillet, P.; Lefebvre, J.P.; Fernandez, J.M.; Mari, X.; Froidefond, J.-M. Spatio-temporal variability in suspended particulate matter concentration and the role of aggregation on size distribution in a coral reef lagoon. Mar. Geol. 2008, 256, 36–48. [Google Scholar] [CrossRef]
- Barron, M.G.; Vivian, D.N.; Yee, S.H.; Santavy, D.L. Methods to estimate solar radiation dosimetry in coral reefs using remote sensed, modeled, and in situ data. Environ. Monit. Assess. 2009, 151, 445–455. [Google Scholar] [CrossRef] [PubMed]
- Briceño, H.O.; Boyer, J.N.; Castro, J.; Harlem, P. Biogeochemical classification of South Florida’s estuarine and coastal waters. Mar. Pollut. Bull. 2013, 75, 187–204. [Google Scholar] [CrossRef] [PubMed]
- Fourqurean, J.W.; Willsie, A.; Rose, C.D.; Rutten, L.M. Spatial and temporal pattern in seagrass community composition and productivity in South Florida. Mar. Biol. 2001, 138, 341–354. [Google Scholar] [CrossRef]
- Kuffner, I.B.; Hickey, T.D.; Morrison, J.M. Calcification rates of the massive coral Siderastrea siderea and crustose coralline algae along the Florida Keys (USA) outer-reef tract. Coral Reefs 2013, 32, 987–997. [Google Scholar] [CrossRef]
- Zimmerman, R.C. Light and photosynthesis in seagrass meadows. In Seagrasses: Biology, Ecology and Conservation; Larkum, A., Orth, R.J., Duarte, C., Eds.; Springer Netherlands: Dordrecht, The Netherlands, 2006; pp. 303–321. [Google Scholar]
- Nakamura, T.; Nakamori, T. Estimation of photosynthesis and calcification rates at a fringing reef by accounting for diurnal variations and the zonation of coral reef communities on reef flat and slope: A case study for the Shiraho reef, Ishigaki Island, southwest Japan. Coral Reefs 2009, 28, 229–250. [Google Scholar] [CrossRef]
- Schutter, M.; van Velthoven, B.; Janse, M.; Osinga, R.; Janssen, M.; Wijffels, R.; Verreth, J. The effect of irradiance on long-term skeletal growth and net photosynthesis in Galaxea fascicularis under four light conditions. J. Exp. Mar. Biol. Ecol. 2008, 367, 75–80. [Google Scholar] [CrossRef]
- Turk, D.; Yates, K.; Vega-Rodriguez, M.; Toro-Farmer, G.; L’Esperance, C.; Melo, N.; Ramsewak, D.; Dowd, M.; Cerdeira Estrada, S.; Muller-Karger, F.; et al. Community metabolism in shallow coral reef and seagrass ecosystems, lower Florida Keys. Mar. Ecol. Prog. Ser. 2015, 538, 35–52. [Google Scholar] [CrossRef]
- Lapointe, B.E.; Barile, P.J.; Matzie, W.R. Anthropogenic nutrient enrichment of seagrass and coral reef communities in the Lower Florida Keys: Discrimination of local versus regional nitrogen sources. J. Exp. Mar. Biol. Ecol. 2004, 308, 23–58. [Google Scholar] [CrossRef]
- Jantzen, C.; Schmidt, G.M.; Wild, C.; Roder, C.; Khokiattiwong, S.; Richter, C. Benthic reef primary production in response to large amplitude internal waves at the Similan Islands (Andaman Sea, Thailand). PLoS ONE 2013, 8, e81834. [Google Scholar]
- Naumann, M.S.; Jantzen, C.; Haas, A.F.; Iglesias-Prieto, R.; Wild, C. Benthic primary production budget of a Caribbean reef lagoon (Puerto Morelos, Mexico). PLoS ONE 2013, 8, e82923. [Google Scholar]
- Mass, T.; Kline, D.I.; Roopin, M.; Veal, C.J.; Cohen, S.; Iluz, D.; Levy, O. The spectral quality of light is a key driver of photosynthesis and photoadaptation in Stylophora pistillata colonies from different depths in the Red Sea. J. Exp. Biol. 2010, 213, 4084–4091. [Google Scholar] [CrossRef] [PubMed]
- Bidigare, R.R.; Ondrusek, M.E.; Morrow, J.H.; Kiefer, D.A. In-Vivo absorption properties of algal pigments. Proc. SPIE 1990, 1302, 290–302. [Google Scholar]
- Aguirre-Gomez, R.; Weeks, A.R.; Boxall, S.R. The identification of phytoplankton pigments from absorption spectra. Int. J. Remote Sens. 2001, 22, 315–338. [Google Scholar] [CrossRef]
- IOCCG. Remote Sensing of Inherent Optical Properties: Fundamentals, Tests of Algorithms, and Applications; Reports of the International Ocean-Colour Coordinating Group, No. 5; Lee, Z.P., Ed.; IOCCG: Dartmouth, NS, Canada, 2006; p. 126. [Google Scholar]
- Dupouy, C.; Neveux, J.; Ouillon, S.; Frouin, R.; Murakami, H.; Hochard, S.; Dirberg, G. Inherent optical properties and satellite retrieval of chlorophyll concentration in the lagoon and open ocean waters of New Caledonia. Mar. Pollut. Bull. 2010, 61, 503–518. [Google Scholar] [CrossRef] [PubMed]
- Hu, C.; Cannizzaro, J.; Carder, K.L.; Muller-Karger, F.E.; Hardy, R. Remote detection of Trichodesmium blooms in optically complex coastal waters: Examples with MODIS full-spectral data. Remote Sens. Environ. 2010, 114, 2048–2058. [Google Scholar] [CrossRef]
- Volpe, V.; Silvestri, S.; Marani, M. Remote sensing retrieval of suspended sediment concentration in shallow waters. Remote Sens. Environ. 2011, 115, 44–54. [Google Scholar] [CrossRef]
- Hochberg, E.J.; Andrefouet, S.; Tyler, M.R. Sea surface correction of high spatial resolution ikonos images to improve bottom mapping in near-shore environments. IEEE Trans. Geosci. Remote Sens. 2003, 41, 1724–1729. [Google Scholar] [CrossRef]
- Purkis, S.J.; Pasterkamp, R. Integrating in situ reef-top reflectance spectra with Landsat TM imagery to aid shallow-tropical benthic habitat mapping. Coral Reefs 2004, 23, 5–20. [Google Scholar] [CrossRef]
- Palandro, D.A.; Andréfouët, S.; Hu, C.; Hallock, P.; Muller-Karger, F.E.; Dustan, P.; Callahan, M.K.; Kranenburg, C.; Beaver, C.R. Quantification of two decades of shallow-water coral reef habitat decline in the Florida Keys National Marine Sanctuary using Landsat data (1984–2002). Remote Sens. Environ. 2008, 112, 3388–3399. [Google Scholar] [CrossRef]
- Hochberg, E.; Atkinson, M. Coral reef benthic productivity based on optical absorptance and light-use efficiency. Coral Reefs 2008, 27, 49–59. [Google Scholar] [CrossRef]
- Lee, Z.; Carder, K.L.; Mobley, C.D.; Steward, R.G.; Patch, J.S. Hyperspectral Remote Sensing for Shallow Waters. 2. Deriving Bottom Depths and Water Properties by Optimization. Appl. Opt. 1999, 38, 3831–3843. [Google Scholar] [CrossRef] [PubMed]
- Botha, E.J.; Brando, V.E.; Anstee, J.M.; Dekker, A.G.; Sagar, S. Increased spectral resolution enhances coral detection under varying water conditions. Remote Sens. Environ. 2013, 131, 247–261. [Google Scholar] [CrossRef]
- Devred, E.; Turpie, K.R.; Moses, W.; Klemas, V.V.; Moisan, T.; Babin, M.; Toro-Farmer, G.; Forget, M.-H.; Jo, Y.-H. Future retrievals of water column bio-optical properties using the Hyperspectral Infrared Imager (HyspIRI). Remote Sens. 2013, 5, 6812–6837. [Google Scholar] [CrossRef]
© 2016 by the authors; licensee MDPI, Basel, Switzerland. This article is an open access article distributed under the terms and conditions of the Creative Commons by Attribution (CC-BY) license (http://creativecommons.org/licenses/by/4.0/).