This section presents the results obtained from the application of the simplified polarimetric soil moisture retrieval method to the temporal datasets of UAVSAR acquired during SMAPVEX12. To understand and evaluate the advantages and the limitations of this algorithm, the temporal variations of the scattering mechanisms (before and after the removal of the vegetation volume component) are first analyzed. Then, soil moisture retrieval results are presented and discussed.
4.1. Temporal Variation of Scattering Mechanisms
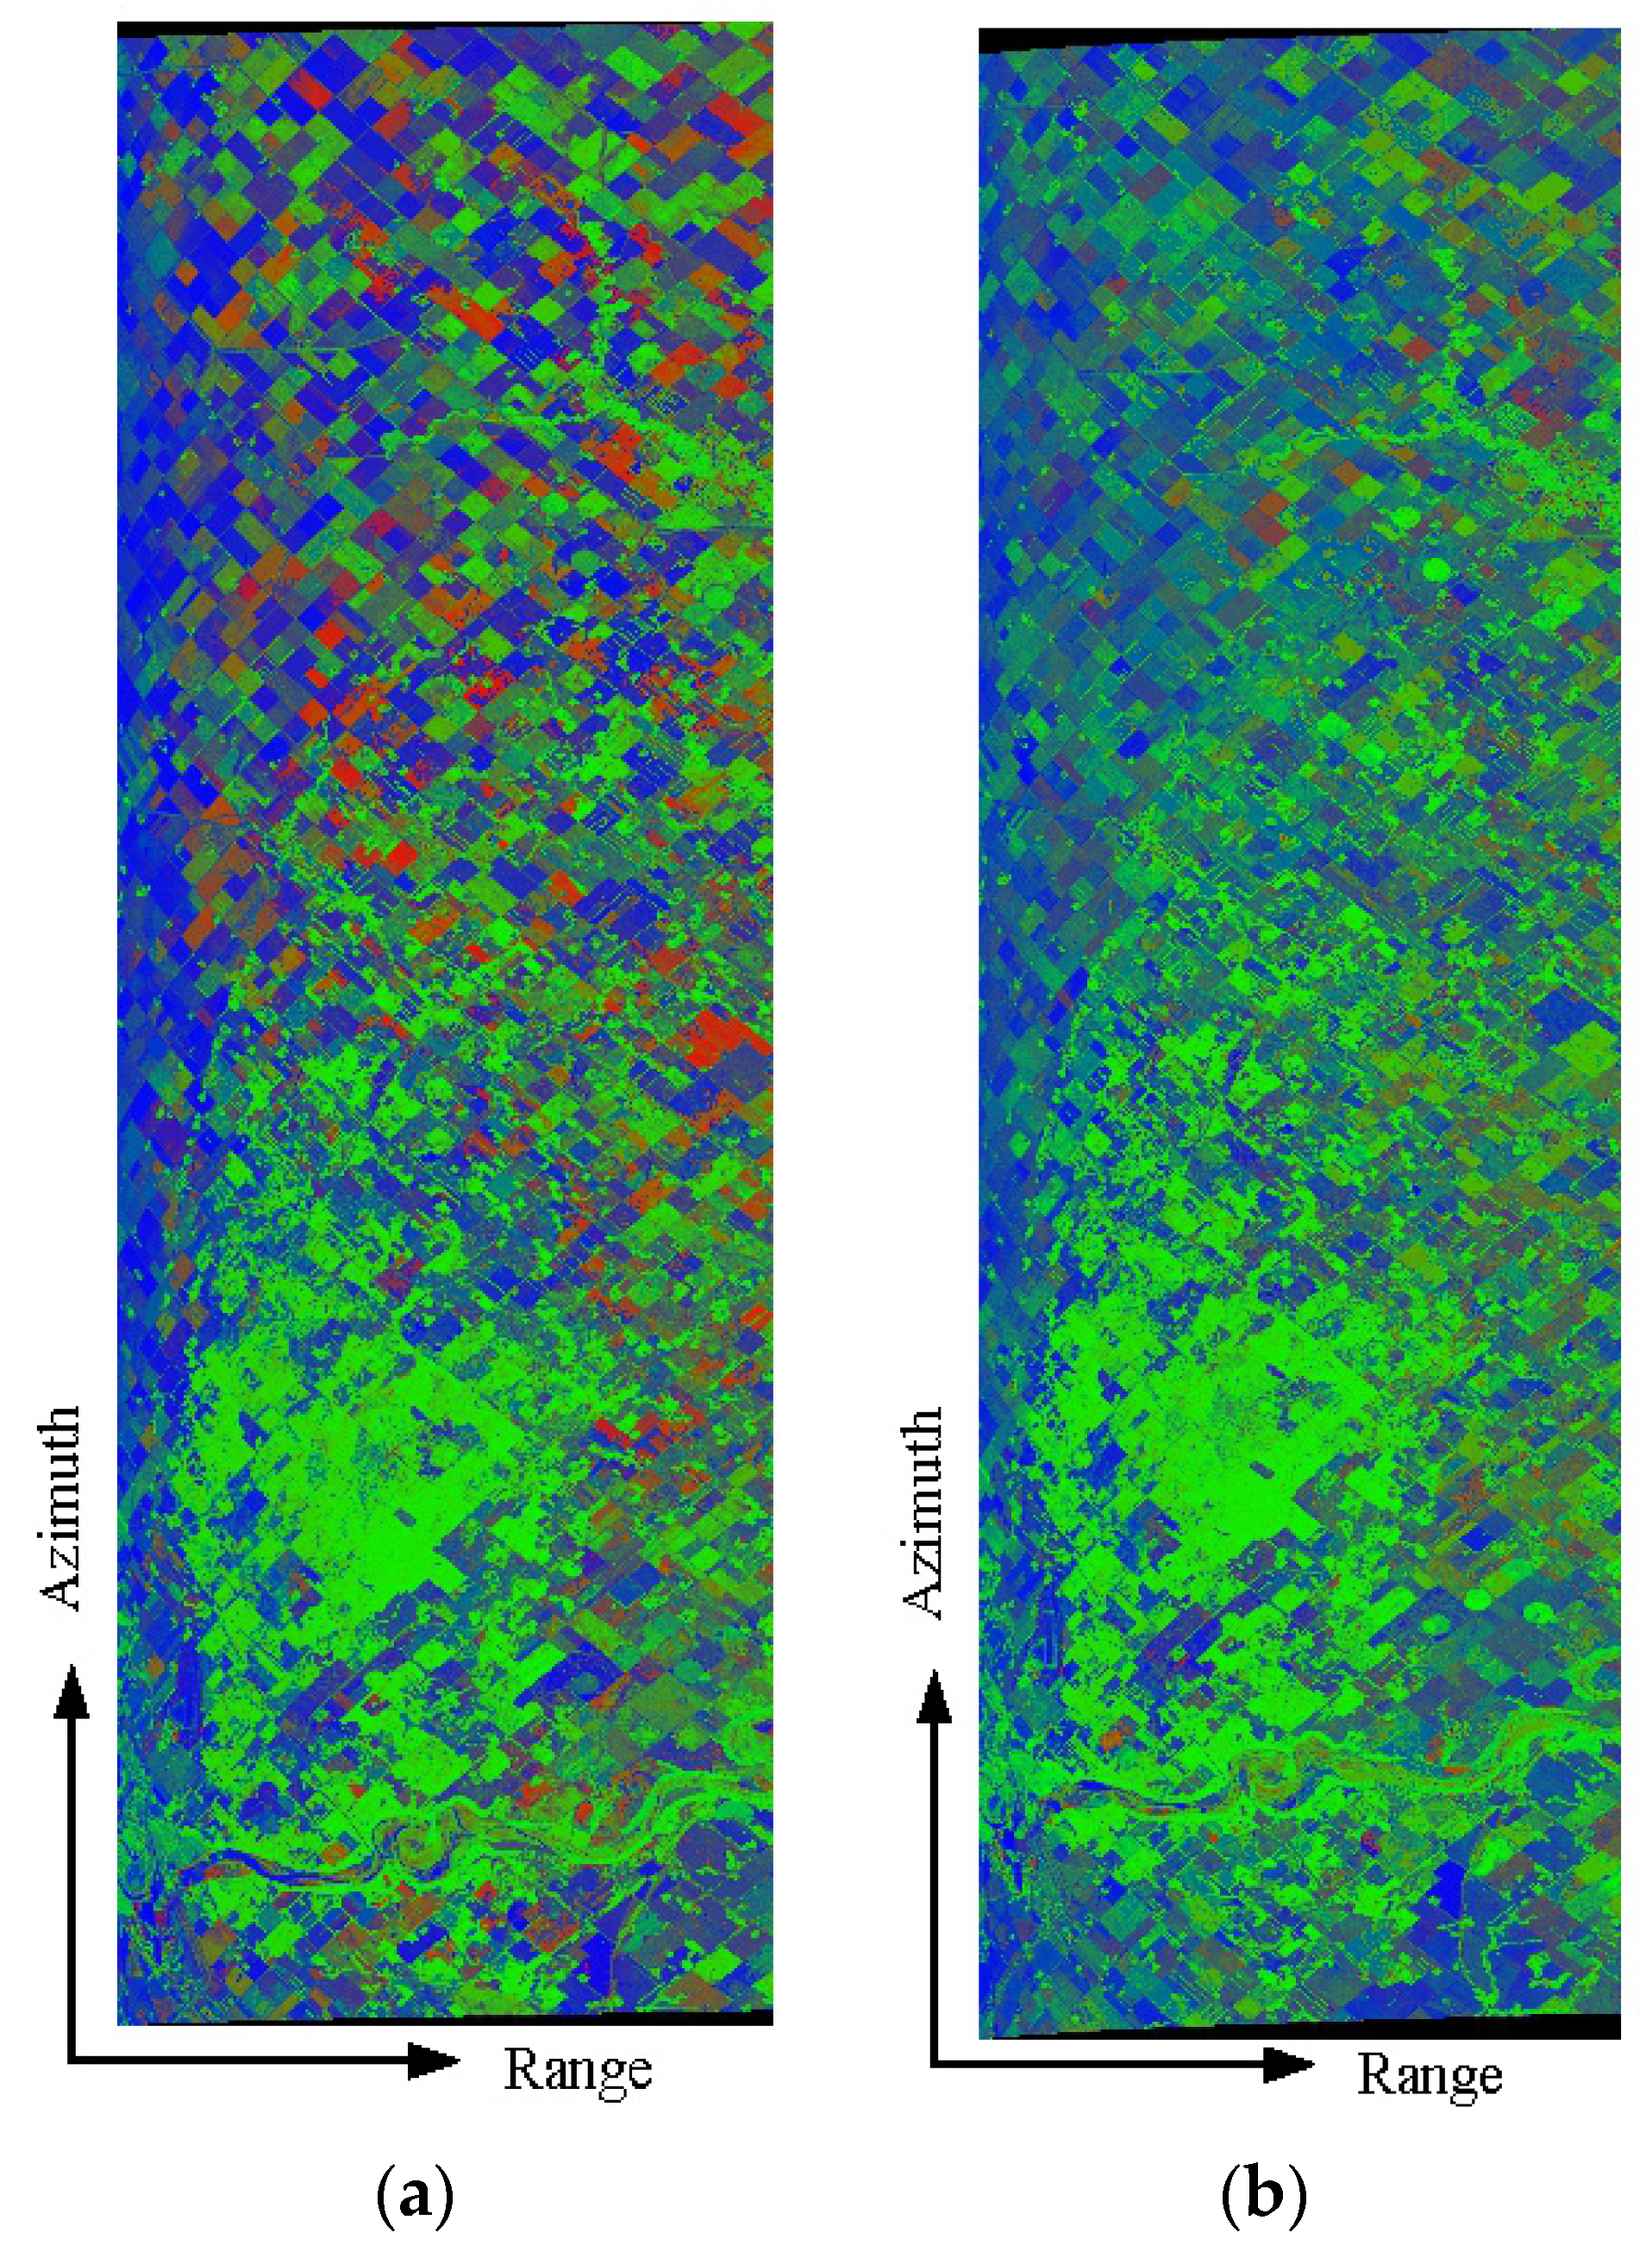
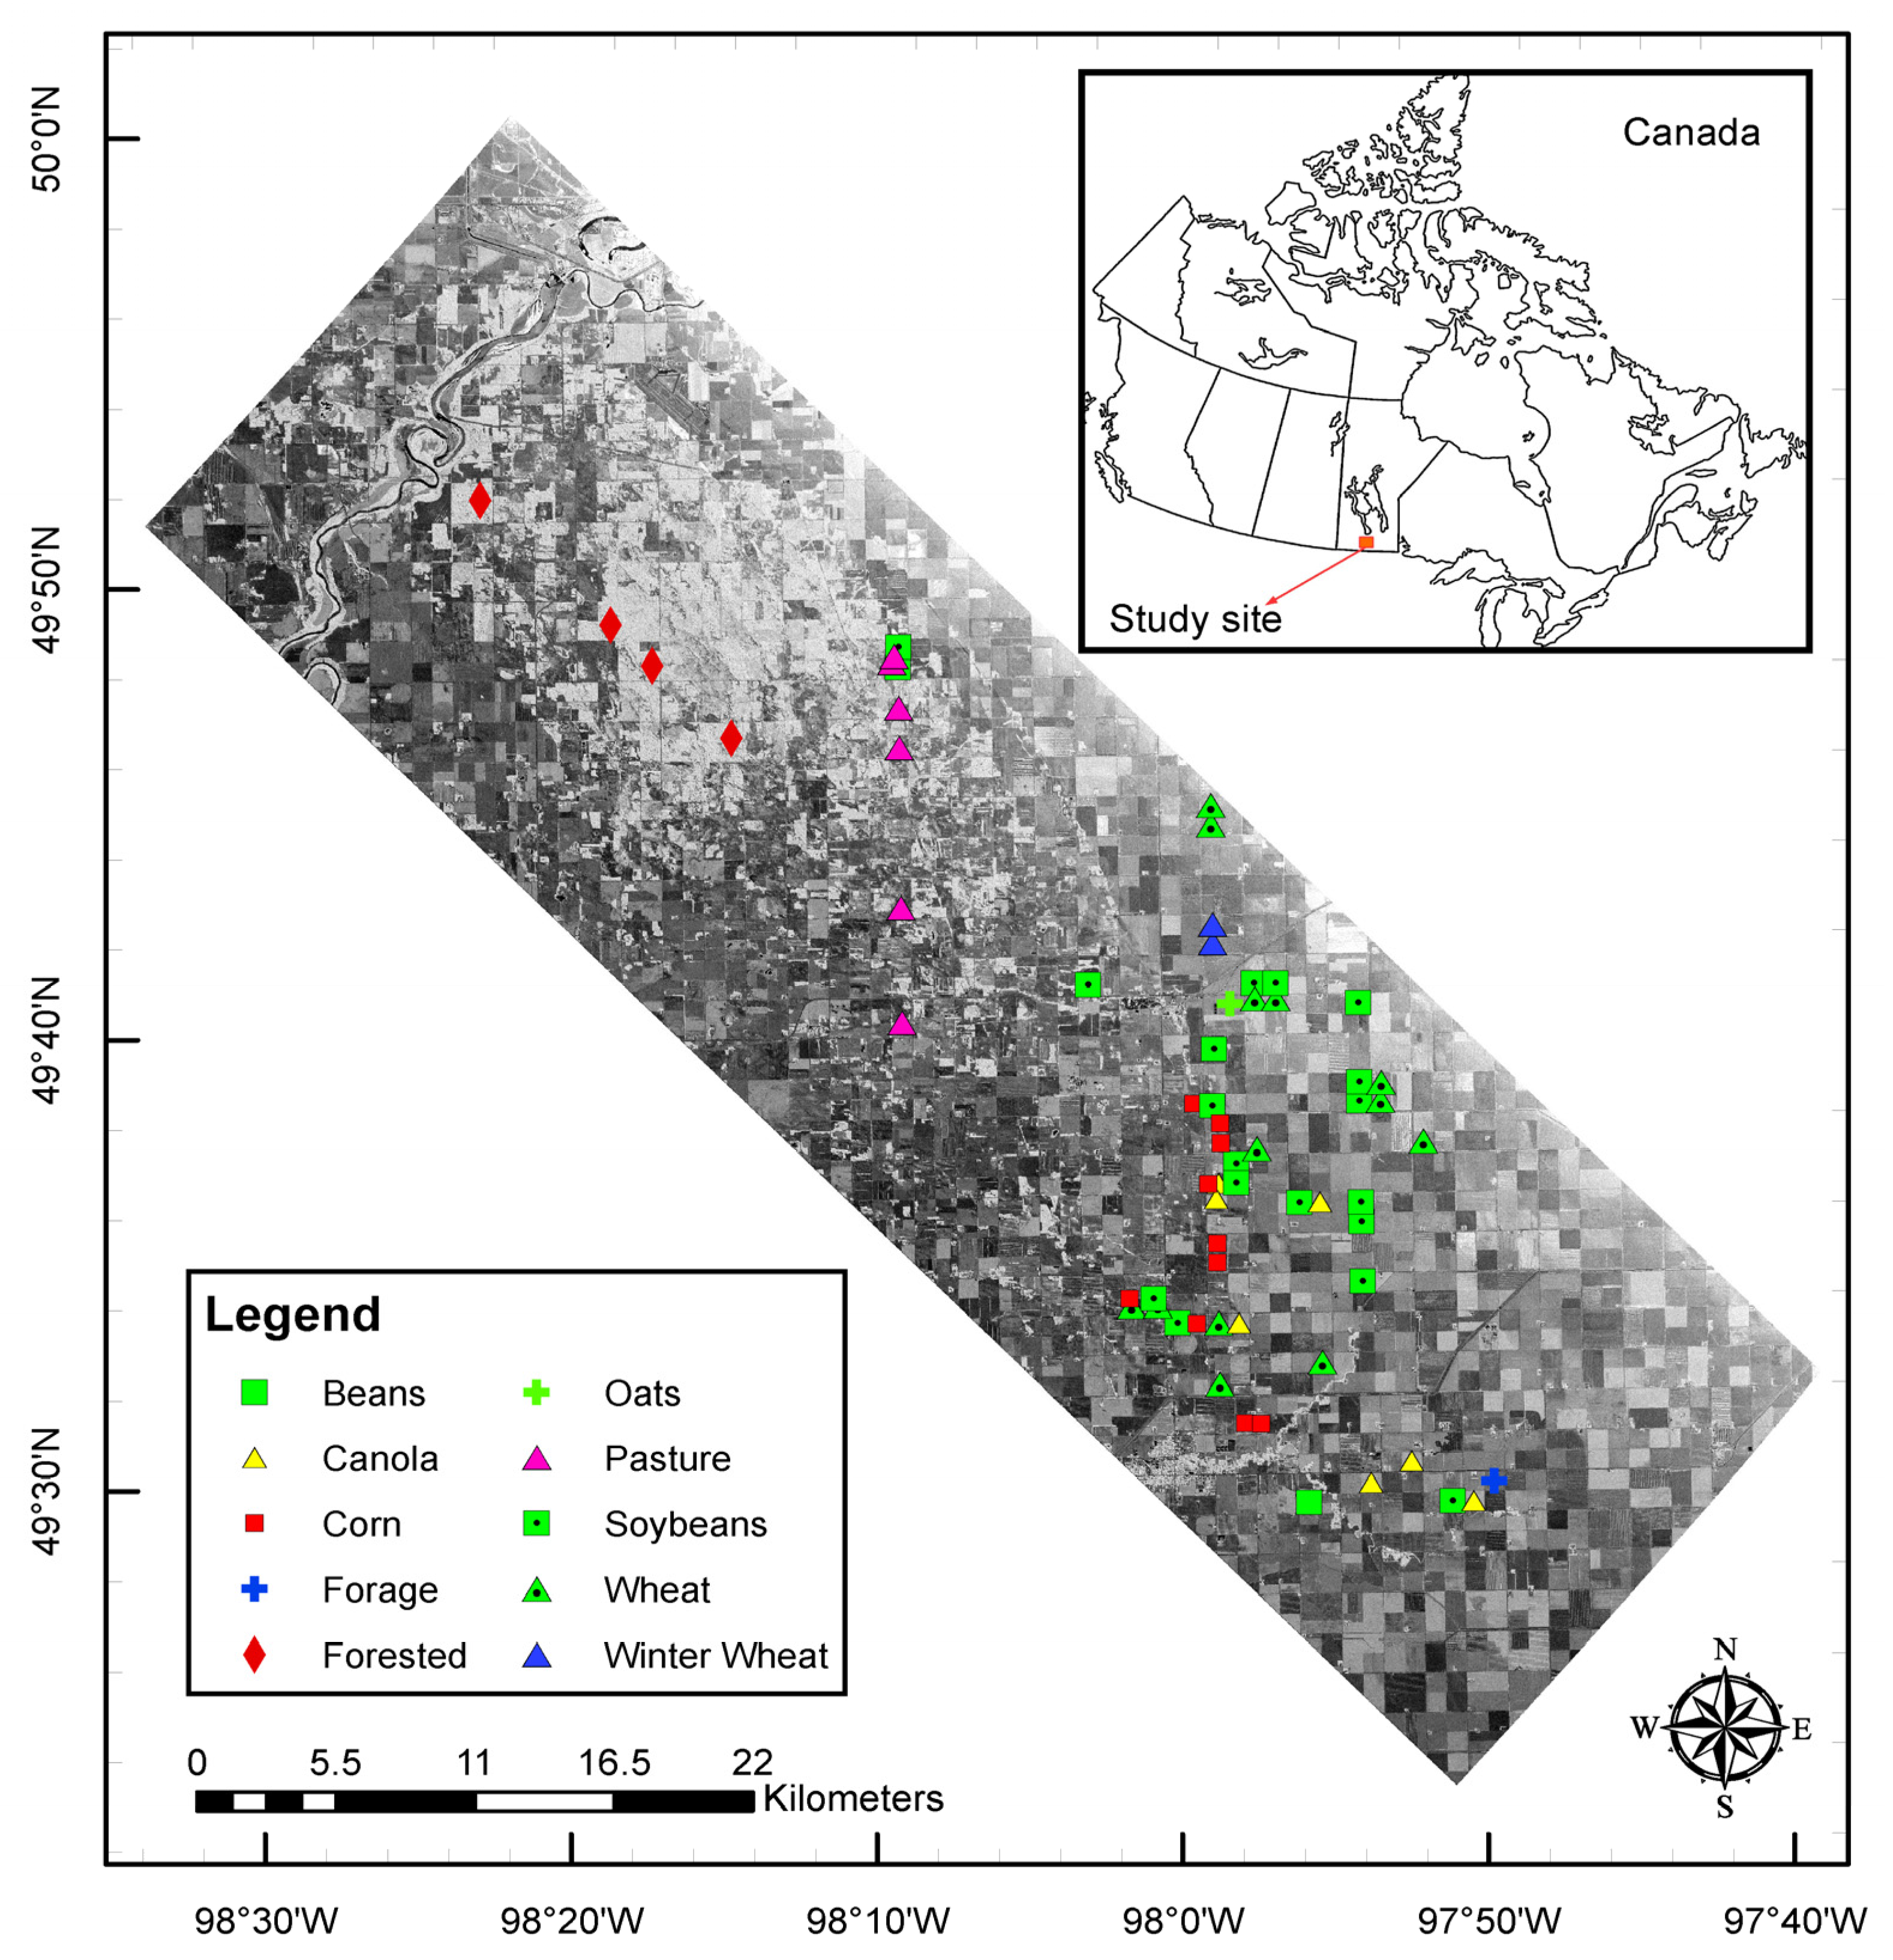
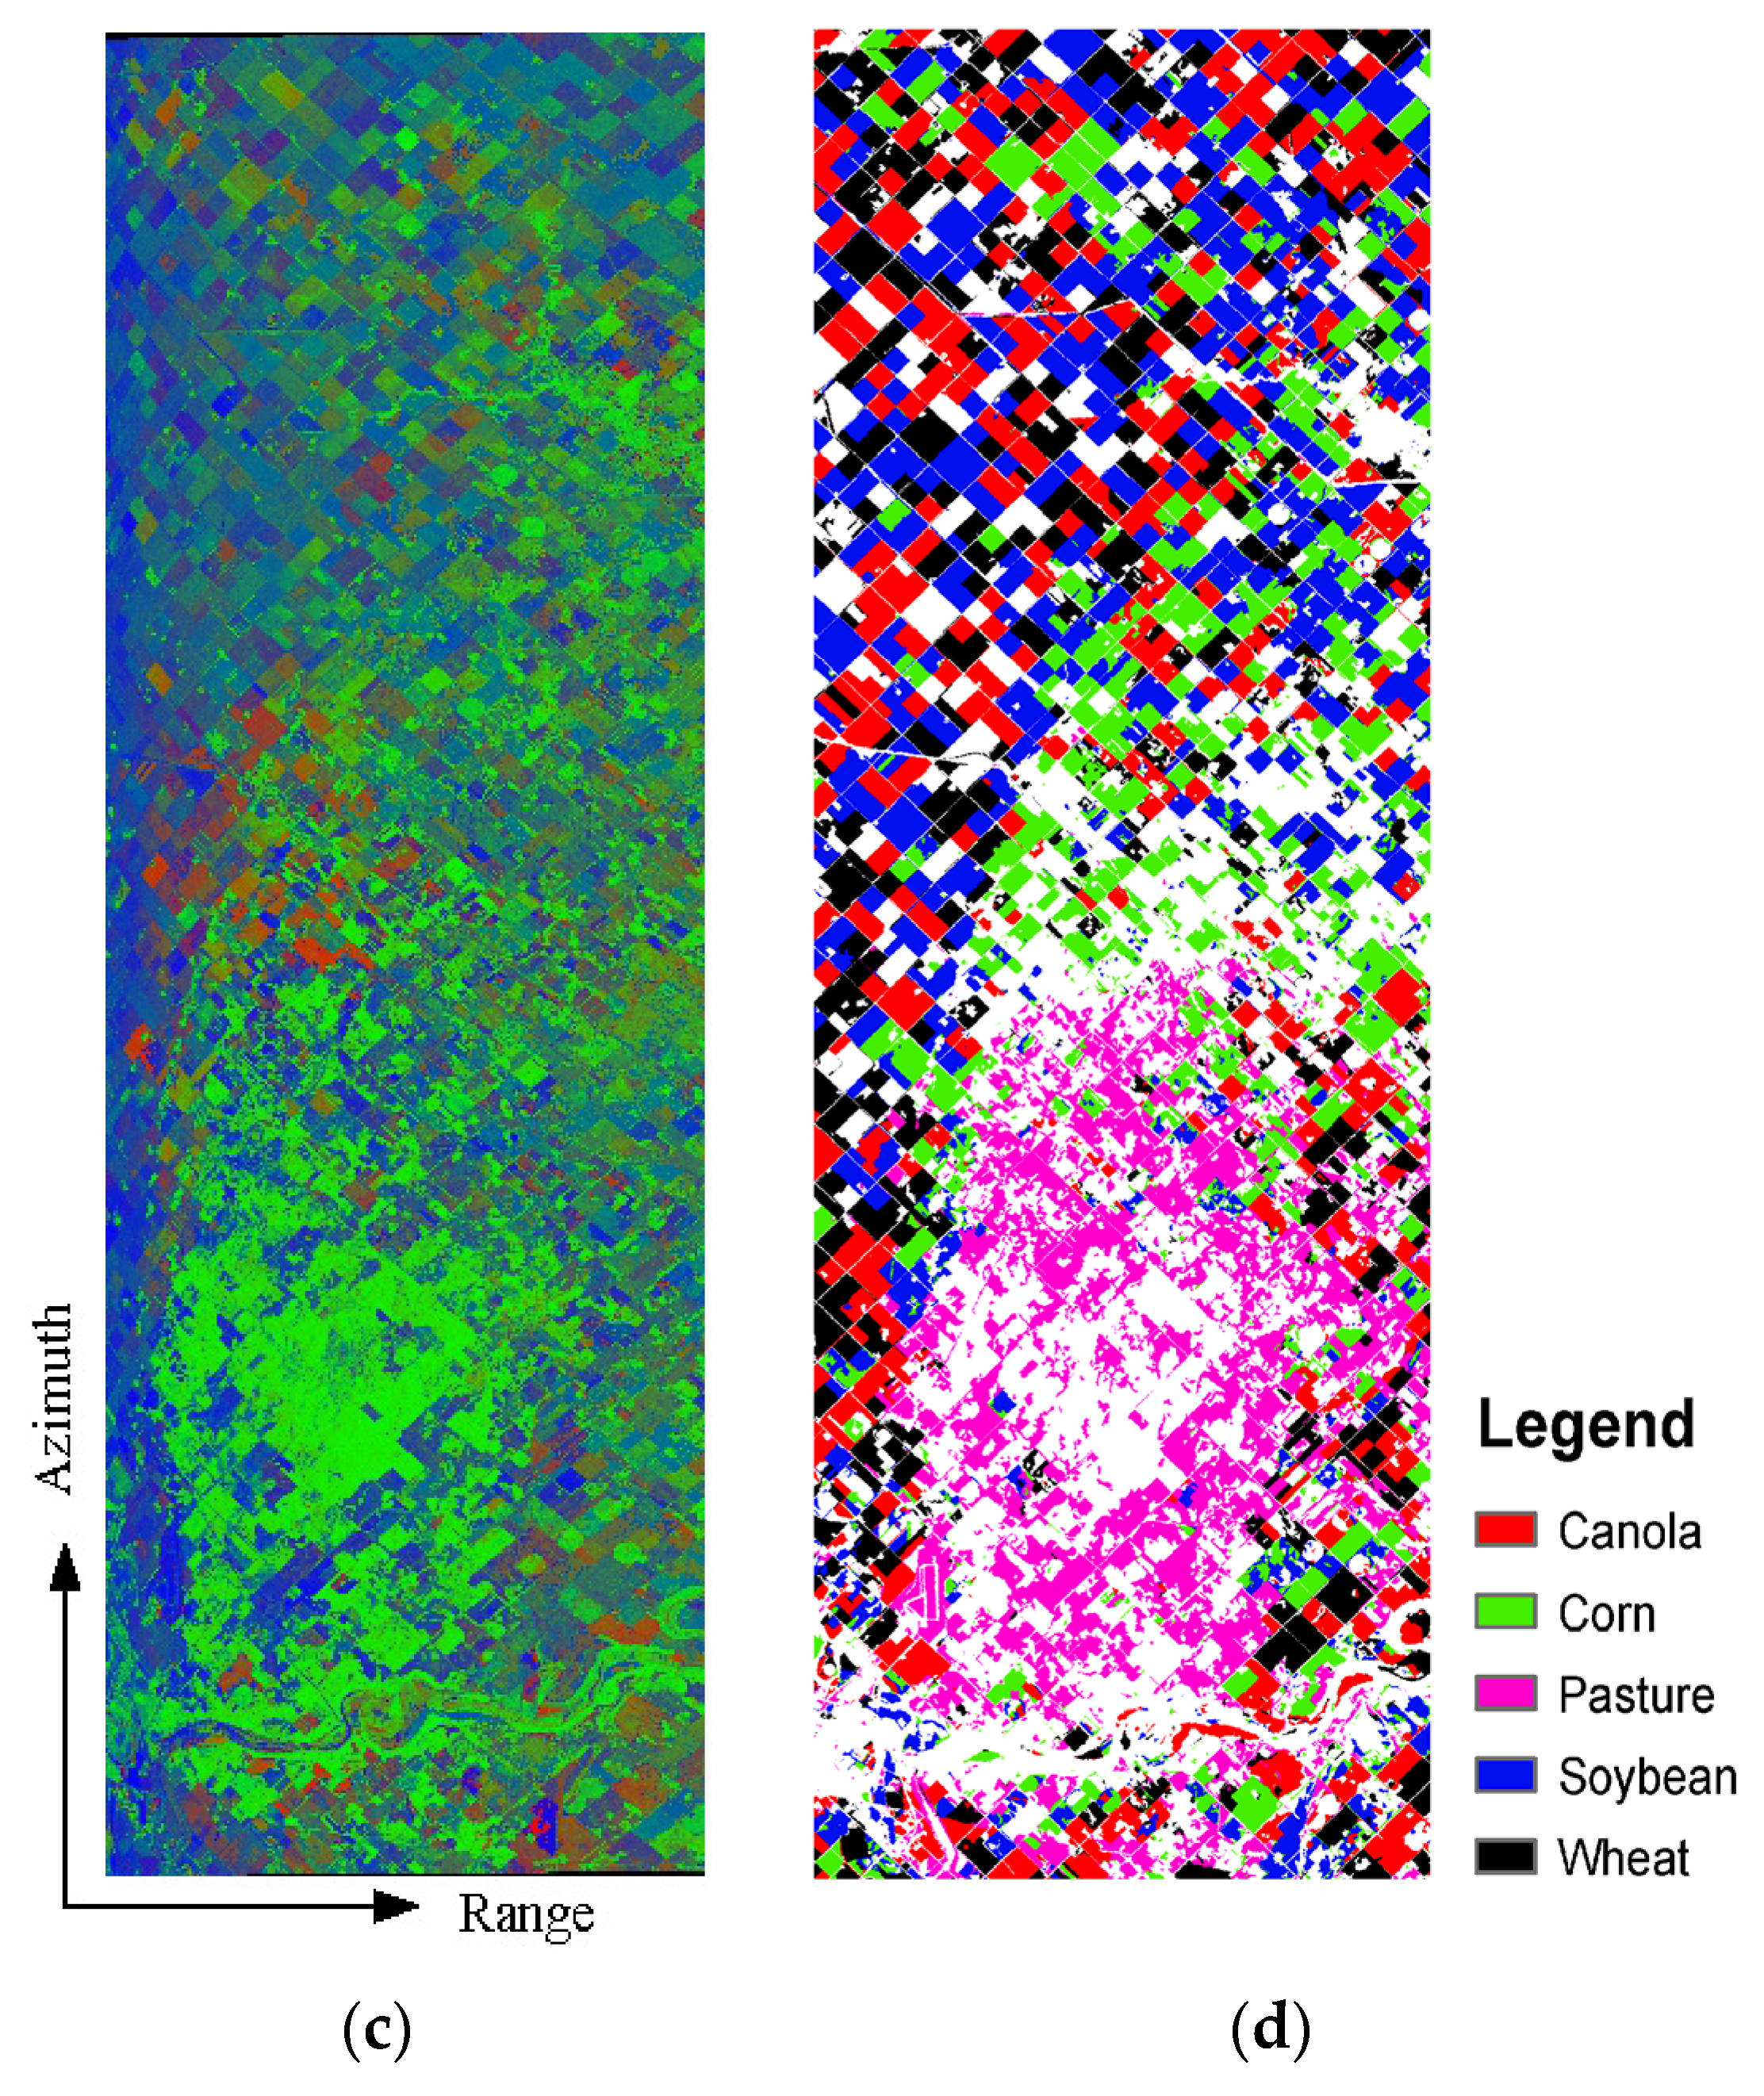
Figure 5 shows the false color composite of the normalized surface, dihedral, and volume scattering mechanisms (Equation (7)) for Julian days 169 (17 June 2012), 185 (3 July 2012), and 199 (17 July 2012) corresponding to three representative days (beginning, middle, and end of the campaign). A classification map [
18] of the considered five crop types is provided to relate the scattering characteristics to crop types (on this map, the areas in white color are covered by other crops and the forested site). Generally, it can be noted that the surface scattering intensity tends to decrease from June to July 2012, since the fast crop development during the investigation period and the well-developed crops’ structure (height and biomass are increased) in July reduce the penetration depth of the microwave signal. This decrease of the surface scattering component is especially pronounced in the near range, as the single scattering component is more significant at low incidence angle (corresponding to near range). A strong dihedral scattering component, like in [
1], is observed at the beginning of the campaign (
Figure 5a) for several fields, mainly those covered by corn. Indeed, according to the SMAPVEX12 ground measurements, the vegetation height and biomass are still low at this time, leading to a double bounce between vegetation stalk and the underlying soil. At mid-campaign, the dihedral scattering component becomes less significant due to the developed leaf layer and the increased complexity of vegetation structure which reduce the dihedral scattering mechanism. The volume scattering component is predominant over the fields covered by canola, wheat and corn.
Figure 5.
RGB color composition of the normalized three scattering mechanisms for Julian day (a) 169 (17 June 2012); (b) 185 (3 July 2012); (c) 199 (17 July 2012). Dihedral scattering power in red, volume scattering power in green and surface scattering power in blue. The incidence angle in the range direction varies from 25° to 65°. (d) Classification map of the considered five crop types (the areas in white color are covered by other crops and the forested site).
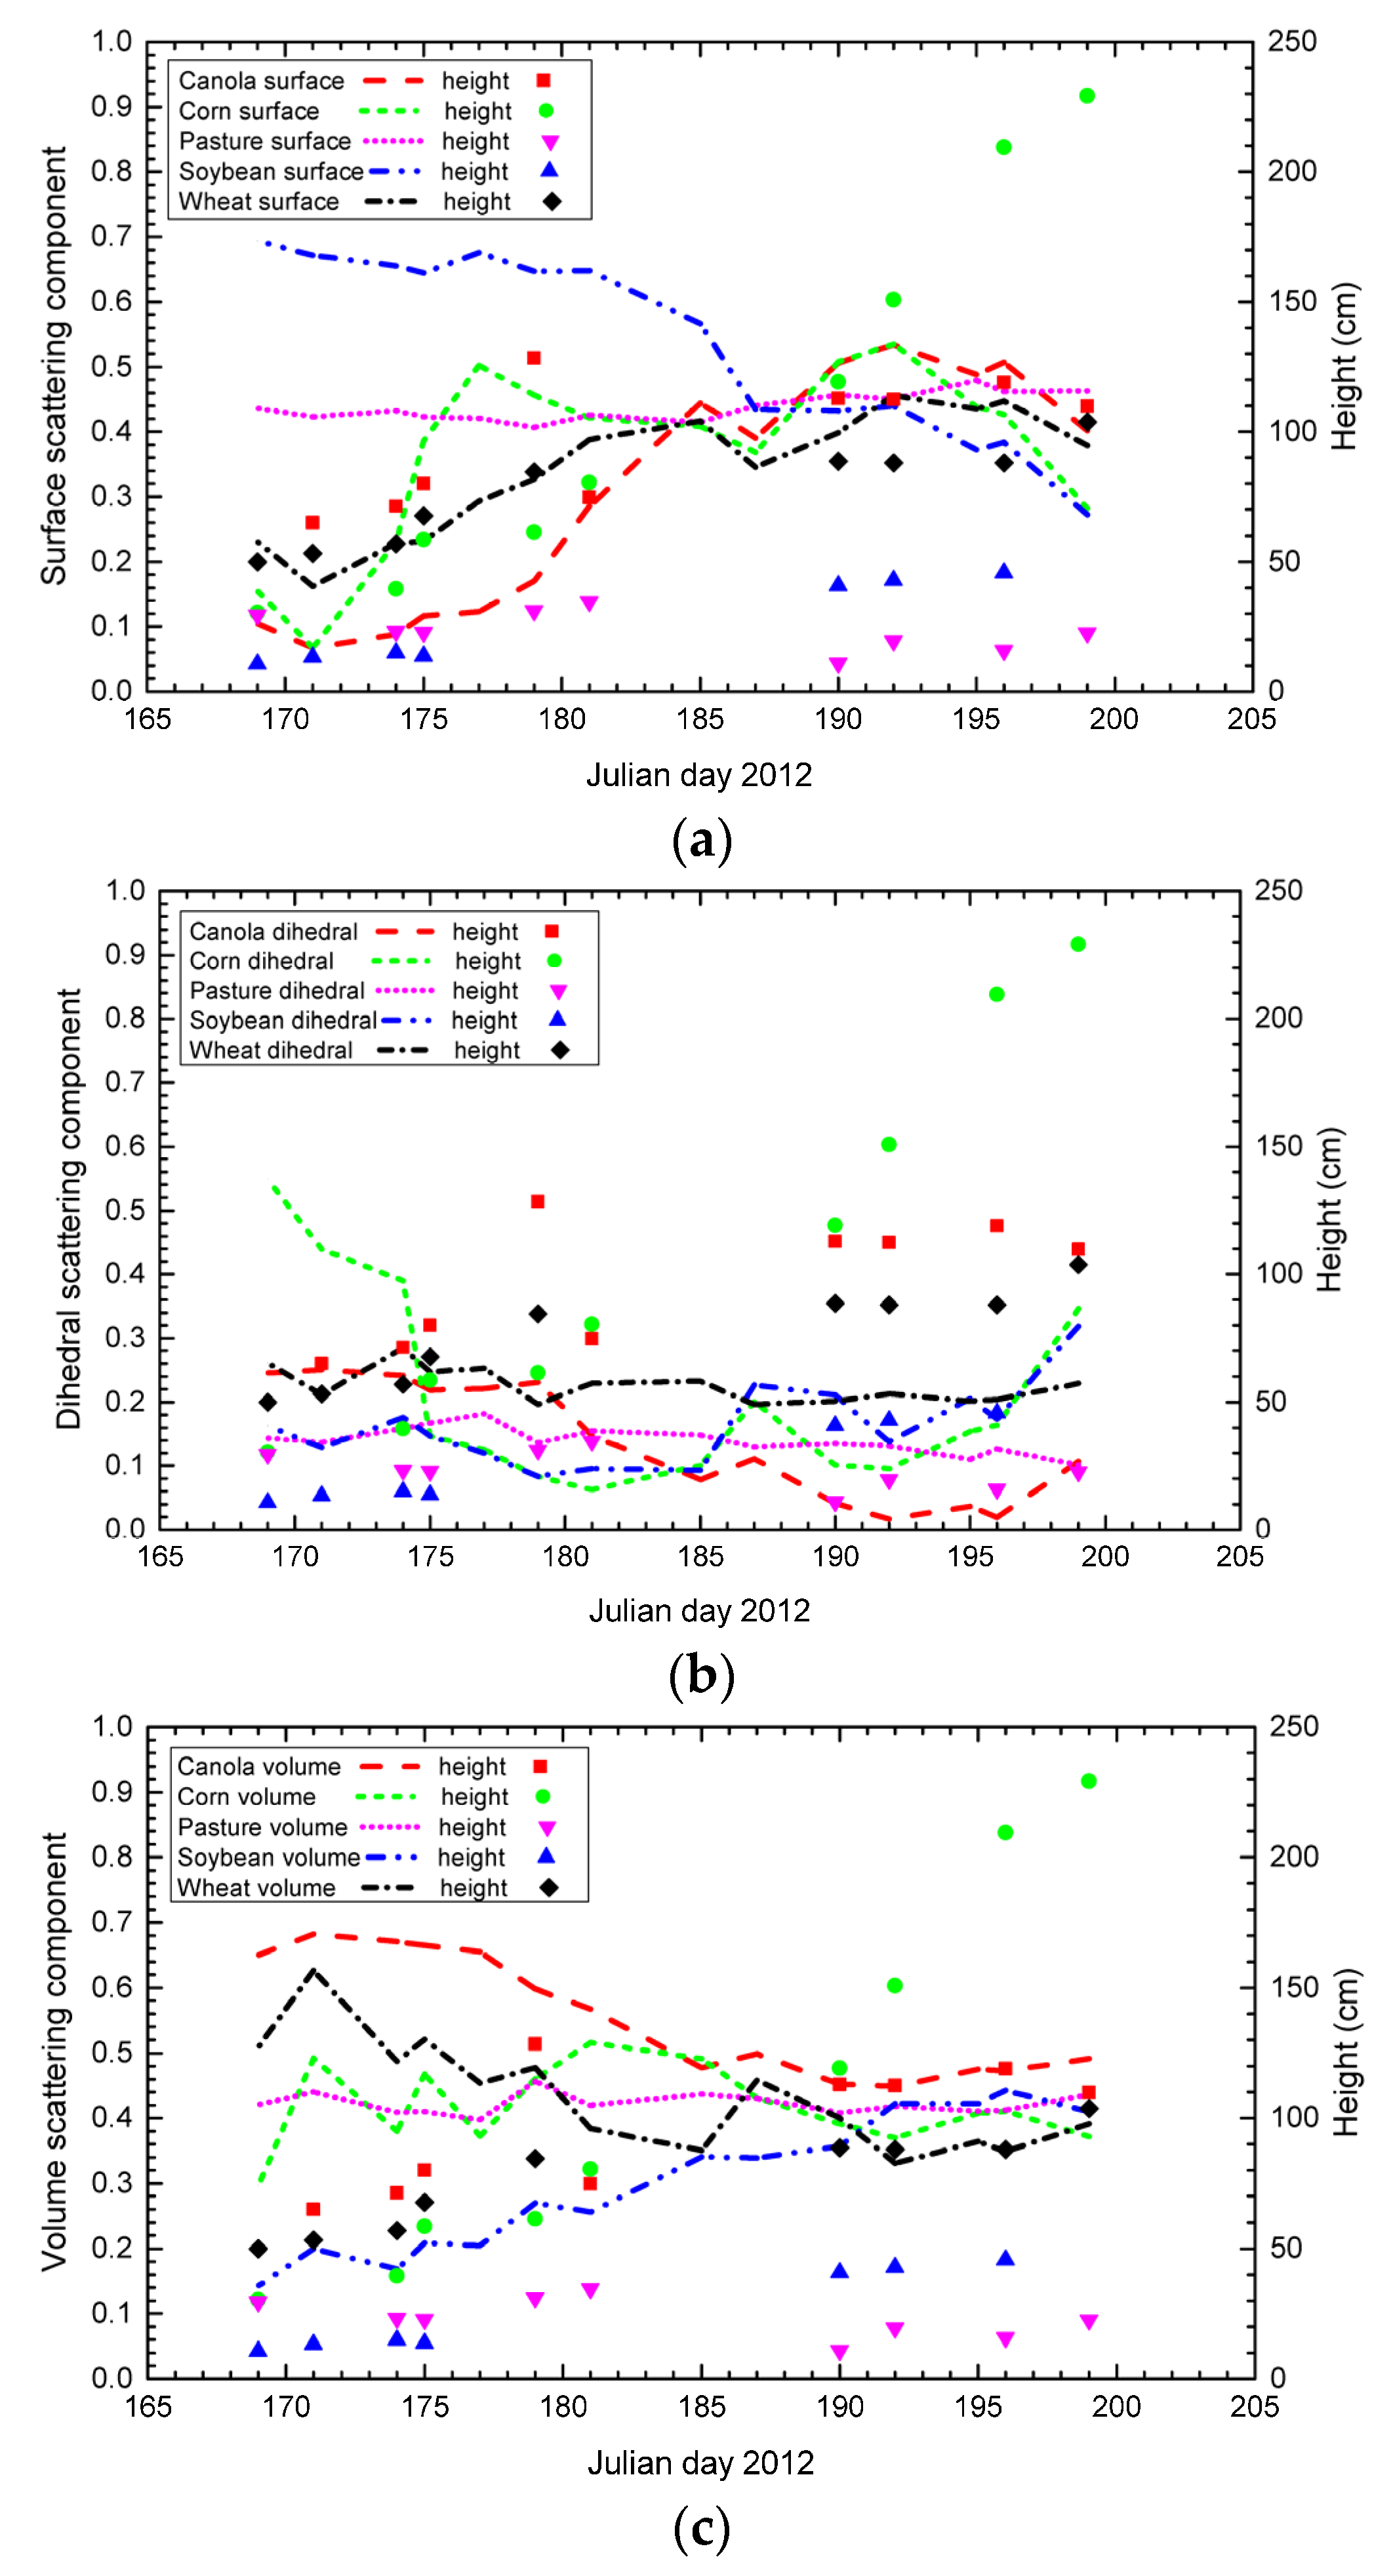
For different crop types,
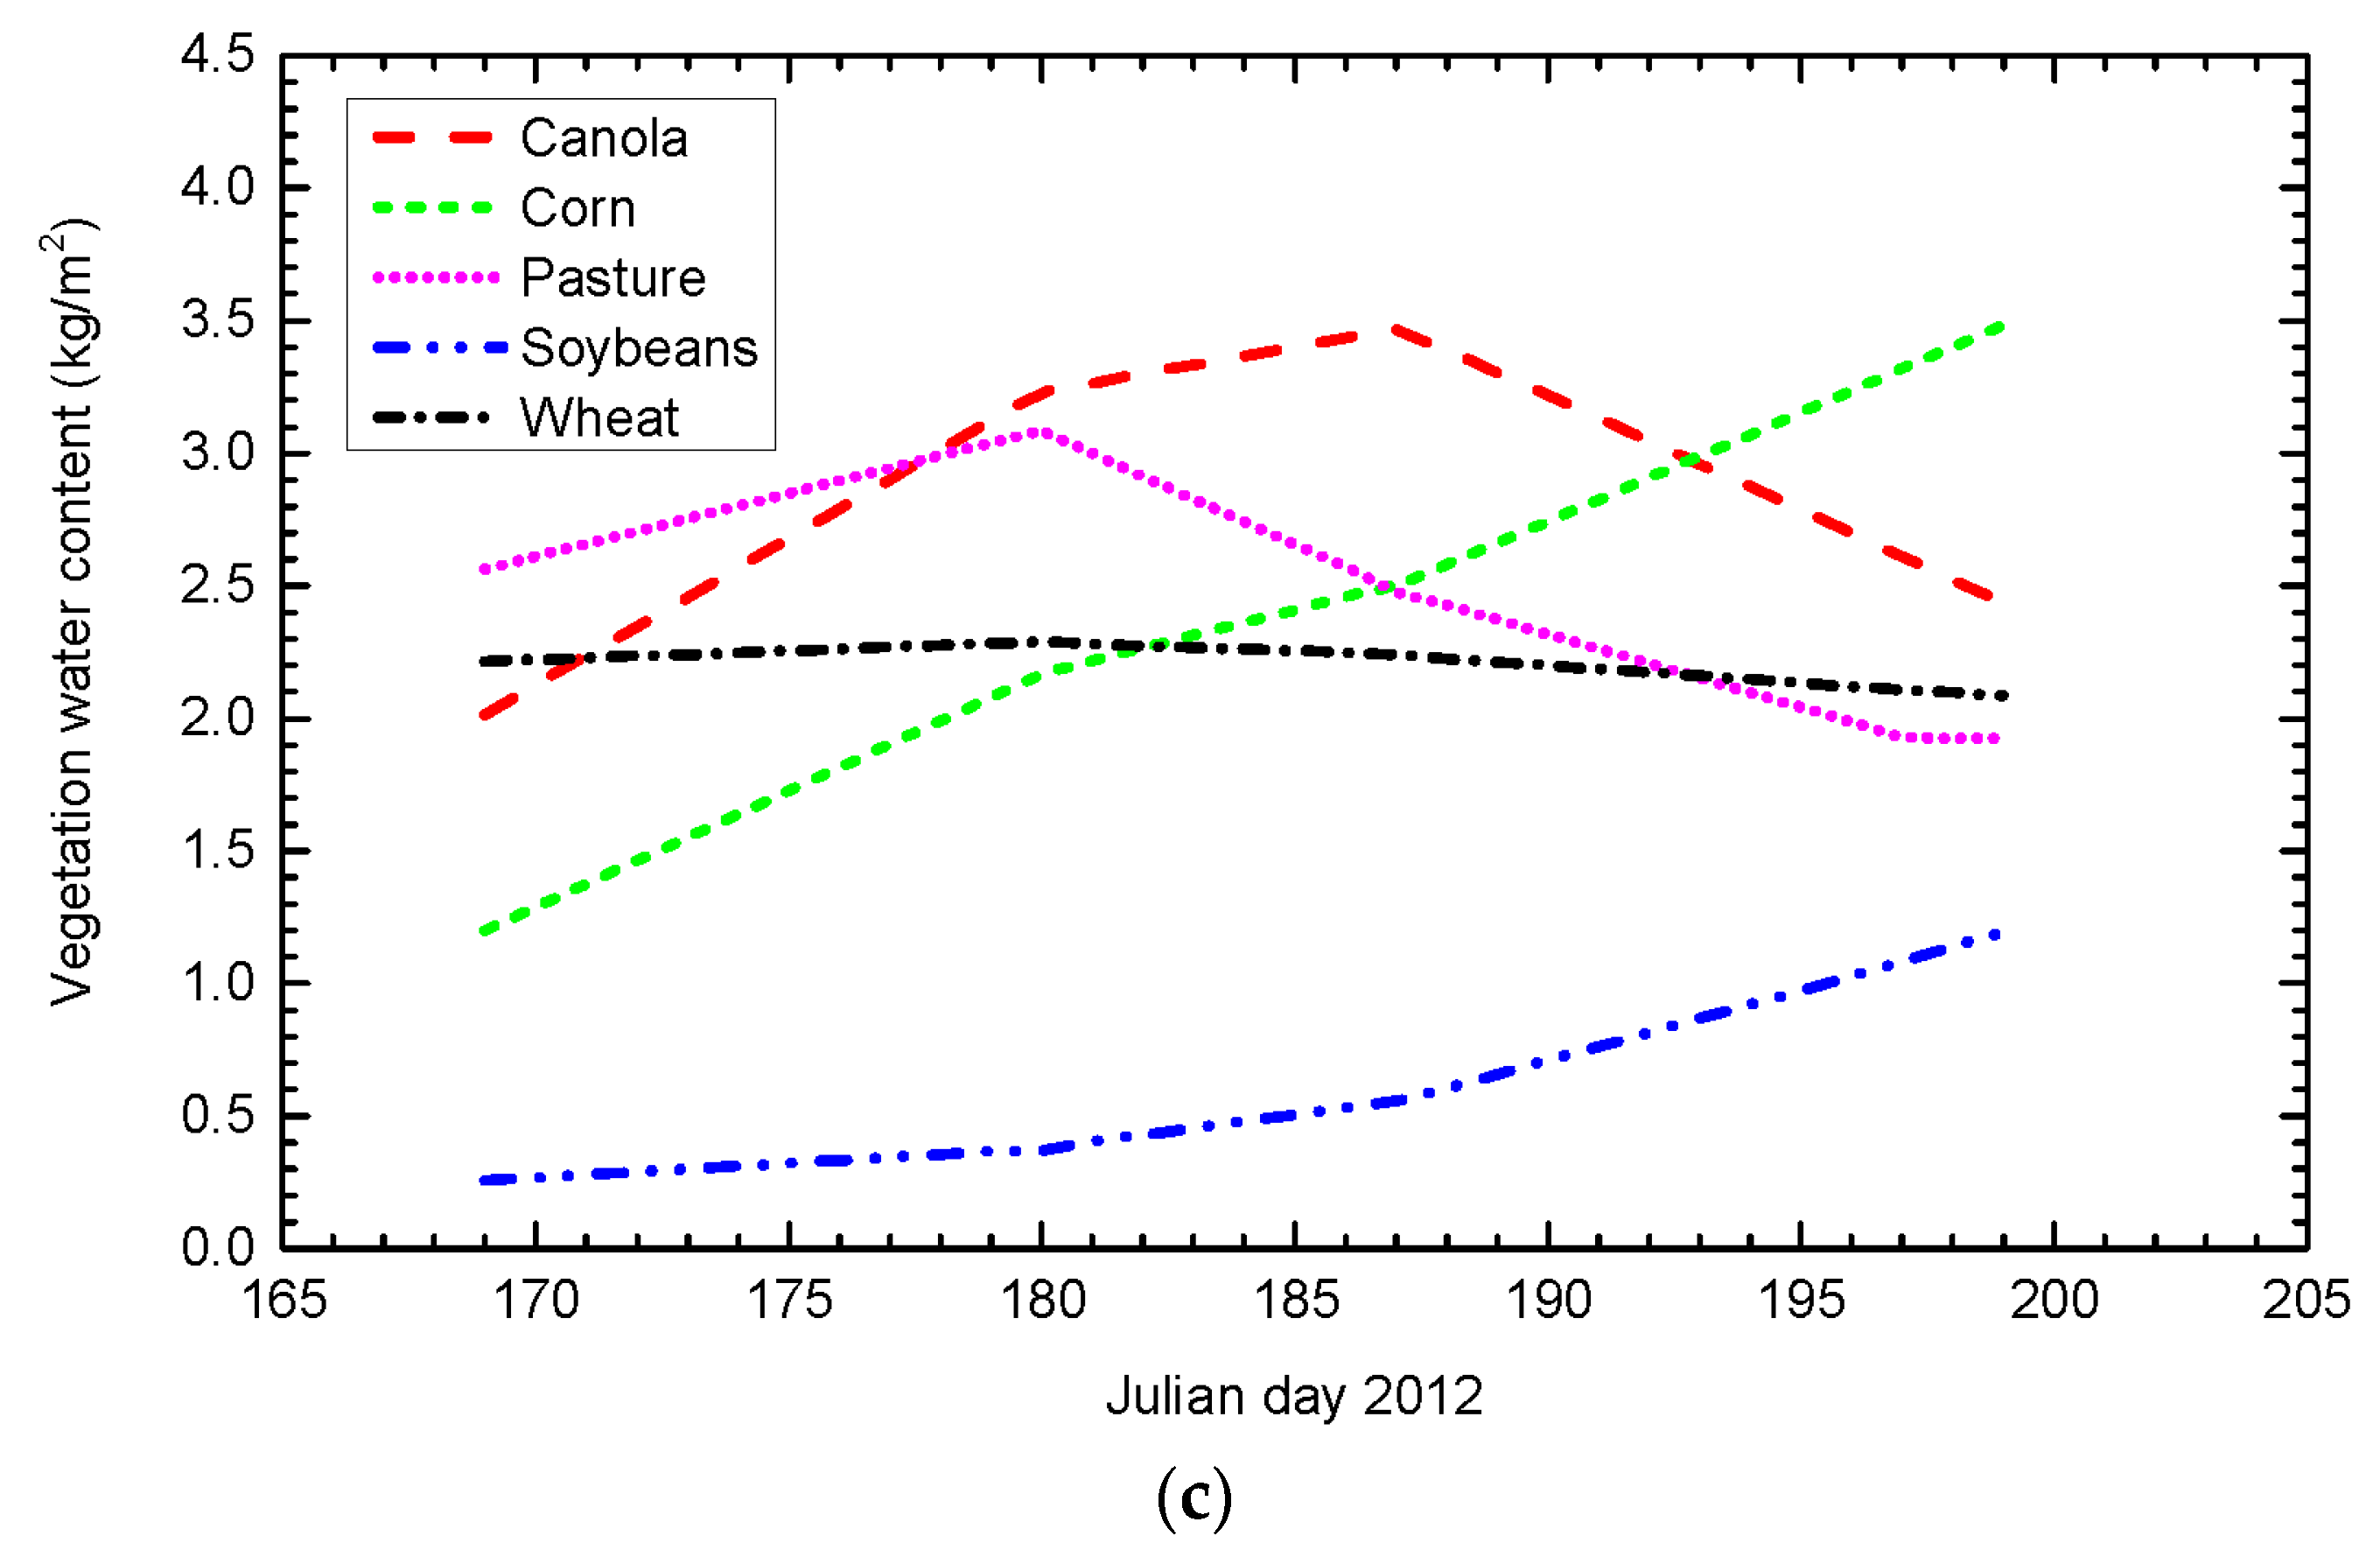
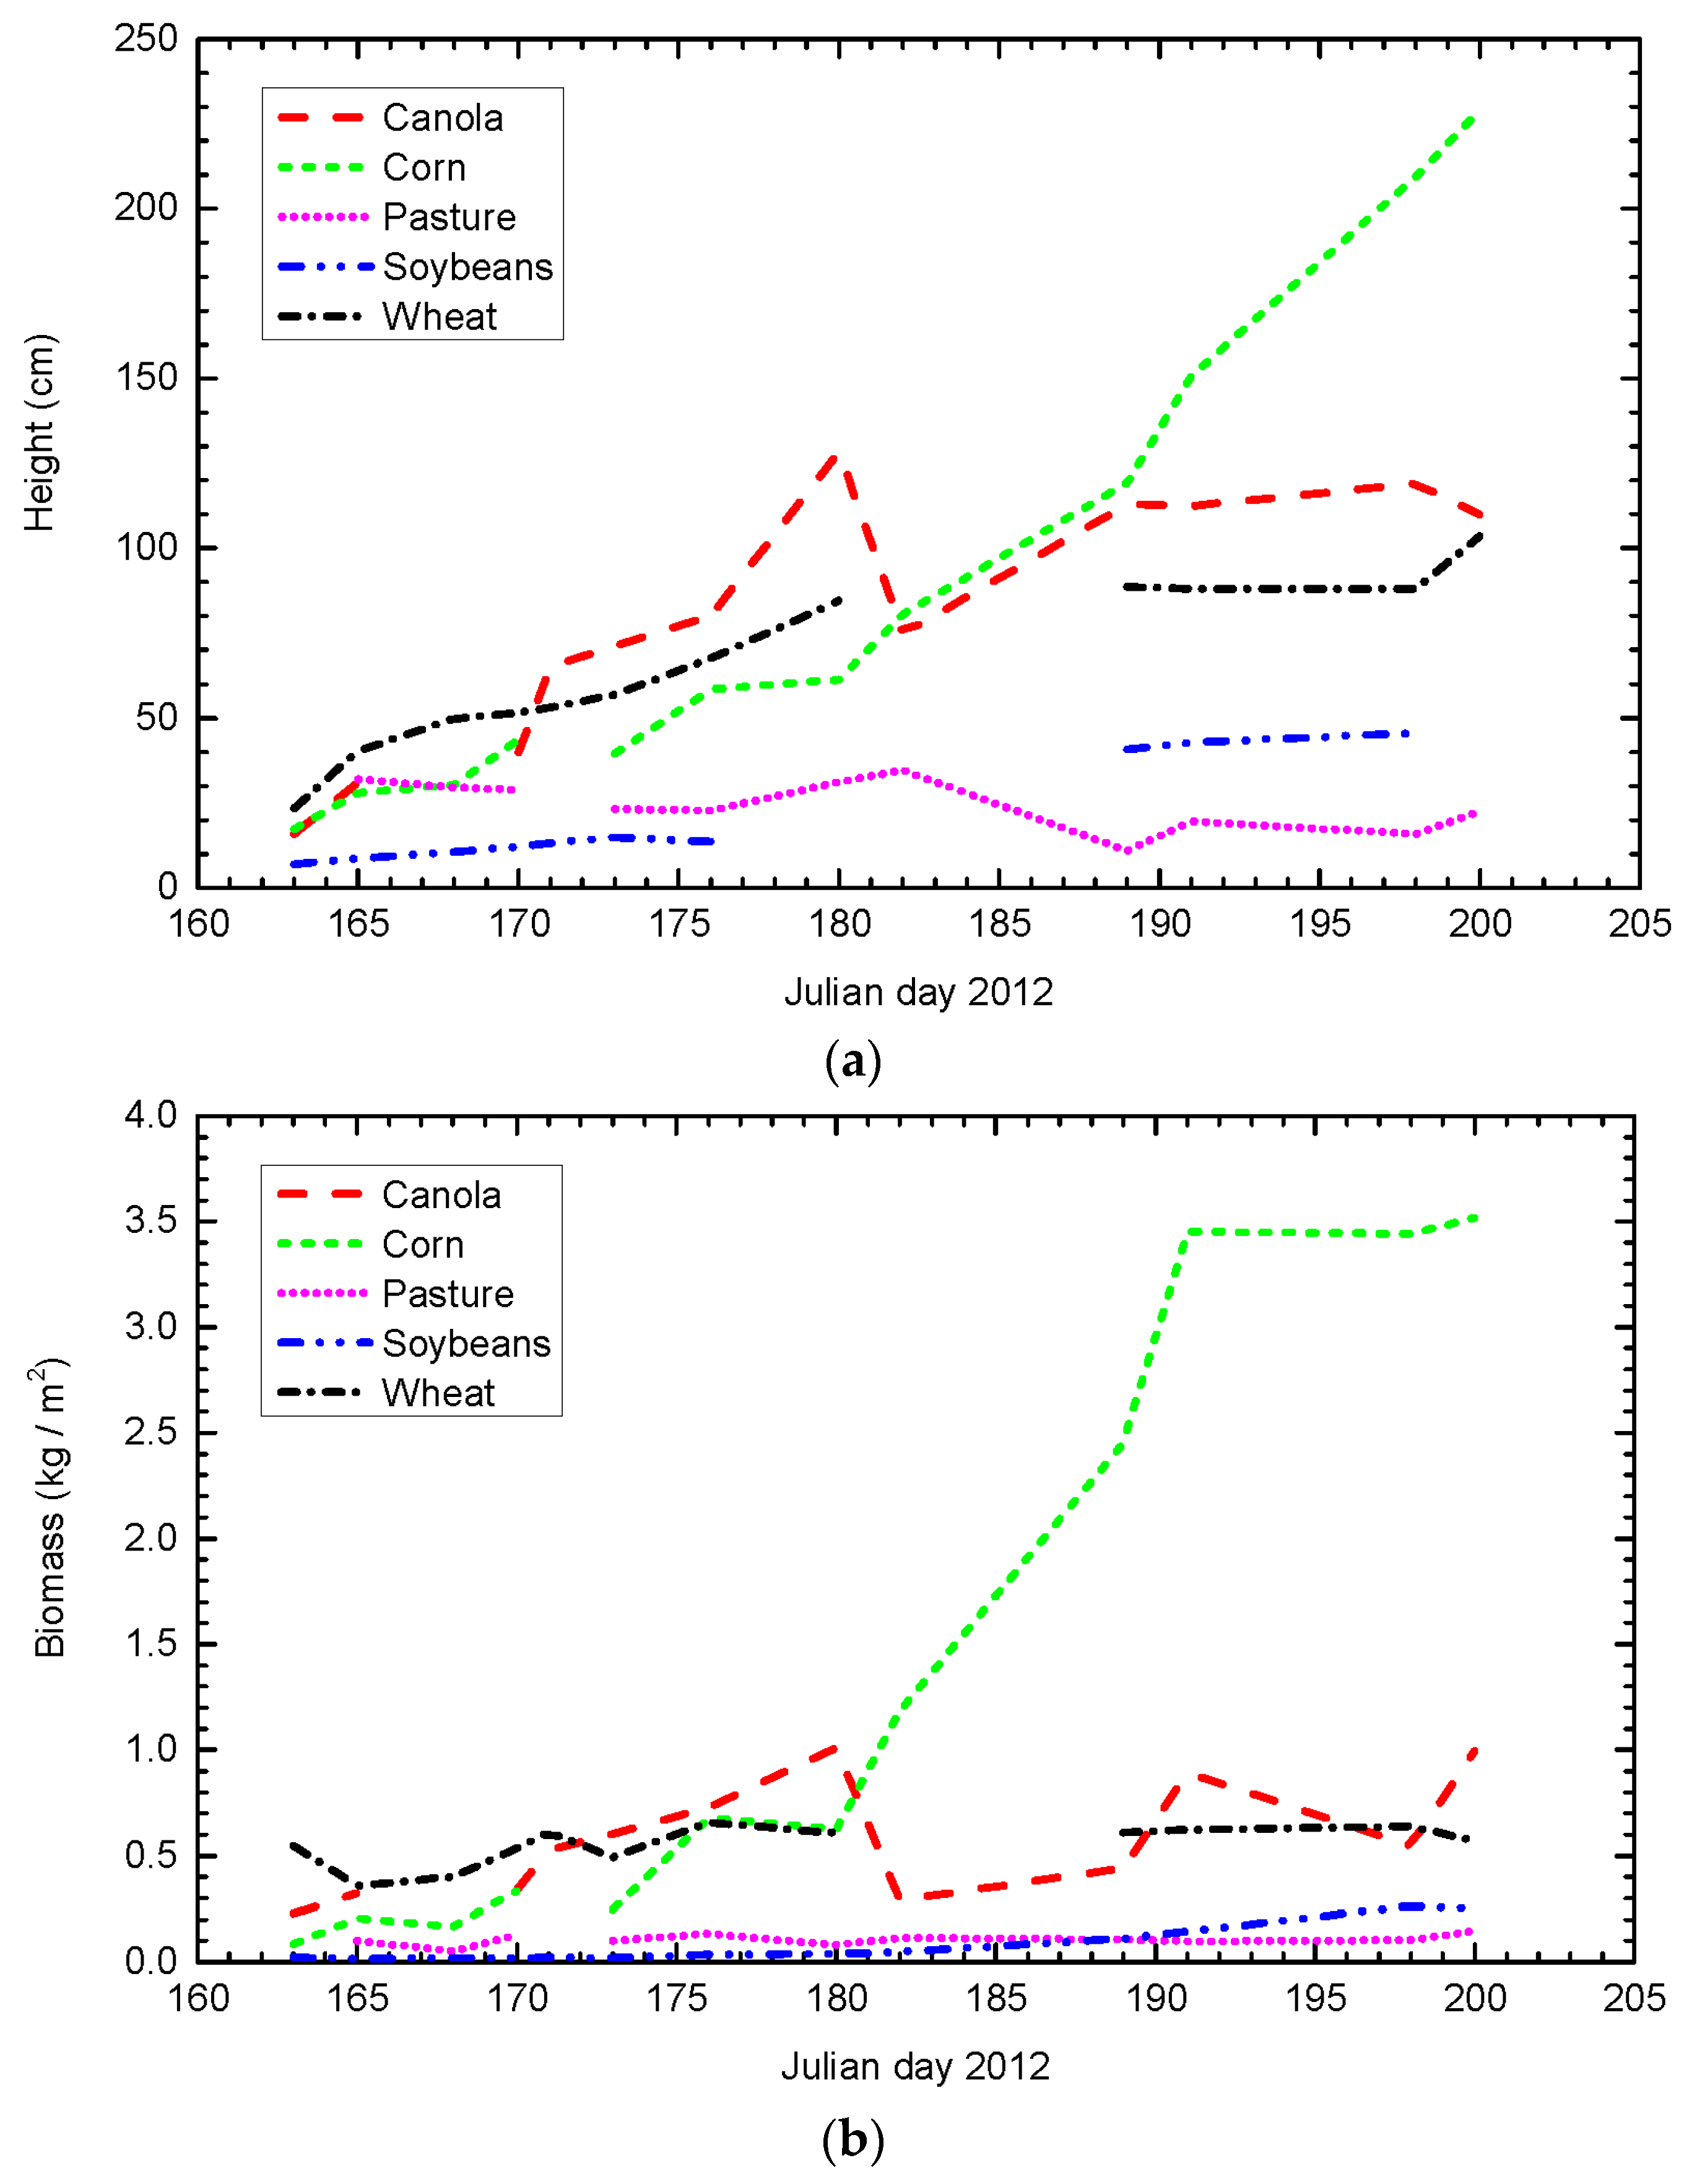
Figure 6 shows the temporal variation of each scattering mechanism (surface, dihedral, and volume scatterings) derived as the mean value of the normalized scattering power. The backscattering mechanisms of soybean are in accordance with the temporal variation of plant penology (
Figure 3), which indicates the increase in volume scattering power and the decrease in surface scattering power. As the vegetation water content of soybean is low during the developing stage considered in this study (less than 1 kg/m
2), the temporal evolution of its volume scattering is mainly affected by the changes in soybean structure. Regarding the corn,
Figure 6b shows that its dihedral scattering power is significant at the beginning of the campaign as a result of the already developed corn stalk supporting only a few leaves. From Julian day 175 (June 23), the dihedral scattering component decreases due to the well-developed corn leaves which attenuate the electromagnetic waves (followed by a decline of surface scattering component from Julian day 177 to 187). For the pasture, the temporal evolution of scattering mechanisms is quiet stable, which is probably due to the low and stable biomass indicated by the ground measurements. For wheat fields, the increase in surface scattering (
Figure 6a) is in agreement with the quasi stable wheat’s water content value (2.2 kg /m
2) and its increasing height [
1]. This corresponds to a vegetation drying out, which enhances the surface scattering and decreases the volume scattering (
Figure 6c) due to a more pronounced signal penetration.
For the fields covered by canola, the surface scattering power increases while the volume scattering power decreases during the growing period (
Figure 6). These temporal behaviors which seem unexpected are closely related to the temporal evolution of height, biomass and vegetation water content (
Figure 3) as well as to the correlation between these parameters. Indeed, during the crop growth cycle, canola’s height, biomass and vegetation water content increase until reaching the mature stage which is then followed by a drying out process. Therefore, the decreasing vegetation water content from the maturation stage leads to a decrease in the volume scattering and an increase in the surface scattering. Consequently, due to the combined effect of the biomass, height and the vegetation water content on the volume scattering, the latter does not increase during the growing season as expected; in turn, neither does the surface scattering during the growing season. In addition, other reasons arising from the polarimetric decomposition can explain these results [
1,
2], particularly those obtained before the canola’s drying out. For instance, the high and sophisticated temporal changes in the shapes and structures of canola during the considered phenological stage may not be fully exploited by the only three fixed volume coherency matrices.
Figure 6.
Temporal variation of normalized scattering powers of (a) surface scattering, (b) dihedral scattering and (c) volume scattering component for different crop types. The points (corresponding to right y-axis) shows the height of different crop types.
Figure 6.
Temporal variation of normalized scattering powers of (a) surface scattering, (b) dihedral scattering and (c) volume scattering component for different crop types. The points (corresponding to right y-axis) shows the height of different crop types.
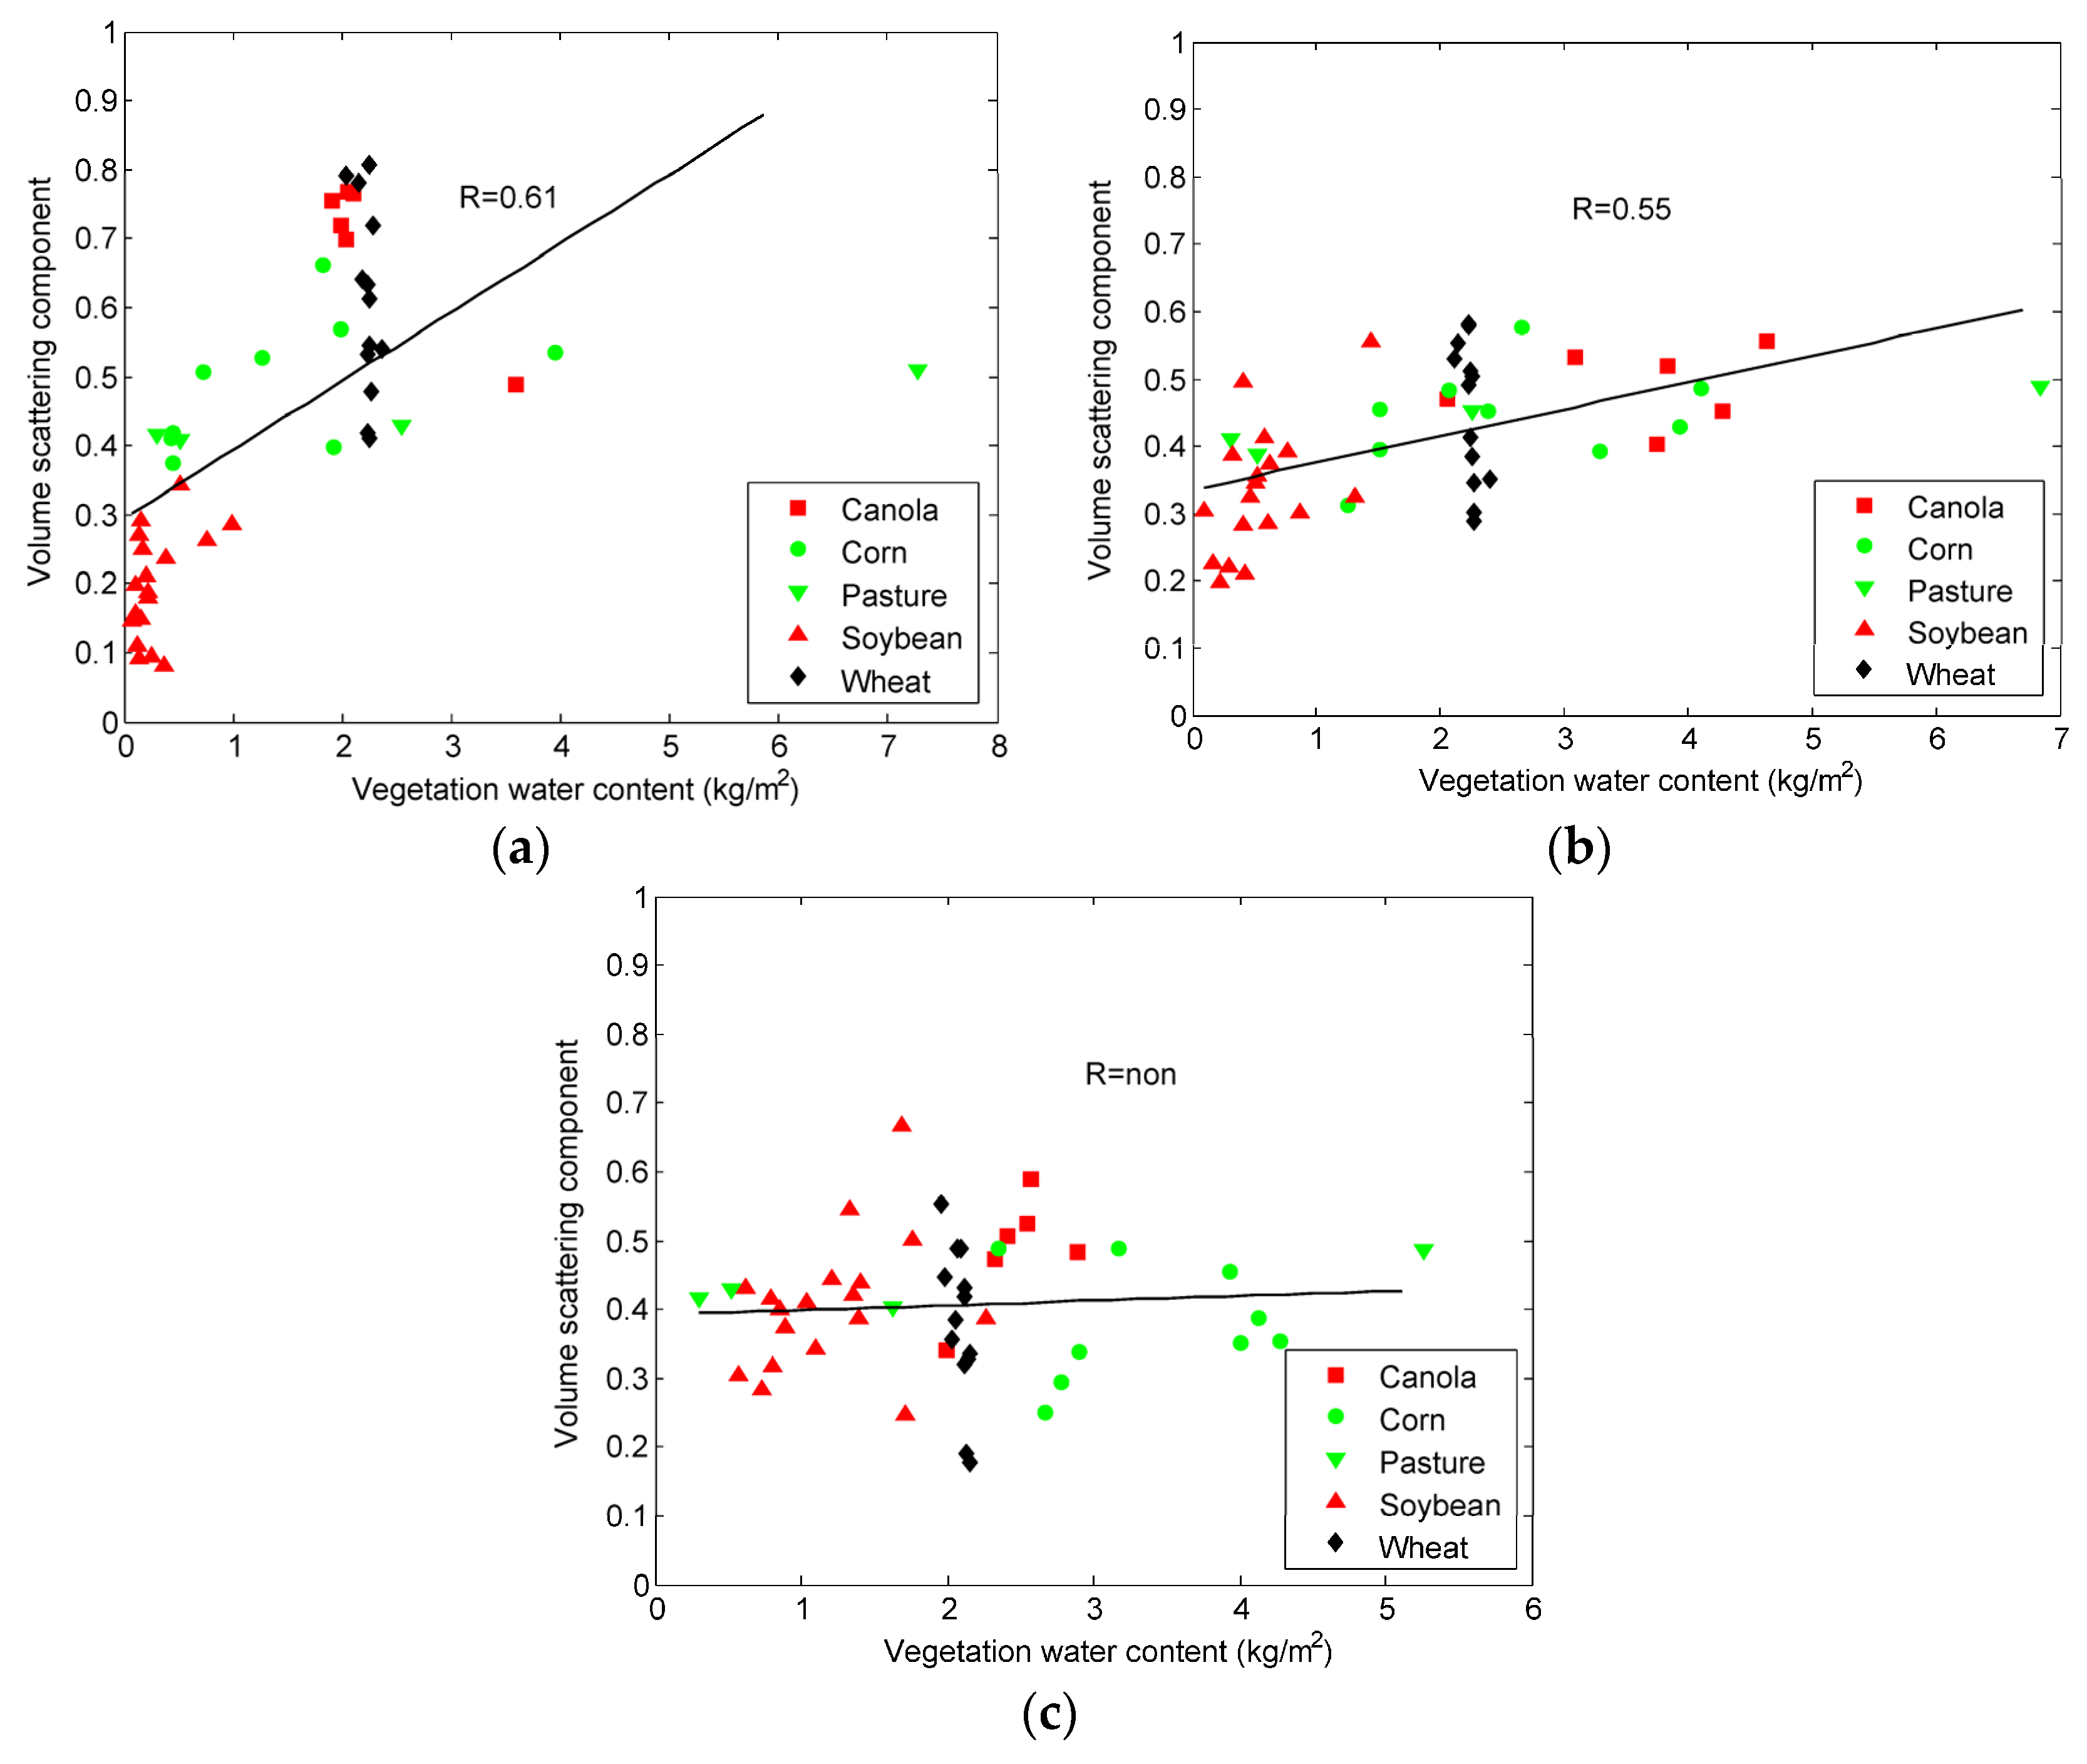
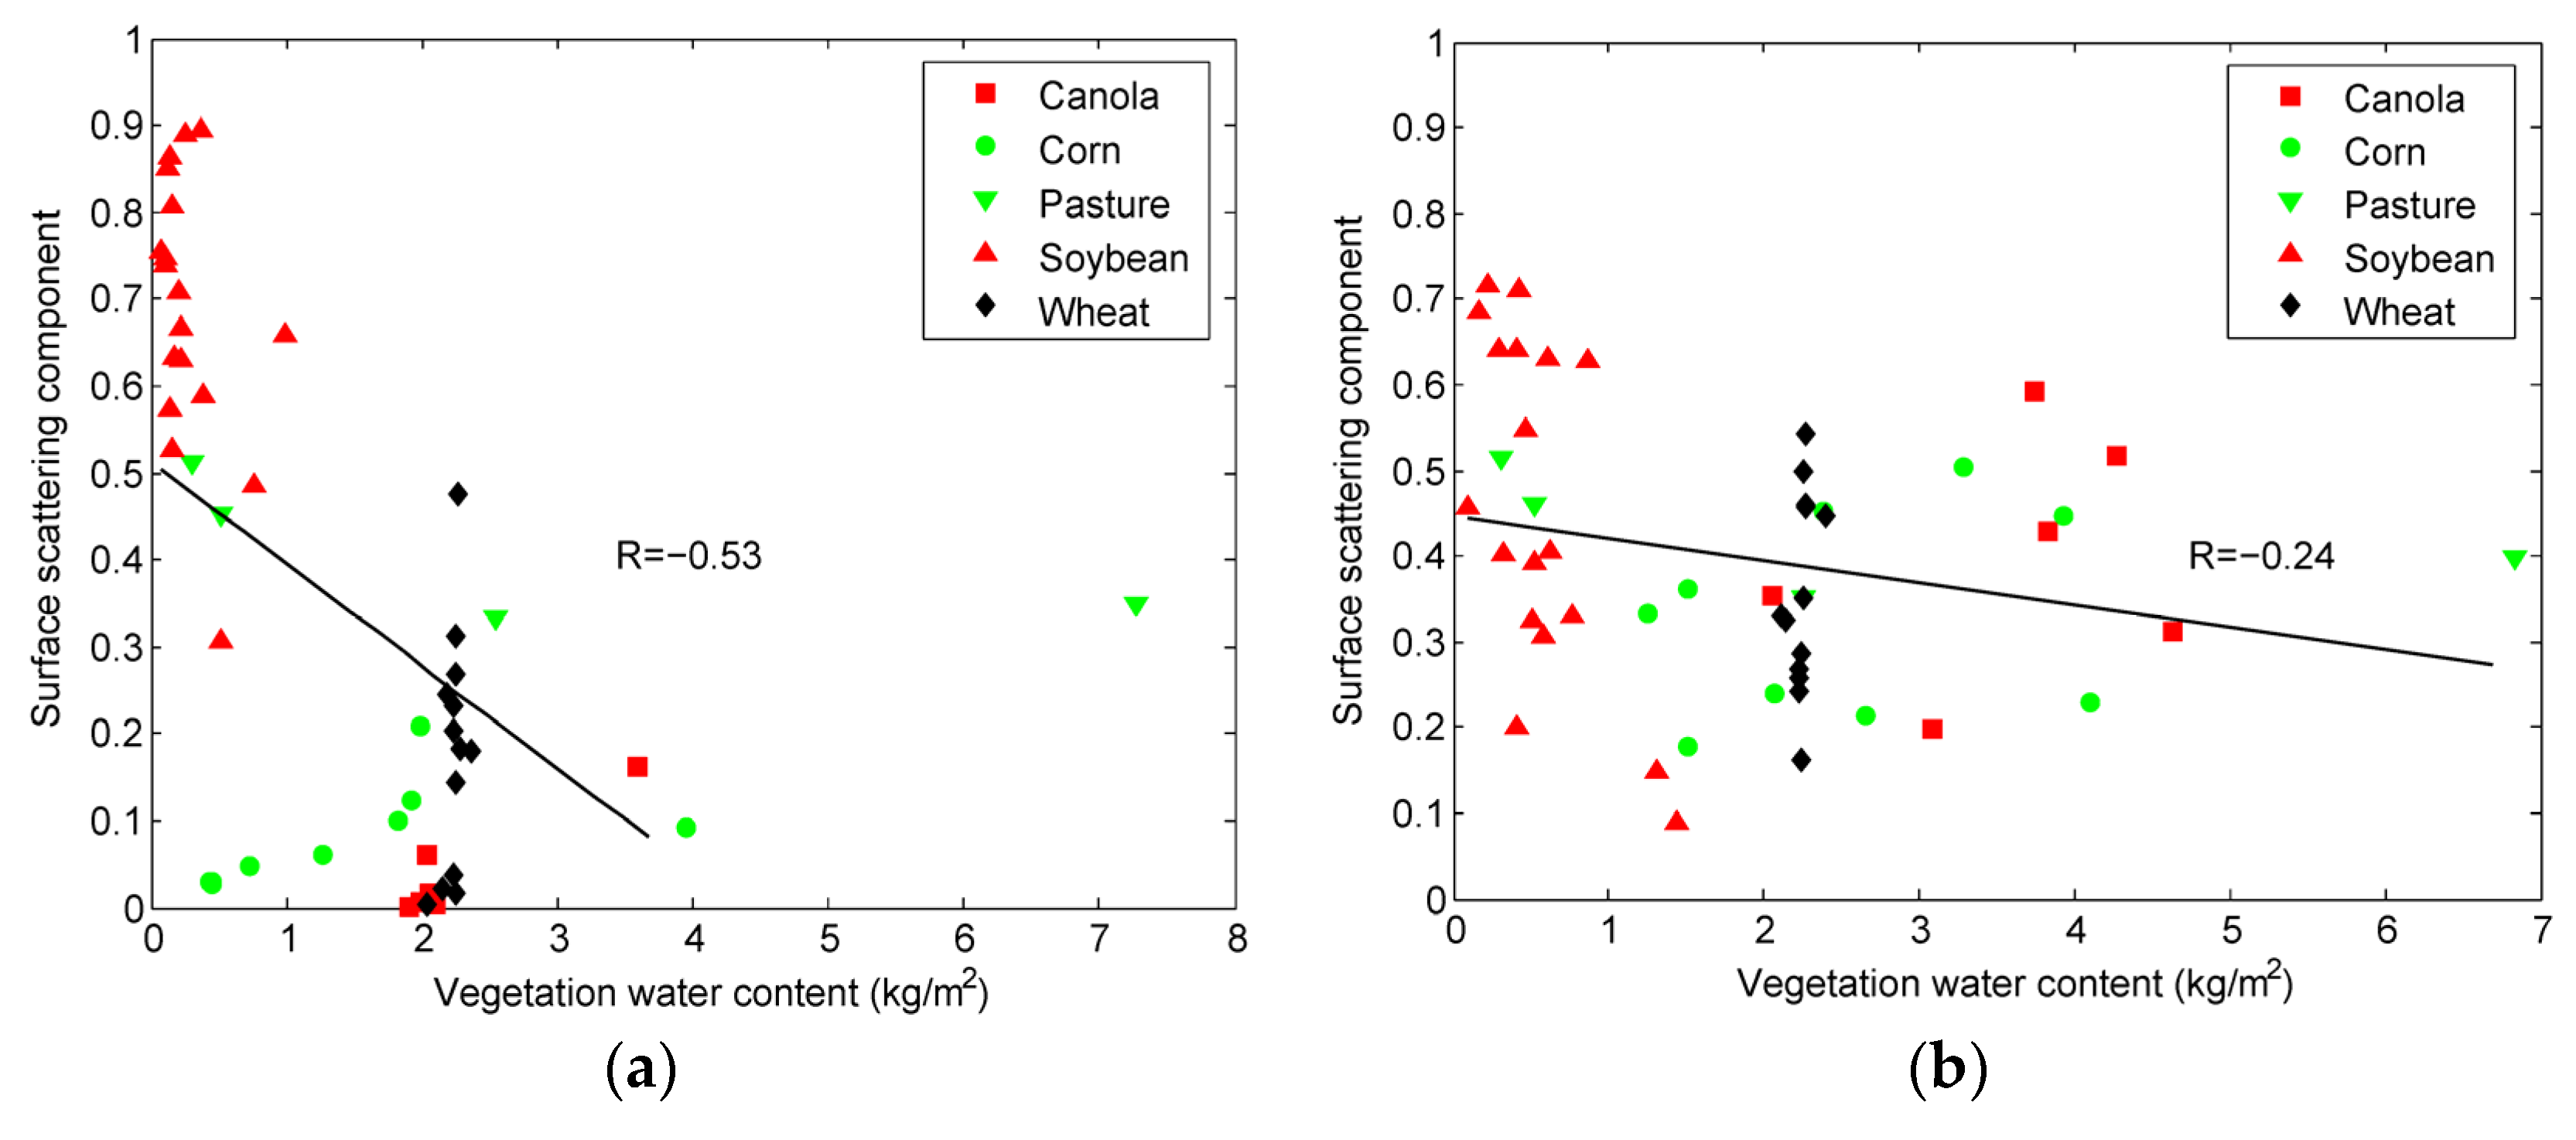
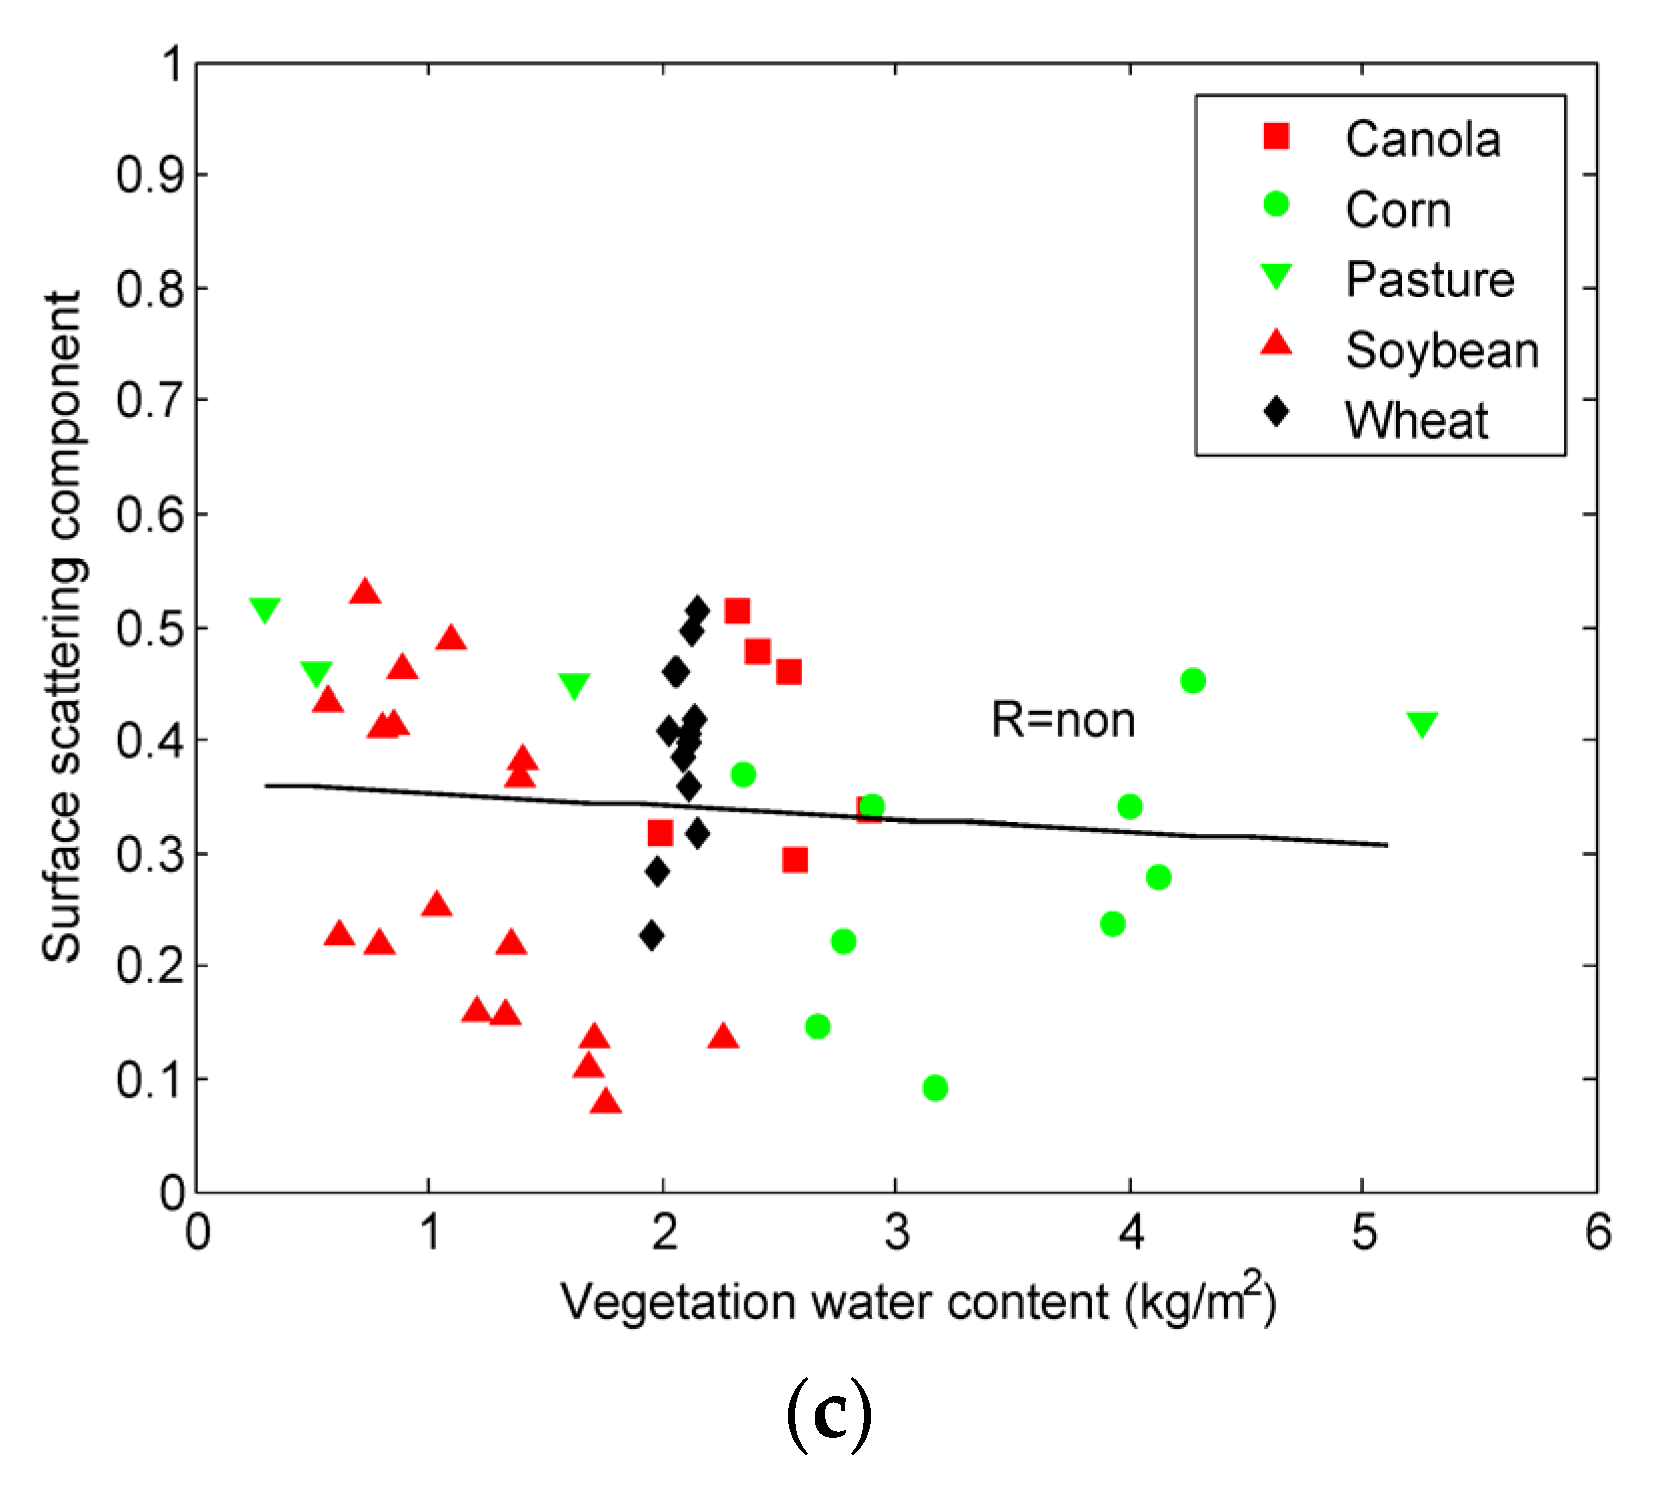
The scattering characteristics are affected by several factors including the vegetation water content, height, biomass and density. The scatterplots in
Figure 7 and
Figure 8 present the behaviors of the volume and surface scatterings with respect to vegetation water content. They show that as the vegetation water content increases, the volume scattering power increases while the surface scattering power decreases respectively. Different volume/surface scattering behaviors are obtained even for similar vegetation water content values due to the combined effects of the influencing factors. Furthermore, the dynamic of scattering mechanisms to vegetation water content is significantly dependent on the crop growing stage. The low and no correlations observed between the vegetation water content and volume (or surface scattering) during the middle and the end of the campaign (
Figure 7b,c,
Figure 8b,c), respectively, suggest the loss of explanatory power of the adopted linear regression.
Figure 7.
Correlation analysis of vegetation water content and volume scattering component for Julian day (a) 169 (17 June 2012); (b) 185 (3 July 2012); (c) 199 (17 July 2012).
Figure 7.
Correlation analysis of vegetation water content and volume scattering component for Julian day (a) 169 (17 June 2012); (b) 185 (3 July 2012); (c) 199 (17 July 2012).
Figure 8.
Correlation analysis of vegetation water content and surface scattering component for Julian day (a) 169 (17 June 2012); (b) 185 (3 June 2012); (c) 199 (17 July 2012).
Figure 8.
Correlation analysis of vegetation water content and surface scattering component for Julian day (a) 169 (17 June 2012); (b) 185 (3 June 2012); (c) 199 (17 July 2012).
4.2. Evaluation of the Modeling of the Volume Scattering and Its Removal from the Measured Coherency Matrix
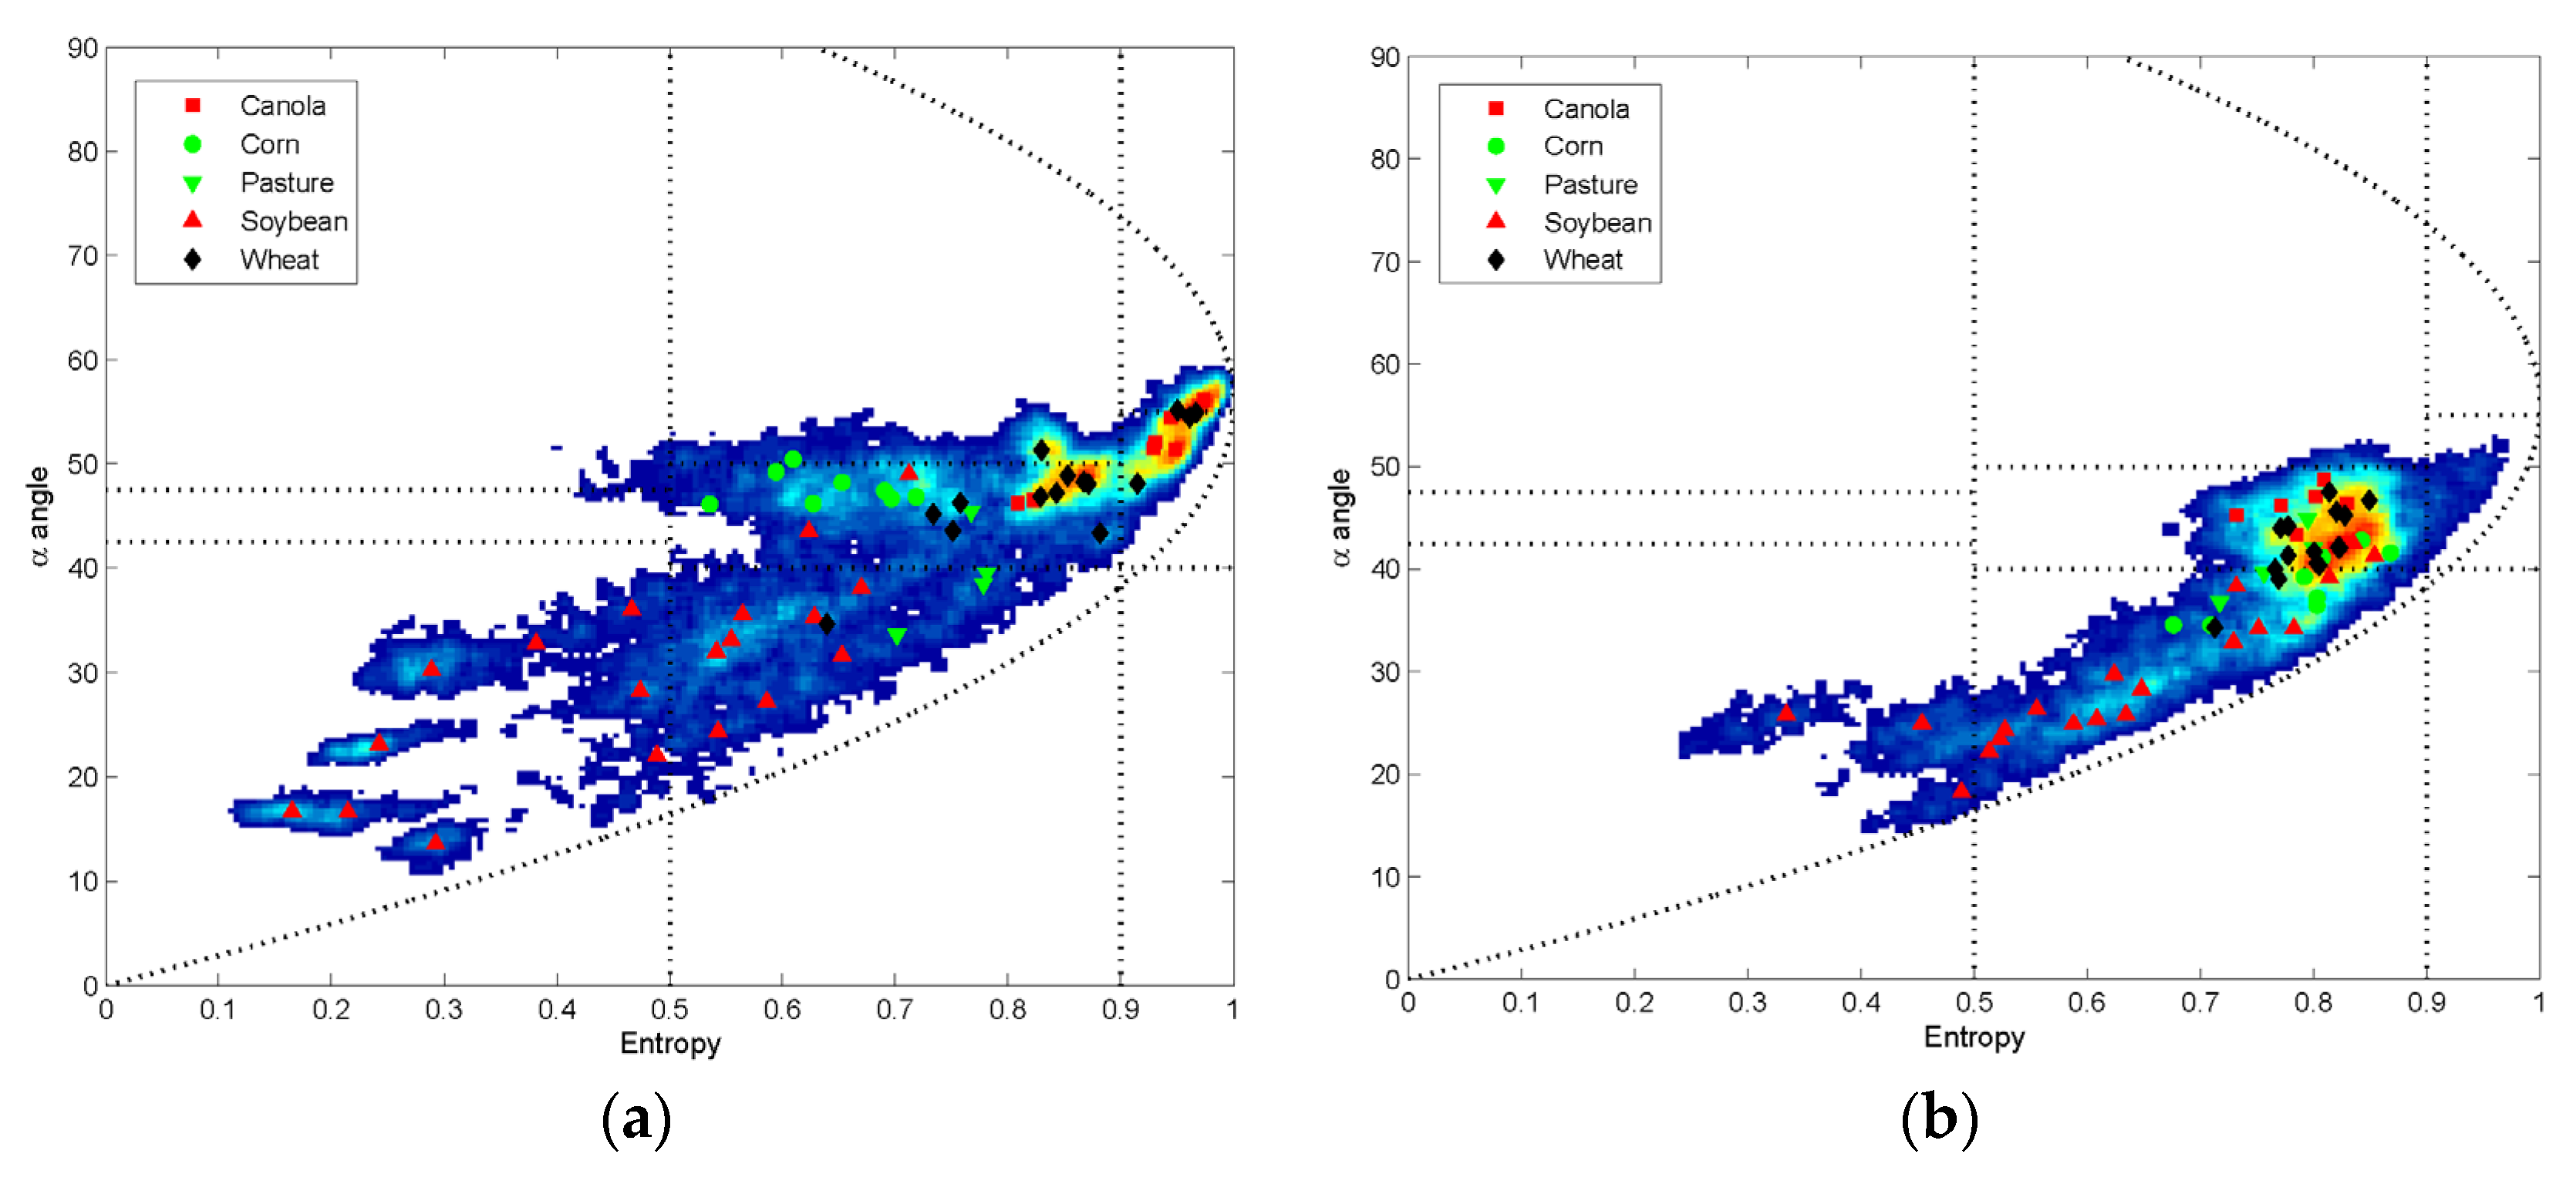
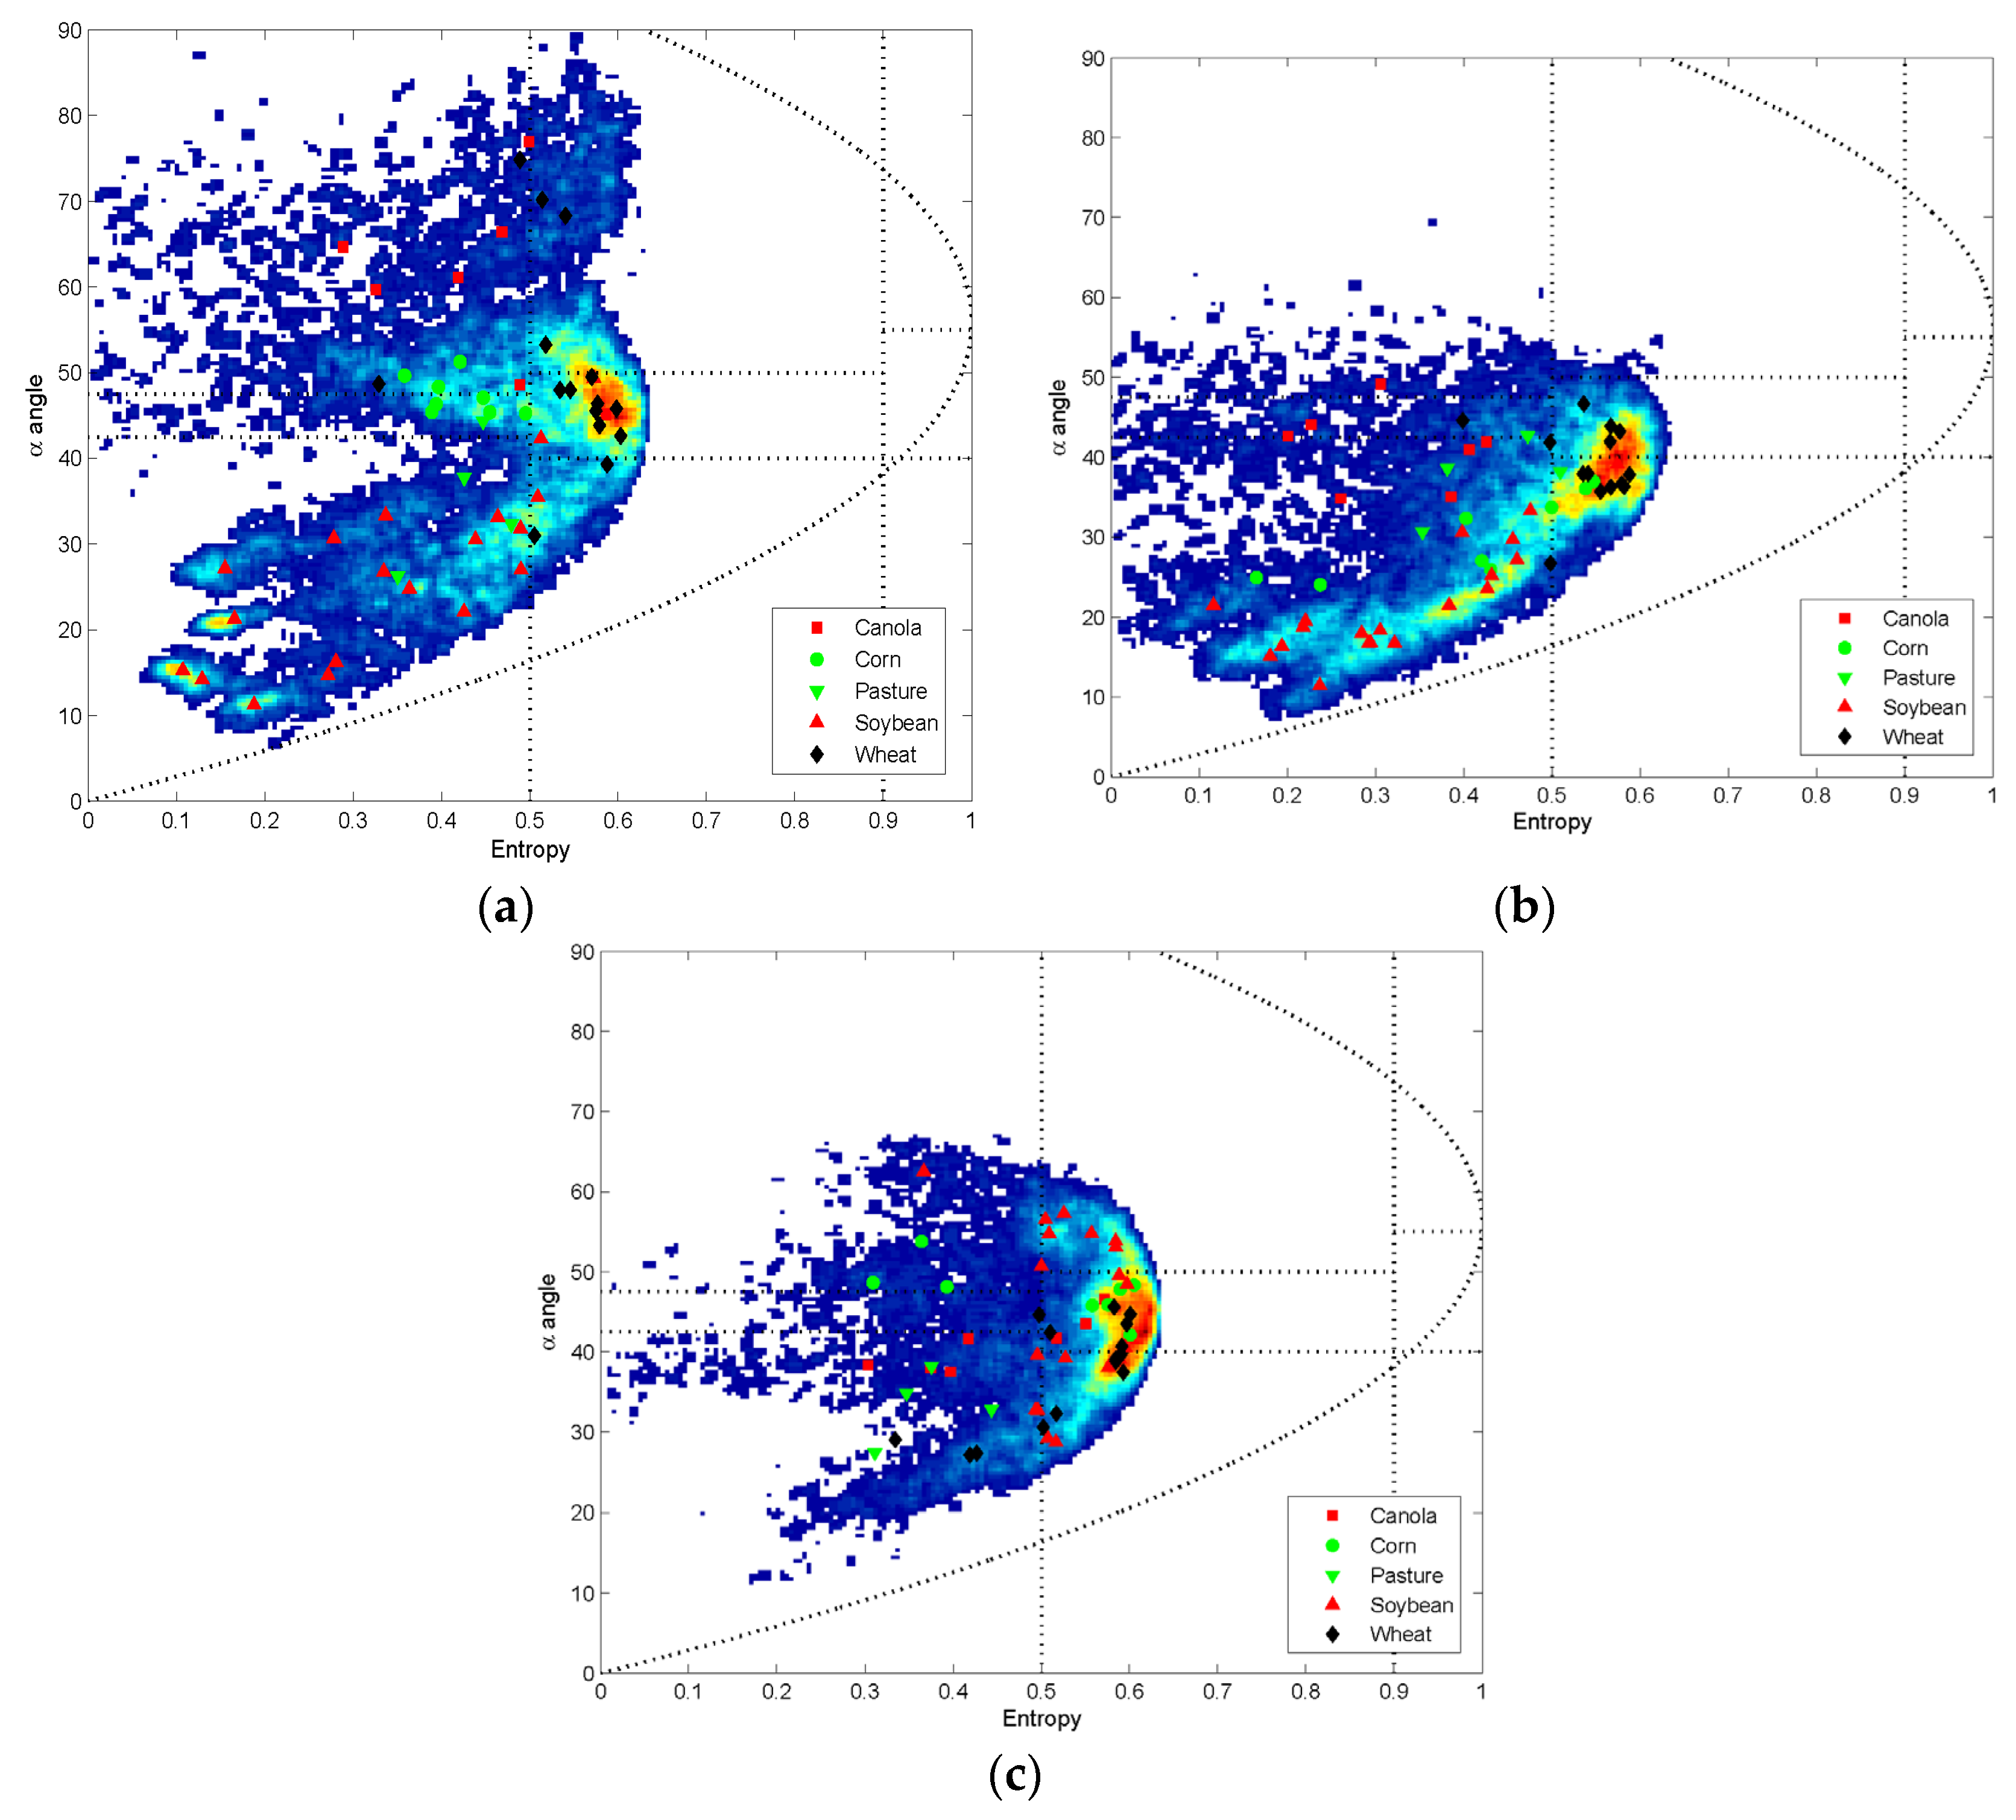
In this paper, a main challenge lies in the modeling of the vegetation contribution and its removal in order to better retrieve the soil moisture from the remaining surface scattering component. To understand the vegetation scattering, the polarimetric parameters entropy and α scattering angle (
Section 3.3) are used to build a 2-D plane, which is subsequently divided into nine zones for different scattering characteristics. For comparison purposes, for several dates,
Figure 9 and
Figure 10 show the results of 2-D statistical distribution density of crops obtained before and after the removal of the volume component respectively, with an over plot of the mean values of entropy and α angle for each test field. The color represents the statistical distribution density (from low density in blue to high density in red), while the dashed lines denote the boundary of the nine divided scattering characteristics. Through the comparison, the effect of volume contribution can be understood.
Figure 9 shows that soybean fields present the highest dynamic, especially for its entropy values. It can be seen in
Figure 9a, which corresponds to the beginning of campaign, that the soybean fields are dominated by the surface scattering (α angle is less than 45°), and they are well discriminated from the other crop types. With the growth of the soybean, the entropy and the α angle increase due to changes in crop structure (
Figure 9b). At the end of the campaign, when the crops are in the mature stage,
Figure 9c shows that the field distribution is more clustered, thus hampering any discrimination between the crops.
Figure 9.
Distribution of fields on entropy/α plane before the removal of the volume component on Julian day (a) 169 (17 June 2012); (b) 185 (3 July 2012); (c) 199 (17 July 2012).
Figure 9.
Distribution of fields on entropy/α plane before the removal of the volume component on Julian day (a) 169 (17 June 2012); (b) 185 (3 July 2012); (c) 199 (17 July 2012).
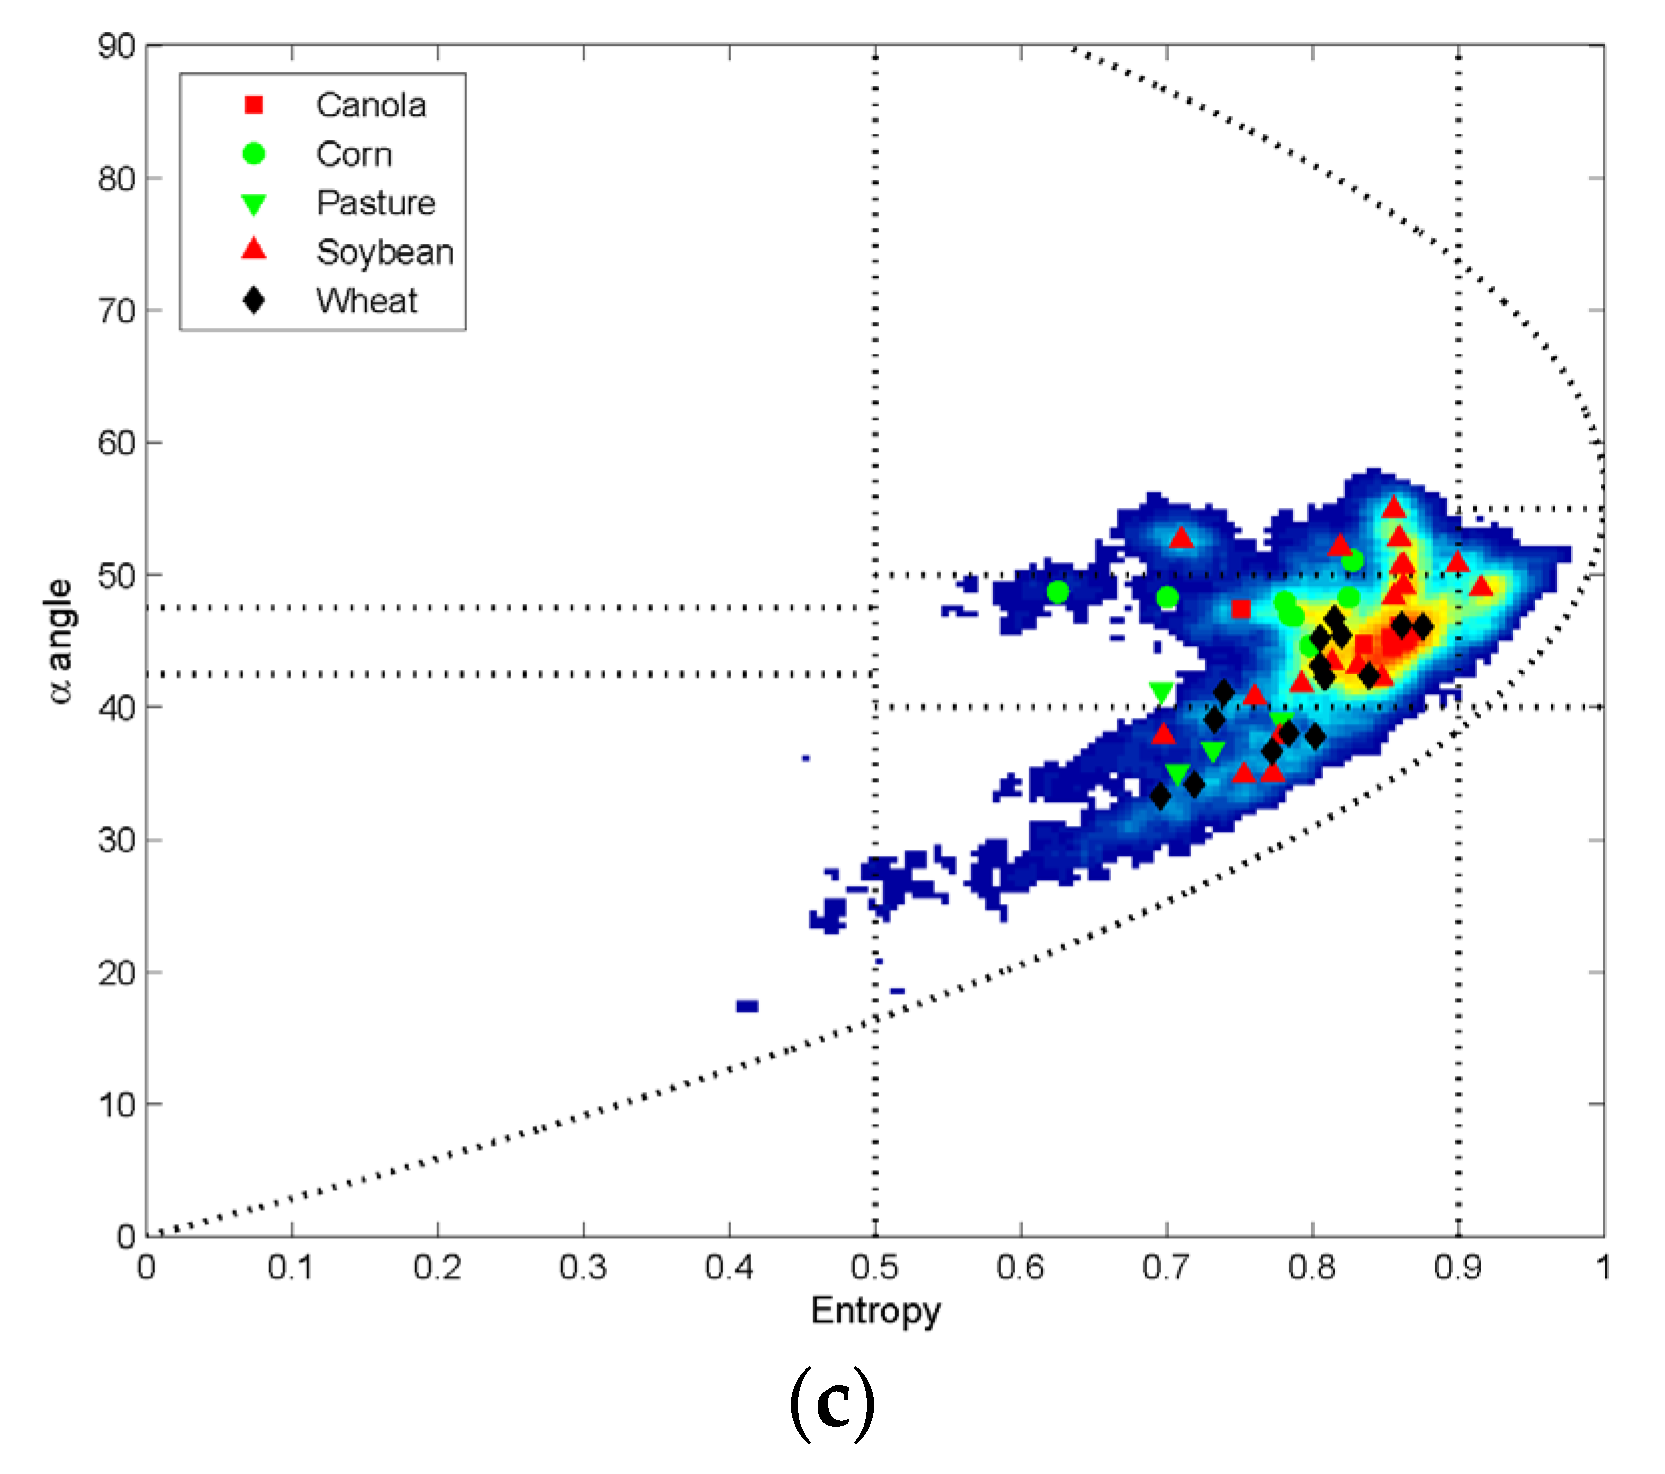
Figure 10.
Distribution of fields on entropy/α plane after the removal of the volume component on Julian day (a) 169 (17 June 2012); (b) 185 (3 July 2012); (c) 199 (17 July 2012).
Figure 10.
Distribution of fields on entropy/α plane after the removal of the volume component on Julian day (a) 169 (17 June 2012); (b) 185 (3 July 2012); (c) 199 (17 July 2012).
Comparing
Figure 9 and
Figure 10, a decrease in entropy values clearly appears for all crops. This result is expected since the remaining ground coherency matrix [Tg] used to generate the
Figure 10 represents the surface and dihedral scatterings, and consequently provides lower entropy than the results (
Figure 9) obtained from the measured coherency matrix [T3]. Nevertheless, in
Figure 10, some of the scattering α angles which are still located within the dipole/volume scattering region are probably related to the residual volume scatterings. These can be explained not only from the limitation of this polarimetric decomposition algorithm using fixed volume orientation cases, but also from the strict narrow criterion on α angle. Indeed, α angle used to characterize the scattering mechanisms stems from a purely empirical segmentation of the entropy/α plane [
20,
25].
Furthermore, the performance of the volume removal depends on both crop phenological stage and crop types due to different plant geometry and density. Better results were obtained for moderate vegetation height and biomass condition. For example, during mid-campaign, the peak value of 2-D distribution density is shifted significantly into the surface scattering region in the entropy/α plane (
Figure 10b). In contrast, at the beginning and the end of the campaign, the volume contribution can only be partially removed. Indeed, in this study, the vegetation structure is modeled as dipoles considering three fixed orientation cases. However, the low vegetation (lacking strict stem) and the high vegetation status (with abundant leaves and ears) seem to be represented by a spherical-like shape [
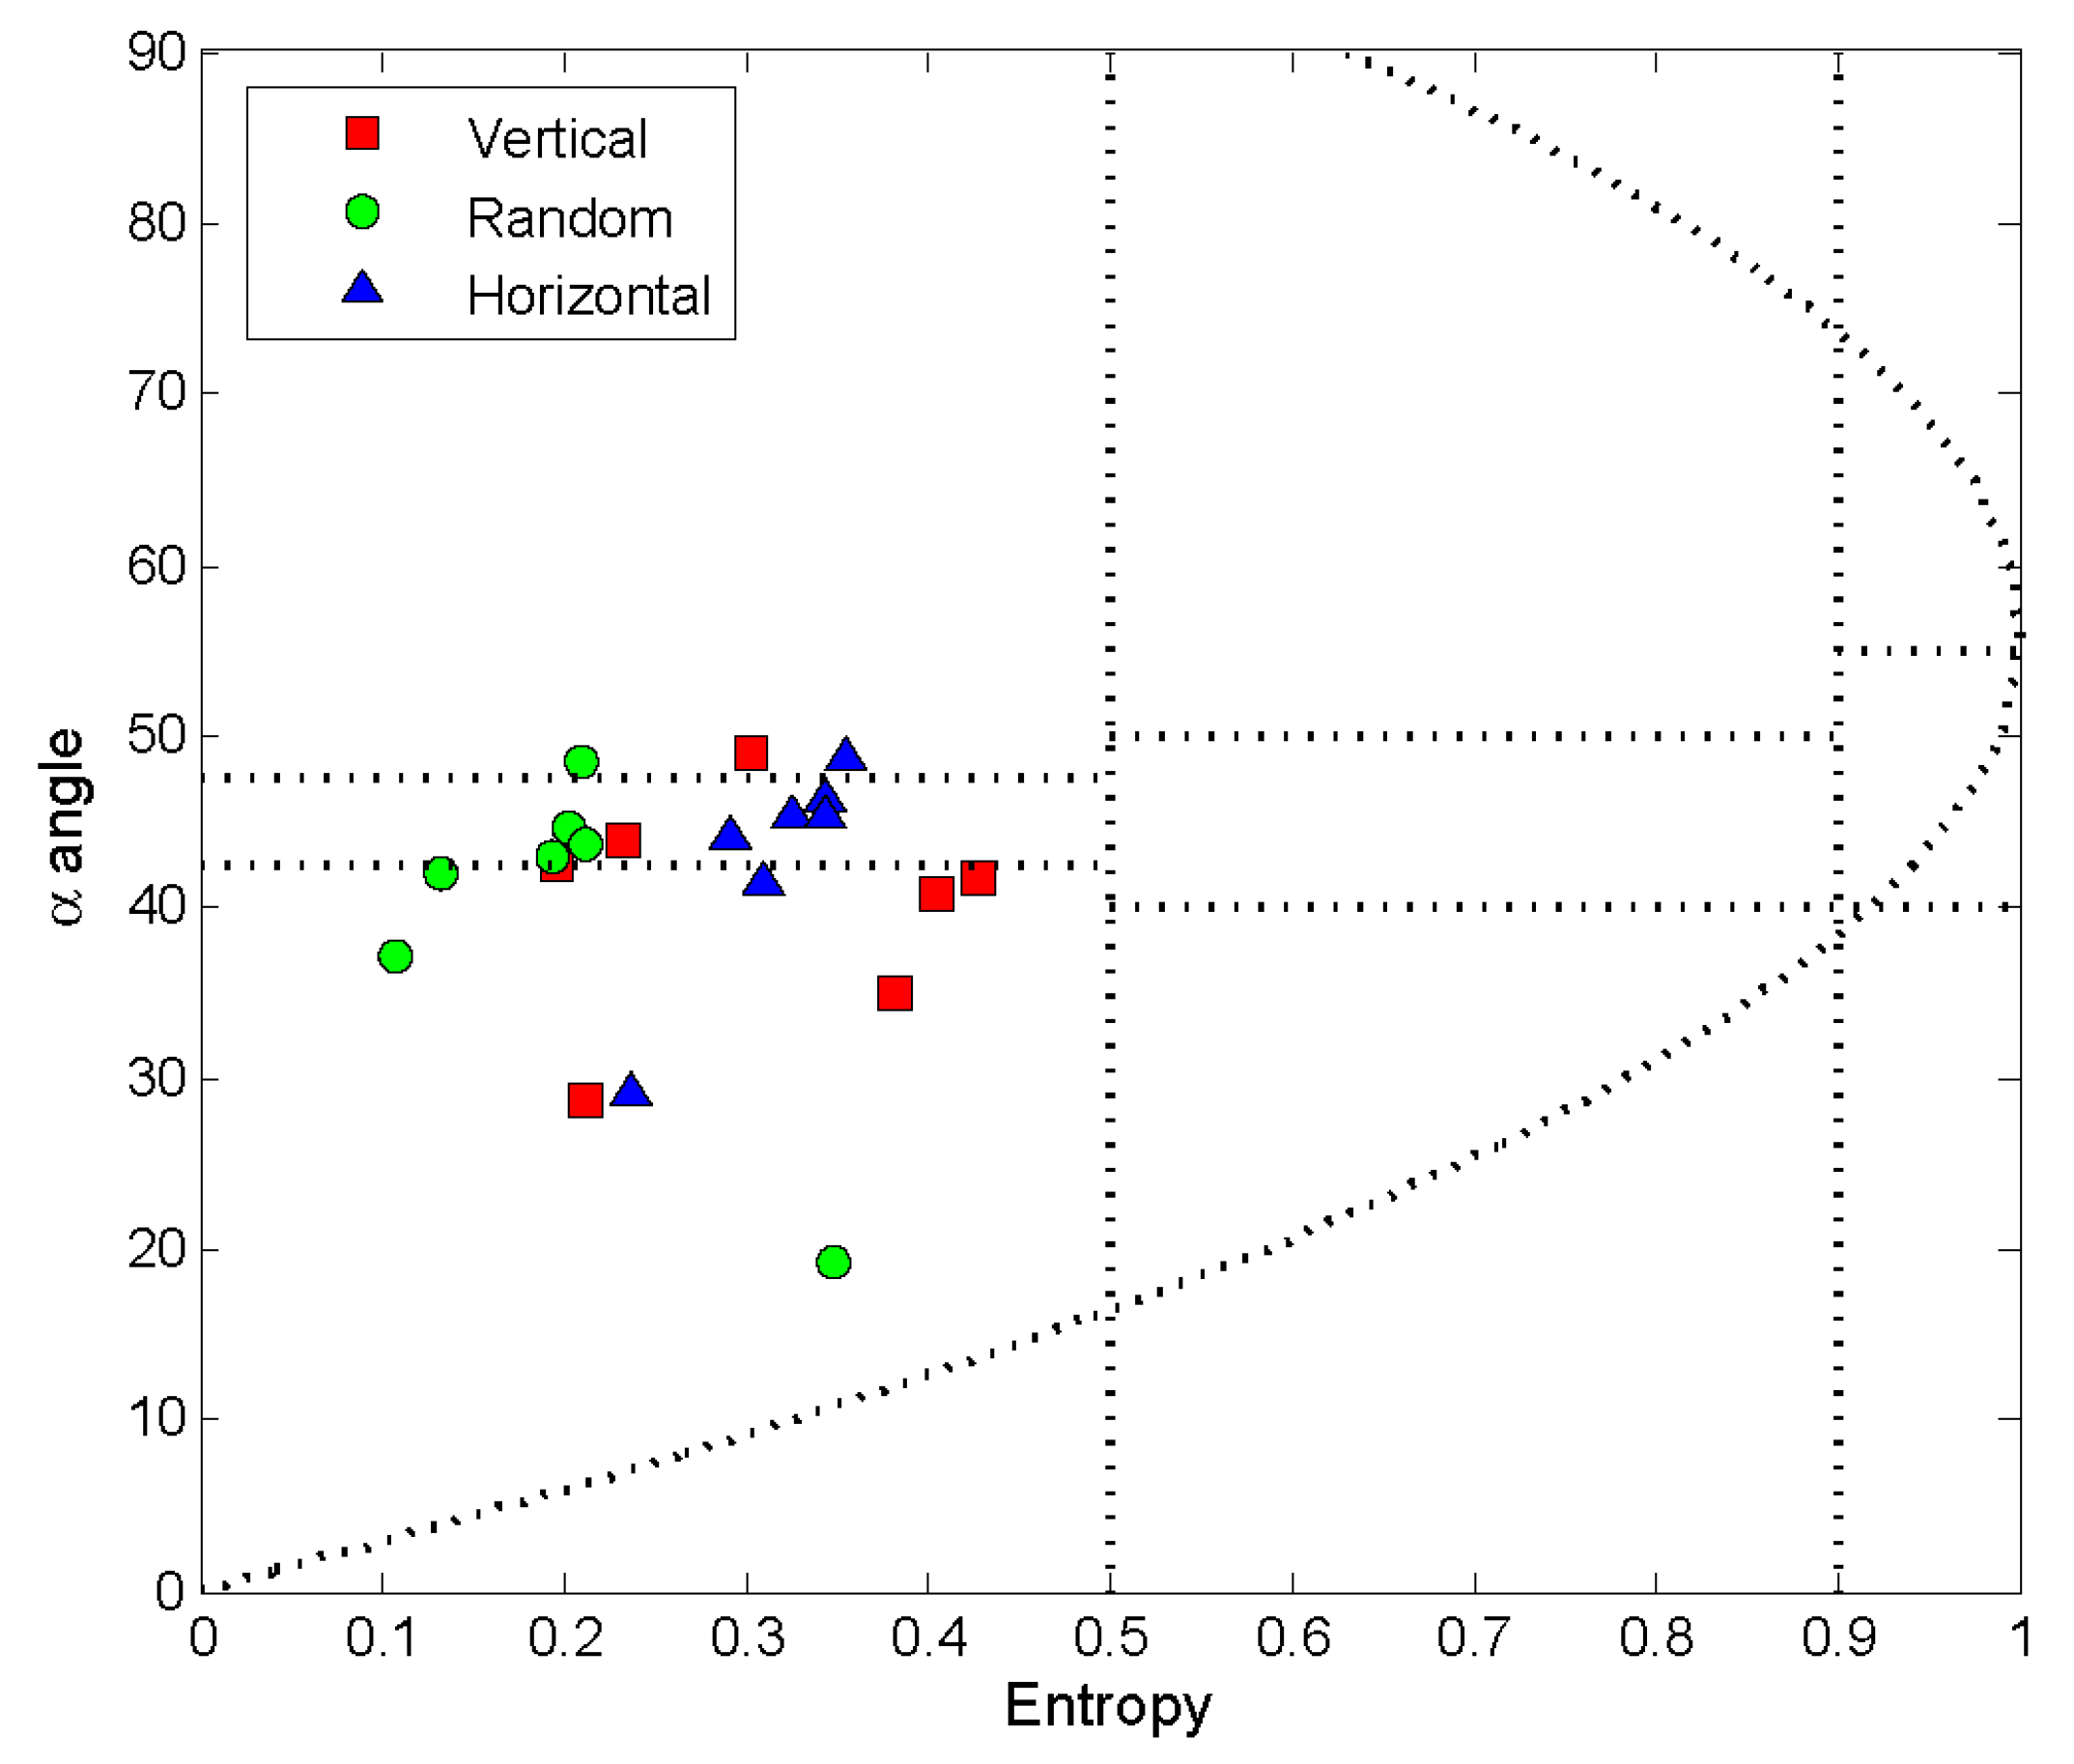
1]. As for the effect of crop types on the performance of the volume scattering modeling and removal, good results are obtained for soybean and pasture. We expect therefore that these crops match better with the predefined and fixed volume coherency matrix. Nevertheless, the volume contribution of wheat and canola can only be partially removed by the proposed volume model (Equation (6)). It is likely that their orientations are not sufficiently represented by the only three fixed volume components. In order to further analyze the effect of the three fixed vegetation orientation cases on the removal of the volume component, the exemplary results obtained over canola fields on day 185 (3 July 2012) are compared through the entropy/α plane presented in
Figure 11. For this crop and at this phenological stage particularly, even though there is no clear tendency in the results shown in
Figure 11, vertical orientation seems to provide the best one. Therefore, any failure in considering the appropriate crop orientation will negatively impact the modeling and the removal of the volume component.
Figure 11.
Distribution of canola fields on entropy/α plane after the removal of volume scattering component on Julian day 185 (3 July 2012) for three vegetation orientations (vertical, horizontal and random).
Figure 11.
Distribution of canola fields on entropy/α plane after the removal of volume scattering component on Julian day 185 (3 July 2012) for three vegetation orientations (vertical, horizontal and random).
4.3. Soil Moisture Retrieval Results
They are obtained from the fields characterized by a dominant surface scattering component, after the removal of the volume scattering component.
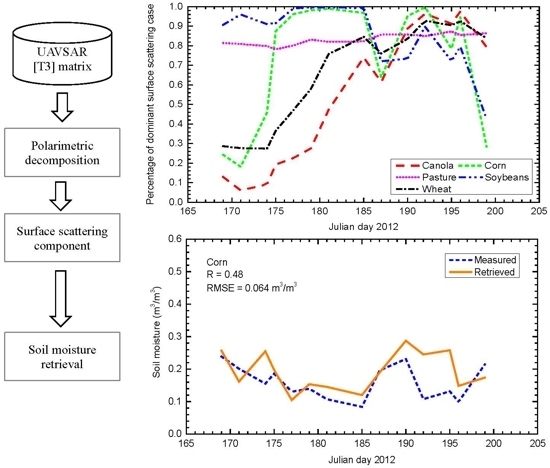
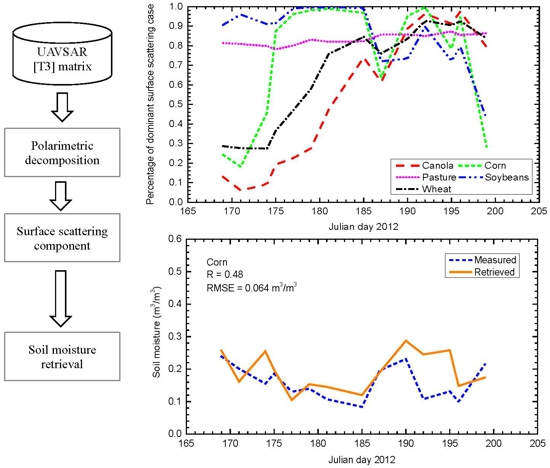
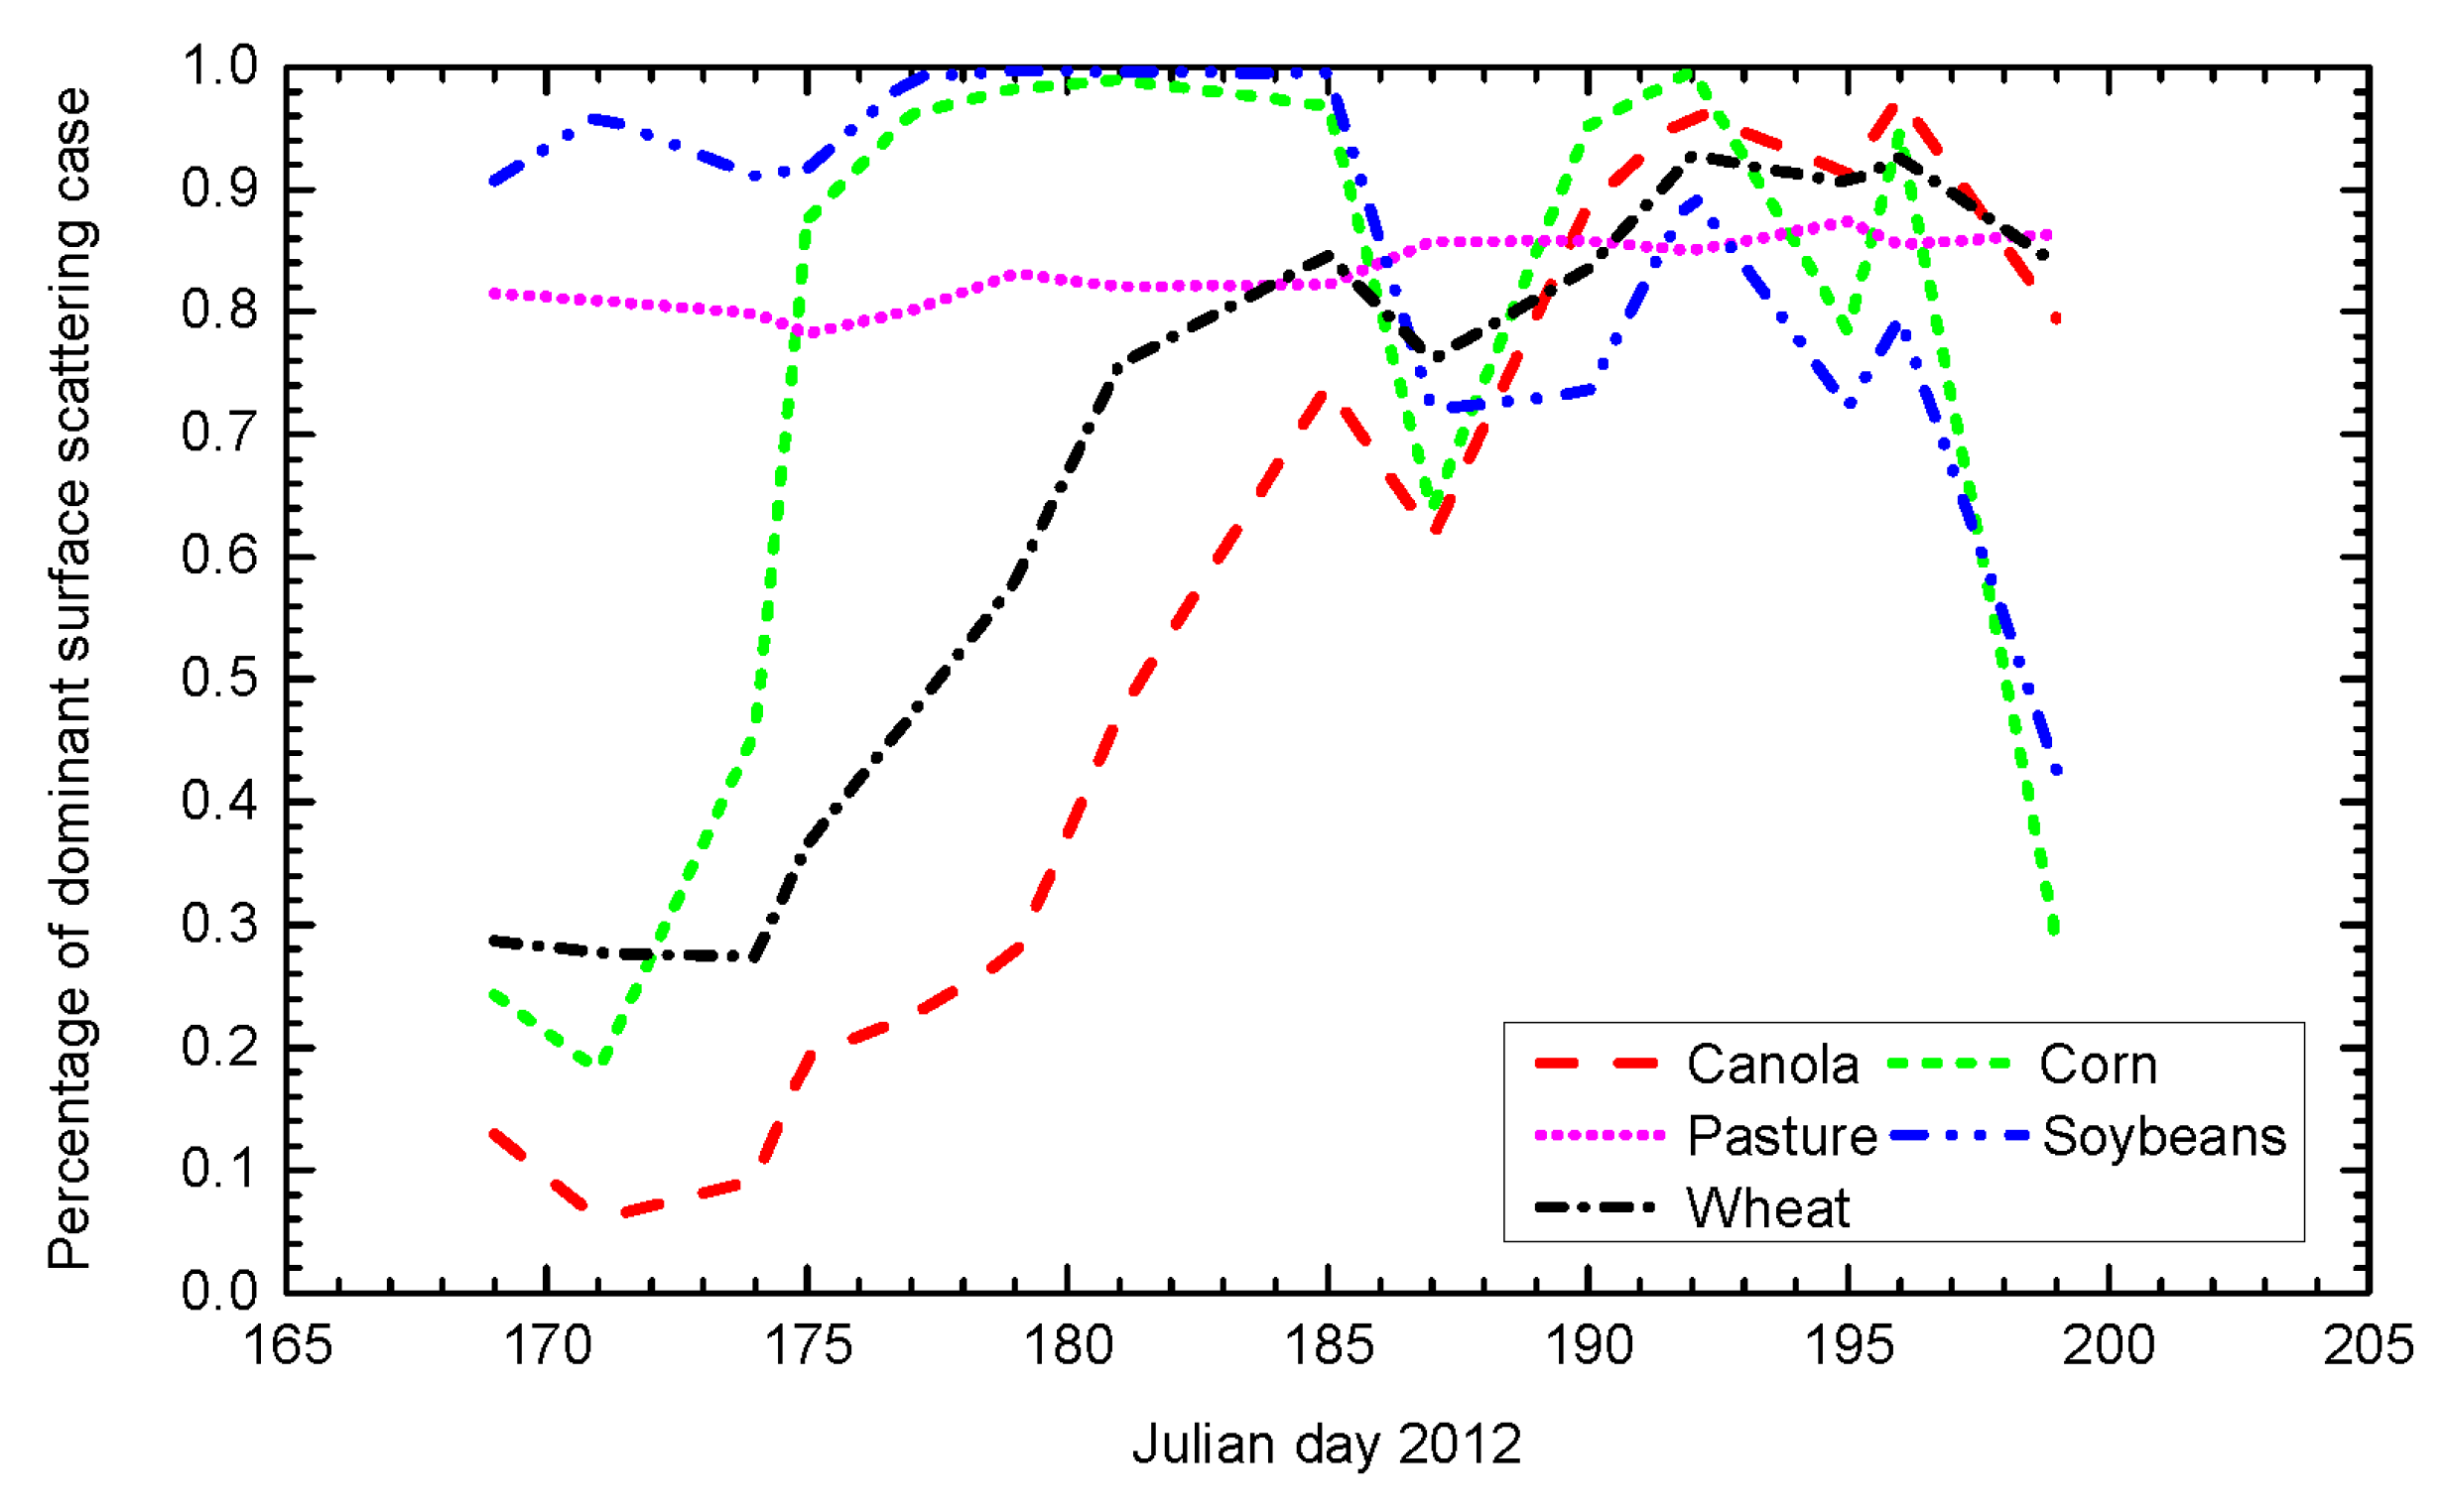
(1) Percentage of dominant surface scattering after removing the volume component: In order to ensure both the retrieval accuracy and spatial inversion rate, a given field was selected for soil moisture inversion, if more than 10% of its area was covered by pixels satisfying the dominant surface scattering criteria. Since for canola, corn and wheat’s fields the dominant surface scattering cases were low at the beginning of the campaign (
Figure 12), thresholding the dominant surface scattering cases at 10% allowed retrieval of the soil moisture for almost all the crops. However, as the soil moisture retrieval algorithm is a simplified one, which is only based on the dominant surface scattering, the accuracy is compromised in the conditions of the highly dominant dihedral scattering component. Consequently, for these fields characterized by more than 10% of dominant surface scattering cases, a spatial average of soil moisture was computed from the retrieved soil moisture obtained over the pixels with the dominant surface scattering. Considering
Figure 12 which presents the percentage of the dominant surface scattering case for different crop types, the surface scattering component could be used as inputs in the retrieval process, except for canola fields before Julian day 173 (June 21), when the dominant surface scattering case is lower than 10%. Due to the complementarity between the dominant surface scattering and the dihedral scattering component in the remaining signal,
Figure 12 also indicates an important dihedral scattering component for canola, wheat and corn from Julian day 169 to 178 (from June 16 to 26). Under such conditions, less performance of the simplified polarimetric soil moisture retrieval algorithm will be obtained, which is mainly due to the over-subtraction of volume scattering contribution.
Figure 12.
Percentage of dominant surface scattering case after removing volume scattering component, for different crop types.
Figure 12.
Percentage of dominant surface scattering case after removing volume scattering component, for different crop types.
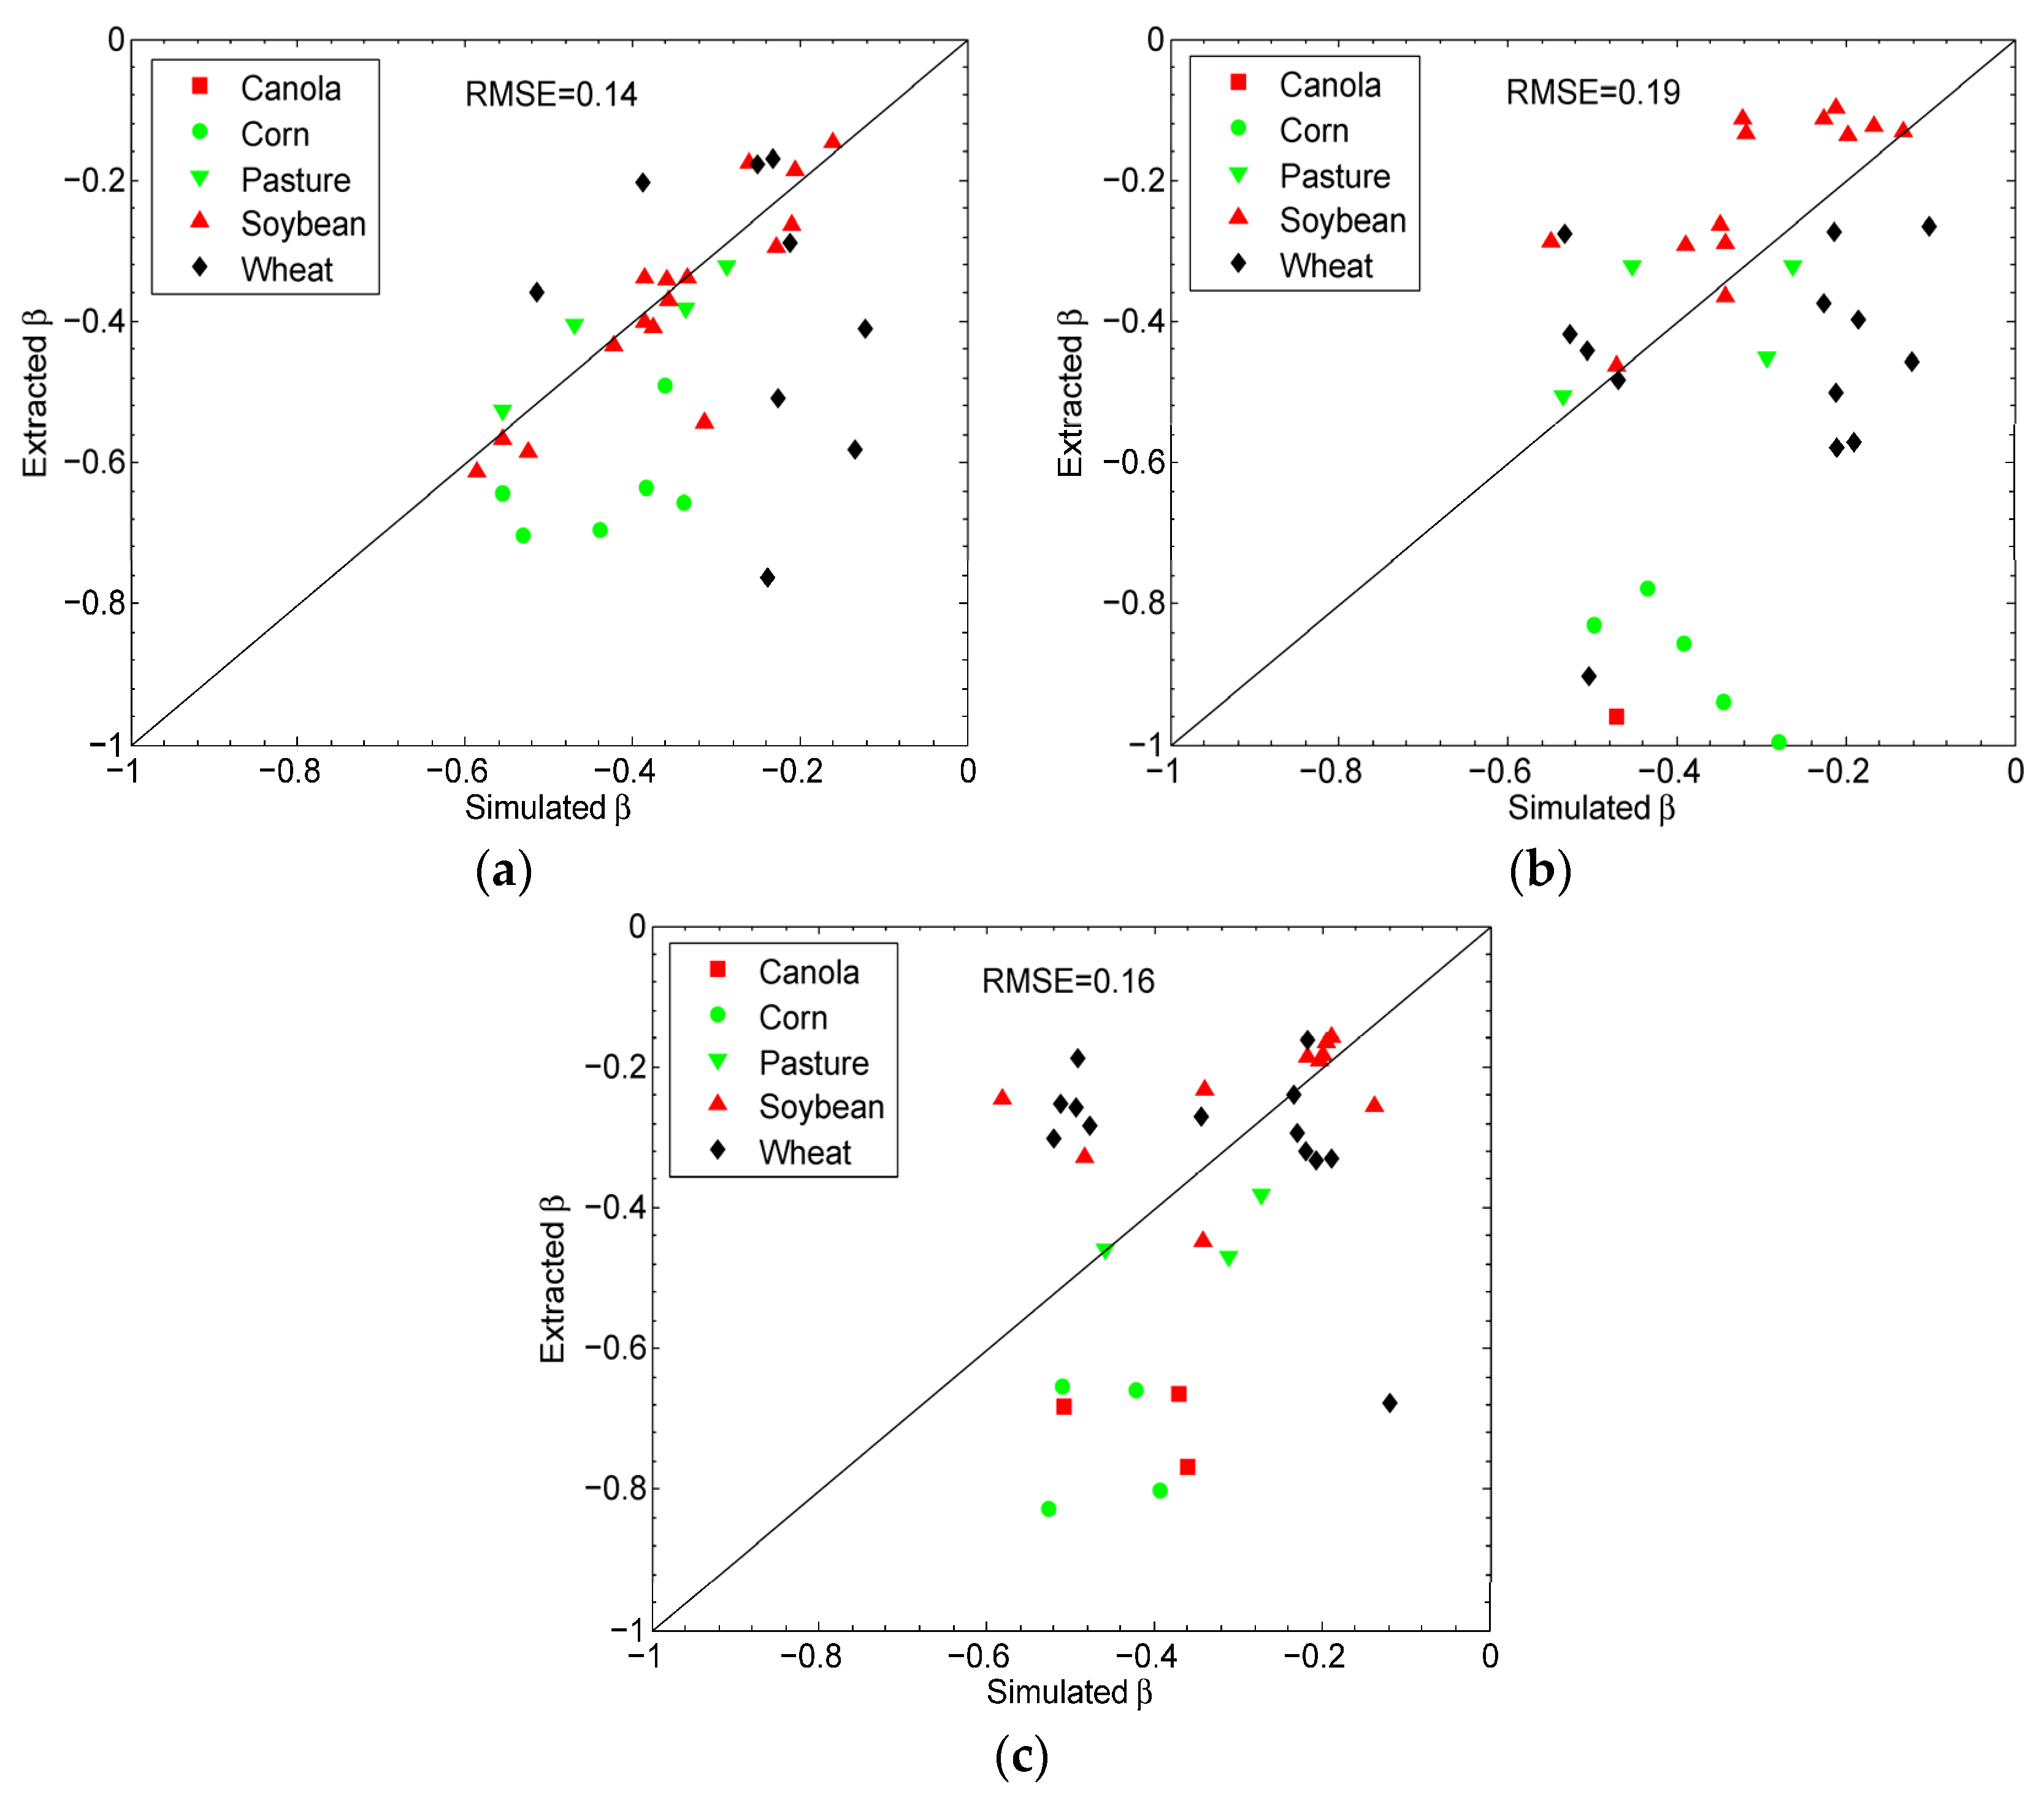
(2) Evaluation of the simulated β parameter: This step is important since the soil moisture is derived from the normalized difference of Bragg scattering in H and V polarization β (
Figure 4).
Figure 13 compares the β
data values which are derived from UAVSAR data with corresponding simulation values obtained using the known incidence angles of UAVSAR and the field average of the measured soil moisture as inputs. In
Figure 13, each β
data value is a field average for a given sampling field (it is computed by averaging the values of all the pixels within the targeted field, except the pixels near the field boundary to remove boundary effects). Disagreements are found between the simulated and the derived β parameter for canola, wheat and corn crops, while for soybean and pasture the results of β
data and β
simu match better. This result is in line with the analysis of the scattering mechanisms conducted in
Section 4.2, specifically the limitations observed in the volume scattering modeling for canola and wheat and its good performance for soybean and pasture. However, for soybean and pasture, the weak deviation observed between the simulated and the derived values of β confirms the ability of the surface and volume scattering formulations, as described in [
1], to model the phenological development of short vegetation such as soybean and pasture. Therefore, it is important to highlight that the applicability of the simplified polarimetric soil moisture retrieval algorithm is dependent on both the crop type and the crop development stage.
Figure 13.
Comparison between simulated and measured β on Julian day (a) 169 (17 June 2012); (b) 185 (3 July 2012); (c) 199 (17 July 2012).
Figure 13.
Comparison between simulated and measured β on Julian day (a) 169 (17 June 2012); (b) 185 (3 July 2012); (c) 199 (17 July 2012).
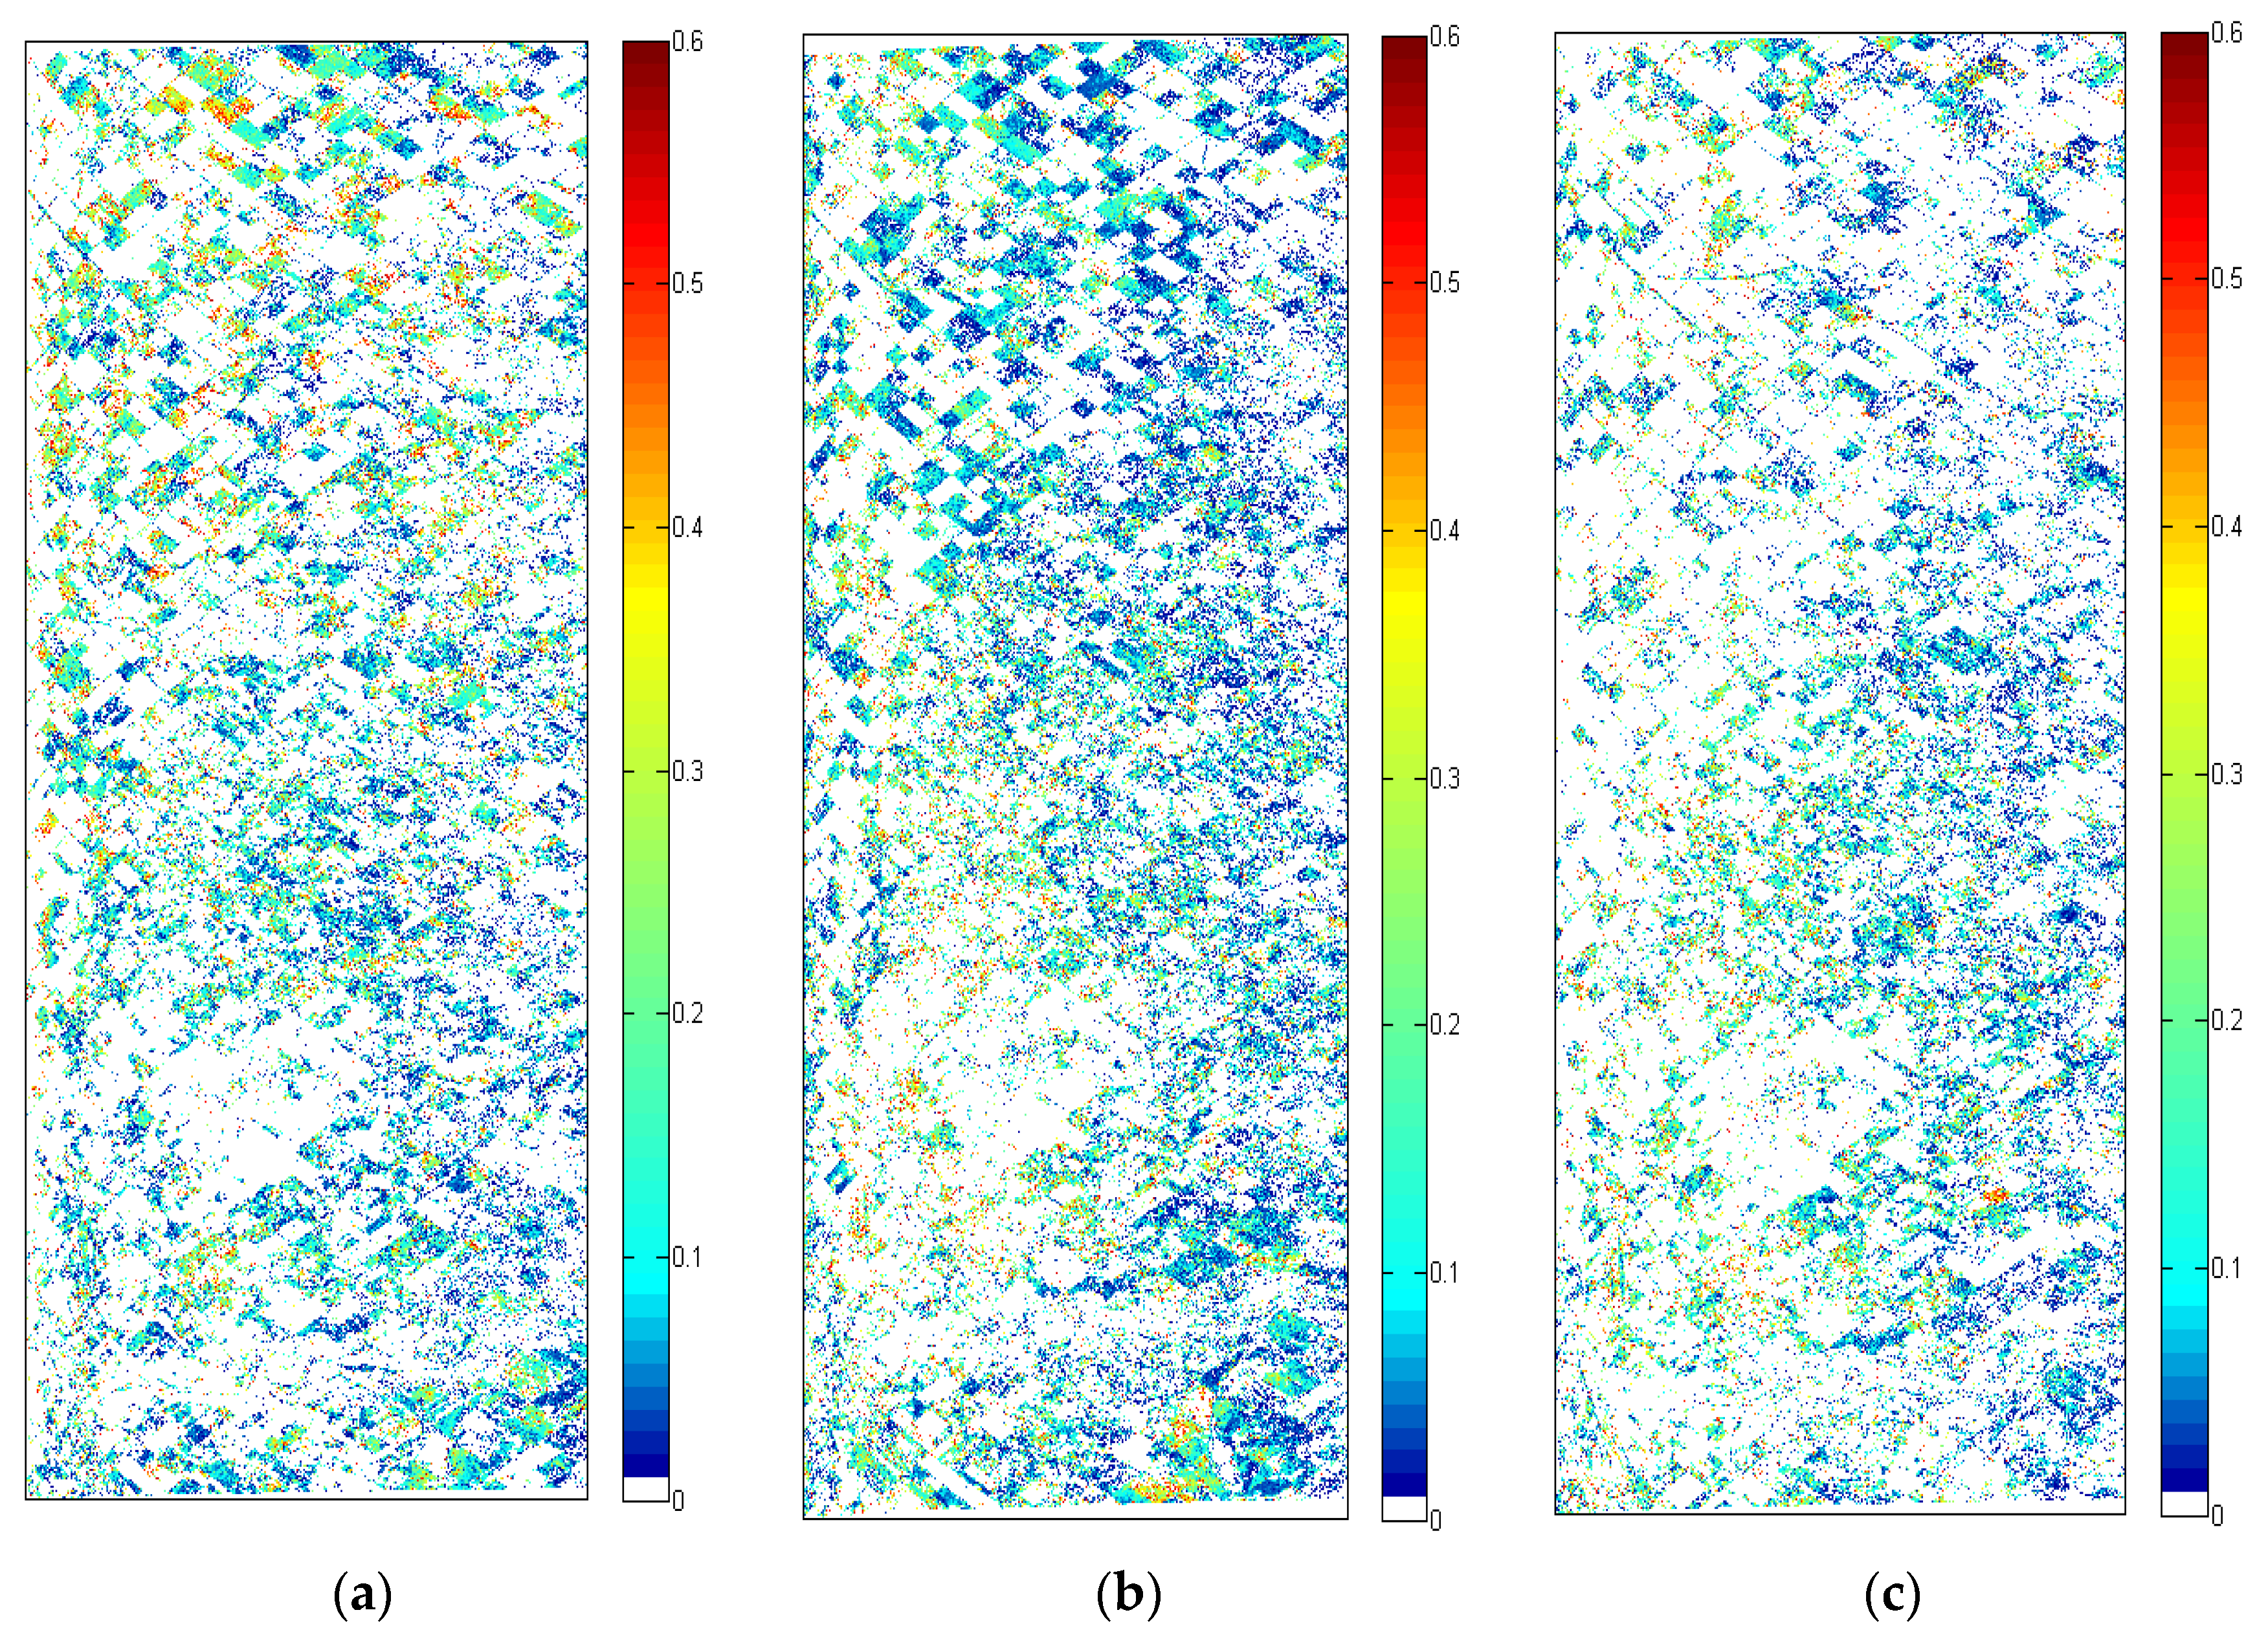
Figure 14.
Spatial distribution of the retrieved soil moisture on Julian day (a) 169 (17 June 2012); (b) 185 (3 July 2012); (c) 199 (17 July 2012).
Figure 14.
Spatial distribution of the retrieved soil moisture on Julian day (a) 169 (17 June 2012); (b) 185 (3 July 2012); (c) 199 (17 July 2012).
(3) Analysis of the retrieved soil moisture from the surface scattering component: Figure 14 presents the maps of the retrieved soil moisture for the beginning, middle and end of the agricultural campaign, while the invalid pixels are set to white color. Two main reasons can explain these invalid pixels: First, some pixels are characterized by a dominant dihedral scattering after the removal of the volume component. Indeed, in this study, the dihedral component is disregarded due to its ambiguity and disturbance by the wave propagation (the dihedral intensity
fd needs to be compensated properly [
1,
2]) as well as the low improvement in the soil moisture inversion rate that could be obtained. Second, for some pixels characterized by a dominant surface scattering, the corresponding β value is less than −1, which is non-physically correct [
1]. However, the range (5% to 50%) of the retrieved soil moisture observed in
Figure 14 is in agreement with that of the
in situ soil moisture measurements [
18]. Furthermore, while some inversion results are provided as field-average values [
5], it is interesting to underline the ability of this algorithm to inform about the spatial variability in soil moisture at the field scale (
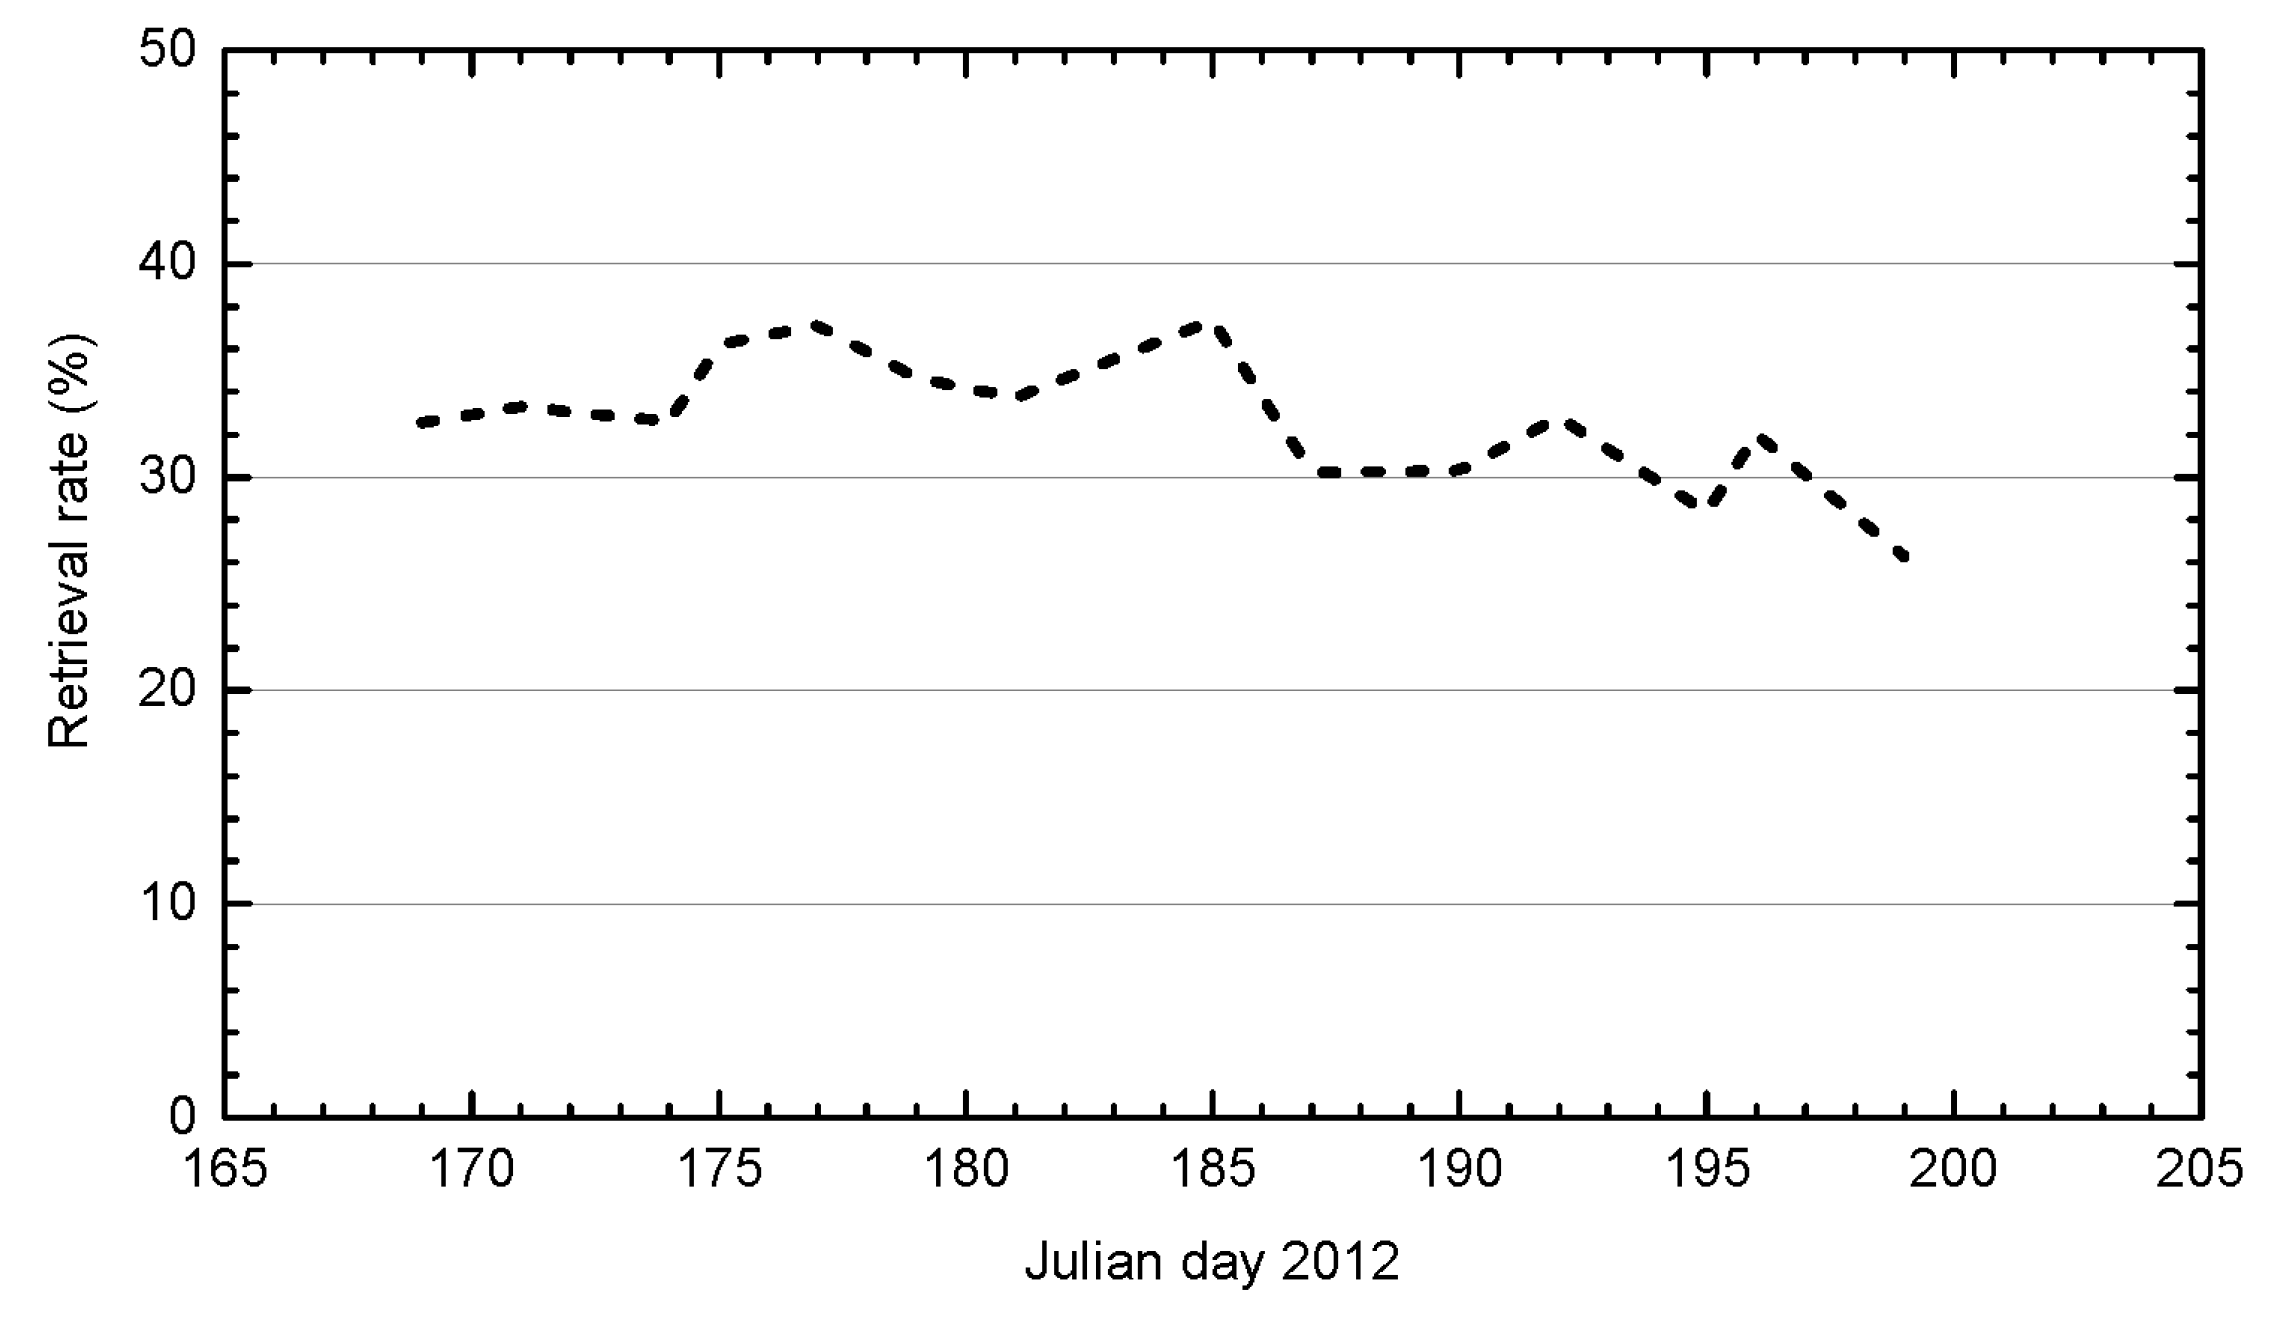
Figure 14). As for the retrieval rate in
Figure 15, it varies from 26% to 38% before the mature stage of the crops and then decreases, thereby leading to high amount of white pixels in
Figure 14c.
Figure 15.
The retrieval rate by using surface scattering component.
Figure 15.
The retrieval rate by using surface scattering component.
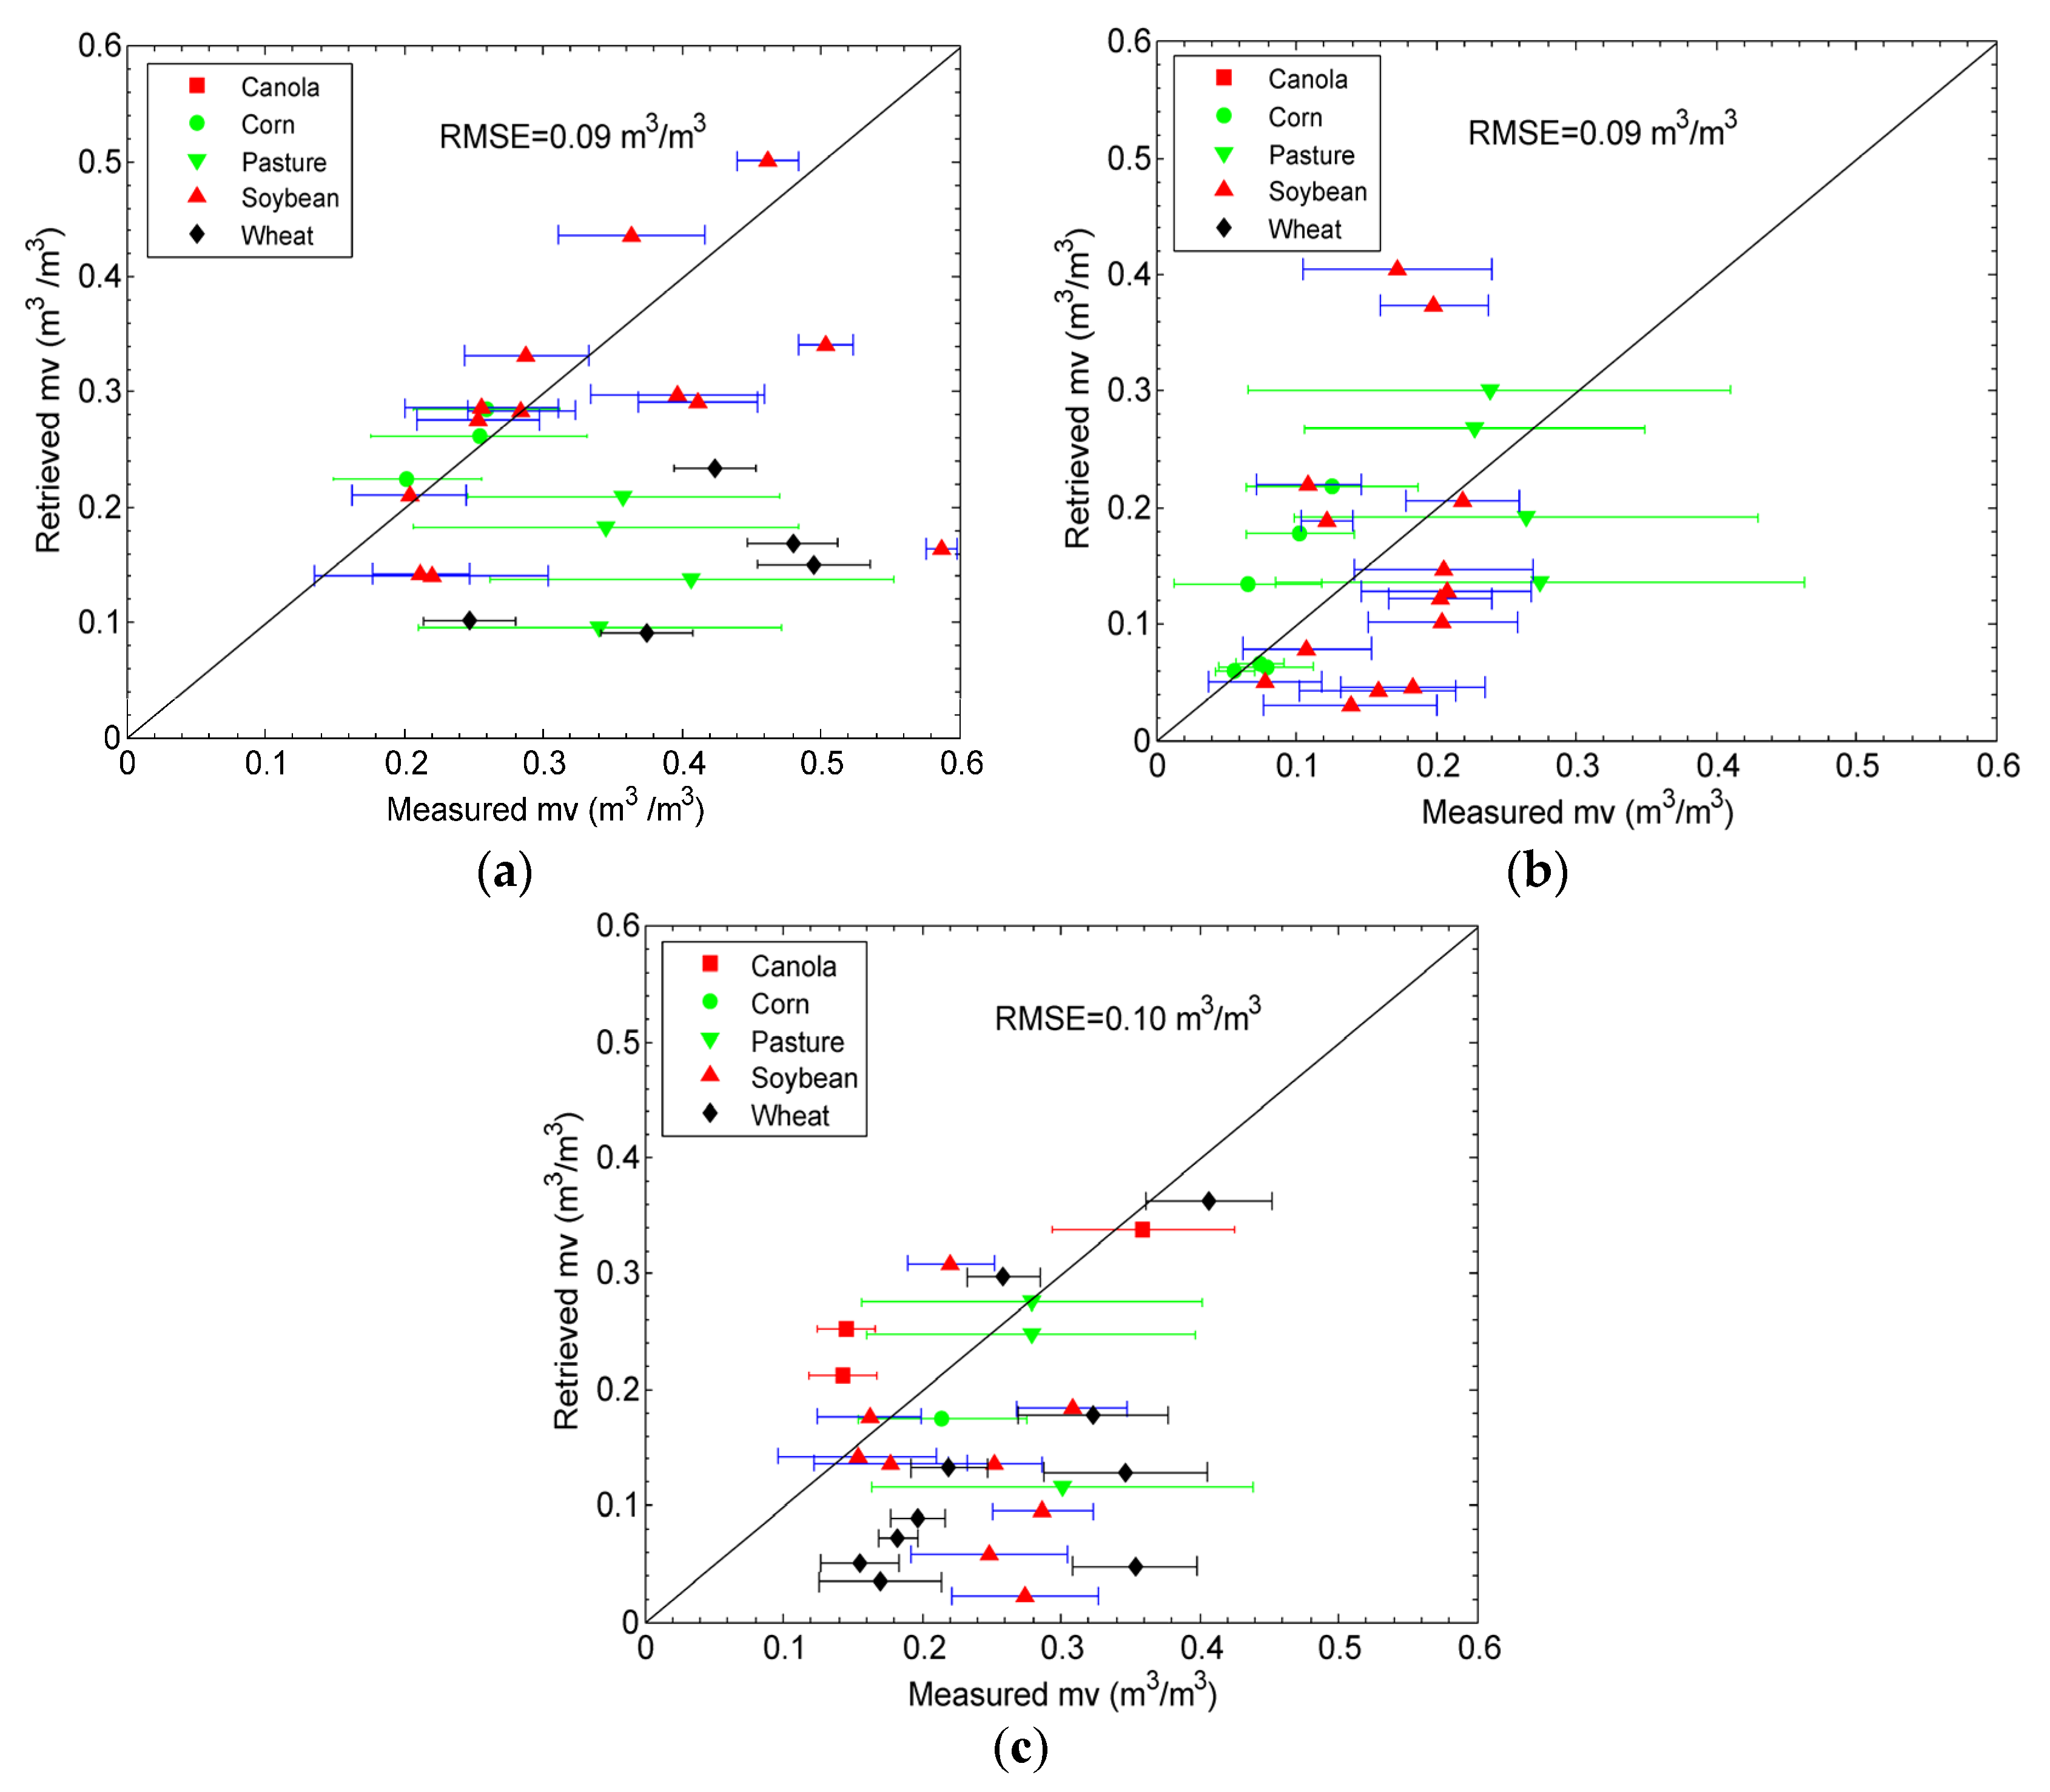
Figure 16.
Comparison between the retrieved and measured soil moisture on Julian day (a) 169 (17 June 2012); (b) 185 (3 July 2012); (c) 199 (17 July 2012).
Figure 16.
Comparison between the retrieved and measured soil moisture on Julian day (a) 169 (17 June 2012); (b) 185 (3 July 2012); (c) 199 (17 July 2012).
A quantitative analysis is also conducted by comparing the mean values of the retrieved soil moisture on each field with the
in situ soil moisture measured during the SMAPVEX12 experiment. However, in agreement with the scattering mechanism analysis (
Section 4.2) and β simulation values (
Figure 13),
Figure 16 shows that better results are obtained over the fields covered by soybean and pasture than those covered by other crop types, especially at the beginning of the campaign. Besides,
Figure 16 shows that the canola fields are not invertible for some dates. On Julian day 199, the inversion succeeded over three canola fields (
Figure 16c) with an RMSE value around 0.06 m
3/m
3. For the corn fields, the accuracy of most of the retrieved results is less than ±0.1 m
3/m
3. As for the wheat fields, it should be noted that the
in situ measurements are missed on Julian day 185, thus the comparison with the retrieved results cannot be performed (
Figure 16b).
Figure 16a,c show that over the wheat fields the results are underestimated mainly due to the bias of β values (
Figure 13), which stems from the partial removal of the volume scattering component (
Figure 10).
4.4. Validation
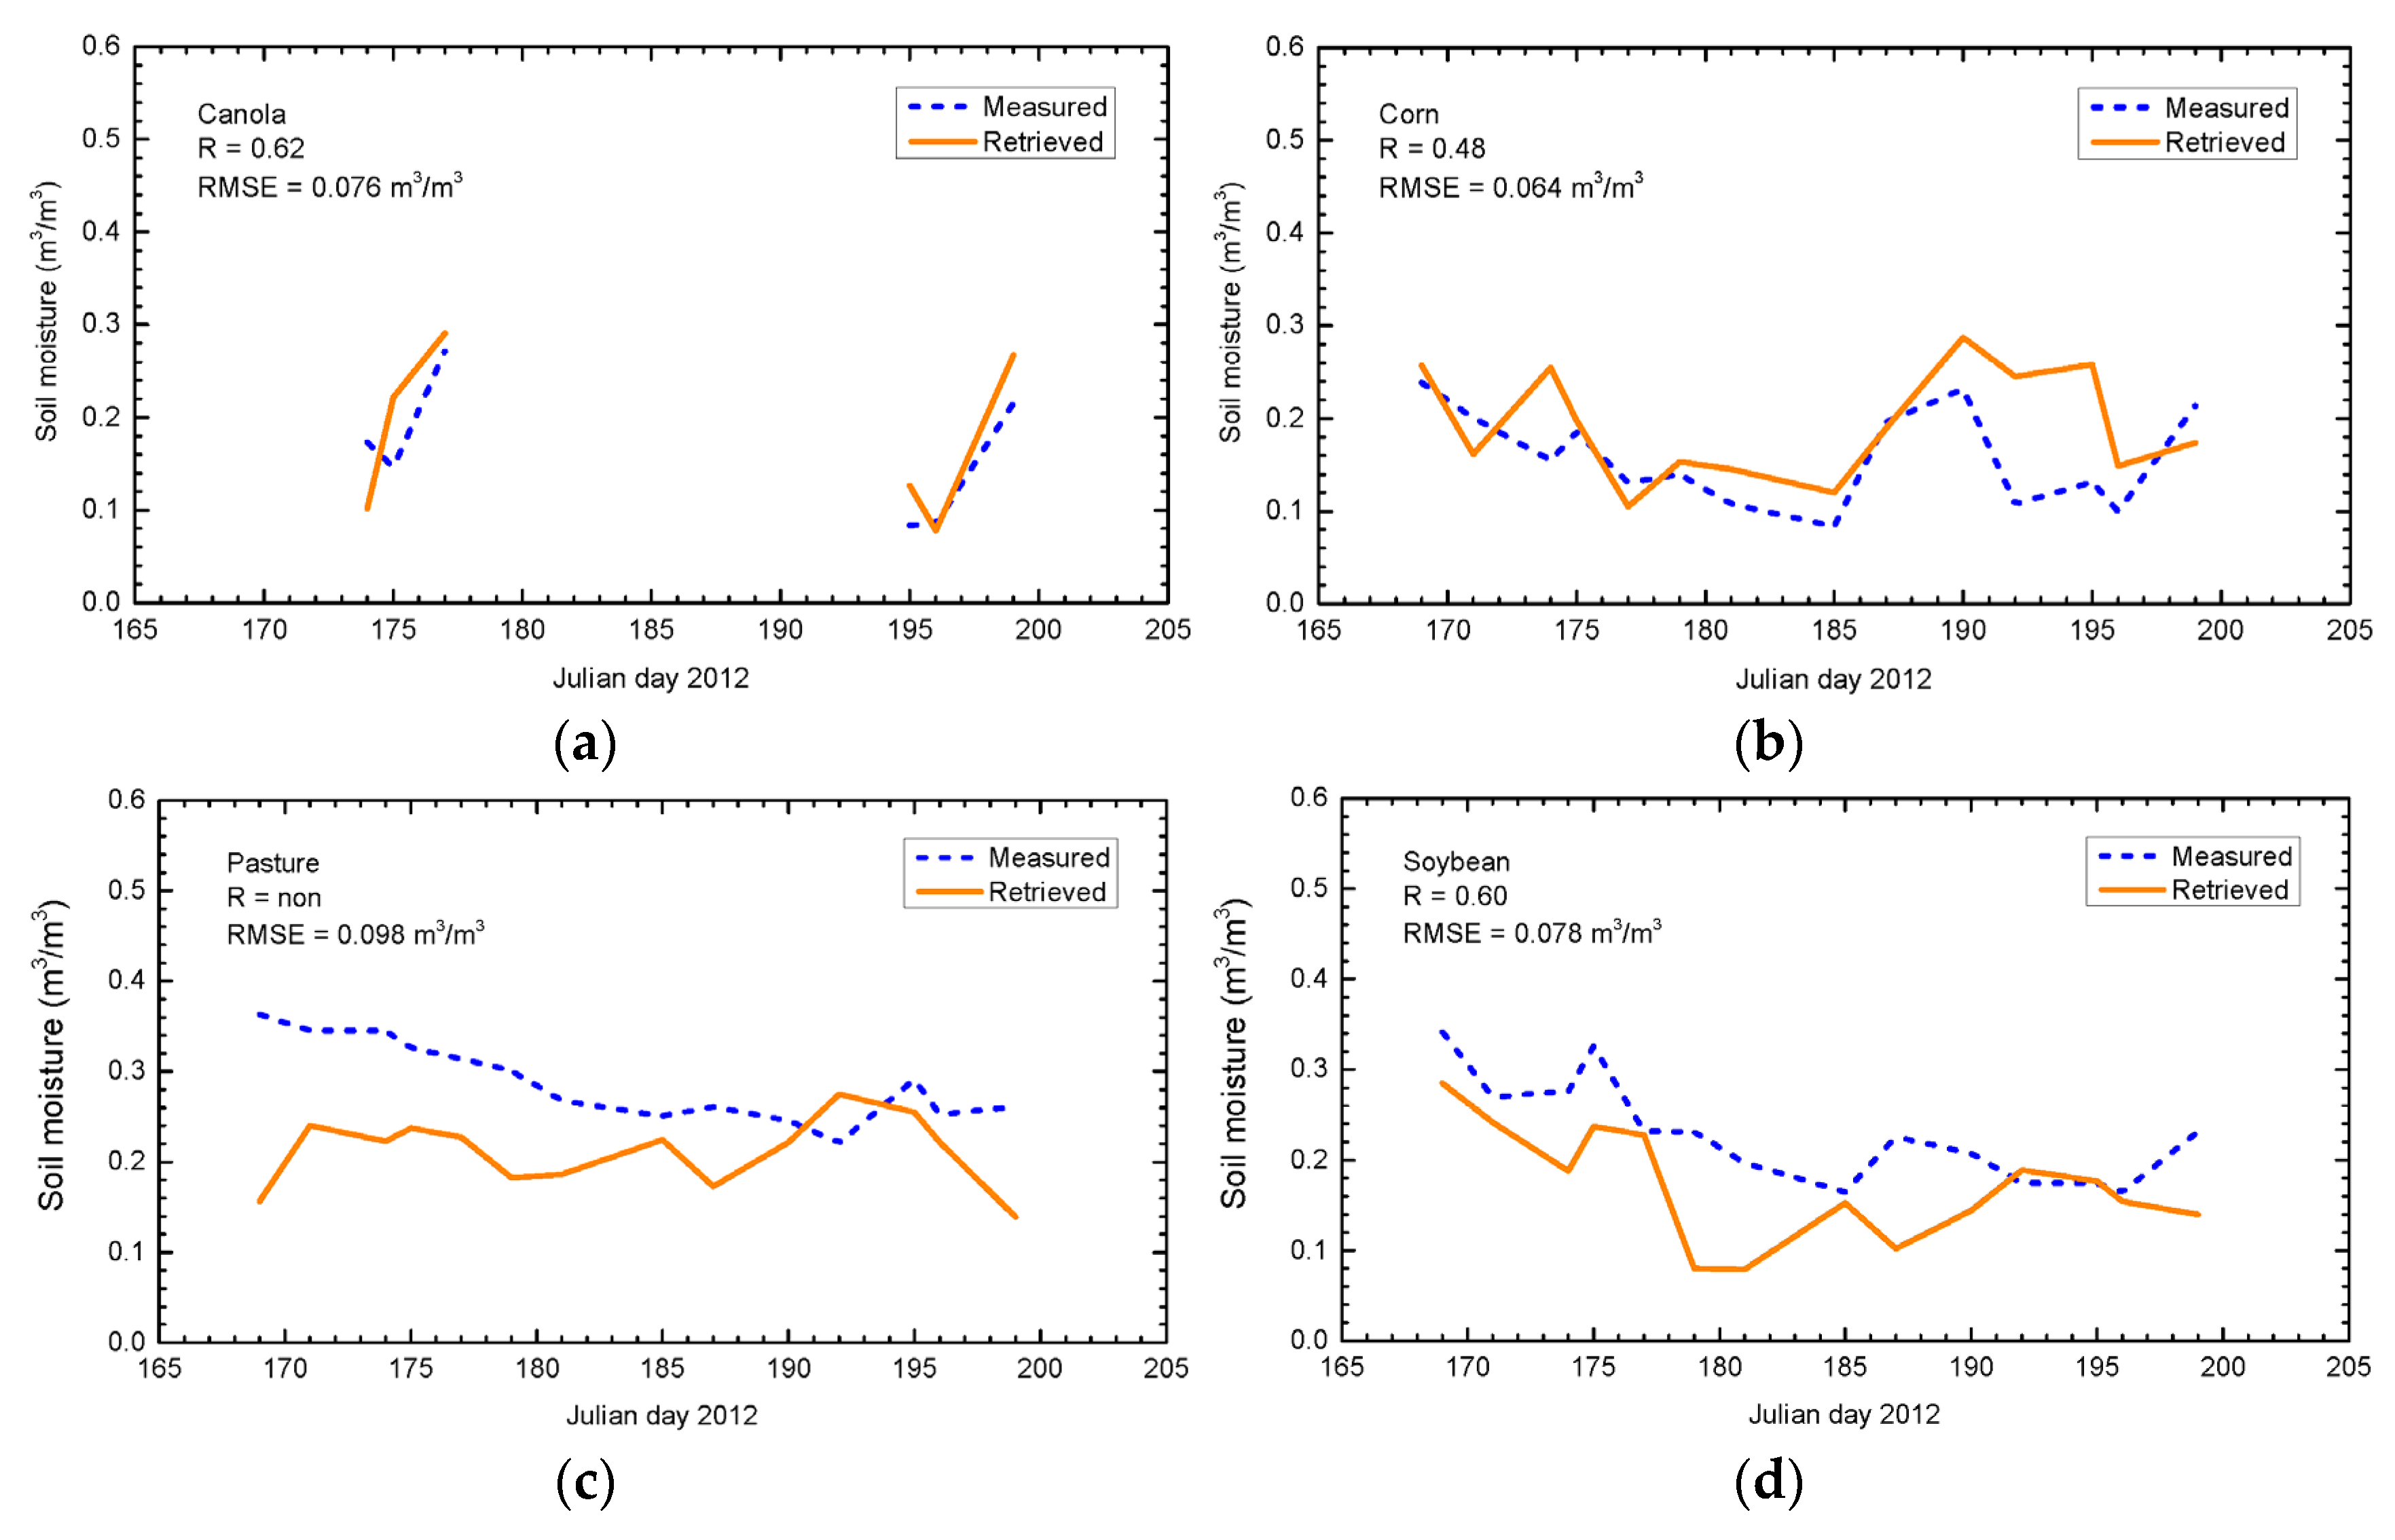
In
Figure 17, for each crop type, the time series of the mean value of the retrieved soil moisture are presented, along with that of
in situ soil moisture measurements:
For the canola (
Figure 17a), soil moisture cannot be inverted for the most part of the phenological period (around 80%). Even if after removing the volume scattering contribution the surface scattering component is dominant over the canola fields (
Figure 12), the second condition that its β
data values should be confined between −1 and 0 is generally not respected. Therefore, the obtained low values of β
data (less than −1) are considered as non-theoretically correct for soil moisture inversion. These invalid low values of the extracted β
data are a consequence of the limitations observed in the modeling of the volume scattering of canola fields. However, although the soil moisture can be retrieved on some days (e.g. around the days of June 23 and July 14) with a RMSE of 0.076 m
3/m
3 and a correlation of 0.62, the low inversion rate (20 %) limits the application of this algorithm to canola crops.
For the corn (
Figure 17b), the temporal evolution of the measured and the retrieved soil moisture agrees well up to Julian day 190 (July 8th). According to the temporal evolution of vegetation characteristics presented in
Figure 3, high height (more than 150 cm), biomass (more than 3.5 kg/m
2), vegetation water content (more than 2.8 kg /m
2) and fast changes in corn structure can explain the higher difference observed between the measured and the retrieved soil moisture after Julian day 190.
For the pasture (
Figure 17c), RMSE of 0.098 m
3/m
3 is obtained. However, there is no correlation between the temporal variation of the retrieved and the measured soil moisture. A possible reason may be the large
std values of the measured soil moisture over pasture fields (
Figure 16). Besides, compared to the agricultural fields, the pasture characteristics are more heterogeneous.
For the soybean (
Figure 17d), the retrieval is achieved with a correlation of 0.6 and RMSE of 0.078 m
3/m
3. The temporal variation of the three scattering mechanisms of soybean (
Figure 6) is in agreement with its phenological development (
Figure 3), and the simulations and the extracted values of β matched (
Figure 13). Thus, the three predefined fixed vegetation orientation cases are considered suitable to model the vegetation contribution for soil moisture inversion from the full polarimetric signature of soybean fields.
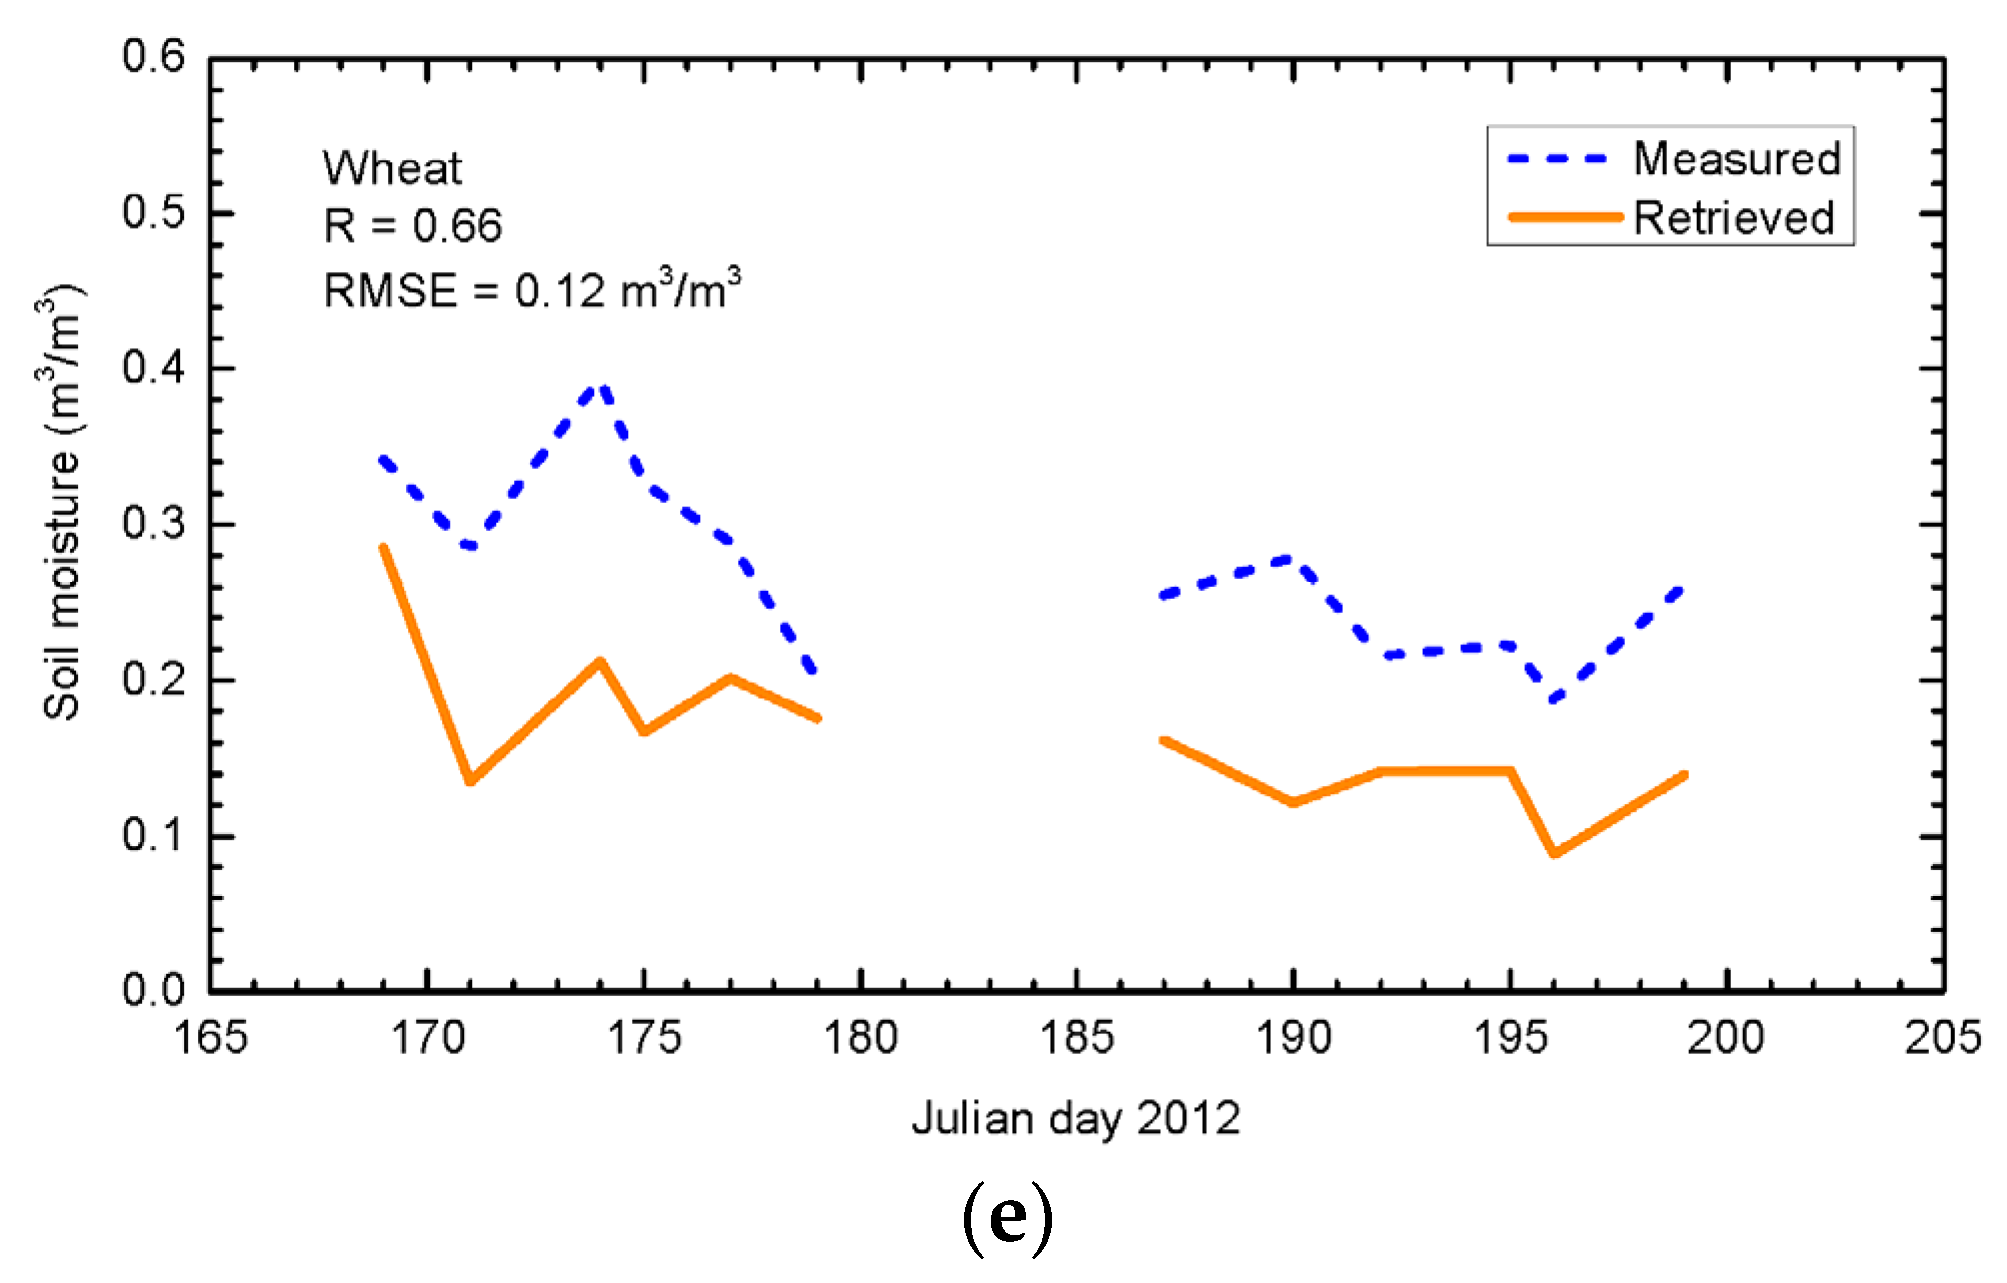
For the wheat (
Figure 17e), the inversion is only achieved for 70% of the investigated period, with a correlation of 0.66 and RMSE of 0.12 m
3/m
3. Using single polarization ENVISAT ASAR data normalized at 20°, higher retrieval accuracies (RMSE of 5.3% vol. and 6.4% vol., for respectively HH and VV) were obtained by [
27] over wheat fields characterized by vegetation water content ranging from 0.08–1.15 kg/m
2. Compared to our dataset, both the lower incidence and the lower vegetation water content are very helpful for improving the retrieval accuracy.
With RMSE values varying from 0.07–0.12 m
3/m
3,
Figure 17 shows that the performance of the retrieval algorithm is crop type and phenological stage dependent. The soil moisture is underestimated over most of the crop fields, except for the corn. This result can be explained by the dipole modeling of crop shape [
1] and the predefined fixed volume coherency matrices (only three types). Indeed, it is reported in [
1] that assuming a dipole particle shape will lead to an underestimation of soil moisture. In [
1], the soil moisture retrieval over corn fields is the best with RMSE of 0.08 m
3/m
3 during the temporal comparison with ground measurements. For the fields covered by canola and wheat, the RMSEs are around 0.10–0.14 m
3/m
3. In this study, by using only the surface scattering mechanism and neglecting the dihedral scattering mechanism which is affected by both the characteristics of vegetation and the underlying soils, the obtained RMSEs are 0.064 m
3/m
3 for corn, 0.076 m
3/m
3 for canola and 0.12 m
3/m
3 for wheat. Nevertheless, in terms of performances, a comparison cannot be made between the soil moisture retrievals conducted in this study and in [
1], due to the difference in the experimental conditions including the location of test areas, the crop growth stages and the soil and vegetation characteristics.
Figure 17.
Comparison between the retrieved and measured soil moisture during the agricultural campaign for (a) Canola; (b) Corn; (c) Pasture; (d) Soybean; (e) Wheat. The retrieved and measured soil moisture are averaged for each crop type, and the discontinuities in the curves correspond to unsuccessful retrieval periods.


