Article

Soumi NPP VIIRS Day/Night Band Stray Light Characterization and Correction Using Calibration View Data

1
Science Applications International Corp., Goddard Space Flight Center Code 616, Greenbelt, MD 20771, USA
2
ERT Corp., Laurel, MD 20740, USA
3
NOAA/NESDIS/STAR, College Park, MD 20737, USA
*
Author to whom correspondence should be addressed.
Remote Sens. 2016, 8(2), 138; https://doi.org/10.3390/rs8020138
Submission received: 2 November 2015 / Revised: 27 January 2016 / Accepted: 29 January 2016 / Published: 8 February 2016
(This article belongs to the Collection Visible Infrared Imaging Radiometers and Applications)

Abstract

:
The Soumi NPP VIIRS Day/Night Band (DNB) nighttime imagery quality is affected by stray light contamination. In this study, we examined the relationship between the Earth scene stray light and the signals in VIIRS’s calibrators to better understand stray light characteristics and to improve upon the current correction method. Our analyses showed the calibrator signal to be highly predictive of Earth scene stray light and can provide additional stray light characteristics that are difficult to obtain from Earth scene data alone. In the current stray light correction regions (mid-to-high latitude), the stray light onset angles can be tracked by calibration view data to reduce correction biases. In the southern hemisphere, it is possible to identify the angular extent of the additional stray light feature in the calibration view data and develop a revised correction method to remove the additional stray light occurring during the southern hemisphere springtime. Outside of current stray light correction region, the analysis of calibration view data indicated occasional stray light contamination at low latitude and possible background biases caused by Moon illumination. As stray light affects a significant portion of nighttime scenes, further refinement in characterization and correction is important to ensure VIIRS DNB imagery quality for Soumi NPP and future missions.

Graphical Abstract

1. Introduction

One of the unique capabilities on Soumi National Polar-Orbiting Partnership (SNPP) is the Visible Infrared Imaging Radiometer Suite (VIIRS) Day/Night Band (DNB), a visible and near infrared panchromatic band (500–900 nm) that is capable of making observations during both day and night [1,2]. The VIIRS DNB is designed to improve upon the global nighttime lights observations initiated more than two decades ago by the Defense Meteorological Satellite Program’s (DMSP) Operational Linescan System (OLS) [3,4,5,6,7,8,9]. The VIIRS DNB is sensitive enough to pinpoint the location of lights from bridges [10] or the faint air glow pattern during moonless nights [11]. Many other anthropogenic activities, e.g., city light power consumption and outages [12], seasonal light activities [13], and fishing and shipping tracks [14], have been observed and quantified by analysis of VIIRS DNB data. When there is sufficient moonlight, much of the Earth’s surface features seen during the daytime, e.g., water, cloud, and land surfaces of different types, can also be observed by DNB at night. This improved capability reveals the Earth’s nocturnal secrets in unprecedented detail for a new chapter in nighttime remote sensing [14].
The superior DNB nighttime data quality in SNPP is partly due to the fact that its on-orbit performance exceeds its original design specification [15]. On-orbit DNB calibration and characterization is a challenging undertaking because most useful observations have radiance values that are below the sensor’s designed minimum observable radiance. Stray light contamination causes the most significant degradation in DNB nighttime image quality. The most persistent stray light contamination is in the mid-to-high latitude regions where the spacecraft is crossing the northern and southern day/night terminators [16]. The exact latitudes affected by stray light can be determined by the Earth-Sun-spacecraft geometry and orbital inclinations, which change over time. In these regions, the spacecraft is under direct solar illumination due to its elevated orbital track at ~830 km relative to the nighttime Earth surface. Due to the large difference between the Sun and nighttime Earth view radiances, the tiny fraction of Sunlight entering the optical system causes significant contamination of the images [17]. Without correction, large swaths of the nighttime scenes will have little use because the stray light dominates most nighttime imagery signals.
The current VIIRS operational calibration algorithm includes stray light correction to remove the mid-to-high latitude stray light contamination that occurs during the spacecraft’s northern and southern day/night terminator crossings. The stray light is estimated based on Earth view data measured over dark surfaces during moonless nights, with an assumption that stray light and airglow are the only contributors to the observed signals [16,17]. Stray light intensity is estimated as a function of the satellite’s zenith angle to account for the effects of Earth-Sun-spacecraft geometry. The estimated stray light is also detector- and scan angle-dependent, which indicates that there is a scattered light path that is sensitive to the positioning of the rotating telescope assembly (RTA) as well as to the minor differences in detector locations on the focal plane. Operationally, stray light is estimated once per month during the new moon to best approximate the stray light optical path. The monthly estimated stray light magnitudes are stored in a look-up table (LUT). The online calibration algorithm applies the correction derived from the LUT with the closest Earth-Sun-spacecraft geometries relative to the scene to minimize biases.
The accuracy of the stray light estimation depends on how well the dark surfaces are selected, and airglow approximated. Since a completely dark surface over the entire stray light-affected region is unobtainable, the signals over the dark surfaces at each detector and scan angle are estimated using many orbits of data, excluding data with potential light sources [16,17]. Since the dark surface selection process is imperfect, small uncertainties could occur due to residual data contamination. With the selected dark surfaces, the dark signals can be computed, taking into account the combined effect of stray light and airglow. To estimate the stray light, airglow is estimated from dark surfaces outside of the stray light affected region as an approximation. This airglow approximation is apt to be biased because airglow is not spatially and temporally uniform. Since airglow intensity is usually much smaller than the stray light, the error in stray light estimates is expected to be small. However, the uncertainty in airglow approximation indicates that current stray light-corrected images likely do not have accurate airglow patterns and magnitudes.
Additional uncertainty in stray light correction is due to the slight shift in the Earth-Sun-spacecraft geometry between the time stray light is estimated and the imaging time. The stray light correction biases due to the mismatch in Earth-Sun-spacecraft geometry are small in areas where stray light change, with respect to the satellite’s zenith angle, is gradual. However, in regions with sharp stray light changes, i.e., the penumbra and the solar diffuser onset angle, large biases could occur. The large biases result in a stray light-corrected image with an observable horizontal strip due to significant under/over correction.
In addition, the current operational method cannot resolve an additional stray light feature that occurs in the southern hemisphere during its springtime (October–December) [18]. The additional stray light could affect up to one-fourth of the total stray light region. The additional stray light usually exists near the onset of the twilight region, an area where stray light is most difficult to estimate [16,17]. The additional stray light cannot be predicted by current methods because it has features considerably different than the overall stray light pattern. Modification of the current methods is needed in order to remove the additional stray light features in the southern hemisphere.
Previous studies have suggested using calibration view data to improve stray light characterization and correction [16,17,19,20]. In this study, we performed detail analyses on DNB signal characteristics in the VIIRS on-board calibrators, and their corresponding Earth view stray light characteristics. We show the potential of using the DNB calibration view signals to improve stray light onset angle tracking and to refine the current stray light correction. In the southern hemisphere, the regions with additional stray light features can be identified in the calibrator signals, and the current correction algorithm can be modified to remove these features. Last, we will show the use of calibration view data to identify possible stray light contamination outside of the current mid-to-high latitude stray light regions, as well as other potential background contaminations.

2. DNB Calibration Framework

The SNPP VIIRS is a Sun-synchronized, polar-orbiting, scanning radiometer [21]. On orbit, VIIRS collects data in four separate view windows, Earth view (EV), blackbody (BB), solar diffuser (SV), and space view (SV), successively at each scan (Figure 1). The BB, SD, and SV are on-board calibrators (OBCs) designed to calibrate VIIRS’s reflective solar bands (0.4–2.5 μm) and thermal emissive bands, and are also used as an alternative DNB calibration methodology [22,23,24]. The VIIRS BB has high emissivity and is temperature-controlled at ~292.5 K to calibrate the thermal emissive bands. The SD is a near Lambertian Spectralon® panel used to calibrate the reflective solar bands during orbital solar calibration events near the southern hemisphere day/night terminator crossings. The SV is located at a preselected scan angle near the start of EV scan angle, about three degrees off the edge of the Earth’s limb, which is used to provide a deep space view for dark references.
Figure 1. Schematic of VIIRS data collection windows and their approximated angles. The scan angle at the Earth’s limb is ~62.5 degrees.
Remotesensing 08 00138 g001
The DNB consists of four sectors of detector arrays: one is in the low-gain stage (LGS); one is in the intermediate-gain stage (MGS); and two redundant arrays, high-gain A (HGA) and high-gain B (HGB), are in the high-gain stage (HGS). In each scan, the DNB collects samples using the four detector arrays and aggregates them into 4064 EV samples and 16 calibration view samples. The output gain stage is selected at each EV sample to ensure its radiance level is within the dynamic range of that gain stage to reduce down-link bandwidth. The HGA and HGB are normally averaged on-board and down-linked as HGS. In calibration views, all four detector arrays are reported in each pixel.
Figure 2 shows typical DNB signal profiles in each of the calibration views for the entire orbit. In Figure 2, the DNB signals were plotted against solar declination angles to indicate the geometric relationship between satellite, Sun, and Earth. During daytime, the SD signals are several orders of magnitude higher than the SV and BB signals. The stronger SD signals are due to high reflectivity surfaces that are illuminated by the daytime Earthshine coming through VIIRS EV port. The BB’s low reflectivity absorbs most of the incoming lights, and the recorded BB signals are likely dominated by scattered lights entering into the optical paths. During daytime, the SV signals are slightly higher than BB in general but share similar patterns, except when the spacecraft is near the day/night terminators. Since the SV is about three degrees off the Earth’s limb, the Earth scene stray light coming through the telescope could contribute additional signals added onto the stray light. The position of the telescope could also change the scattered light patterns; an effect that can be observed in EV, where the stray light signal varies by scan angles (see Section 3). Examining the calibration view signal characteristics could provide additional information on potential stray light paths since each calibrator has its own unique properties.
Figure 2. DNB calibration view signals for S-NPP orbit 15,758 on 12 November 2014. DNB detector 1 signals for SV, BB, and SD are shown in (ac), respectively. The y-axis are DNB signals in W·cm−2·sr−1. The x-axis is the VIIRS Sun declination angle, in degrees. NH: northern hemisphere, SH: southern hemisphere.
Remotesensing 08 00138 g002
The DNB images have the most significant stray light problem (highlighted in Figure 2) near the day/night terminators. Although the stray light is stronger during the day than the day/night terminators, the effect is negligible because the stray light is several orders of magnitude smaller than the typical daytime radiance. In the stray light problem regions, the calibration view signals are elevated with patterns that are different between the northern and southern hemisphere. In the northern hemisphere, the bulk of the signals likely came through the EV port from the direct solar illumination. There is an additional scattered light through BB at the end of the DNB EV stray light problem region that caused sharp increase in BB signal. The timing of the sharp increase in BB signals corresponds to the onset of twilight on the Earth’s surface. However, there is no corresponding increase in SV signals due to the increased Earth scene radiance in the twilight region. The lack of response in SV signals indicates that an RTA pointing angle might have provided a better shield from the scattered light paths from the Earth’s twilight scene.
In the southern hemisphere, the onset of calibration view signal increase corresponds to the direct solar illumination entering the VIIRS’s EV port. The sharp increase in the SD signal marked the beginning of solar calibration events when SD is being illuminated by the Sun. Both BB and SV showed increased signals, but in different patterns, due to additional lights entering from SD screen. The BB signals showed a rise and fall that largely corresponded to the SD signals, although several orders of magnitude smaller than SD. The SV signals showed a sharp increase at the onset of SD calibration events but remained more or less constant throughout the solar calibration event. The recorded calibration view signal levels during solar calibration could indicate the level of stray light contamination. Figure 3 shows that BB and SV have signals that are at least four orders of magnitude smaller than the SD signals during solar calibration. Unfortunately, we cannot directly measure how much of the SD signals are stray light, which will cause bias in calibration. The signal ratios of SV/SD and BB/SD imply the potential stray light contamination during solar calibration of less than 0.01%. Unless there is a large wavelength stray light dependency, the results indicate that the reflective solar bands calibration error due to stray light contamination should be negligible.
Figure 3. Mean ratios of BB/SD and SV/SD signals around solar calibration events on August 25, 2014. The dashed lines indicate the approximated solar calibration angle range. SZA = solar zenith angle.
Remotesensing 08 00138 g003

3. Stray Light Characterization and Correction

The most prominent stray light contamination on DNB imagery occurs in the mid-to-high latitude of the northern and southern hemispheres when spacecraft is crossing the day/night terminators [16]. The stray light magnitude and its affected latitudes depend on the Earth-Sun-spacecraft geometric relationships, and the patterns usually reoccur at a yearly cycle when the similar Earth-Sun-spacecraft geometric relationships repeat. To remove the Earth scene stray light, the stray light is estimated based on the observed EV dark signals. Currently two different methods are implemented in the publicly-available DNB imagery products [16,17]. In this section, we examine the stray light characteristics based on the relationship of observed EV stray light and calibration view signals to explore ways to improve current stray light corrections. We will demonstrate that the information in calibration view data can be used to modify current stray light correction method to remove the additional stray light features that occur during southern hemisphere springtime.

3.1. Northern Hemisphere

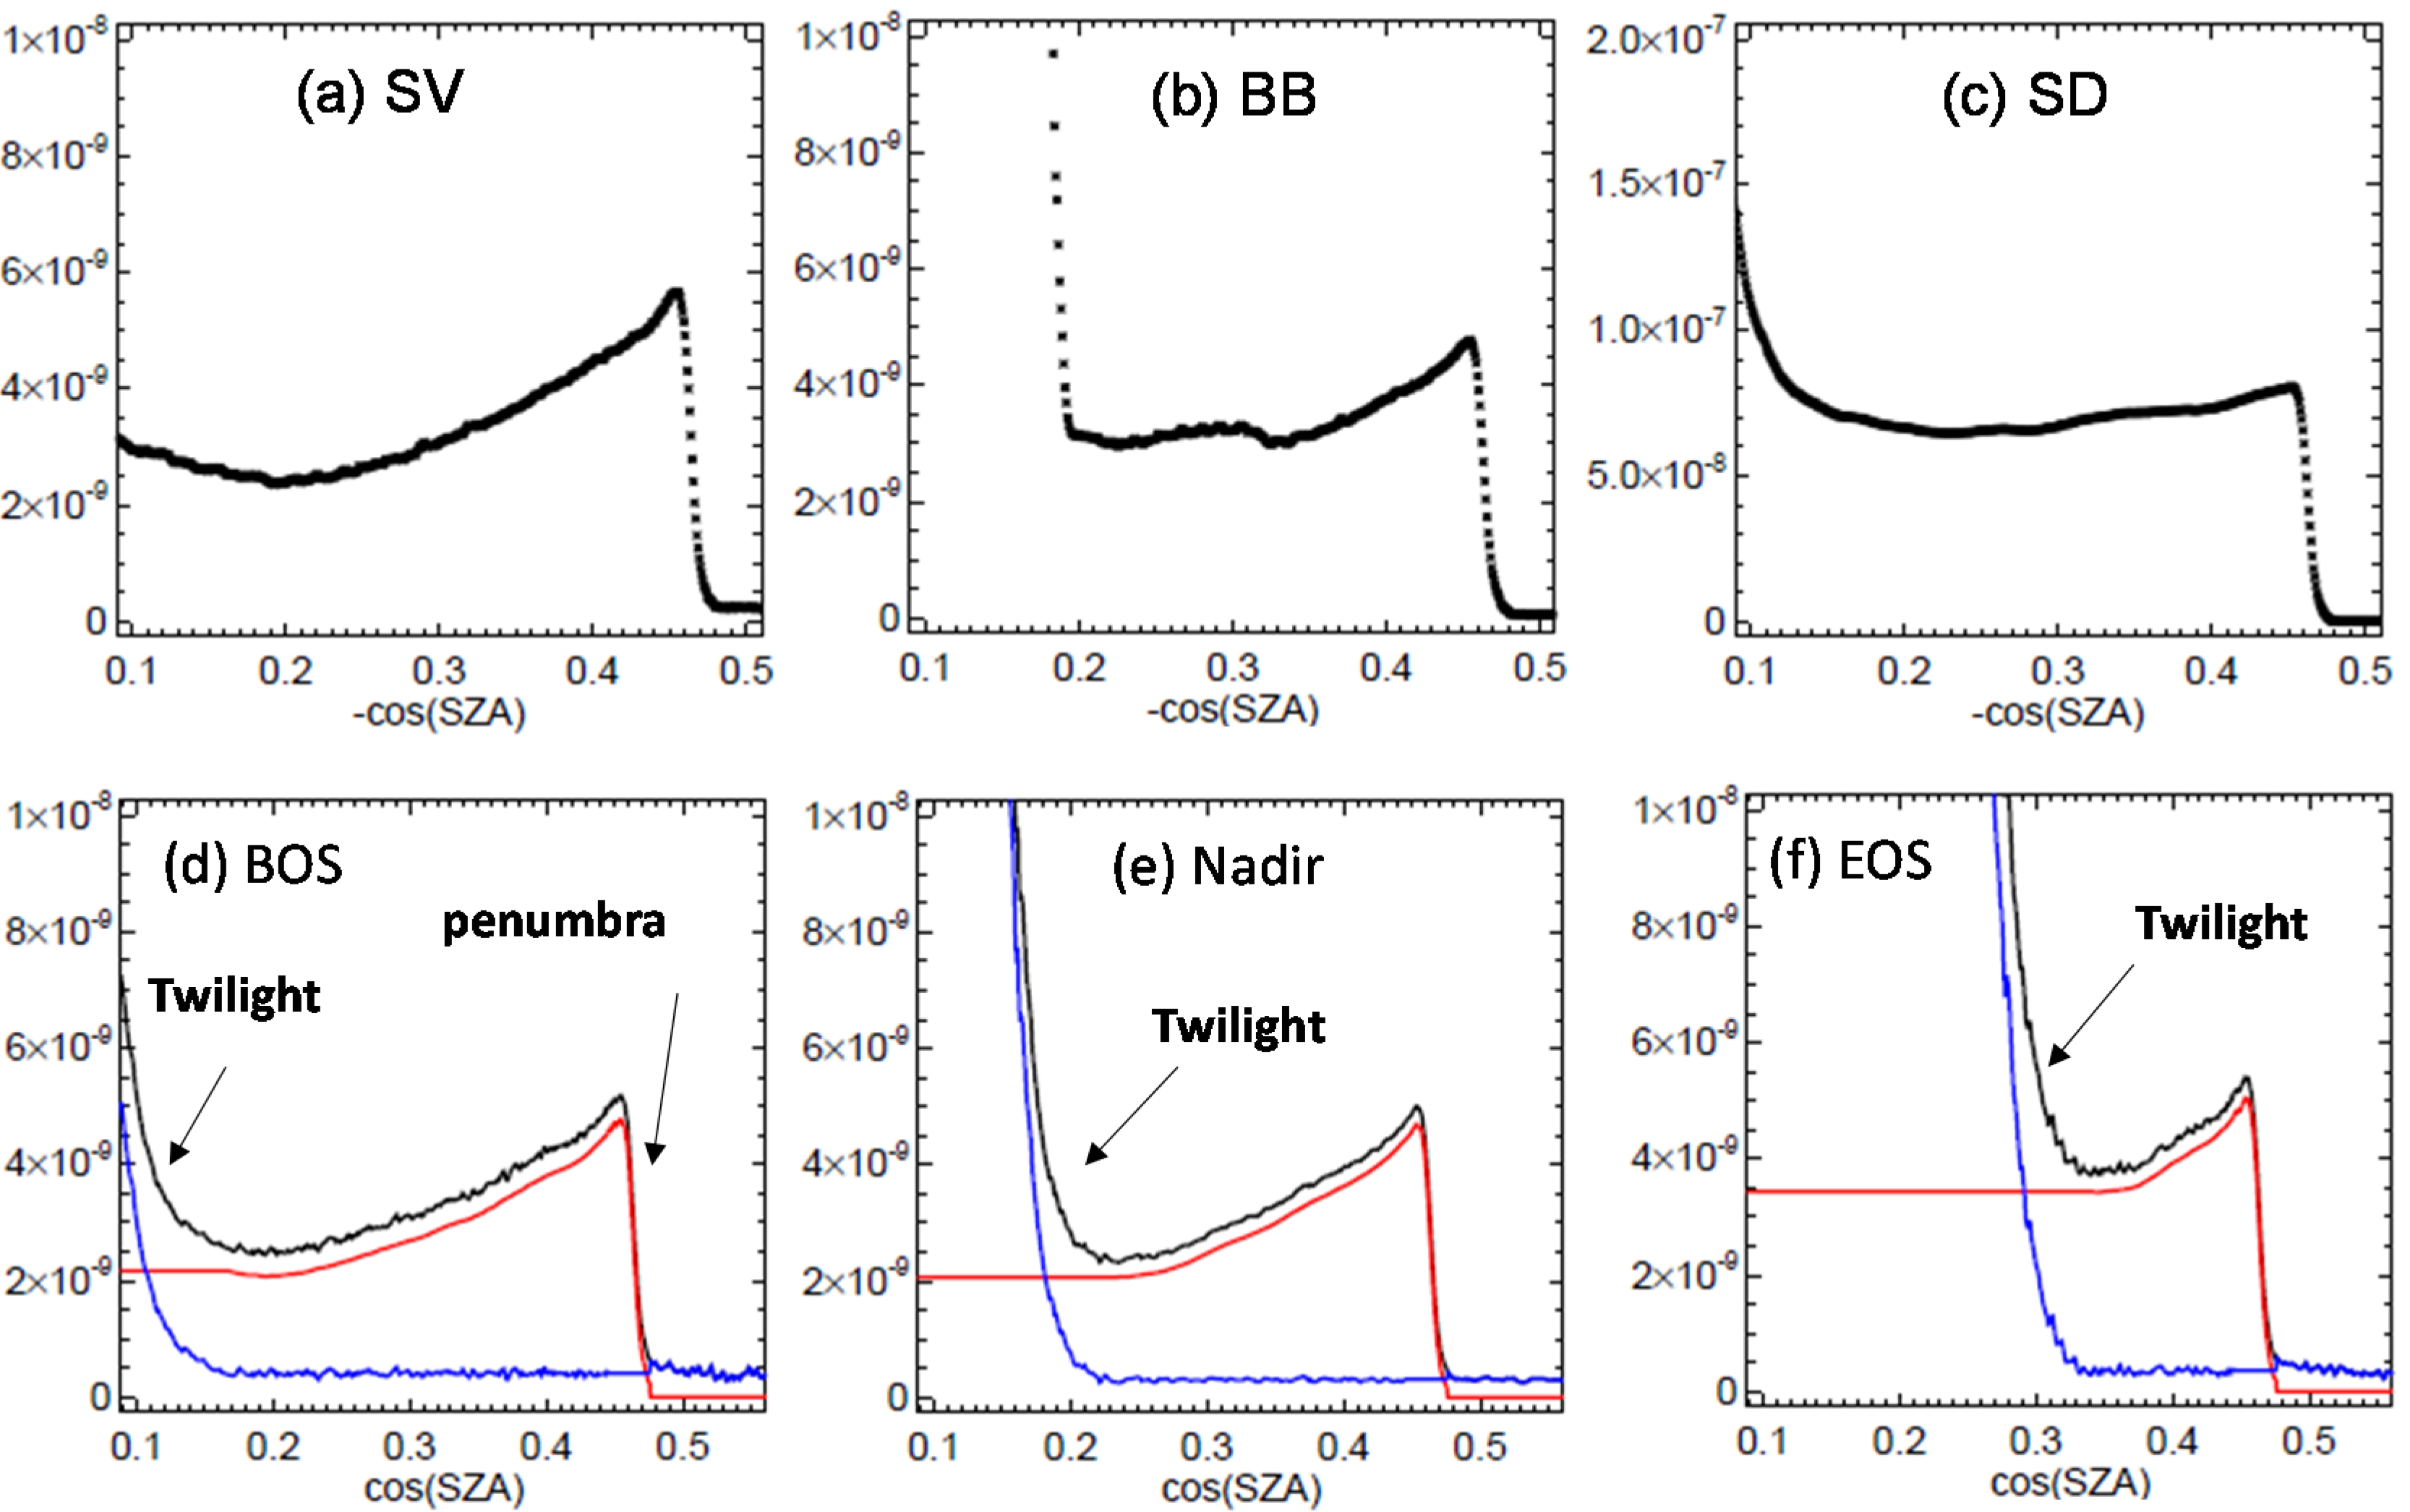
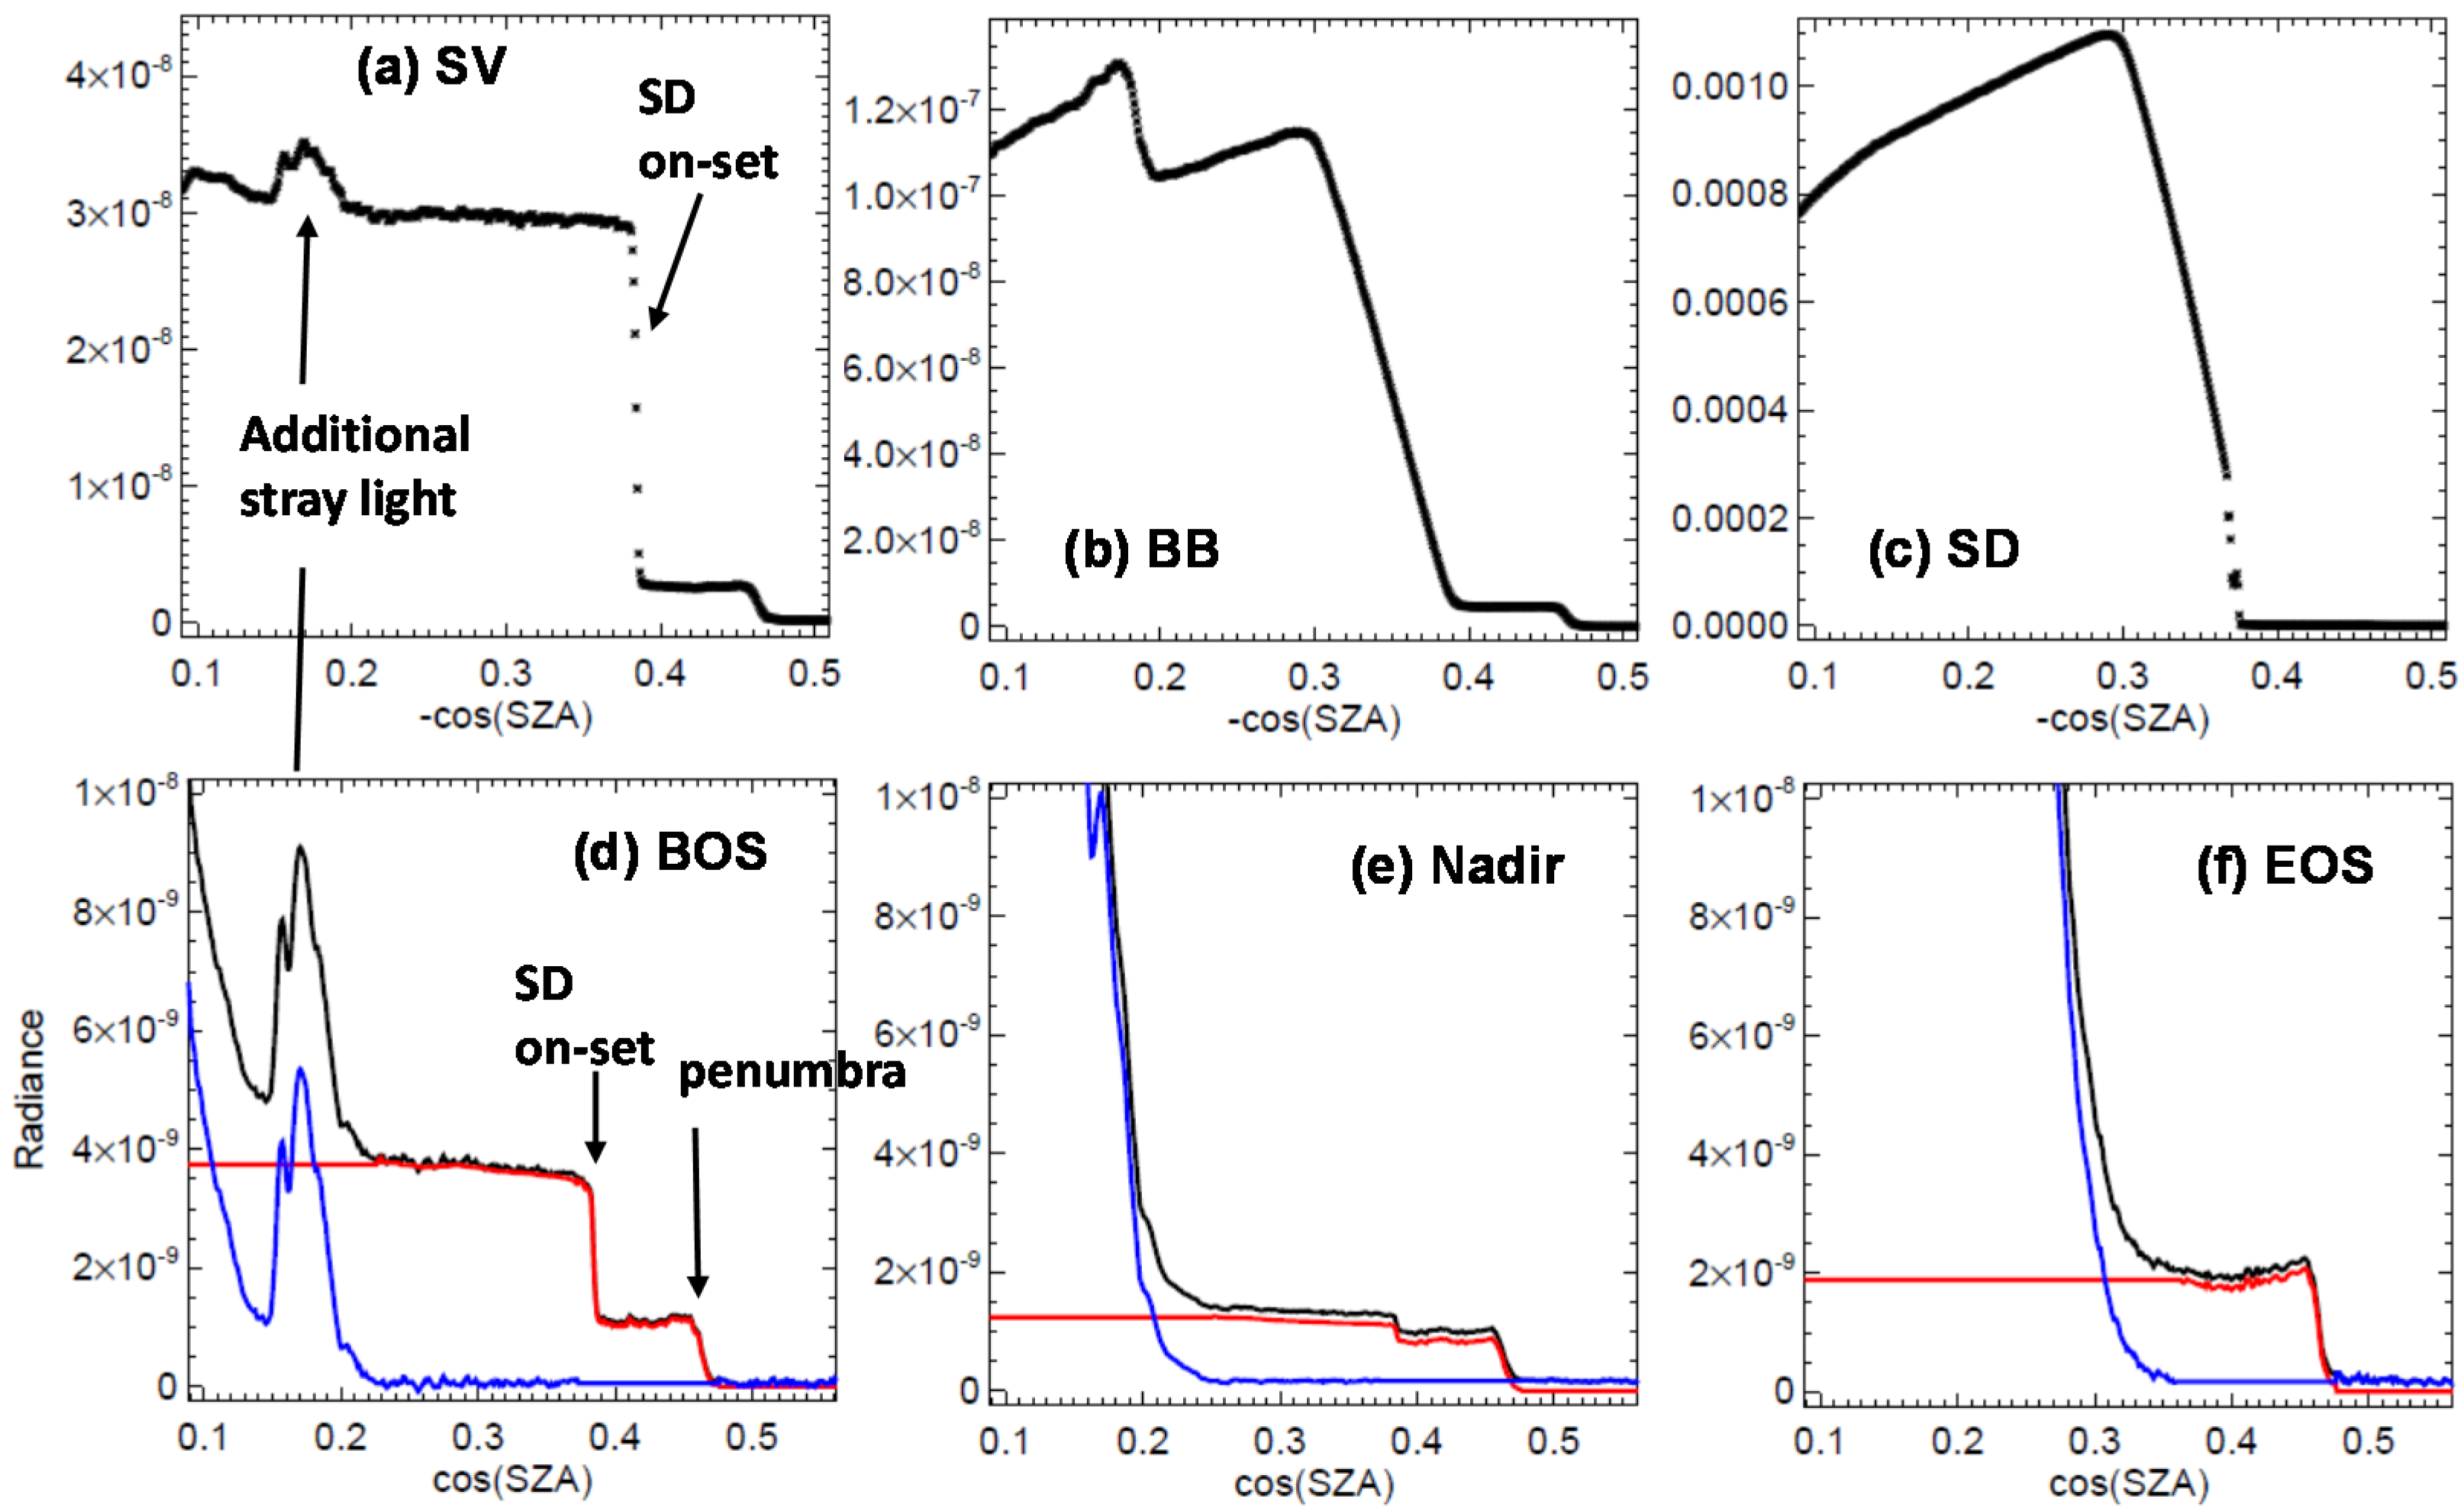
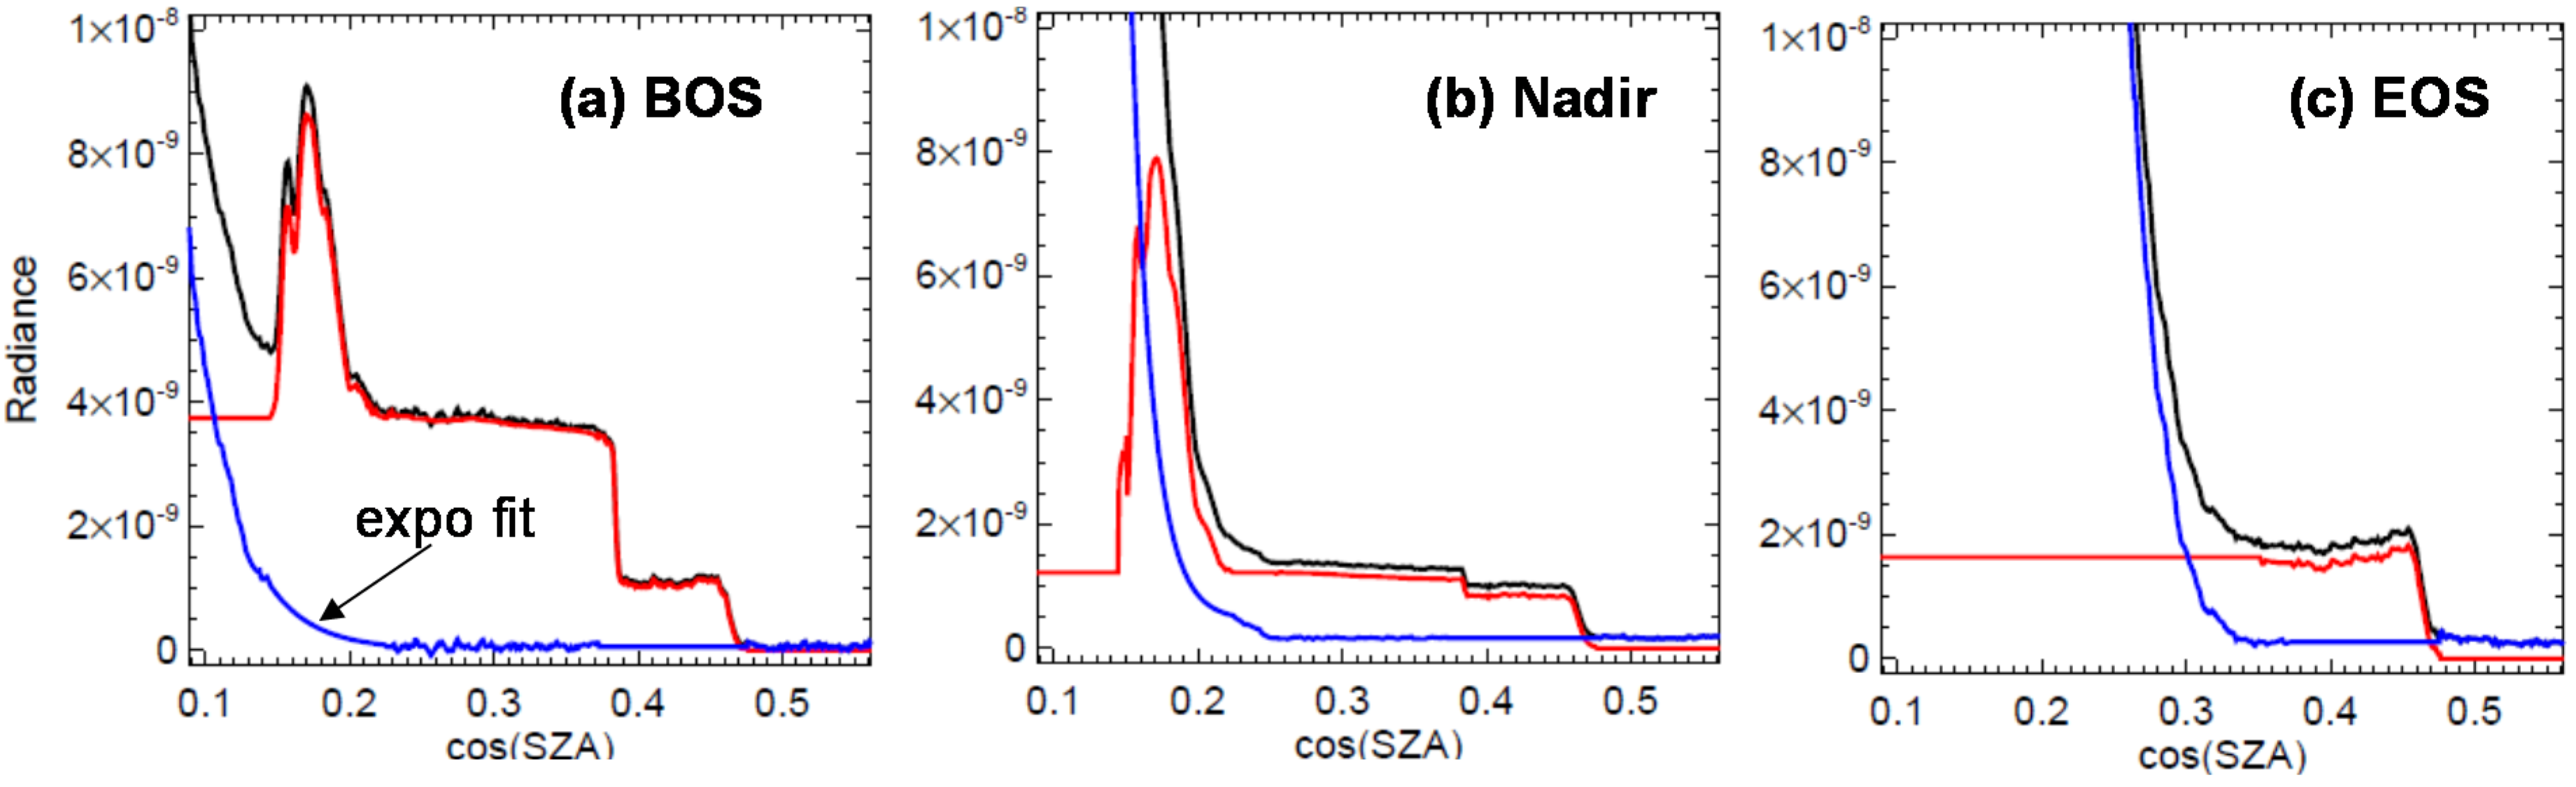
Figure 4 shows the typical EV dark signals (d–f) in the northern hemisphere DNB EV stray light-affected regions and the corresponding calibration views signals (a–c). In the EV plots (d–f) the estimated stray light and mean signals after correction are also plotted in red and blue, respectively. Figure 4 shows that both EV and calibration view signals increased sharply in the penumbra region, when the spacecraft is transitioning from the dark to the bright part of the orbit. The recorded SV signals are similar to the EV dark signals both in patterns and magnitude before the Earth scene enters the twilight region. Since SNPP is on a descending orbit and has a declination angle of ~100 degrees, the Earth scene at end of scan (EOS) will observe the twilight region earlier than the beginning of the scan (BOS). The result is shown in Figure 4 as the sharp EV signal increase due to twilight happening at a lower solar zenith angle (SZA) at BOS (Figure 4d) than at EOS (Figure 4f). The BB signals also showed similar patterns to SV and EV from penumbra to SZA ≈ 108 degrees (−cos(SZA) ≈ 0.32), then the signals were slightly elevated before sharp increases at SZA ≈ 100 degrees (−cos(SZA) ≈ 0.18). The signal pause at SZA ≈ 108 degrees coincided with EOS twilight onset angle, indicating the increased Earth shine might have contributed slightly to BB signals. Similar to SV, BB, and EV, the SD signals show the initial sharp increase in the penumbra region, then a gradual decrease before increasing again at around BOS twilight onset angles when the Earth view entered the twilight region. The SD signals are at least an order of magnitude stronger than SV, BB, or EV, indicating the bulk of the signal likely is the reflected stray light off the SD surface.
Figure 4. DNB detector 8 EV and calibration view dark signals near northern hemisphere stray light problem regions on October 5, 2013. (ac) show calibration views. EV dark signals for beginning of scan (BOS), nadir, and end of scan (EOS) are shown in (d), (e), and (f), respectively. Black curves: dark signals; red curves: estimated stray light; blue curves: signals after stray light correction. SZA = solar zenith angle.
Remotesensing 08 00138 g004
The current operational stray light correction methods approximate the stray lights as the EV dark signals minus the airglow (red curves in Figure 4d–f) approximated by the EV dark signals observed outside of the stray light affected regions [16,17]. In thre northern hemisphere, this method performed well in removing the bulk of the stray light, except for the penumbra regions. Since the sharp stray light increases with respect to SZA in the penumbra region, even a small mismatch in the penumbra onset angles between the imaging and LUT generation time could increase noticeable image artifacts after correction [17]. The effects can be demonstrated in Figure 5, where the same image is corrected using correction LUTs derived from three different months. 
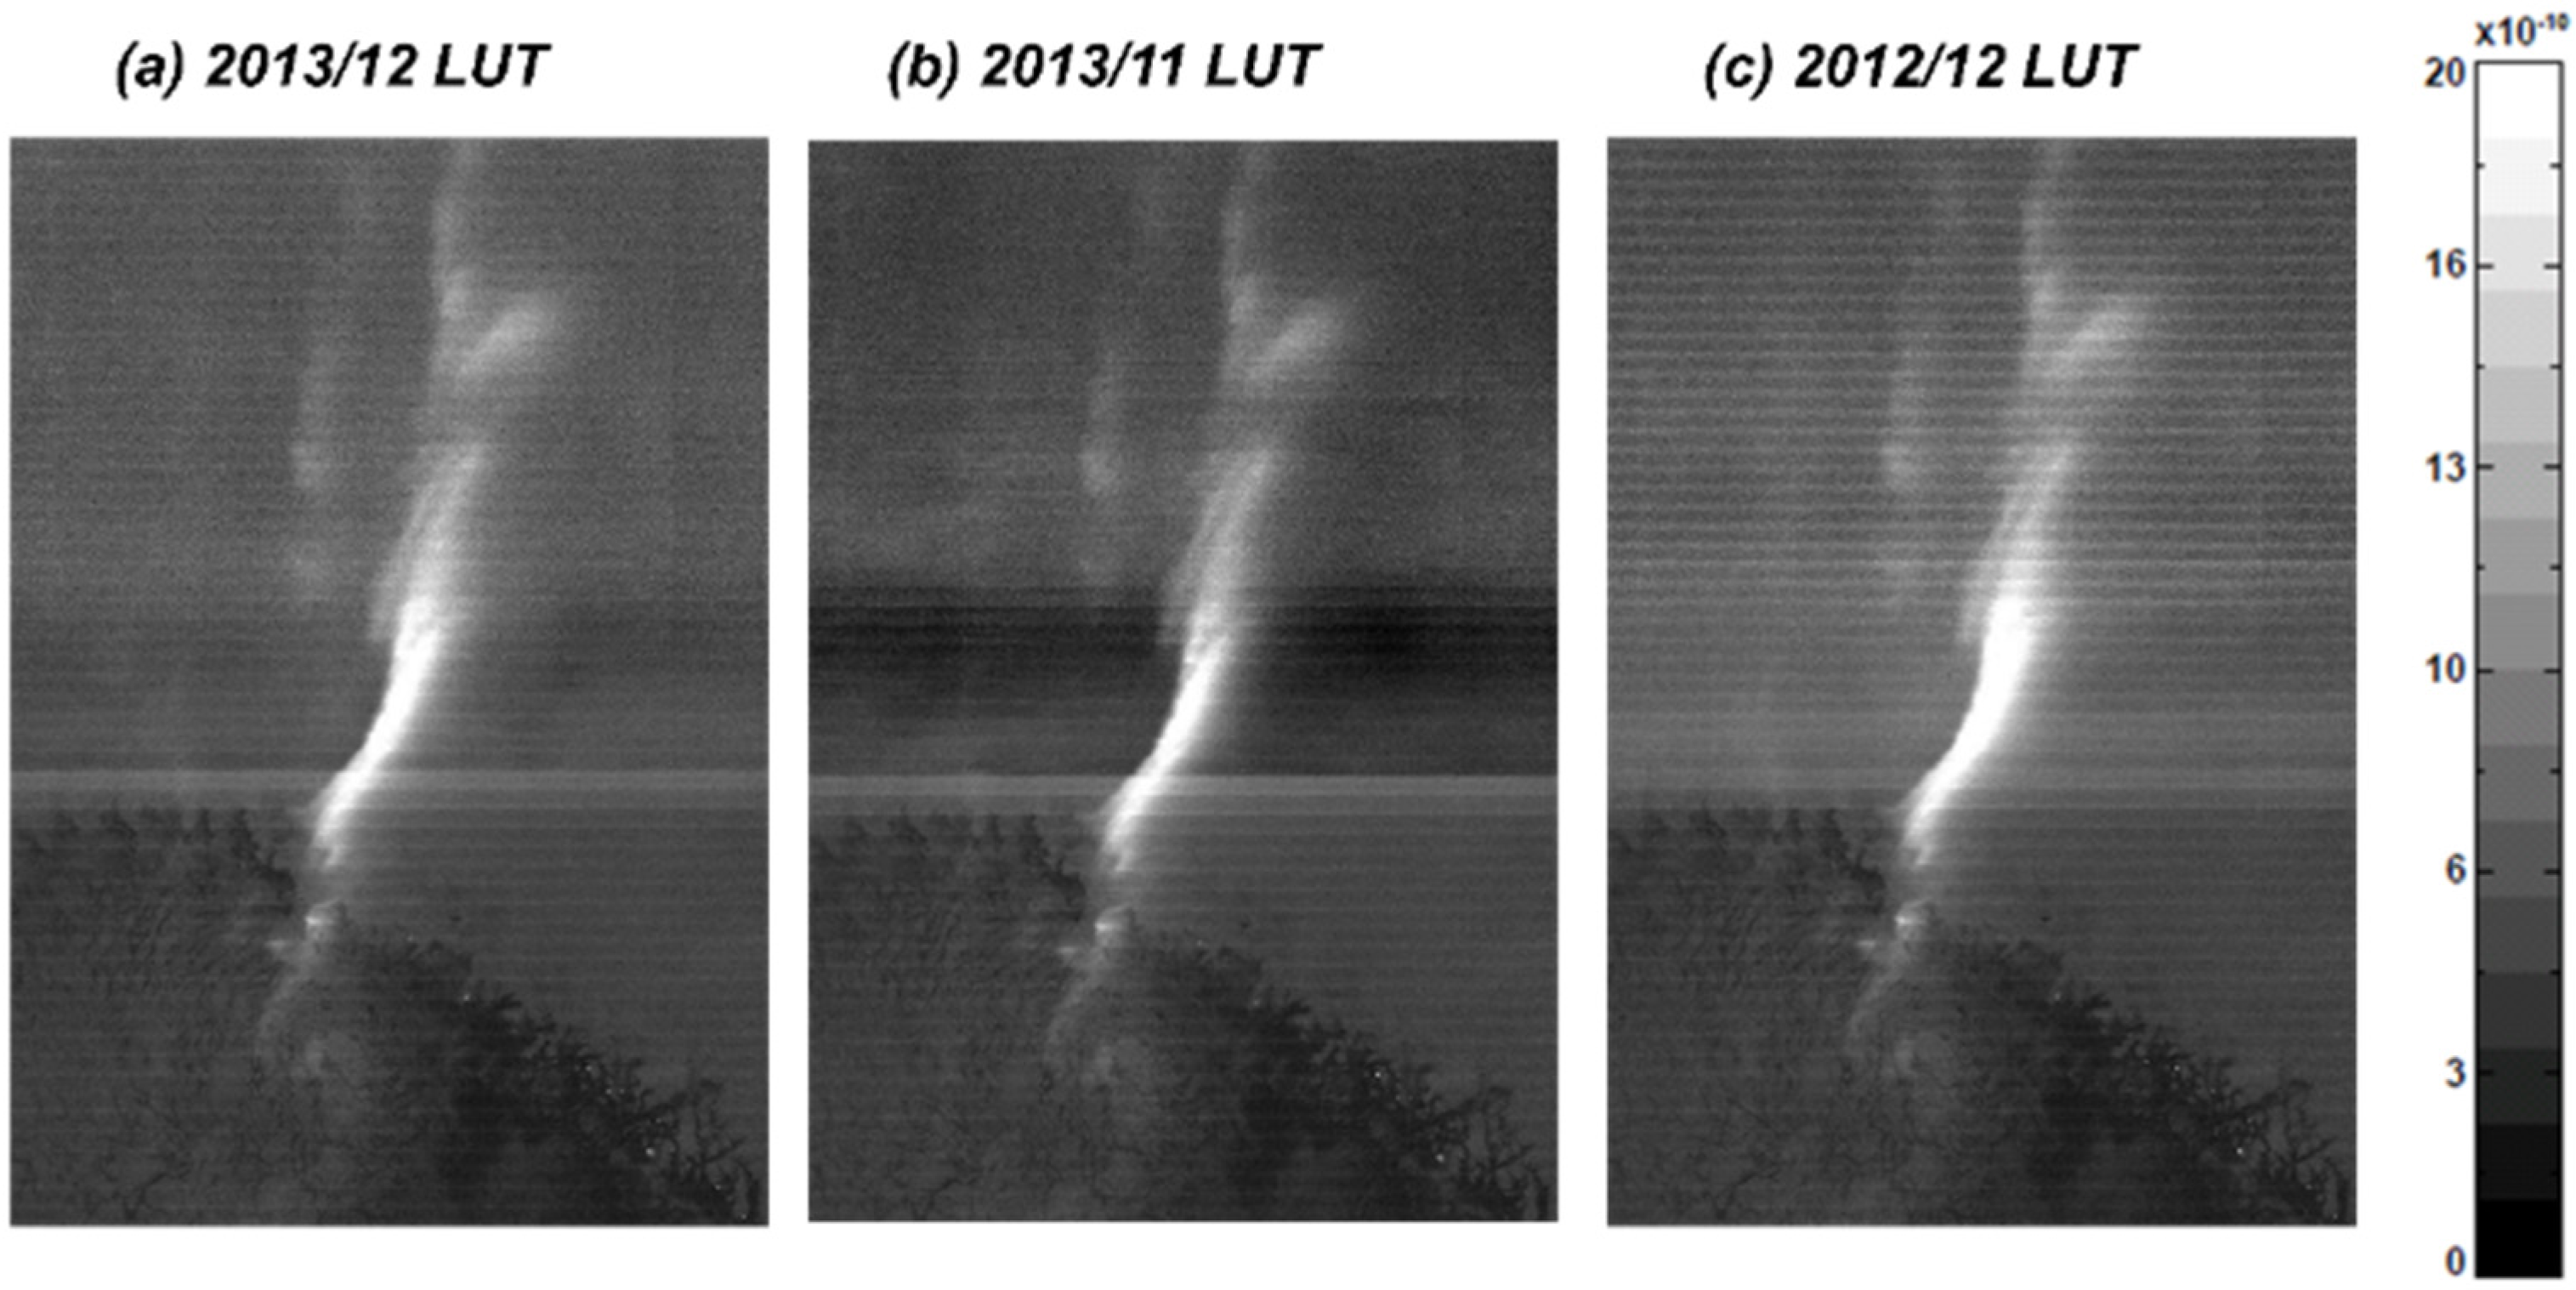
Figure 5 shows the corrected image using the current month’s LUT has the best quality (Figure 5a), and the worst image (
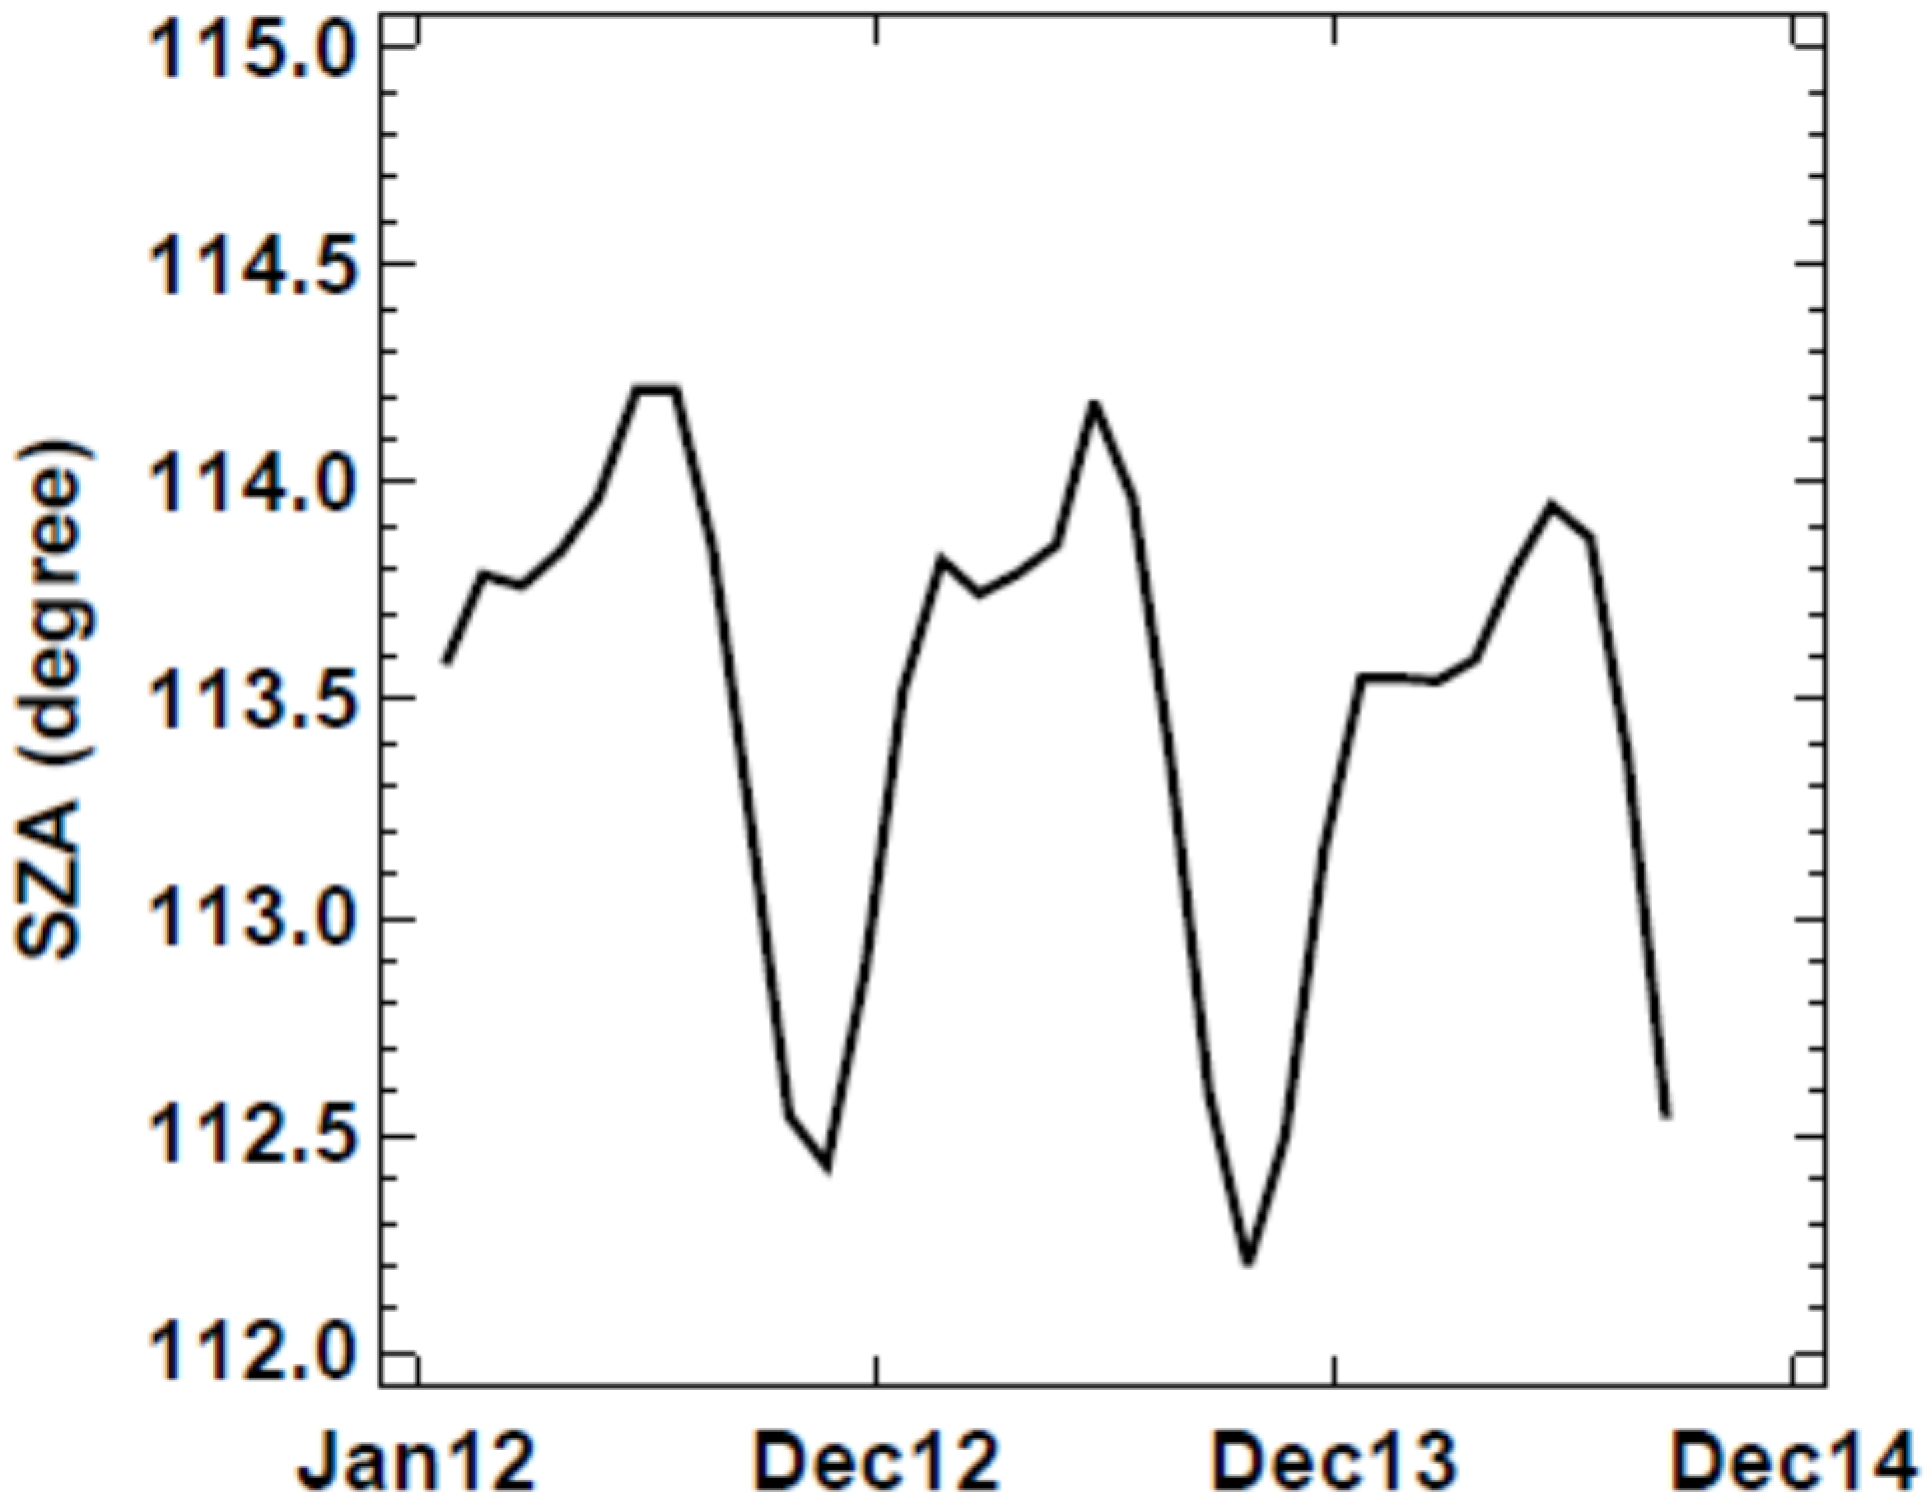
Figure 5b) was corrected using the prior month’s LUT. To show the penumbra angle mismatch was the cause, we estimated the median penumbra angles in SV signal profiles (Figure 6). Based on the estimated penumbra angles, the potential angle bias between the stray light correction LUTs and the scene in Figure 5 is about 0.07 degrees for (b) and 0.02 degrees for (c). The larger penumbra angle bias results in worse image quality after correction. 
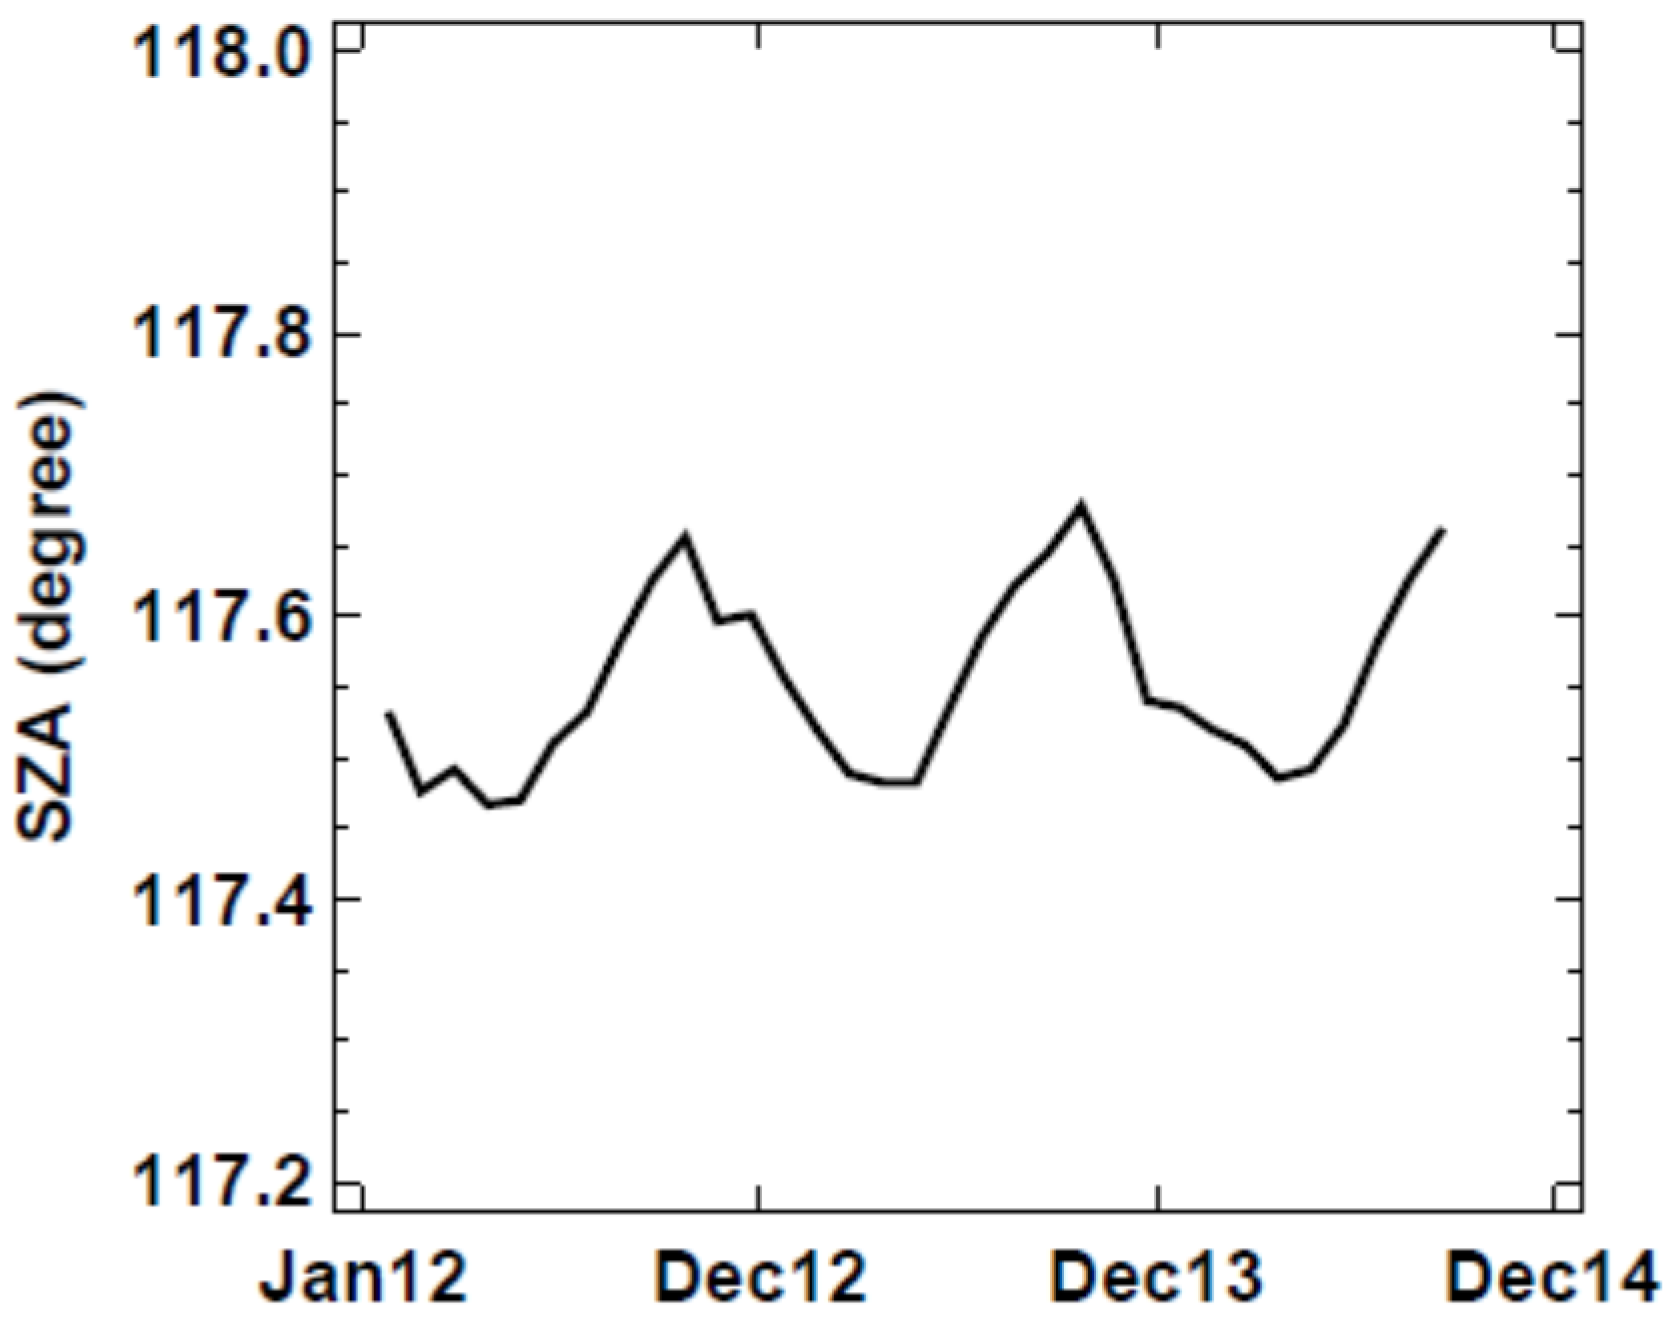
Figure 6 shows that the estimated penumbra regions had an annual cycle with a magnitudes of ~0.2 degrees. The repeatable annual cycle indicates a prior year’s correction LUT will usually have a better match in penumbra angle than the prior month’s correction LUT. Without angular adjustment in correction LUT, a prior year’s correction LUT should perform better in forward operational processing when the most current month’s correction LUT is not available. The bias in penumbra angles could be further reduced if the yearly angular drifts are adjusted. For reprocessing when all historical correction LUTs are available, it is possible to temporally interpolate the penumbra onset angles to further reduce the correction residuals due to the minor penumbra angular drifts.
Figure 5. Stray light corrected images for December 3, 2013, 7:43 GMT, using LUTs derived from (a) 2013 December; (b) 2013 November; and (c) 2012 December data.
Remotesensing 08 00138 g005
Figure 6. Median penumbra angle estimated using DNB SV data. The angle is estimated as the maximum slope in SV signal profile.
Remotesensing 08 00138 g006

3.2. Southern Hemisphere

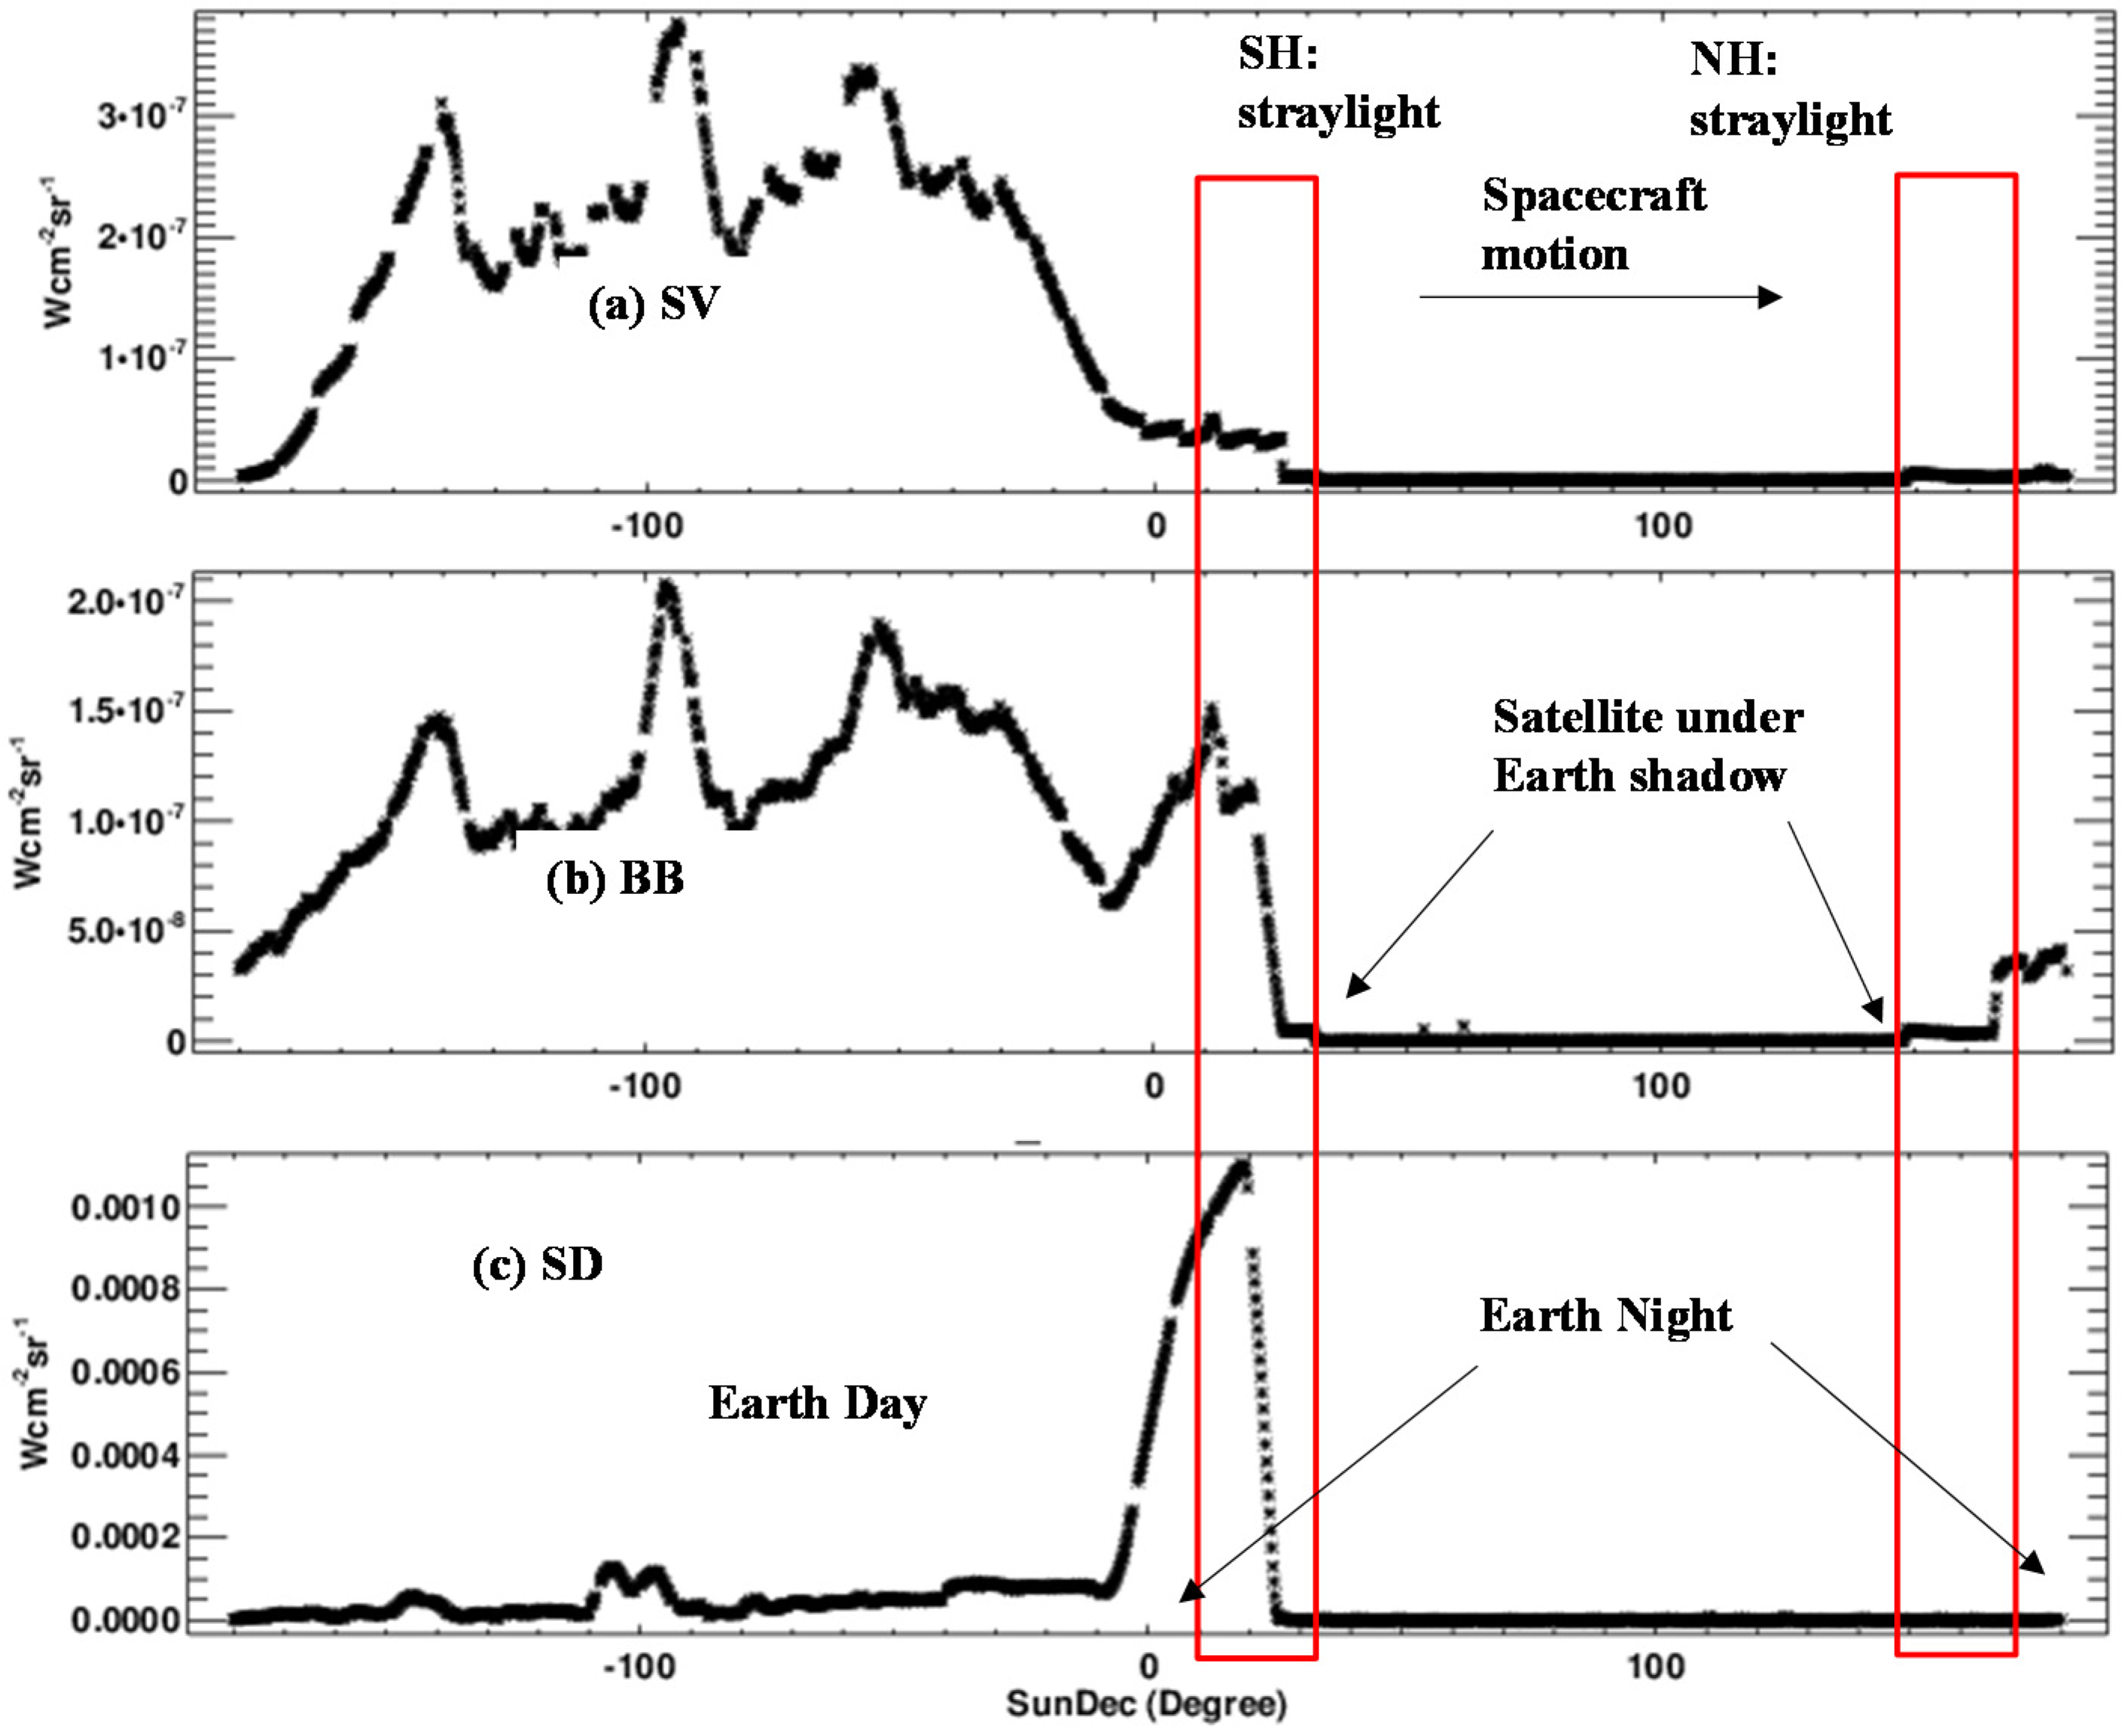
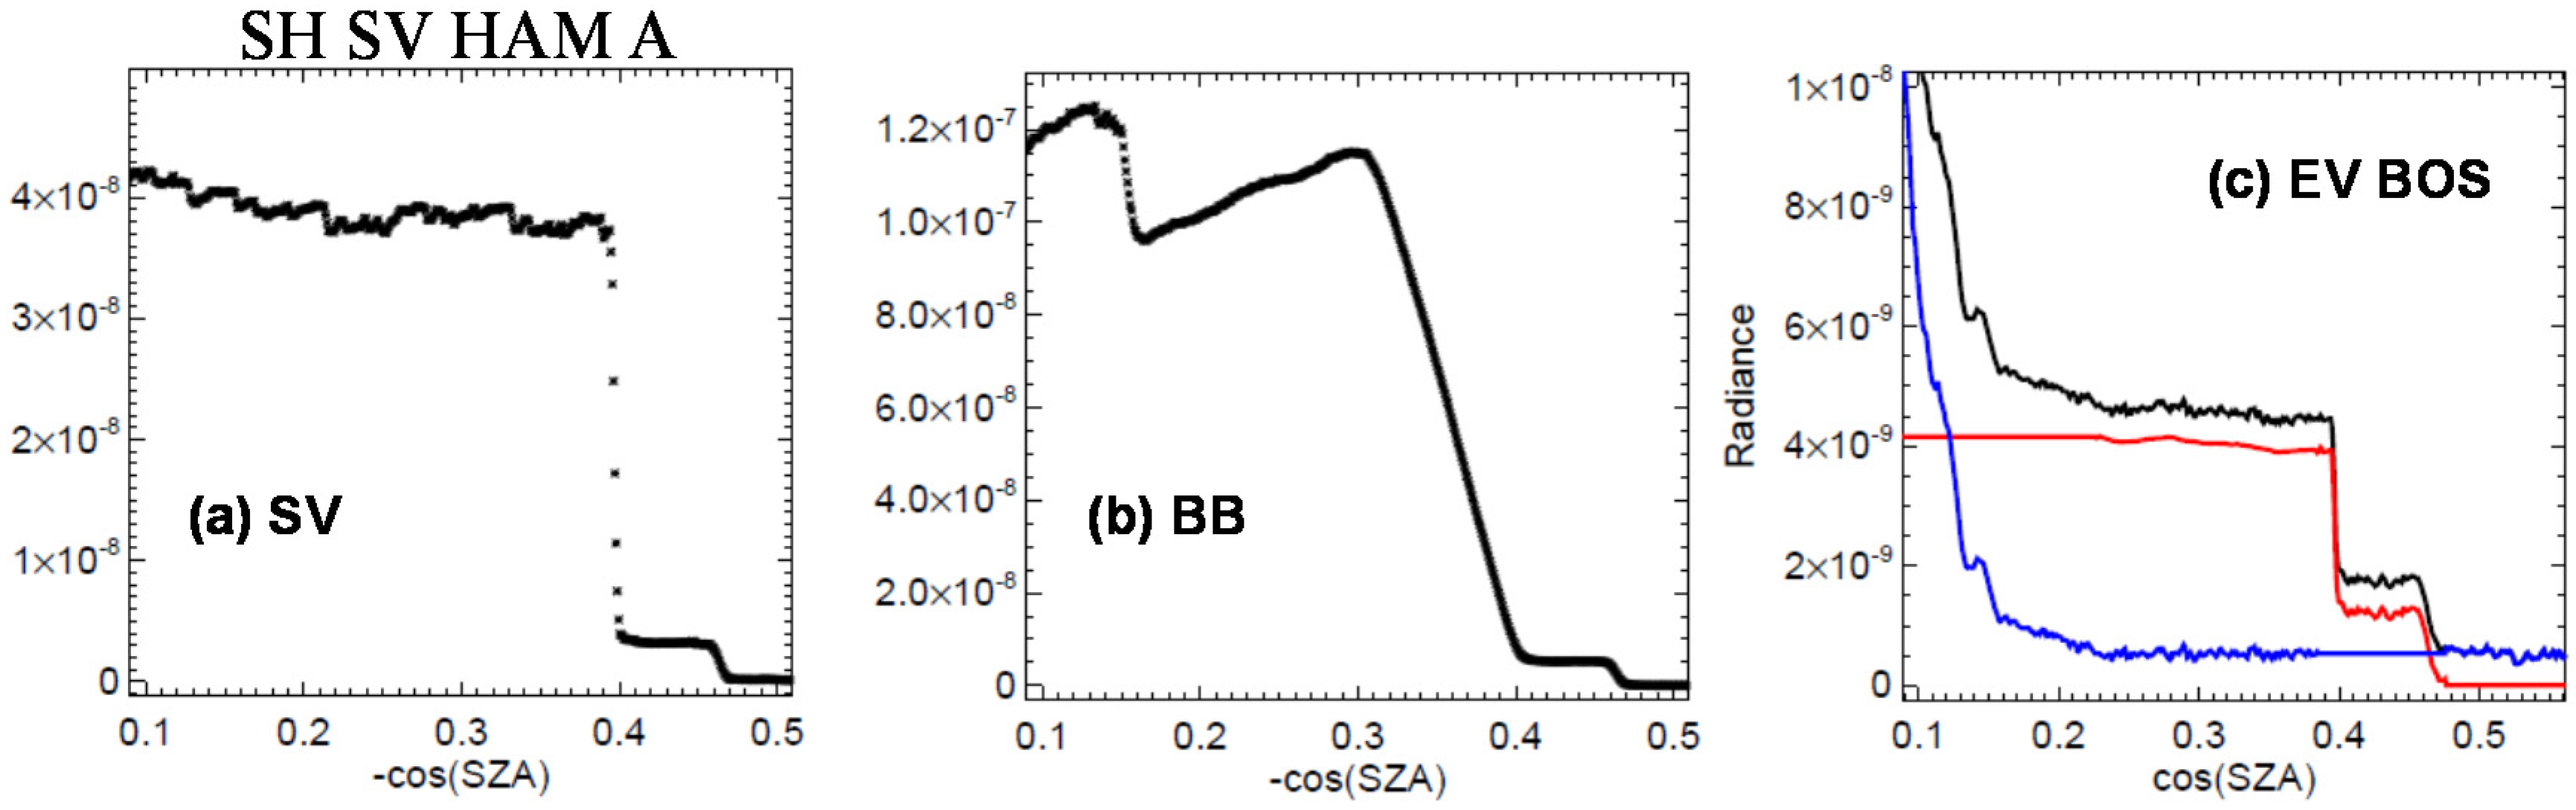
Figure 7 shows the EV and calibration view signal levels around the DNB EV stray light affected-regions in the southern hemisphere. In the penumbra region, EV and calibration view signals show an increase similar to what was observed in the northern hemisphere, but with a smaller magnitude. The BB and SV also showed similar patterns and magnitude as EV signals before the onset of solar calibration when additional solar illumination is coming through the SD screen. At the onset of solar calibration, both SV and EV signals showed a sudden jump that coincides with a signal jump in SD (Figure 7c). After the signal jump, the SV signal is about one order of magnitude larger than the EV before it transitions into the twilight region. At the beginning of the solar calibration event, the SD signal gradually increased to reflect the increase in solar illumination on SD. The BB signals show a similar pattern to SD with a magnitude of four to five orders smaller.
Figure 7. DNB detector 8 EV and calibration views dark signals near southern hemisphere stray light problem regions on October 5, 2013. (ac) show calibration views. EV dark signals for beginning of scan (BOS), nadir, and end of scan (EOS) are shown in (df), respectively. Black curves are computed dark signals, red curves are estimated stray light, and blue curves are the signals after stray light correction. SZA = solar zenith angle.
Remotesensing 08 00138 g007
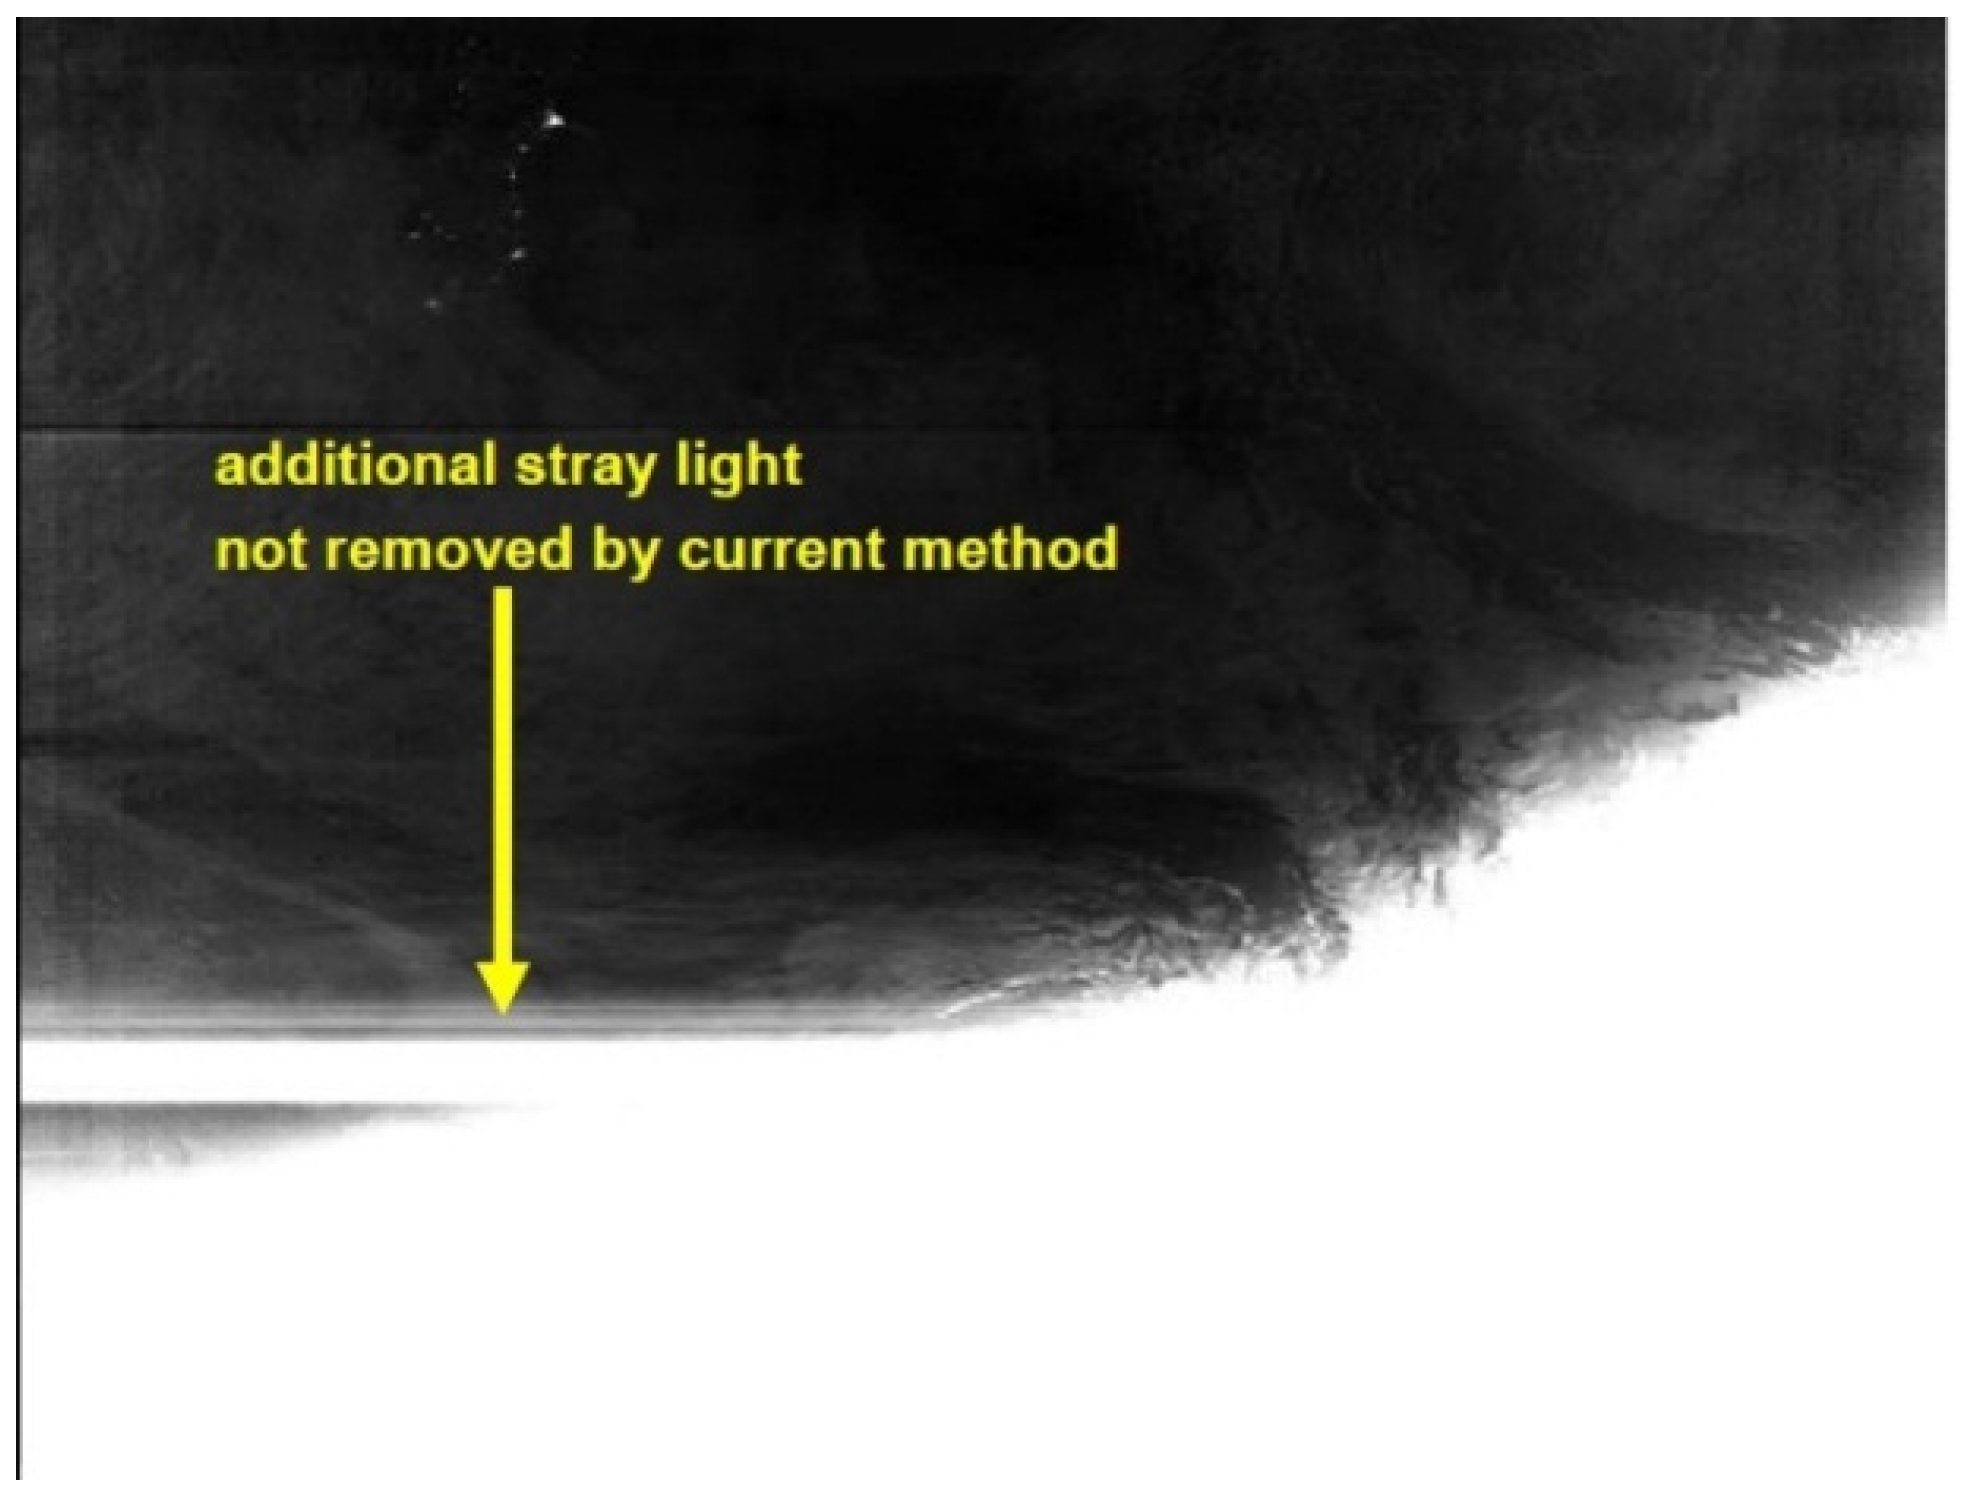
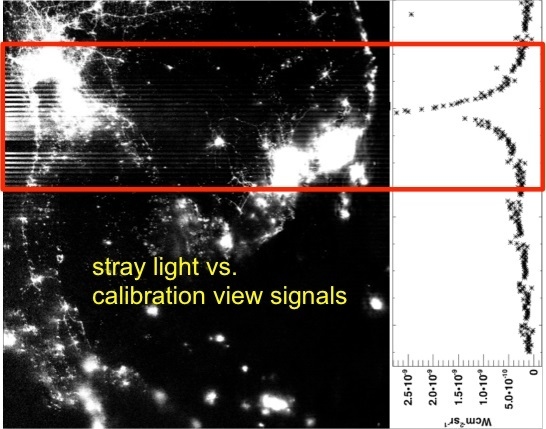
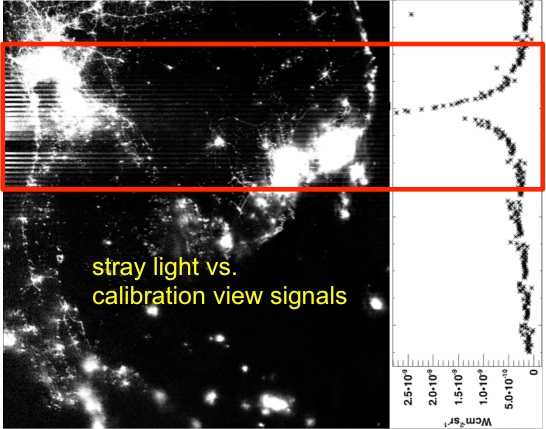
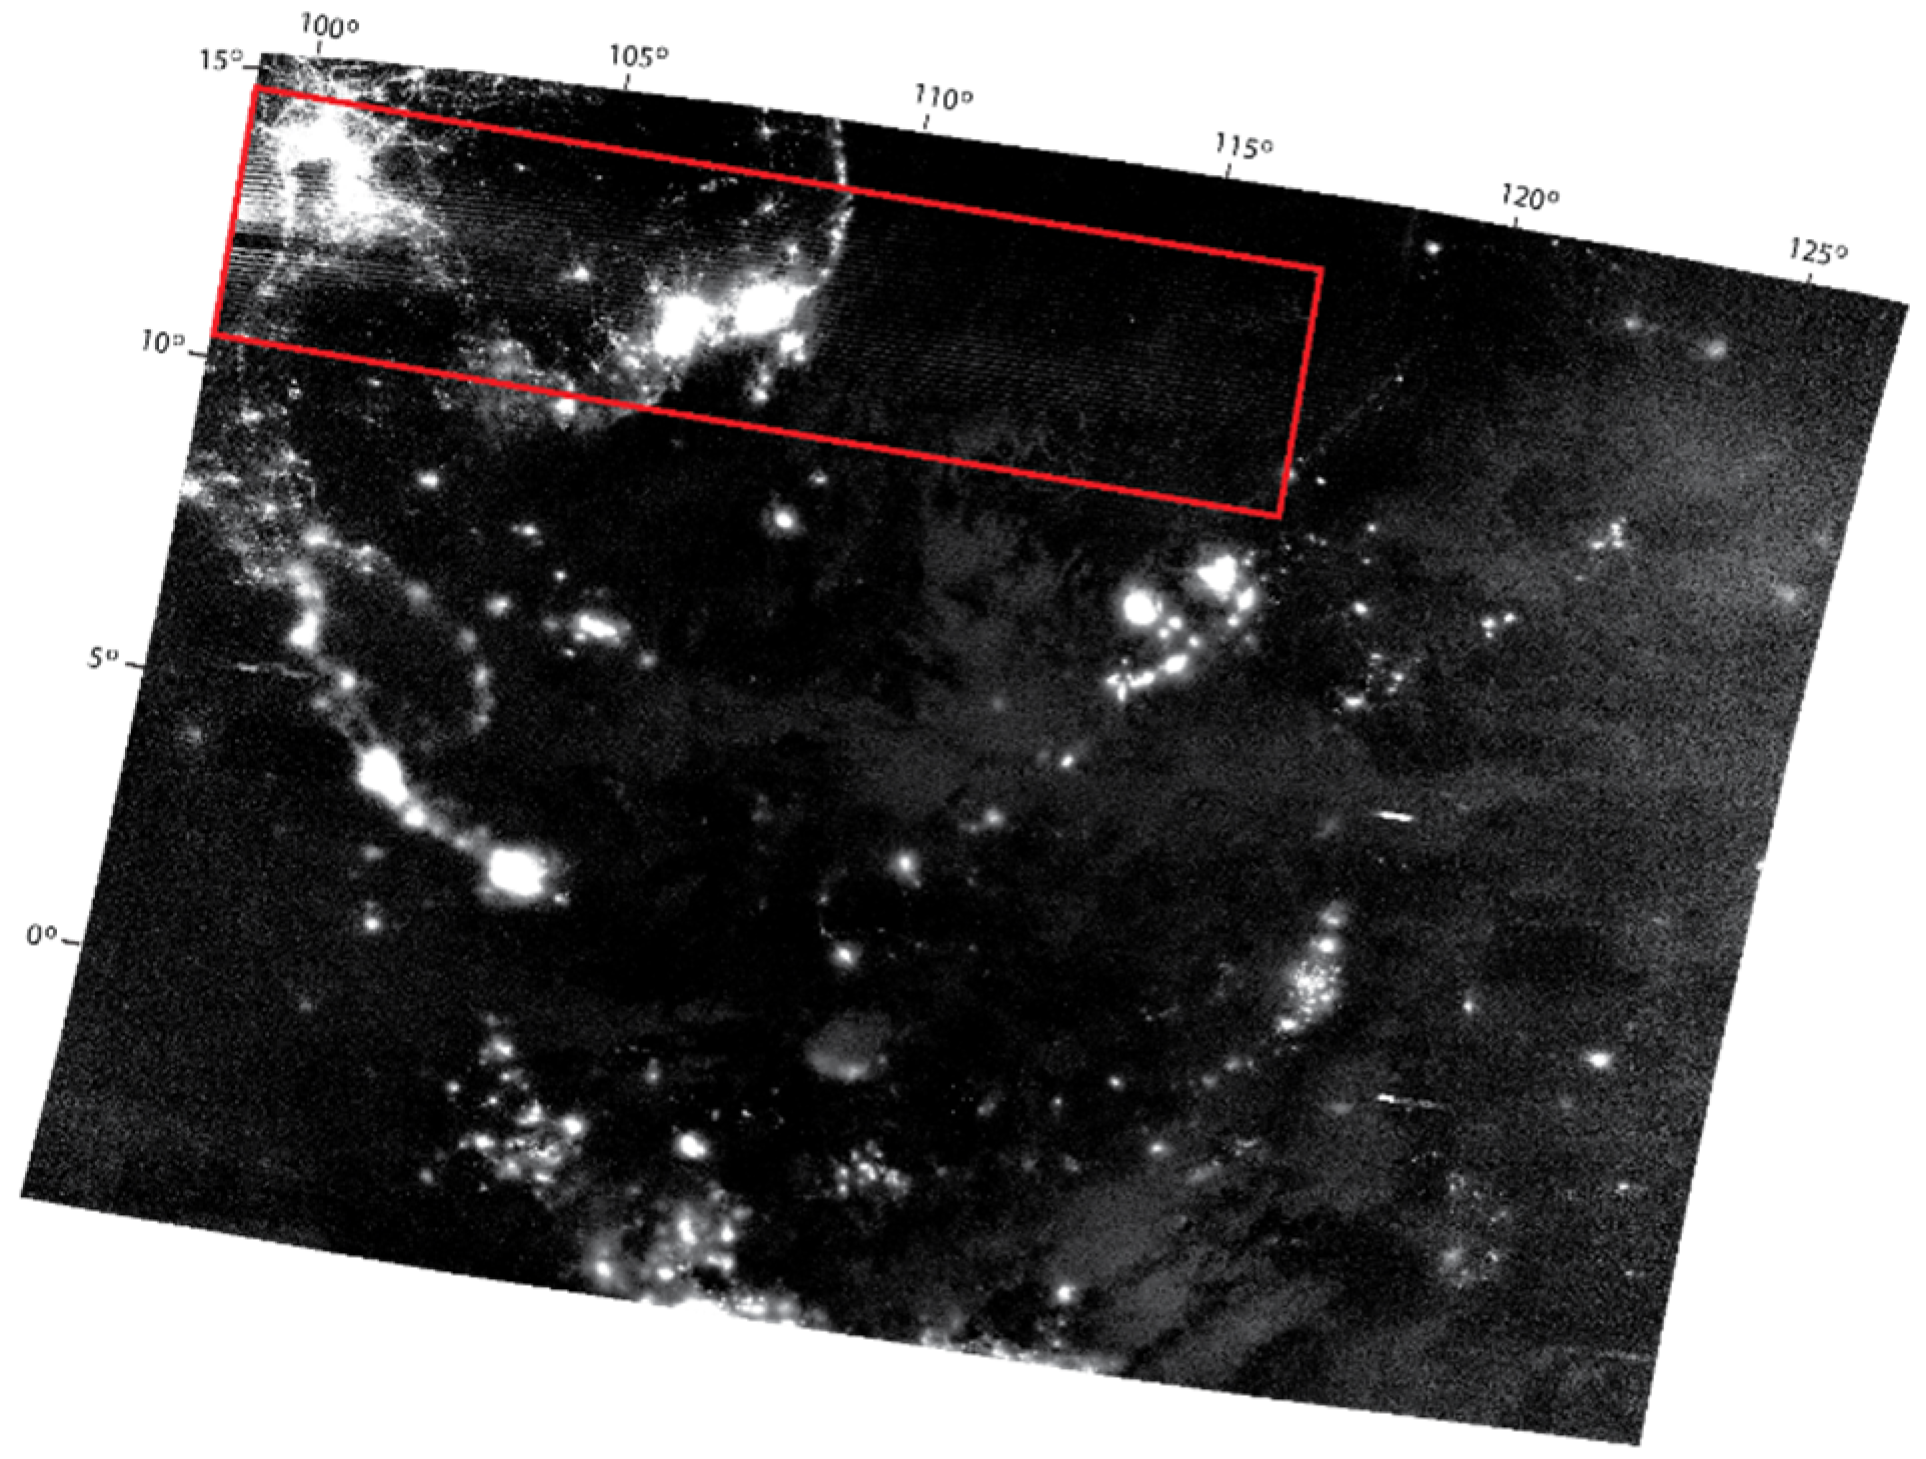
Figure 7 data is taken when additional stray light features occurred in the southern hemisphere. Based on the current correction method, the large correction residual can be seen in Figure 8, which shows that the additional stray light obscures the underlying scene structure. The additional stray light occurred near the twilight region and can be traced back to the elevated SV, BB, and EV dark signals (Figure 7a,b,d). The mean corrected EV dark signal in Figure 7d (blue curve) shows the additional stray light remains within the corrected signals. For comparison, the SV, BB, and EV dark signals for September, 2013 (Figure 9) did not show the corresponding additional stray light features in SV. The current method relies on extrapolation to estimate the stray light in the twilight region due to the difficulty of separating stray light signals from Earth radiance [16,20]. The current method had been proven to work well roughly nine months of the year when there are no additional stray light features. The blue curve in Figure 9 shows no obvious artifact after correction. However, a different method would be required to remove this additional stray light feature.
Figure 8. DNB image from October 5, 2013, 5:06 GMT, corrected by the current method. The residual artifact from additional stray light can be seen as a large swath across the image.
Remotesensing 08 00138 g008
Figure 9. DNB detector of eight dark signals near the southern hemisphere stray light problem regions on September 5, 2013 for (a) SV; (b) BB; and (c) EV at BOS. Black curves are computed dark signals, red curves are estimated stray light, and blue curves are the signals after stray light correction. SZA = solar zenith angle.
Remotesensing 08 00138 g009
To estimate the additional stray light contamination, the current correction method is modified in the twilight region. First, the angular extent of the additional stray light is estimated from SV signals (Figure 7). Then, the expected EV dark signals are estimated based on an exponential fit using data outside of the additional stray light region. The additional stray light is then approximated as the difference between the computed EV dark signals and the approximated EV dark signals. The stray light estimates outside of the new regions identified by SV data remain the same as the current method, in which extrapolated values were used. Based on this updated method, Figure 10 shows the computed EV dark signals, estimated EV stray light, and the expected EV dark signals after stray light correction. Compared with the current method (Figure 7), the updated method was able to estimate the bulk of the additional stray light even within the twilight region. Notice that the estimated additional stray light features were at the onset of twilight at BOS, completely within the twilight at nadir, and nonexistent at EOS, as the additional stay light becomes insignificant to EV signals.
Figure 10. DNB EV dark signals near the southern hemisphere stray light problem regions on October 5, 2013. (ac) show EV dark signals for beginning of scan (BOS), nadir, and end of scan (EOS), respectively. Black curves are computed dark signals, red curves are estimated stray light based on the updated method, and blue curves are the signals after stray light correction. SZA = solar zenith angle.
Remotesensing 08 00138 g010
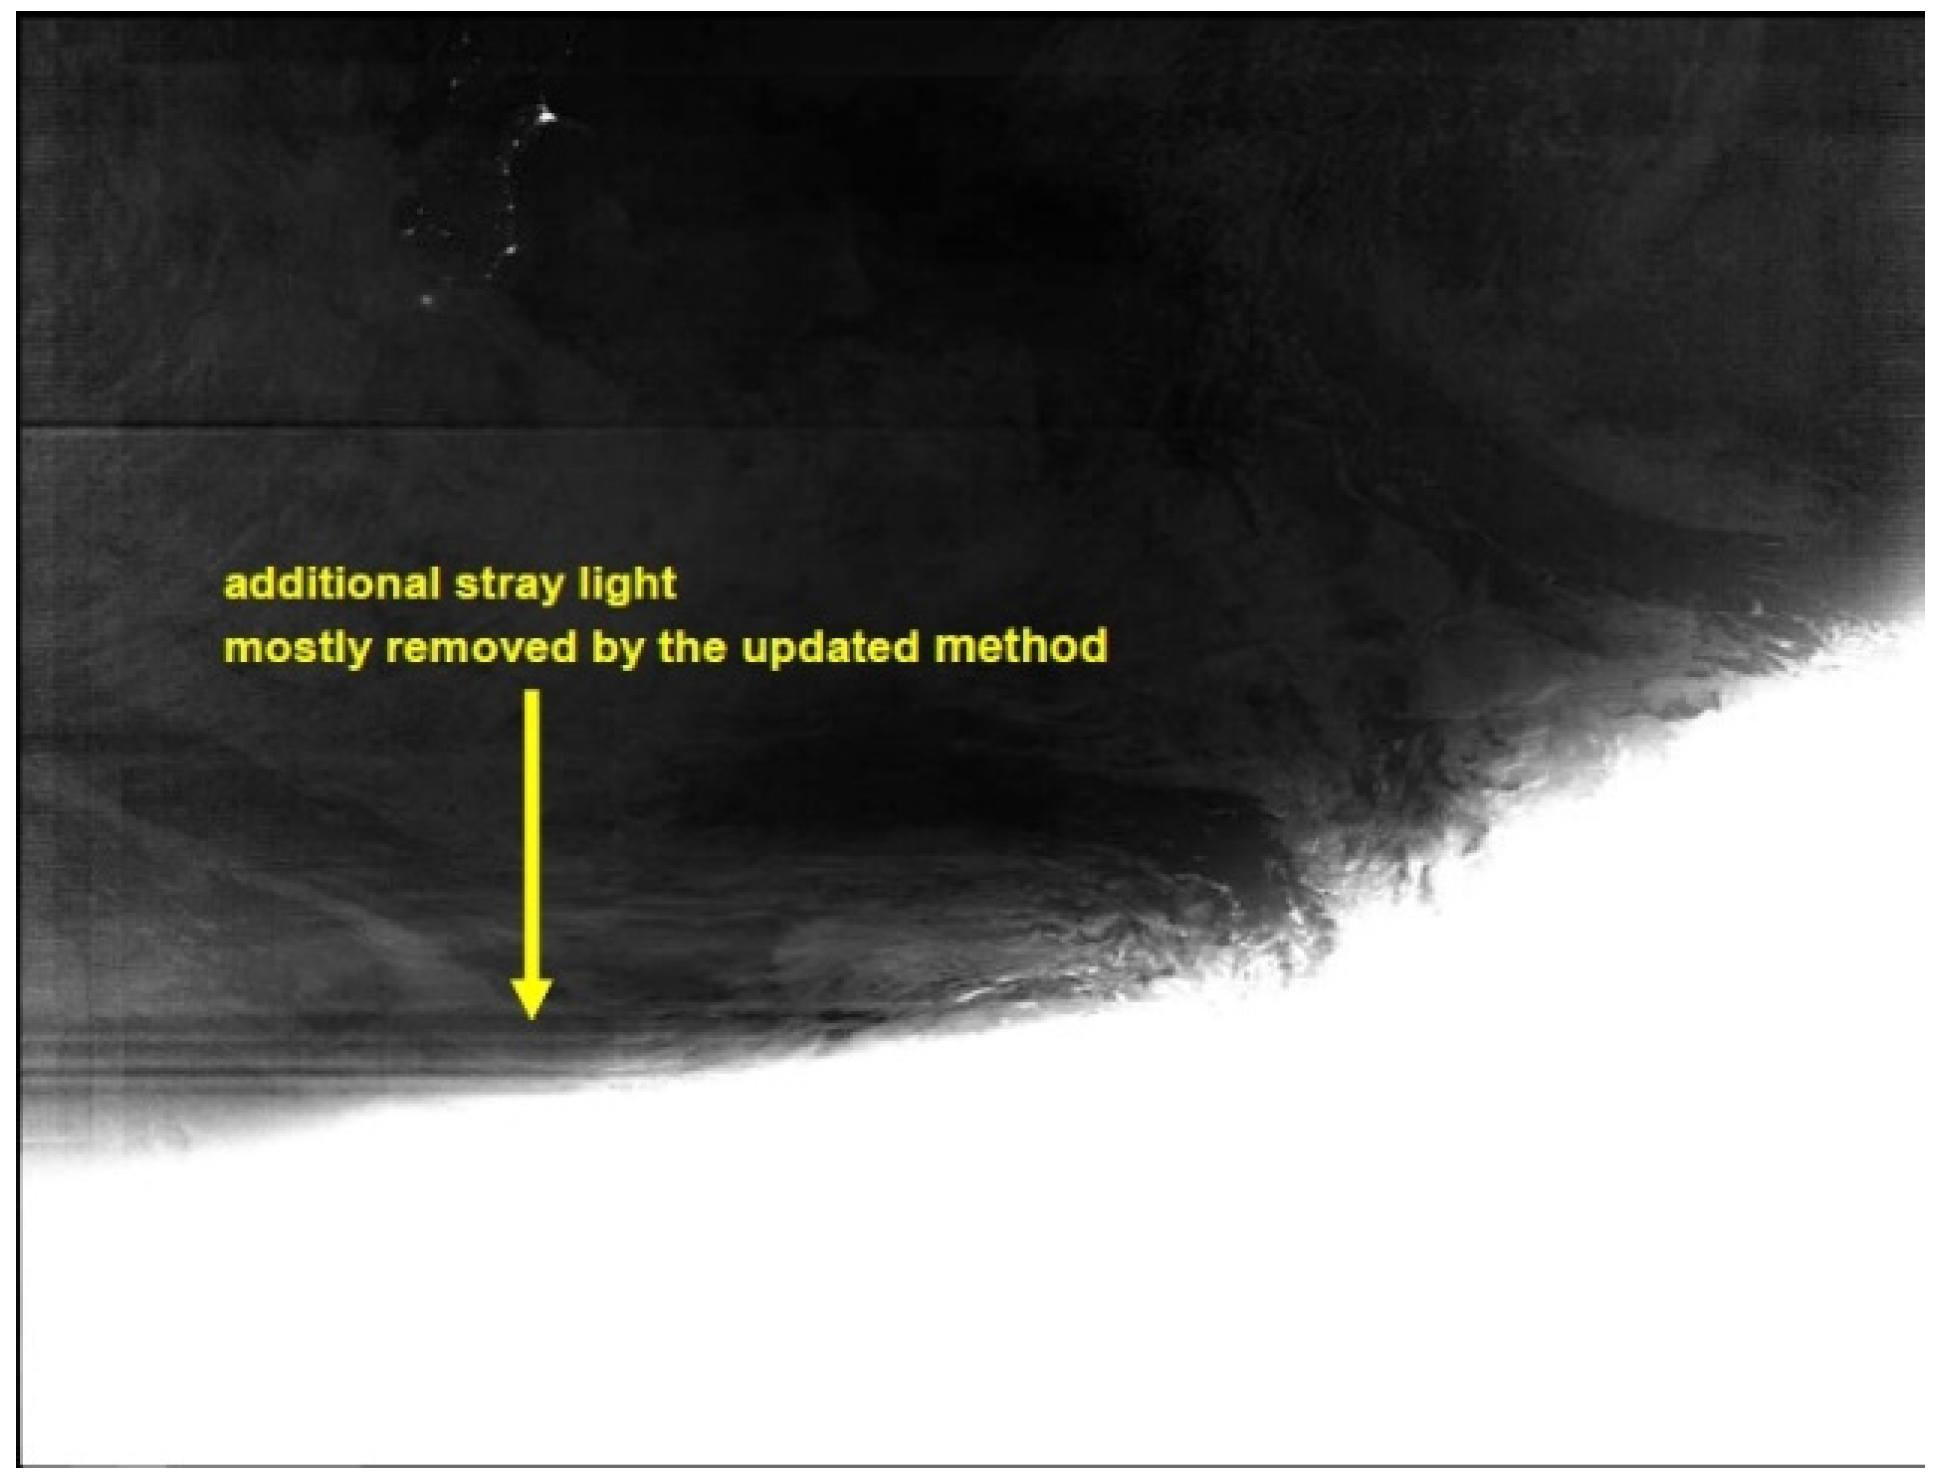
To test the updated method, we applied the updated stray light estimates to Figure 8 and generated the updated DNB stray light corrected image for comparison. The updated DNB stray light corrected image (Figure 11) shows that the bulk of the additional stray light is removed with some correction residuals. Compared with the current image (Figure 8), the updated image reveals additional features under the prior additional stray light contamination region with the well-defined twilight transition across the image. The additional stray light region slices through the twilight transition zones, which complicates the stray light estimation due to the overlapping of stray light and twilight signals. As shown in Figure 7, the additional stray light is clearly identified at BOS, but is partially embedded in the twilight at nadir. At EOS, the additional stray light becomes insignificant when compared with the Earth scene radiance. The result indicates that the updated correction method successfully entangled the stray light features from the twilight, as the corrected image (Figure 11) did not show strong scan angle-dependent residual biases.
Figure 11. DNB image from October 5, 2013, 5:06 GMT, corrected by the updated method. The residual artifact from additional stray light is significantly reduced.
Remotesensing 08 00138 g011
The southern hemisphere stray light correction experienced a similar penumbra angle mismatch issue discussed earlier in the northern hemisphere stray light correction. Furthermore, a much larger angle mismatch could come from the onset of the SD angle as its temporal drift is much larger. To track the temporal drift, we estimated the onset of the SD angle using the signal jumps in the SV data (see Figure 7a). The estimated SD onset angles (Figure 12) show an annual oscillation of about two degrees, an order of magnitude larger than the penumbra’s angular cycle. The large angular drift indicates the importance in selecting stray light correction LUT to avoid a significant correction error due to bias in the SD onset angles. 
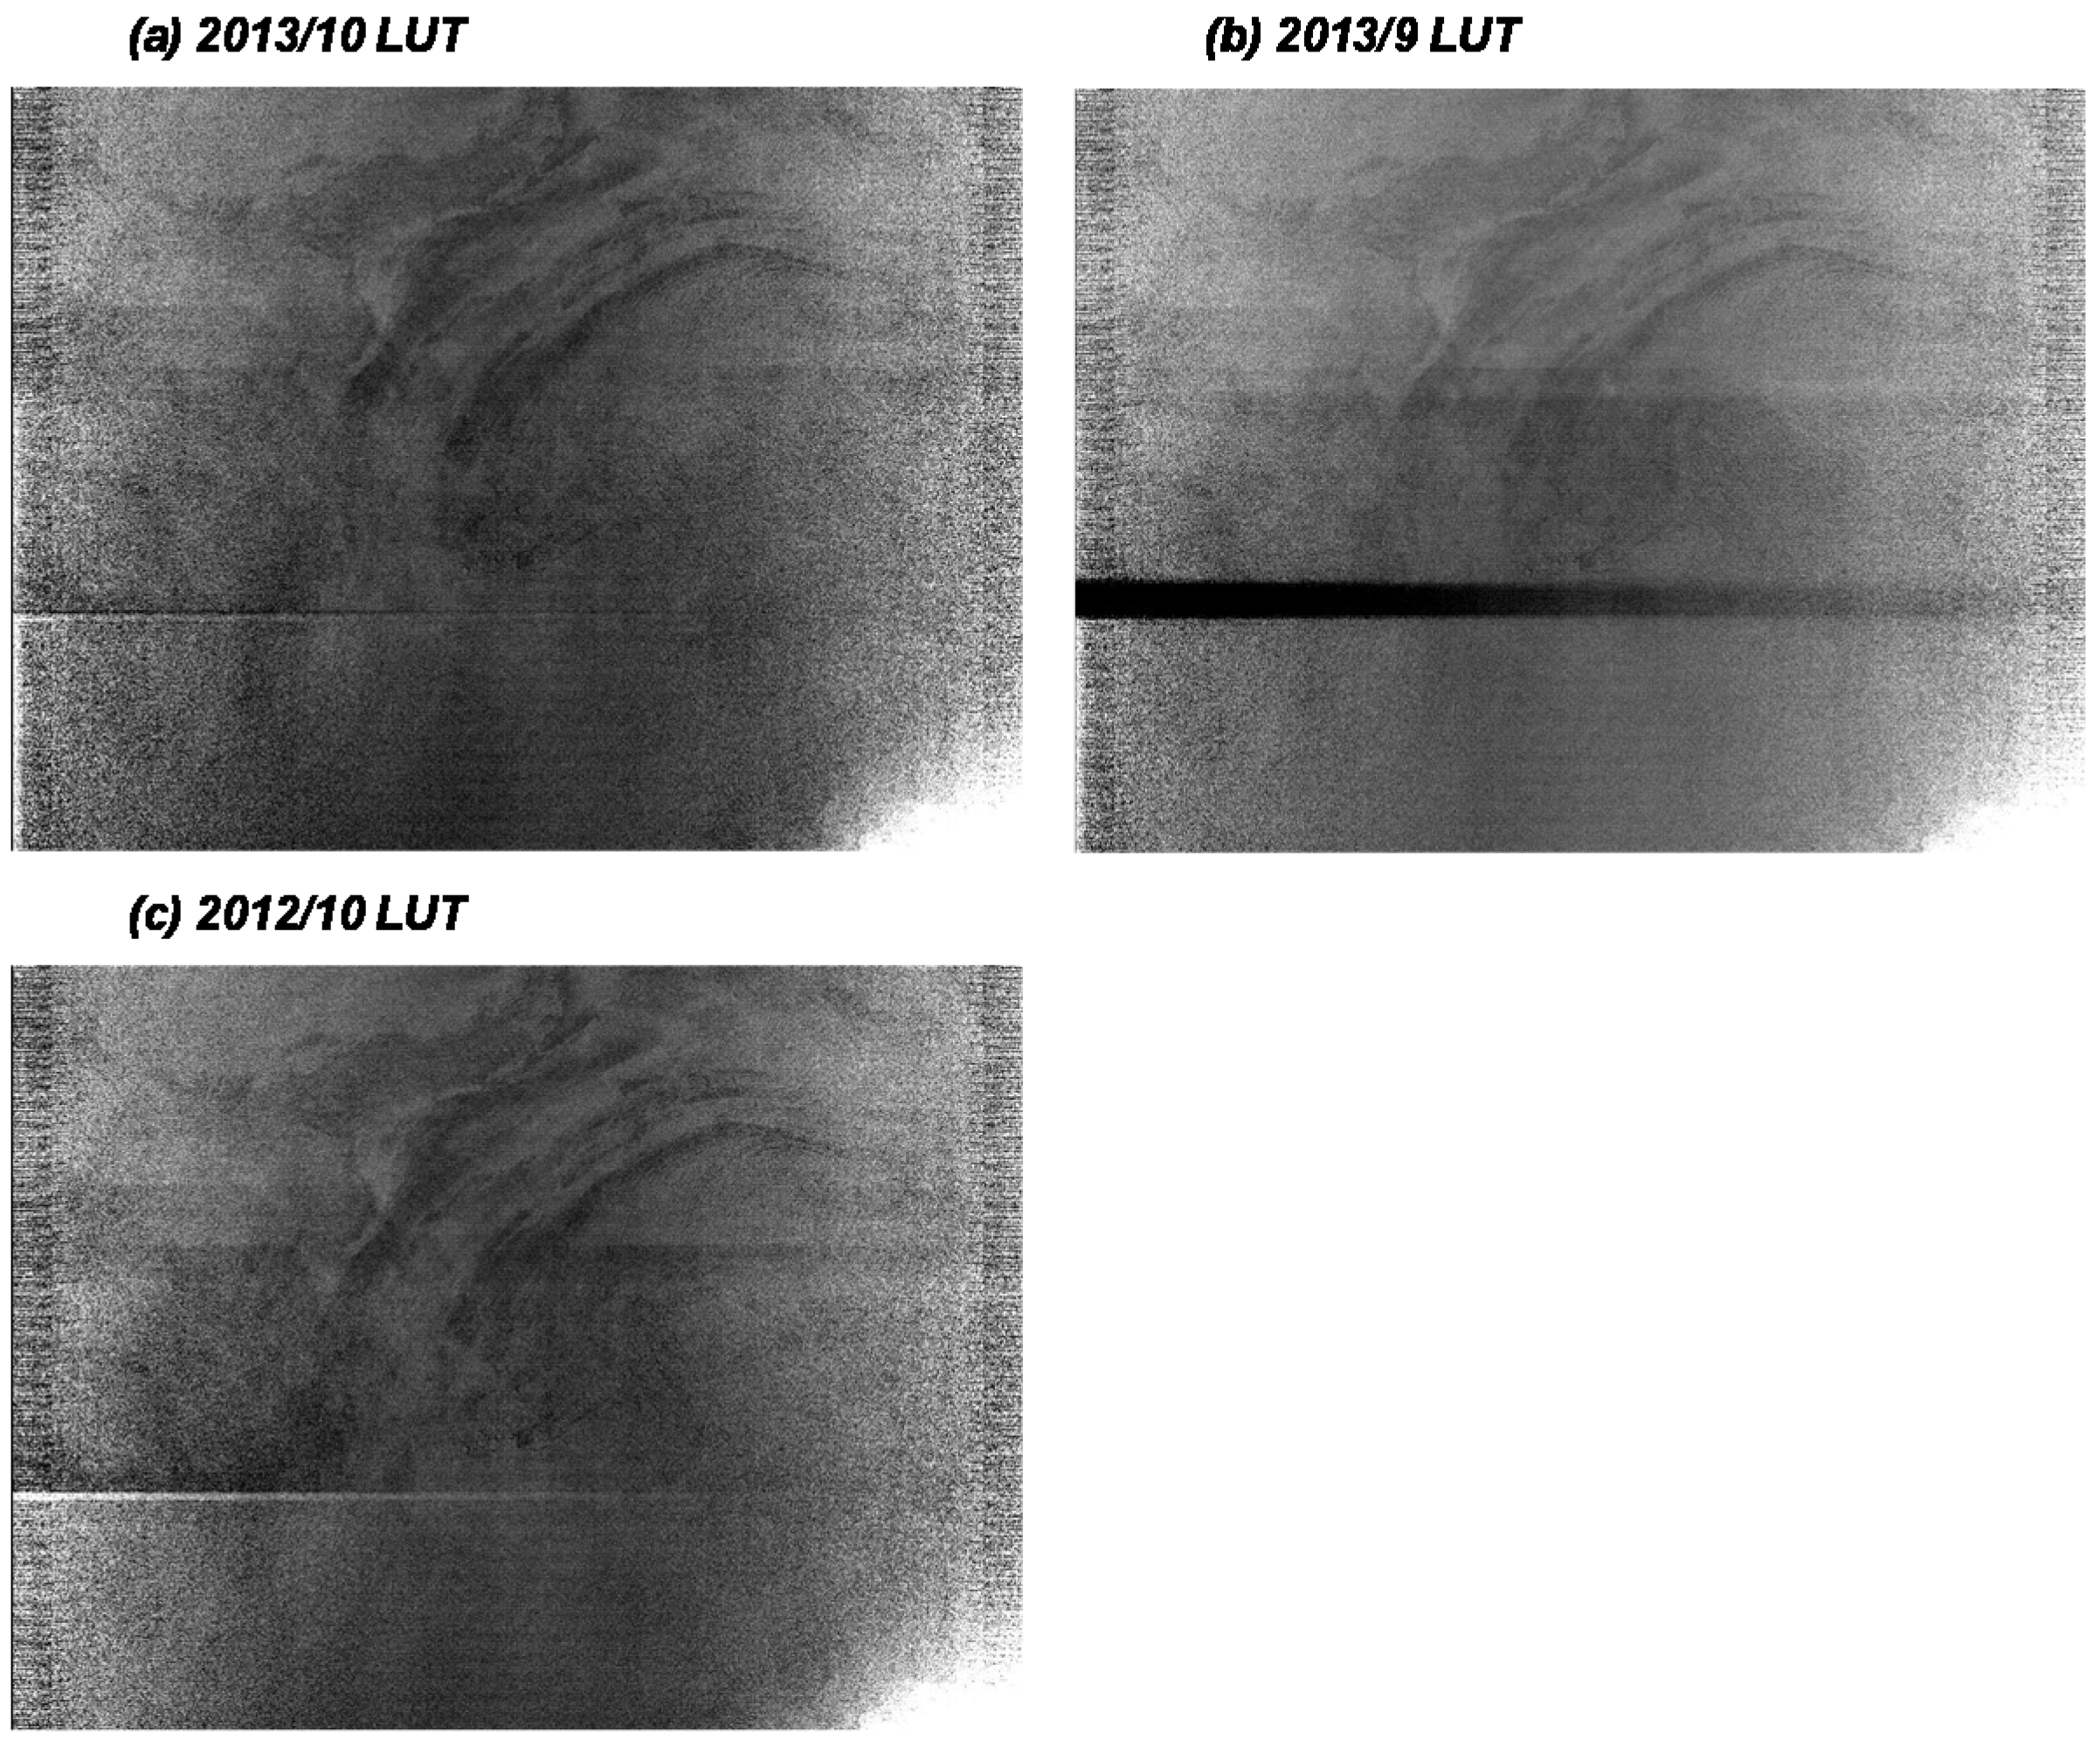
Figure 13 shows the image corrected using the prior month’s LUT has significant overcorrection (black strip in Figure 13b) due to the bias in the SD onset angle. The image corrected using the prior year’s LUT (Figure 13c) showed a more comparable result with correction performed with the current month’s LUT (Figure 13a).
Figure 12. SD onset angle estimated using DNB SV data.
Remotesensing 08 00138 g012
Figure 13. Stray light corrected images for October 5, 2013, 1:41 GMT, using LUTs derived from (a) 2013 October; (b) 2013 September; and (c) 2012 October data.
Remotesensing 08 00138 g013

3.3. Low Latitude Stray Lights

Occasionally, the DNB images could also be contaminated by stray light in the lower latitude regions. Unlike the persistent and predictable mid-to-high latitude DNB stray light previously described, the low latitude stray light appears to occur without predictable periodicity. Figure 14 shows an image in Southeast Asia from December 28, 2014, and striping can be observed in the upper left part of the image. The striping occurred between 10 and 15 degrees north, which is far beyond the reach of the known mid-to-high latitude DNB stray light. Analysis of the calibration view signals showed an elevated SV signal that is several times higher during the time when the striping occurred in the Earth view image (Figure 15). The BB and SD signals are not shown here as no additional signals were observed. The correlation between SV signals and low latitude EV striping features were also found in many other instances (results not shown here). The result indicates a possible stray light source near SV as a cause of the striping feature. One probable source could be the Moon, which is at its first quarter phase and near the SV view angle when the elevated signals occurred. A source near SV could also explain the striping features being most prominent near the BOS, and no additional signals are observed in BB and SD data.
Figure 14. SNPP DNB image from December 28, 2014, 18:06 GMT. The red box indicates the approximated areas with contaminations.
Remotesensing 08 00138 g014
Figure 15. DNB HGA scan averaged SV signals plotted against spacecraft Sun declination angle (SunDec) for orbit 16,420 on December 28, 2014. The signal increase arounda Sun declination angle of 80 degrees corresponded to the timing when EV striping occurred at the beginning of the scan in Figure 14.
Remotesensing 08 00138 g015

3.4. Background Stray Light from the Moon

The operational VIIRS DNB EV dark offset is determined once a month via a special operation [25]. The dark offset is determined using data collected over the dark ocean during each month’s new moon. Studies have shown the dark ocean scenes are not sufficiently dark to set the DNB HGS offset for the nighttime due to airglow and the biases that could be up to 8 × 10⁻¹⁰ W·cm−2·sr−1 [15,20]. One solution is to use an airglow-free dark reference derived from the spacecraft pitch maneuvers’ deep space scene and track the dark offset drift from the BB signals [
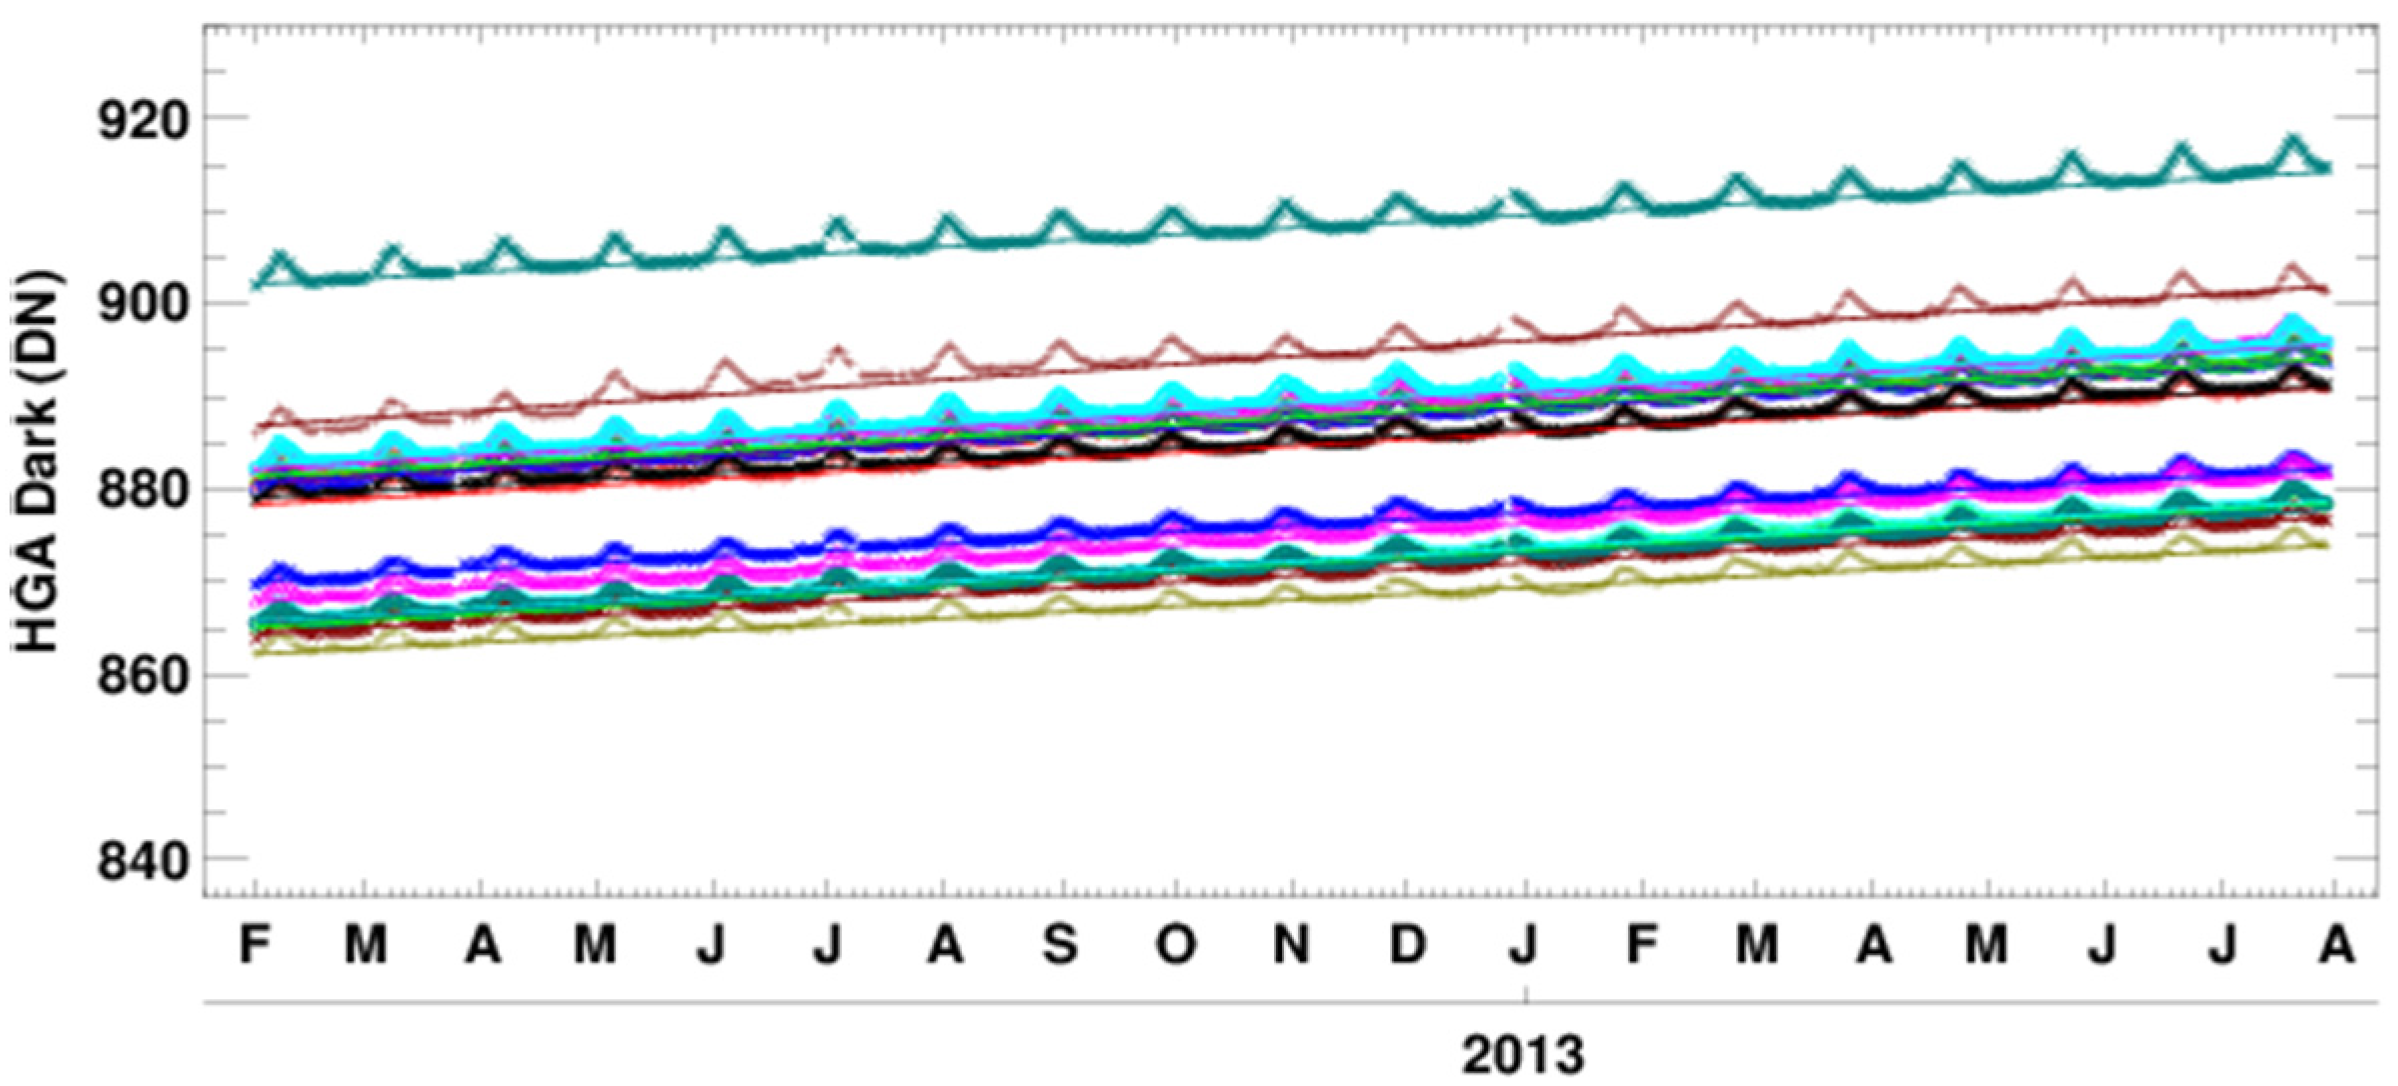
17]. However, the BB nighttime signal trending (Figure 16) showed periodic bumps that are found to be correlated with Moon illumination. To remove the periodic stray light from the Moon, the dark drifts are fitted using the BB data near new moon, and the fitted values are used to adjust dark offset derived from pitch maneuver data [17].
Figure 16. DNB BB daily mean dark signal DN for HGA, aggregation mode 1. The measured values for each detector are represented by symbols. The lines are fitted values using new moon data. The periodic increase in DN corresponded to the increase in lunar illumination. At full moon, the dark response is up to 5 dn (~ 8 × 10⁻¹¹ W·cm−2·sr−1) higher than the new moon.
Remotesensing 08 00138 g016
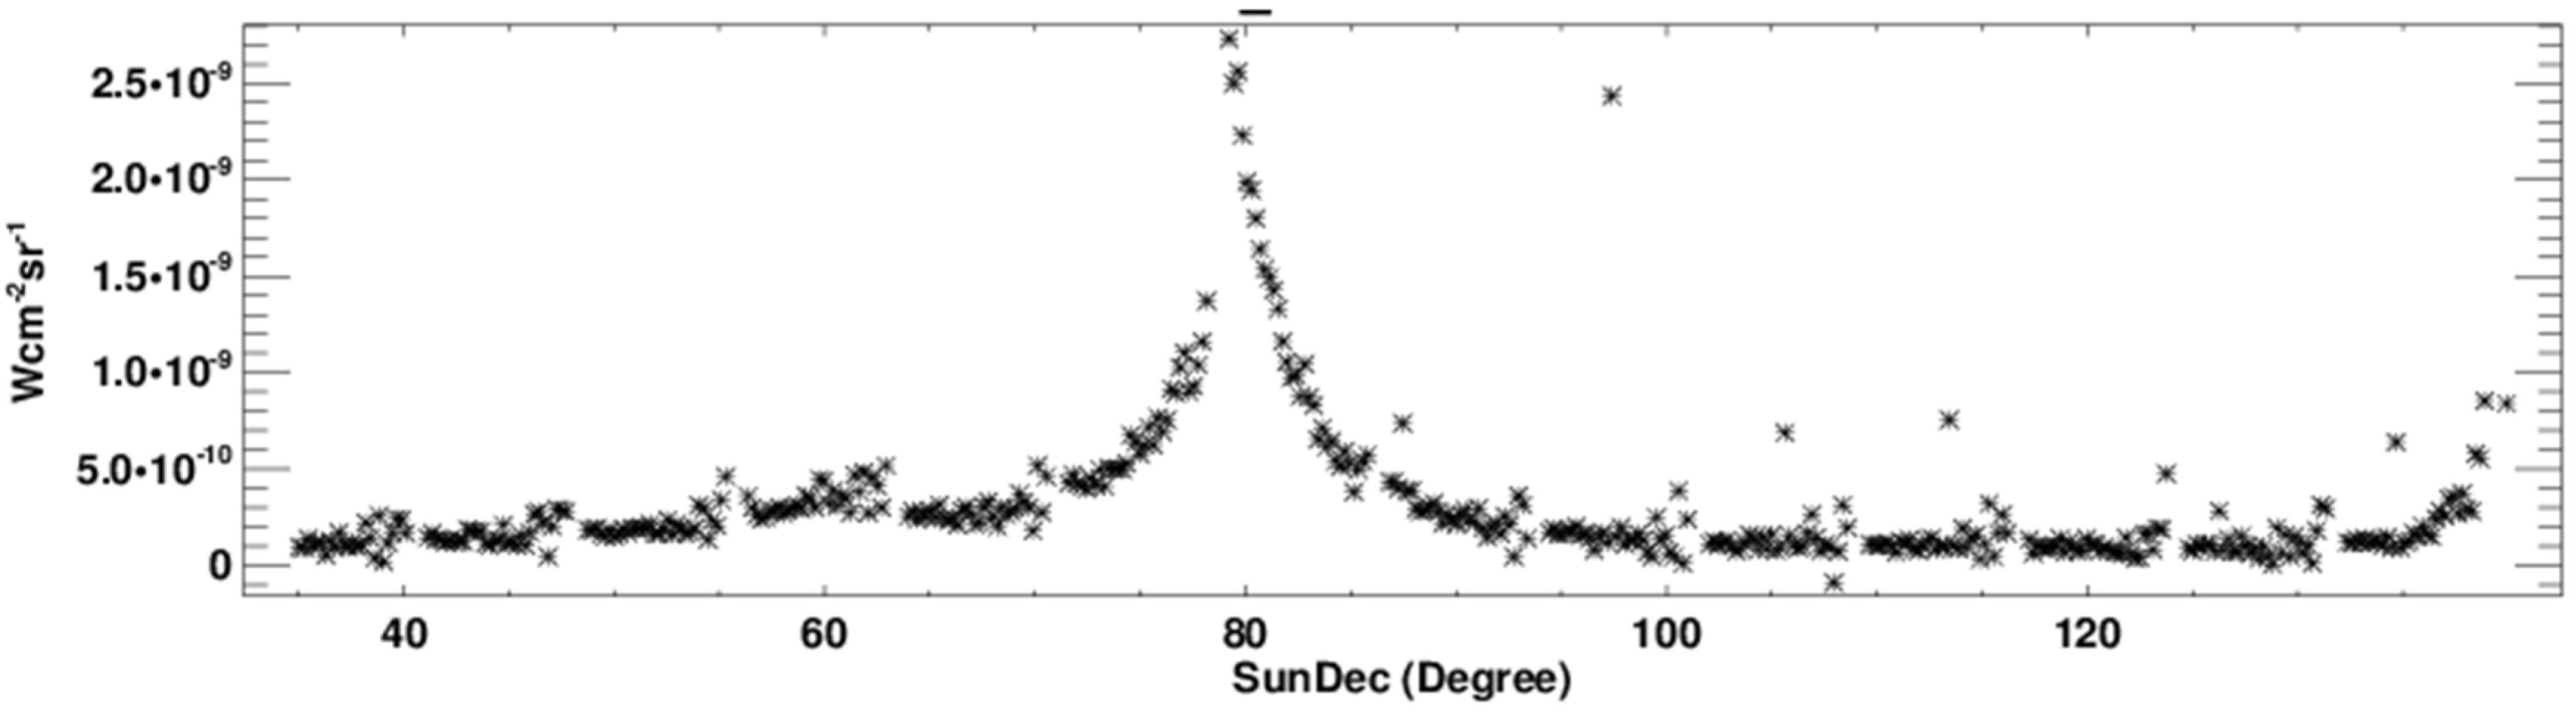
Although this method provided a dark offset that is free from Moon contamination, it is uncertain if, and how much of, the Moon stray light affects EV observation. Based on the stray light analysis and its corresponding EV and calibration views signal features presented earlier, the stray light signals in BB suggest similar effects in EV data. If the Moon stray light observed in BB is, indeed, elevating background signal levels for EV observations, then the EV dark offset should be adjusted based on Moon illumination. The EV and BB relationships presented earlier (Figure 4 and Figure 7) indicated that the EV stray light is at a similar level of BB signal. In Figure 16, the Moon stray light observed in BB is less than 8 × 10⁻¹¹ W·cm−2·sr−1, which is just below the usable DNB radiance of 10−10 W·cm−2·sr−1 [15], and much smaller than the typical airglow. If the Moon stray light causes similar background signal increase in EV as in BB, the impact on DNB imagery quality will be minimal. The potential impact would only be in the airglow over dark surfaces, e.g., oceans, as most other surfaces will have radiance much higher than the Moon stray light.

4. Conclusions

In this paper we analyzed the Soumi NPP VIIRS DNB calibration view data to better understand DNB stray light characteristics. Our analyses show that although the calibration view data provided indirect measurements of Earth view stray light, the calibration view signal features contain useful information for improving current stray light correction and identifying additional stray light features.
In the current stray light correction, matching the onset angles in regions with sharp signal changes, i.e., penumbra and solar diffuser calibration, are critical to avoid large errors. We found that the temporal changes in the penumbra and onset of solar diffuser calibration angles can be tracked by space view data. The angle differences between the creation of stray light correction LUT and the corrected scene can be adjusted to reduce image artifacts after correction. Both penumbra and solar diffuser calibration onset angles are affected by the Earth-Sun-spacecraft geometric relationship, as the long term trends show yearly cycles with a small long-term drift. The yearly repeated onset angles indicating a yearly recycled correction LUT should perform reasonably well with the current scene, thus improving stray light correction in forward operational correction when the current month's correction LUT is not available. However, some angle adjustment in the recycled LUT could be made to account for the long-term onset angular drifts, especially for the solar diffuser calibration onset region as its temporal change is much larger than the penumbras.
One limitation in the current stray light correction method is the inability to remove an additional stray light feature that occurs during the southern hemisphere’s springtime. The additional stray light region overlaps with the Earth scene twilight signals but can be clearly identified in the calibration view data. Based on the calibration view data estimated angular extents of this additional feature, we modified how stray light is estimated when the additional stray light feature occurred. A comparison of DNB images generated by the current and updated methods showed the updated method removed most of the additional stray light and revealed portions of the Earth’s surface previously obscured by stray light.
The analysis of calibration view signal characteristics also indicates possible stray light contamination outside of the currently-known stray light problem regions. The stray light-like features occasionally observed in low-latitude Earth scenes were linked to the elevated signals in the space view. The cause of this low-latitude stray light is unknown, although the Moon might be a possible source. Moon illumination was also found to cause a small increase in the calibration view’s background signals which, potentially, could also affect the Earth view observations.
Finally, the VIIRS DNB stray light is a complex issue currently without clearly identified root causes. As the DNB stray light problem will continue for the follow-on VIIRS missions for the next couple of decades, the full potential of DNB will depend on how well the stray light can be characterized and corrected. In this study, we showed the potential of using calibration view data to improve Earth view stray light characterization and correction. We believe that further studies on operational methods to incorporate time-dependent onset angles in stray light correction, refinement of the additional stray light correction in the twilight regions, and quantifying other stray light sources are critical to continue improving DNB radiometric calibration accuracy in the future.

Acknowledgments

The authors would like to thank the anonymous reviewers for their constructive comments and suggestions, which helped improve our paper. Thanks to Samuel Anderson and Julia Gutin for their editorial assistance. The views, opinions, and findings contained in this paper are those of the authors and should not be construed as official positions, policy, or decisions of the NOAA or the U.S. Government.

Author Contributions

Shihyan Lee designed the study, developed the methodology, performed the analysis and wrote the manuscript. Changyong Cao provided the direction of the study, oversaw the progress and contributed to the writing and revising of the manuscript.

Conflicts of Interest

The authors declare no conflict of interest.

References

  1. Mills, S. VIIRS Radiometric Calibration Algorithm Theoretical Basis Document; Doc. No.: D43777; Northrop Grumman Aerospace Systems: Redondo Beach, CA, USA, 2010. [Google Scholar]
  2. Hillger, D.; Kopp, T.; Lee, T.; Lindsey, D.; Seaman, C.; Miller, S.; Solbrig, J.; Kidder, S.; Bachmeier, S.; Jasmin, T.; et al. First-light imagery from Suomi SNPP VIIRS. Bull. Amer. Meteor. Soc. 2013, 94, 1019–1029. [Google Scholar] [CrossRef]
  3. Southwell, K. Remote sensing: Night lights. Nature 1997, 390. [Google Scholar] [CrossRef]
  4. Imhoff, M.L.; Lawrence, W.T.; Elvidge, C.D.; Paul, T.; Levine, E.; Privalsky, M.V.; Brown, V. Using nighttime DMSP/OLS images of City lights to estimate the impact of urban land use on soil resources in the United States. Remote Sens. Environ. 1997, 59, 105–117. [Google Scholar] [CrossRef]
  5. Imhoff, M.L.; Lawrence, W.T.; Stutzer, D.C.; Elvidge, C.D. A technique for using composite DMSP/OLS “City Lights” satellite data to map urban area. Remote Sens. Environ. 1997, 61, 361–370. [Google Scholar] [CrossRef]
  6. Elvidge, C.; Imhoff, M.L.; Baugh, K.E.; Hobson, V.R.; Nelson, I.; Safran, J.; Dietz, J.B.; Tuttle, B.T. Nighttime lights of the world: 1994–1995. ISPRS J. Photogramm. Remote Sens. 2001, 56, 81–99. [Google Scholar] [CrossRef]
  7. Lawrence, W.T.; Imhoff, M.L.; Kerle, N.; Stutzer, D. Quantifying urban land use and impact on soils in Egypt using diurnal satellite imagery of the earth surface. Int. J. Remote Sens. 2002, 23, 3921–3937. [Google Scholar] [CrossRef]
  8. Elvidge, C.D.; Baugh, K.E.; Kihn, E.A.; Kroehl, H.W.; Davis, E.R. Relation between satellite observed visible-near infrared emissions, population, and energy consumption. Int. J. Remote Sens. 1997, 18, 1373–1379. [Google Scholar] [CrossRef]
  9. Elvidge, C.D.; Baugh, K.E.; Kihn, E.A.; Kroehl, H.W.; Davis, E.R. Mapping of city lights using DMSP operational linescan system data. Photogramm. Eng. Remote Sens. 1997, 63, 727–734. [Google Scholar]
  10. Cao, C.; Bai, Y. Quantitative analysis of VIIRS DNB nightlight point source for light power estimation and stability monitoring. Remote Sens. 2014, 6, 11915–11935. [Google Scholar] [CrossRef]
  11. Miller, S.D.; Mills, S.P.; Elvidge, C.D.; Lindsey, D.T.; Lee, T.F.; Hawkins, J.D. Suomi satellite brings to light a unique frontier of nighttime environmental sensing capabilities. Proc. Natl. Acad. Sci. USA 2012, 109, 15707–15710. [Google Scholar] [CrossRef] [PubMed]
  12. Cao, C.; Shao, X.; Uprety, S. Detecting light outages after severe storms using the S-SNPP/VIIRS day/night band radiances. IEEE Trans. Geosci. Remote Sens. 2013, 10, 1582–1586. [Google Scholar] [CrossRef]
  13. Roman, M.; Stokes, E.C. Holidays in lights: Tracking cultural patterns in demand for energy services. Earth’s Future 2015. [Google Scholar] [CrossRef]
  14. Millers, S. Satellite Sensor Reveals Earth’s Nocturnal Secrets. Available online: http://www.scientificamerican.com/article/miller-satellite-sensor-reveals-earth-s-nocturnal-secrets/ (accessed on 1 February 2016).
  15. Liao, L.B.; Weiss, S.; Mills, S.; Hauss, B. Suomi SNPP CIIRS day-night band on-orbit performance. J. Geophys. Res. Atmos. 2013, 118, 12707–12718. [Google Scholar] [CrossRef]
  16. Mills, S.; Weiss, S.; Liang, K. VIIRS day/night band (DNB) stray light characterization and correction. Proc. SPIE 2013. [Google Scholar] [CrossRef]
  17. Lee, S.; Sun, C.; Chiang, K.F.; Xiong, X. An overview of NASA VIIRS Day-Night Band (DNB) on-orbit radiometric calibration. Proc. SPIE 2014. [Google Scholar] [CrossRef]
  18. Lian, L.; Weiss, S.; Liang, C. DNB Performance. 2013 December SNPP SDR Review. Available online: http://www.star.nesdis.noaa.gov/star/documents/meetings/SNPPSDR2013/dayTwo/Liao_DNBPerf.pdf (accessed on 1 February 2016).
  19. Mills, S.; Miller, S.D. VIIRS Day-Night Band (DNB) calibration methods for improved uniformity. Proc. SPIE 2014. [Google Scholar] [CrossRef]
  20. Lee, S.; Chiang, K.F.; Xiong, X.; Sun, C.; Samuel, A. The S-SNPP VIIRS day-night band on-orbit calibration/characterization and current state of SDR products. Remote Sens. 2014, 6, 12427–12446. [Google Scholar] [CrossRef]
  21. Lee, T.F.; Nelson, S.C.; Dills, P.; Riishojgaard, L.P.; Jones, A.; Li, L.; Miller, S.; Flynn, L.E.; Jedlovec, G.; McCarty, W.; et al. NPOESS: Next-generation operational global earth observations. Bull. Amer. Meteor. Soc. 2010, 91, 727–740. [Google Scholar] [CrossRef]
  22. Lee, S.; McIntire, J.; Oudrari, H.; Schwarting, T.; Xiong, X. A New Method for Suomi-NPP VIIRS Day Night Band (DNB) On-Orbit Radiometric Calibration; Calcon: Logan, UT, USA, 2013. [Google Scholar]
  23. Lee, S.; McIntire, J.; Oudrari, H.; Schwarting, T.; Xiong, X. A new method for Suomi-NPP VIIRS day-night band on-orbit radiometric calibration. IEEE Trans. Geosci. Remote Sens. 2015, 53, 324–334. [Google Scholar]
  24. Rausch, K.; Houchin, S.; Cardema, J.; Moy, G.; Hass, E.; De Luccia, F.J. Automated calibration of the Suomi National Polar-Orbiting Partnership (S-SNPP) Visible Infrared Imaging Radiometer Suite (VIIRS) reflective solar bands. J. Geophys. Res. Atmos. 2013, 118, 13434–13442. [Google Scholar] [CrossRef]
  25. Geis, J.; Florio, C.; Moyer, D.; Rausch, K.; De Luccia, F.J. VIIRS day-night band gain and offset determination and performance. Proc. SPIE 2012, 8510, 1–12. [Google Scholar]

