1. Introduction
The threats to biodiversity from habitat loss, fragmentation and climate change continue to escalate [
1], and the mapping of habitats and the investigation of the processes that determine local patterns of biodiversity have become increasingly important tasks [
2]. Extensively managed, semi-natural grasslands are among the most diverse ecosystems in Europe, and both agricultural intensification and the abandonment of grazing management have led to a decrease in the plant species diversity in grassland habitats (
cf. [
1]). The conservation and monitoring of grazed semi-natural grasslands has become a high priority within the European Union [
3] and target areas for habitat conservation need to be identified and prioritized in order to maintain and enhance biodiversity [
4]. In the future, the conservation of species diversity in modern agricultural landscapes will require the development of techniques for monitoring and predicting patterns of grassland species diversity: the need for tools that are applicable at detailed spatial scales and over large areas has been identified as a central problem [
5].
While a range of edaphic, topographic, historical and stochastic processes may act as drivers of species diversity within grazed semi-natural grasslands (e.g., [
6,
7]), many studies show that local plant species richness is influenced by present-day variation in grazing intensity [
8] and by the historical continuity of grazing management (e.g., [
9]). The activity of grazing animals influences the availability of essential resources, such as light and soil nutrients (the resource availability hypothesis) [
10]. The activity of grazers may also lead to a greater spatial heterogeneity of resources, as a result of trampling or patchy removal of above-ground biomass (the spatial heterogeneity hypothesis) [
10]. Heterogeneous habitats are expected to contain a greater diversity of potential niches for species rather than habitats with more homogeneous conditions [
11], and environmental heterogeneity has been shown to promote fine-scale species diversity in grassland communities (e.g., [
3,
6]). Plant species richness (SR) is regarded as an important ecosystem characteristic [
2] and may also provide an indication of ecosystem health and resilience [
12]. Whereas data on the numbers of species (SR) recorded within a particular sample or habitat are important in conservation planning, diversity indices that account for both the number of species present and the abundance of each species (e.g., the inverse Simpson’s diversity index, iSDI) are often preferred in ecological studies because it is assumed that the most dominant species are likely to contribute most to processes within local communities [
13]. Species diversity indices, such as SR and iSDI, are usually estimated on the basis of standardized field sampling or ground surveys, and the fact that detailed field inventories are time-consuming may limit the spatial extent of diversity surveys. Remote sensing techniques have the potential to play a valuable supporting role in the mapping of plant species diversity, and in the identification of habitat patches that may be of conservation interest [
14] if, for example, spectral data correlate with species diversity or with vegetation properties that are associated with species diversity (
cf. [
15]).
Nagendra [
16] identified three categories of methods for the assessment of species diversity using remotely sensed data: (1) mapping individual organisms or communities; (2) mapping habitat characteristics that are expected to be associated with species diversity; and (3) modeling-based methods by which species diversity is predicted from the direct relationship between spectral data and field-based measures of species diversity. Modeling-based approaches have been shown to be successful in the prediction of fine-scale plant species diversity using remote sensing data acquired with the help of hyperspectral sensors (sensors that collect data in many narrow and contiguous spectral bands) within a range of different grassland habitats and geographic regions [
17,
18,
19]. The direct relationship between hyperspectral data and species diversity has also been examined using measures of the spatial variation of remotely sensed data (hereafter referred to as spectral heterogeneity). The spectral heterogeneity is expected to be associated with the environmental heterogeneity (the spectral variation hypothesis (SVH); [
20]), and can, thus, be used as a proxy for species diversity (
cf. [
21]). Hyperspectral data have also been used, in combination with topographic data, for predicting plant distributions in French and Swiss alpine grasslands [
22]. To our knowledge, no studies have modeled the direct relationship between hyperspectral data and plant species diversity in northern European grasslands.
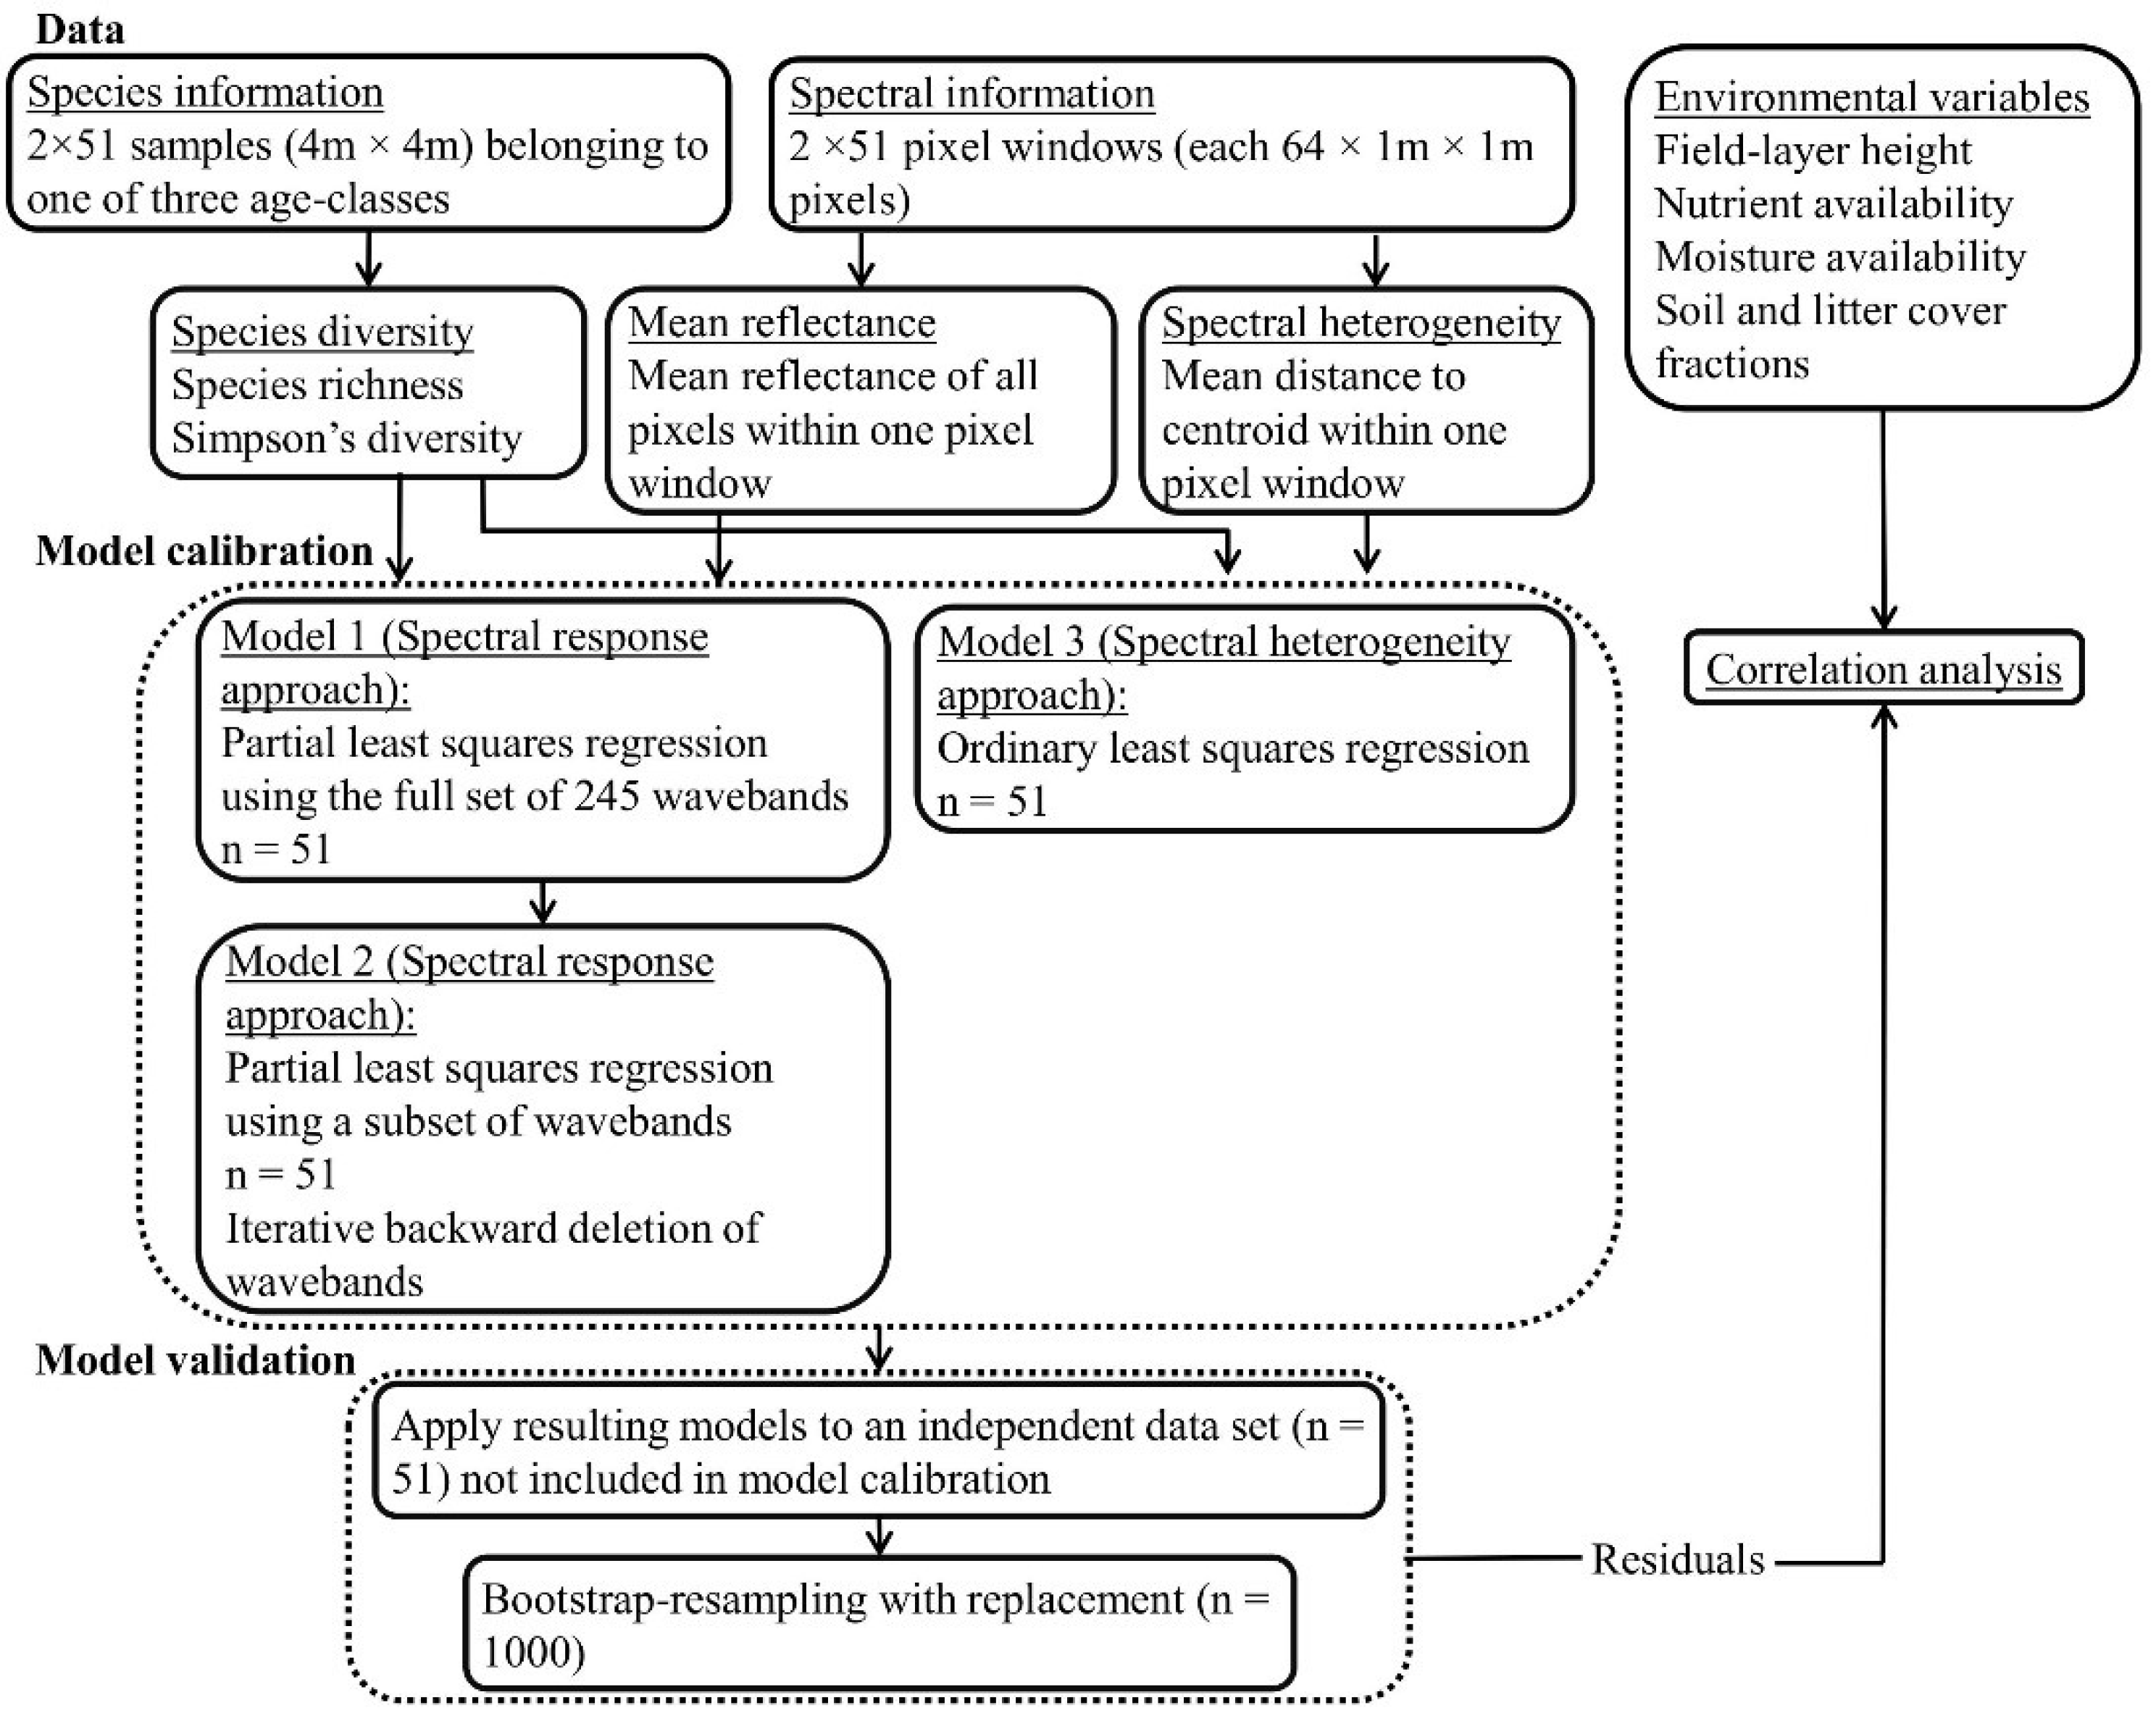
In the present study, we explore the ability of hyperspectral remote sensing technology to characterize fine-scale plant species diversity in dry, grazed grassland habitats in an agricultural landscape on the Baltic island of Öland (Sweden). We compare the performance of two modeling-based approaches to the prediction of species diversity in 4 m × 4 m plots, using data from airborne HySpex hyperspectral imagers (415–2345 nm). We ask the following questions: can hyperspectral data be used to predict the SR and iSDI in dry grazed grasslands via the direct relationship between reflectance data and field-based measures of plant species diversity using (1) an analysis of reflectance, based on information from (i) all wavebands; and (ii) a subset of wavebands, analyzed with a partial least squares regression model (hereafter referred to as the spectral response approach); and (2) an analysis of spectral heterogeneity, based on the mean distance to the spectral centroid in an ordinary least squares regression model (hereafter referred to as the spectral heterogeneity approach)? We also investigate whether the possible relationship between hyperspectral data and species diversity is influenced by environmental conditions (grazing continuity, nutrient and moisture status, field-layer height, and soil- and litter-cover fractions).
3. Results
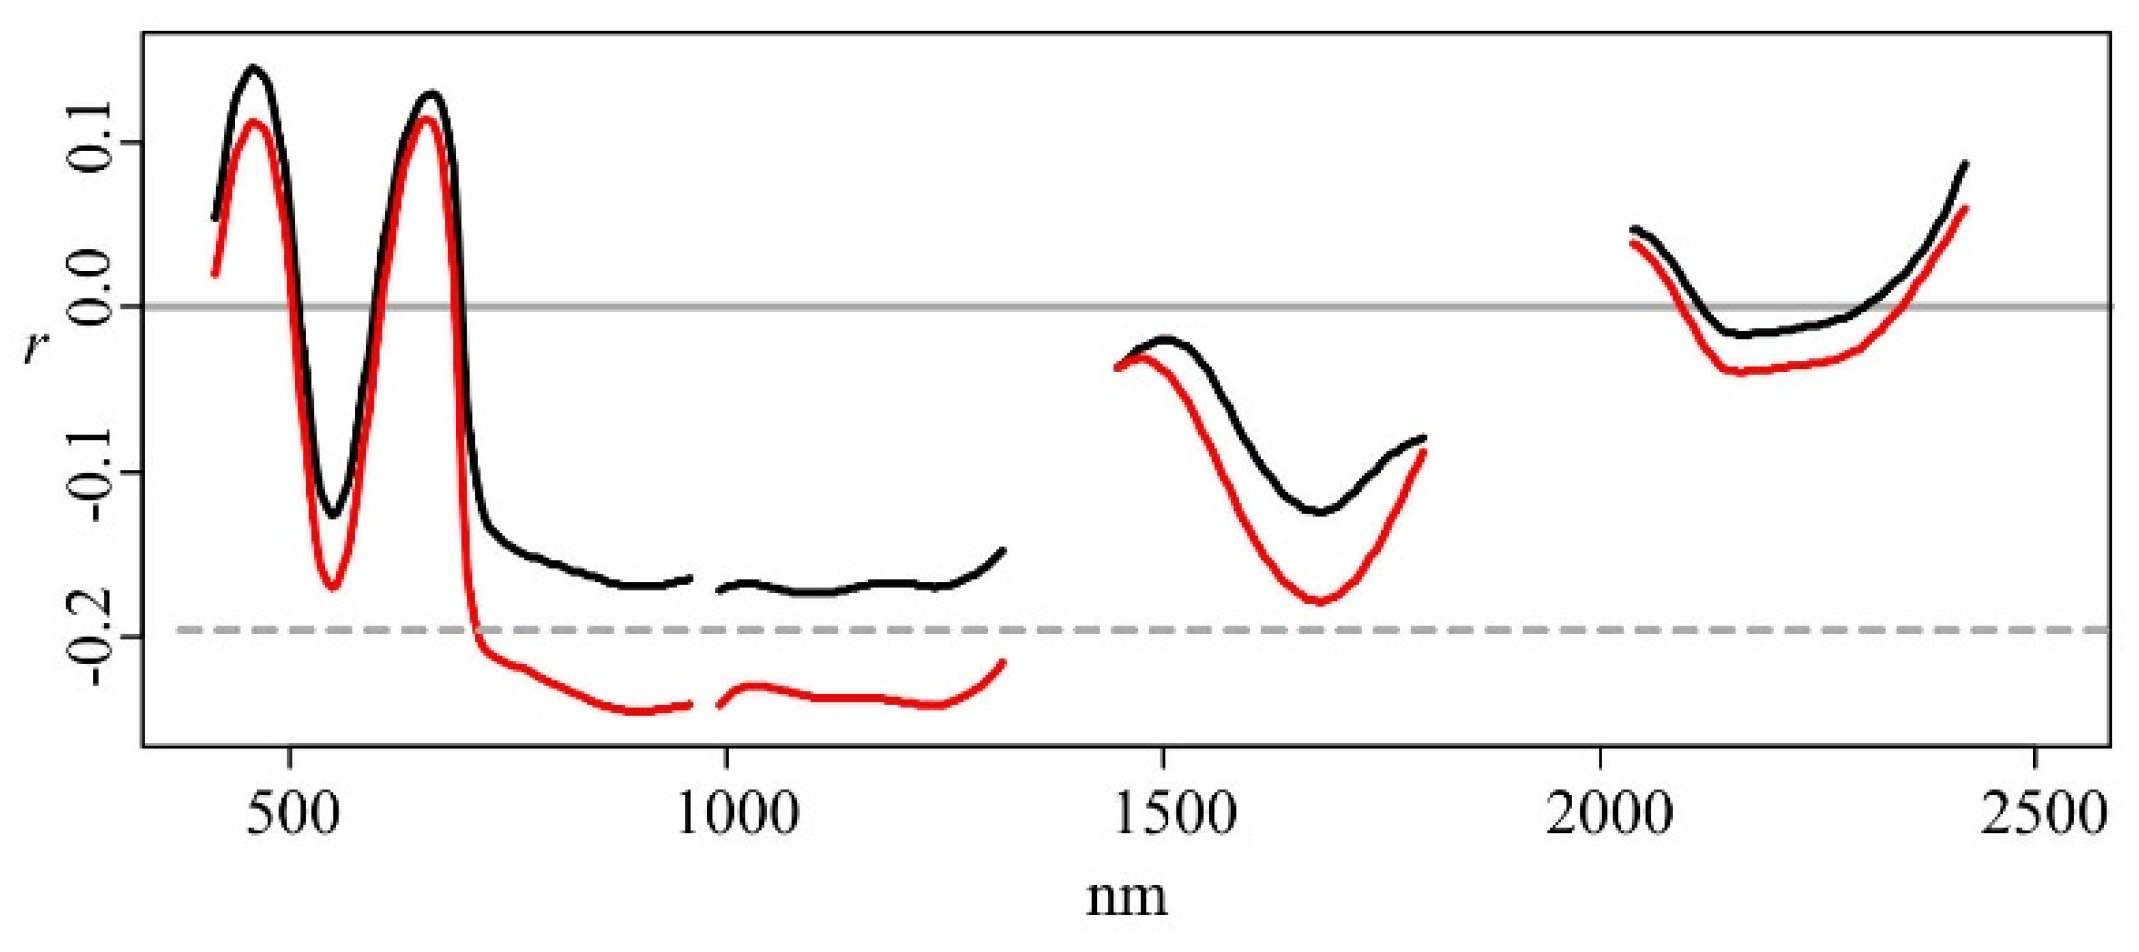
The summary statistics for the dependent variables for the plots within each grassland age-class (young, intermediate-aged, and old grasslands) are presented in in
Table A3. The Pearson’s correlation coefficients between the ln(SR) and the iSDI were significant for both the calibration (
r = 0.98,
p < 0.001) and validation subsets (
r = 0.97,
p < 0.001). There were significant negative correlations (
p < 0.05) between the reflectance associated with wavebands in the near-infrared (758–1316 nm) (NIR) part of the electromagnetic spectrum and the ln(SR) (
Figure 3). There were positive but non-significant correlations between the reflectance at wavebands in the blue (415–499 nm) and red (602–752 nm) parts of the spectrum and the dependent variables, and (non-significant) negative correlations between the reflectance at wavebands in the green (505–595 nm) and SWIR (1502–2345 nm) parts of the spectrum and the dependent variables (
Figure 3).
Figure 3.
Pearson’s correlation coefficients (r) between single wavebands and the species richness ln(SR) (red), and the inverse Simpson’s diversity index iSDI (black) for the whole data set (n = 102). Correlations below the dotted line are significant (p < 0.05).
Figure 3.
Pearson’s correlation coefficients (r) between single wavebands and the species richness ln(SR) (red), and the inverse Simpson’s diversity index iSDI (black) for the whole data set (n = 102). Correlations below the dotted line are significant (p < 0.05).
3.1. Spectral Reflectance—Models 1 and 2 (Spectral Response Approach)
3.1.1. PLSR Using the Full Set of 245 HySpex Wavebands—Model 1
The inclusion of seven LVs gave the first local minimum absolute aRMSE
CV in the PLSR model developed from the calibration subset (Model 1;
Figure 2), for both the ln(SR) (aRMSE
CV = 0.34) and the iSDI (aRMSE
CV = 8.87) (
Table 1).
Table 1.
Summary of the ability of PLSR models, based on spectral reflectance using the full set of wavebands (Model 1) or a subset of wavebands (Model 2), to predict the species richness (ln(SR)) and the inverse Simpson’s diversity index (iSDI). The cross-validated error of the calibration models (n = 51) is indicated by the absolute (aRMSECV) and normalized RMSECV (nRMSECV, %). LV indicates the number of latent variables used in the PLSR models. The absolute and normalized prediction errors (aRMSEP, nRMSEP (%)) indicate the ability of the model to predict the observed species diversity measure. The squared correlation (R2P) indicates the fit between the predicted and observed diversity values from the validation subset (n = 51).
| | | aRMSECV | nRMSECV | LV | aRMSEP | nRMSEP | R2P | No. of Wavebands |
|---|
| ln(SR) | Model 1 | 0.34 | 21% | 7 | 0.29 | 19% | 0.43 | 245 |
| Model 2 | 0.37 | 23% | 5 | 0.34 | 22% | 0.19 | 25 |
| iSDI | Model 1 | 8.87 | 23% | 7 | 6.77 | 20% | 0.45 | 245 |
| Model 2 | 9.29 | 25% | 4 | 7.07 | 21% | 0.40 | 35 |
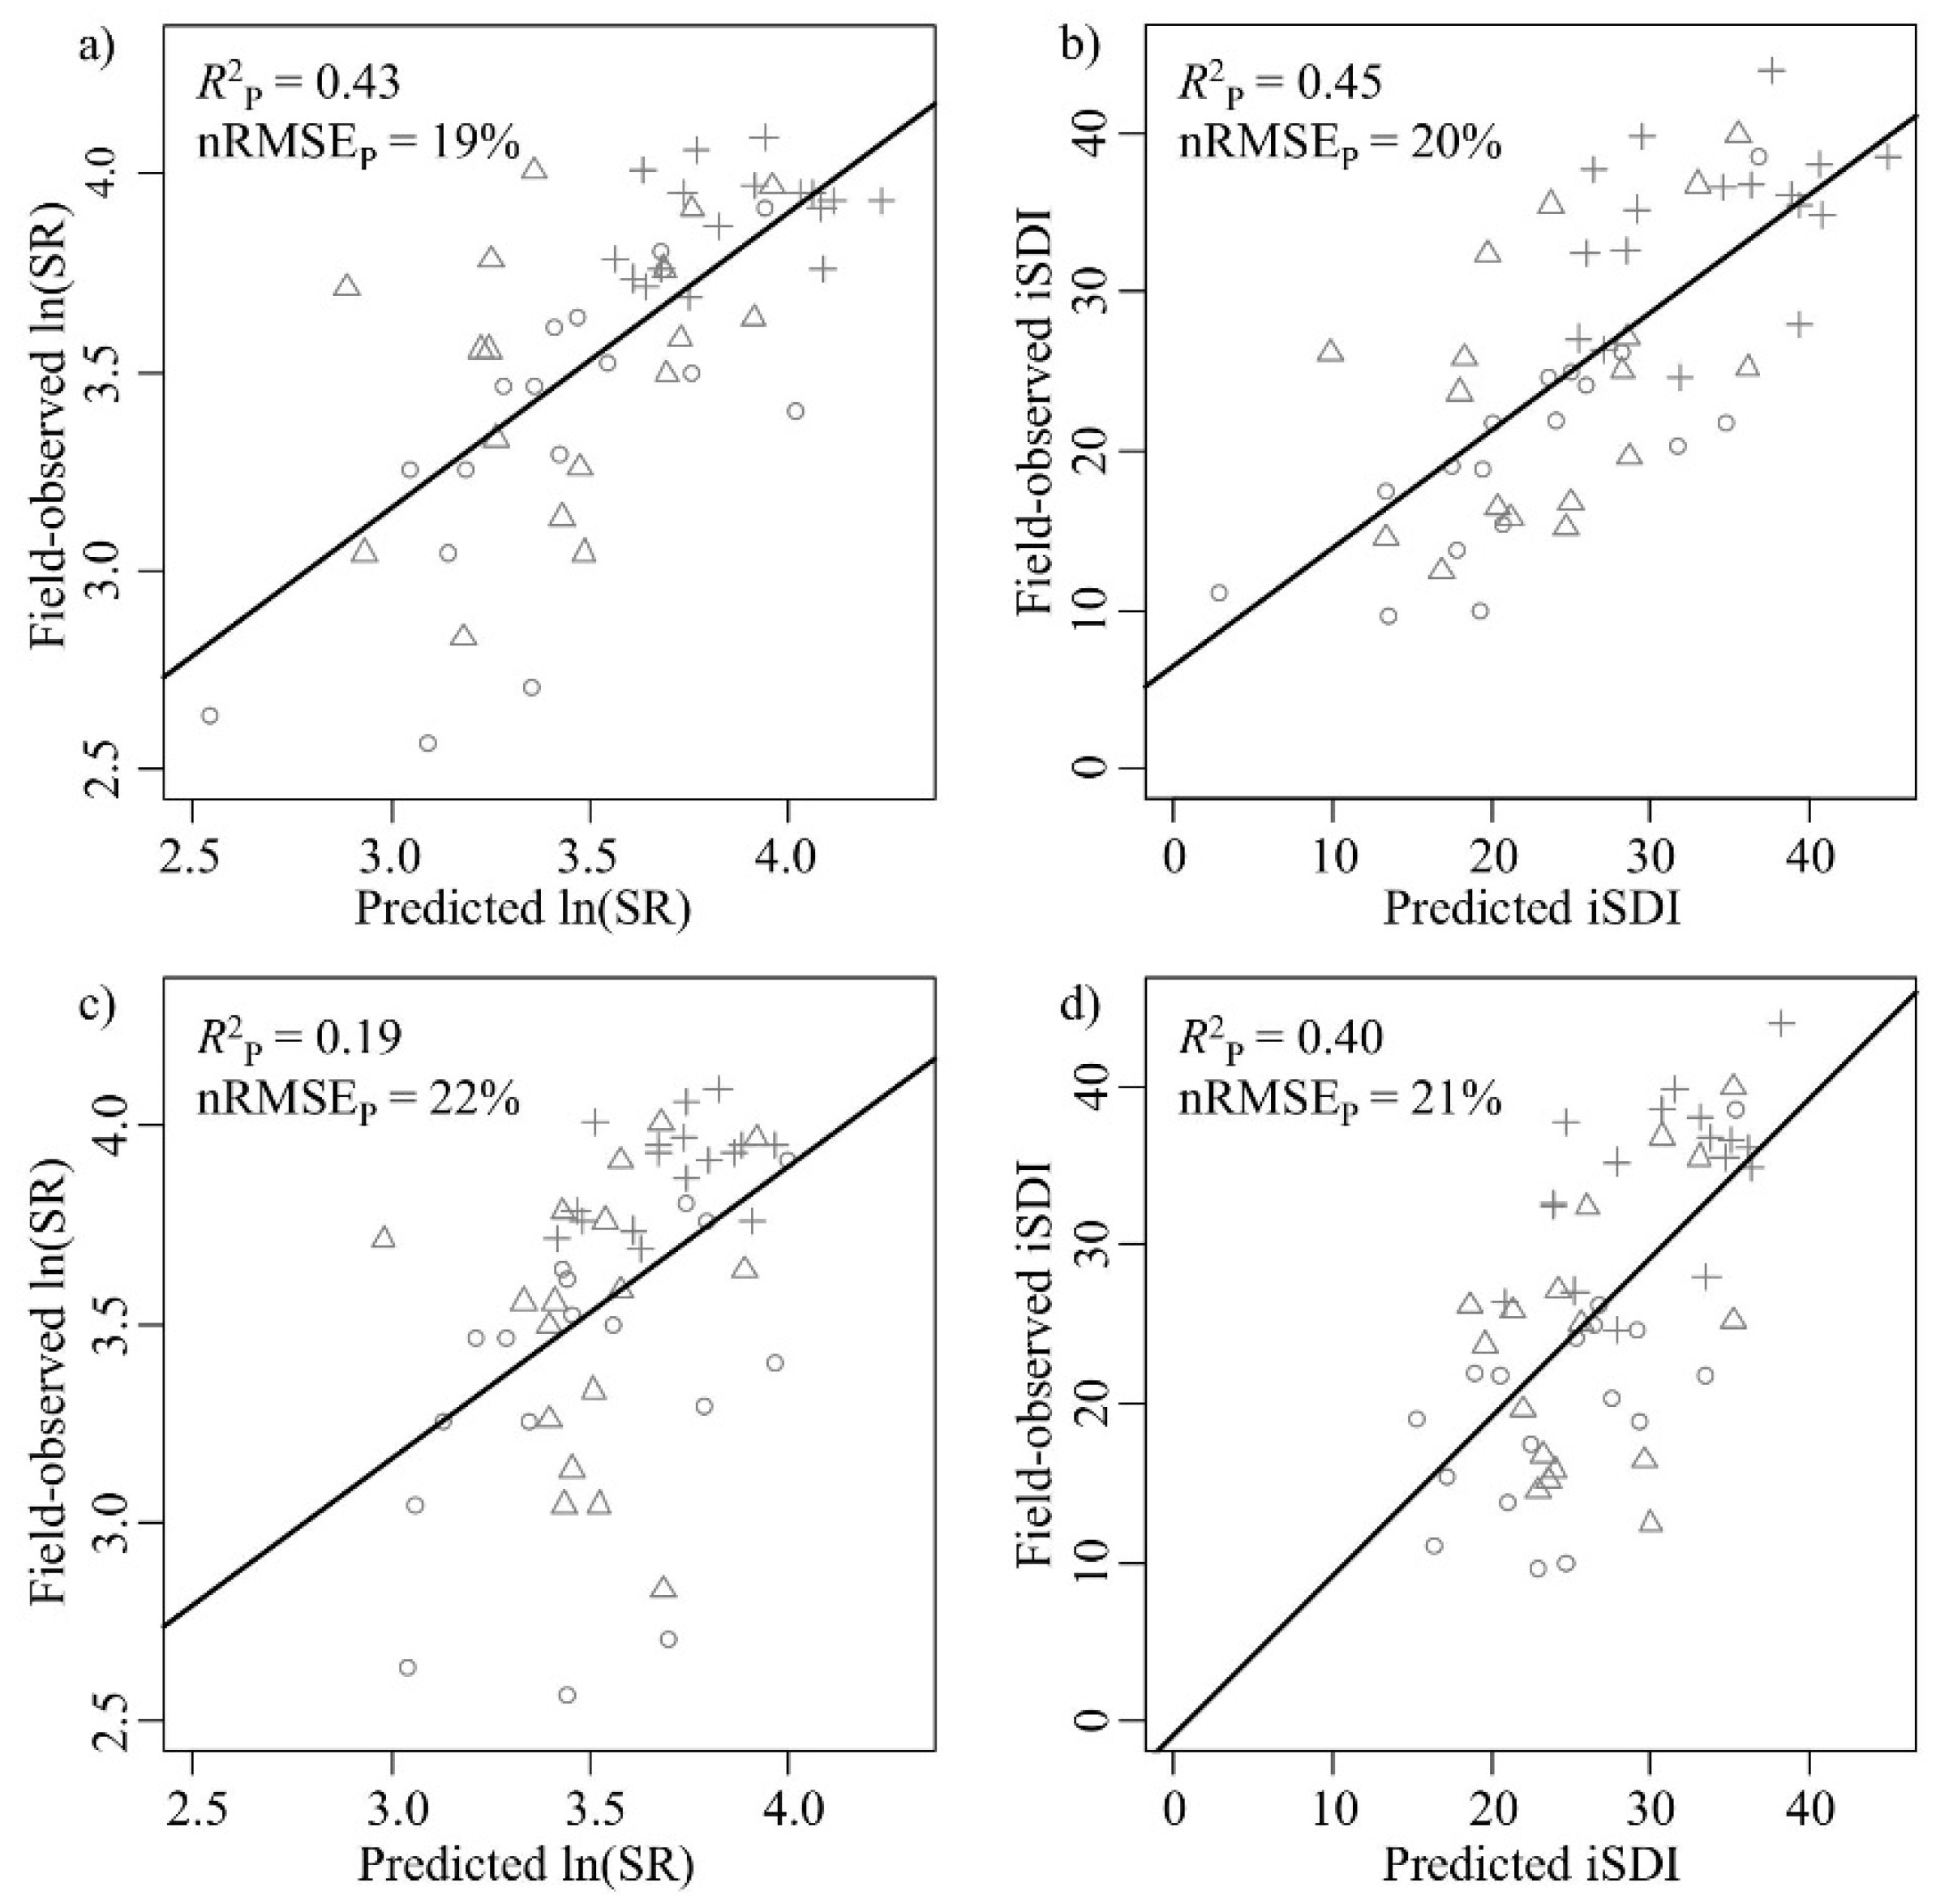
The correlations between the field-observed and predicted measures of species diversity were significant for both the ln(SR) (
R2P = 0.43,
p < 0.001) and the iSDI (
R2P = 0.45,
p < 0.001) (
Table 1,
Figure 4a,b). The nRMSE
P values were approximately 20% for both the ln(SR) (nRMSE
P = 19%) and the iSDI (nRMSE
P = 20%) (
Table 1,
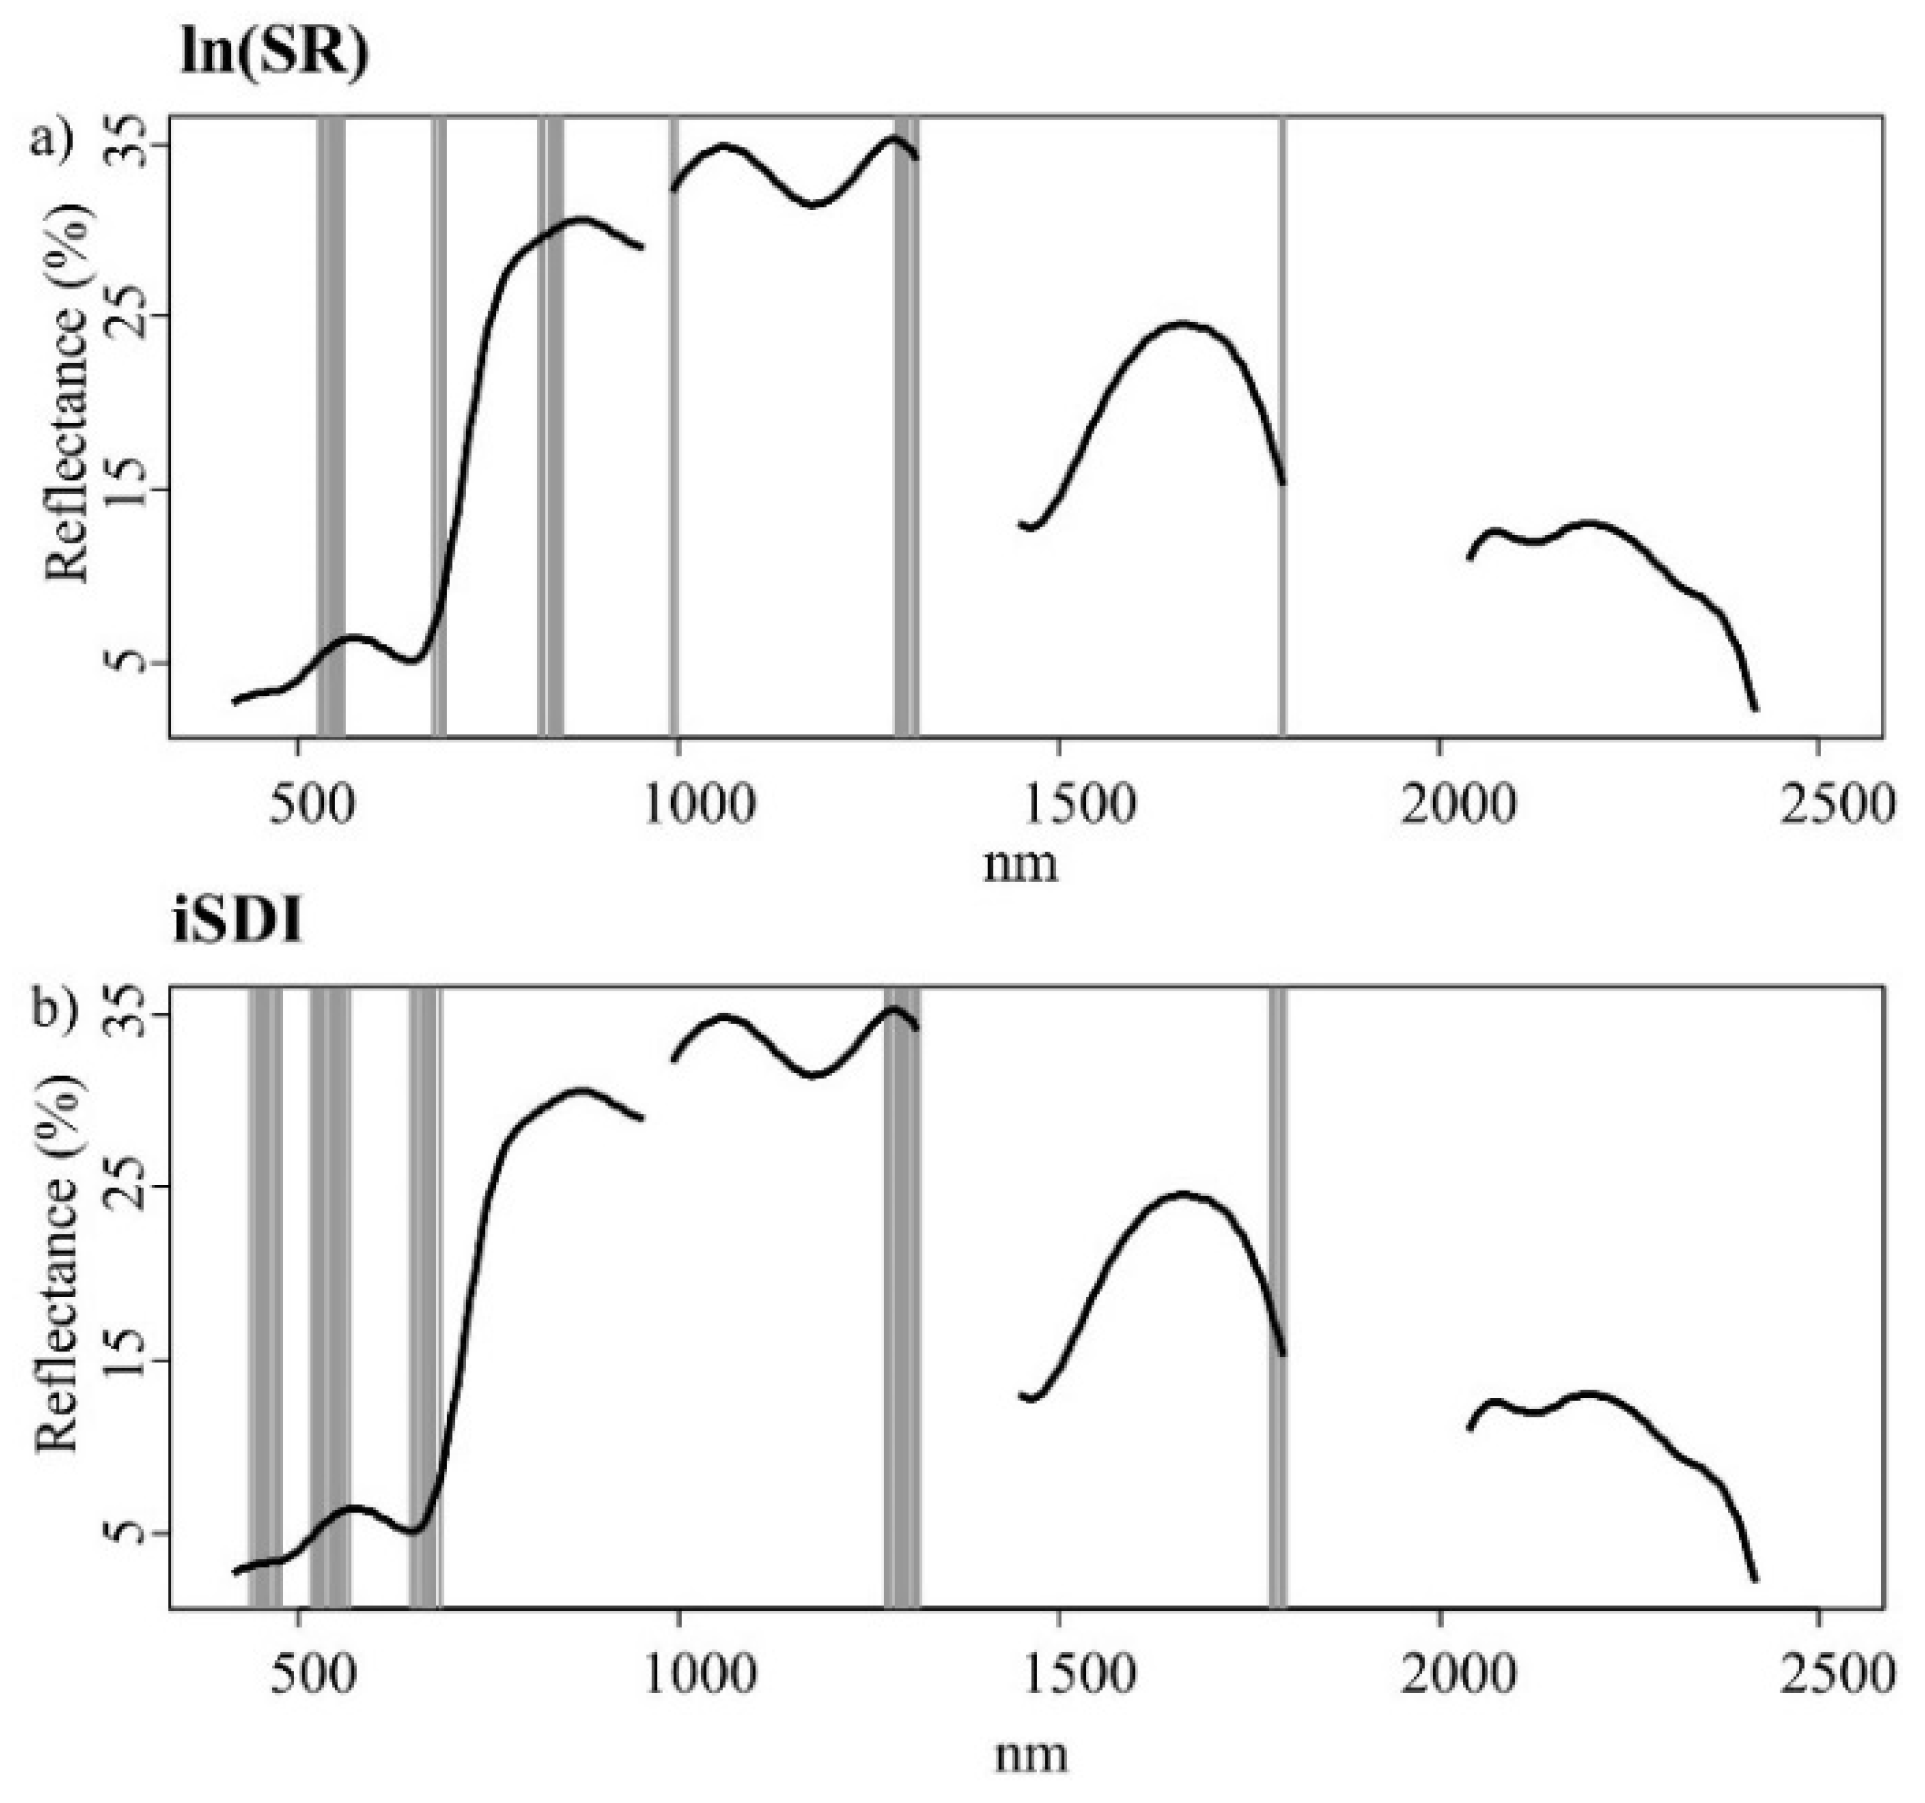
Figure 4a,b). Out of the 245 wavebands used in Model 1, 25 bands were most important for the prediction of the ln(SR) (
Figure 5a,
Table A4), while 35 bands were most important for the prediction of the iSDI (
Figure 5b,
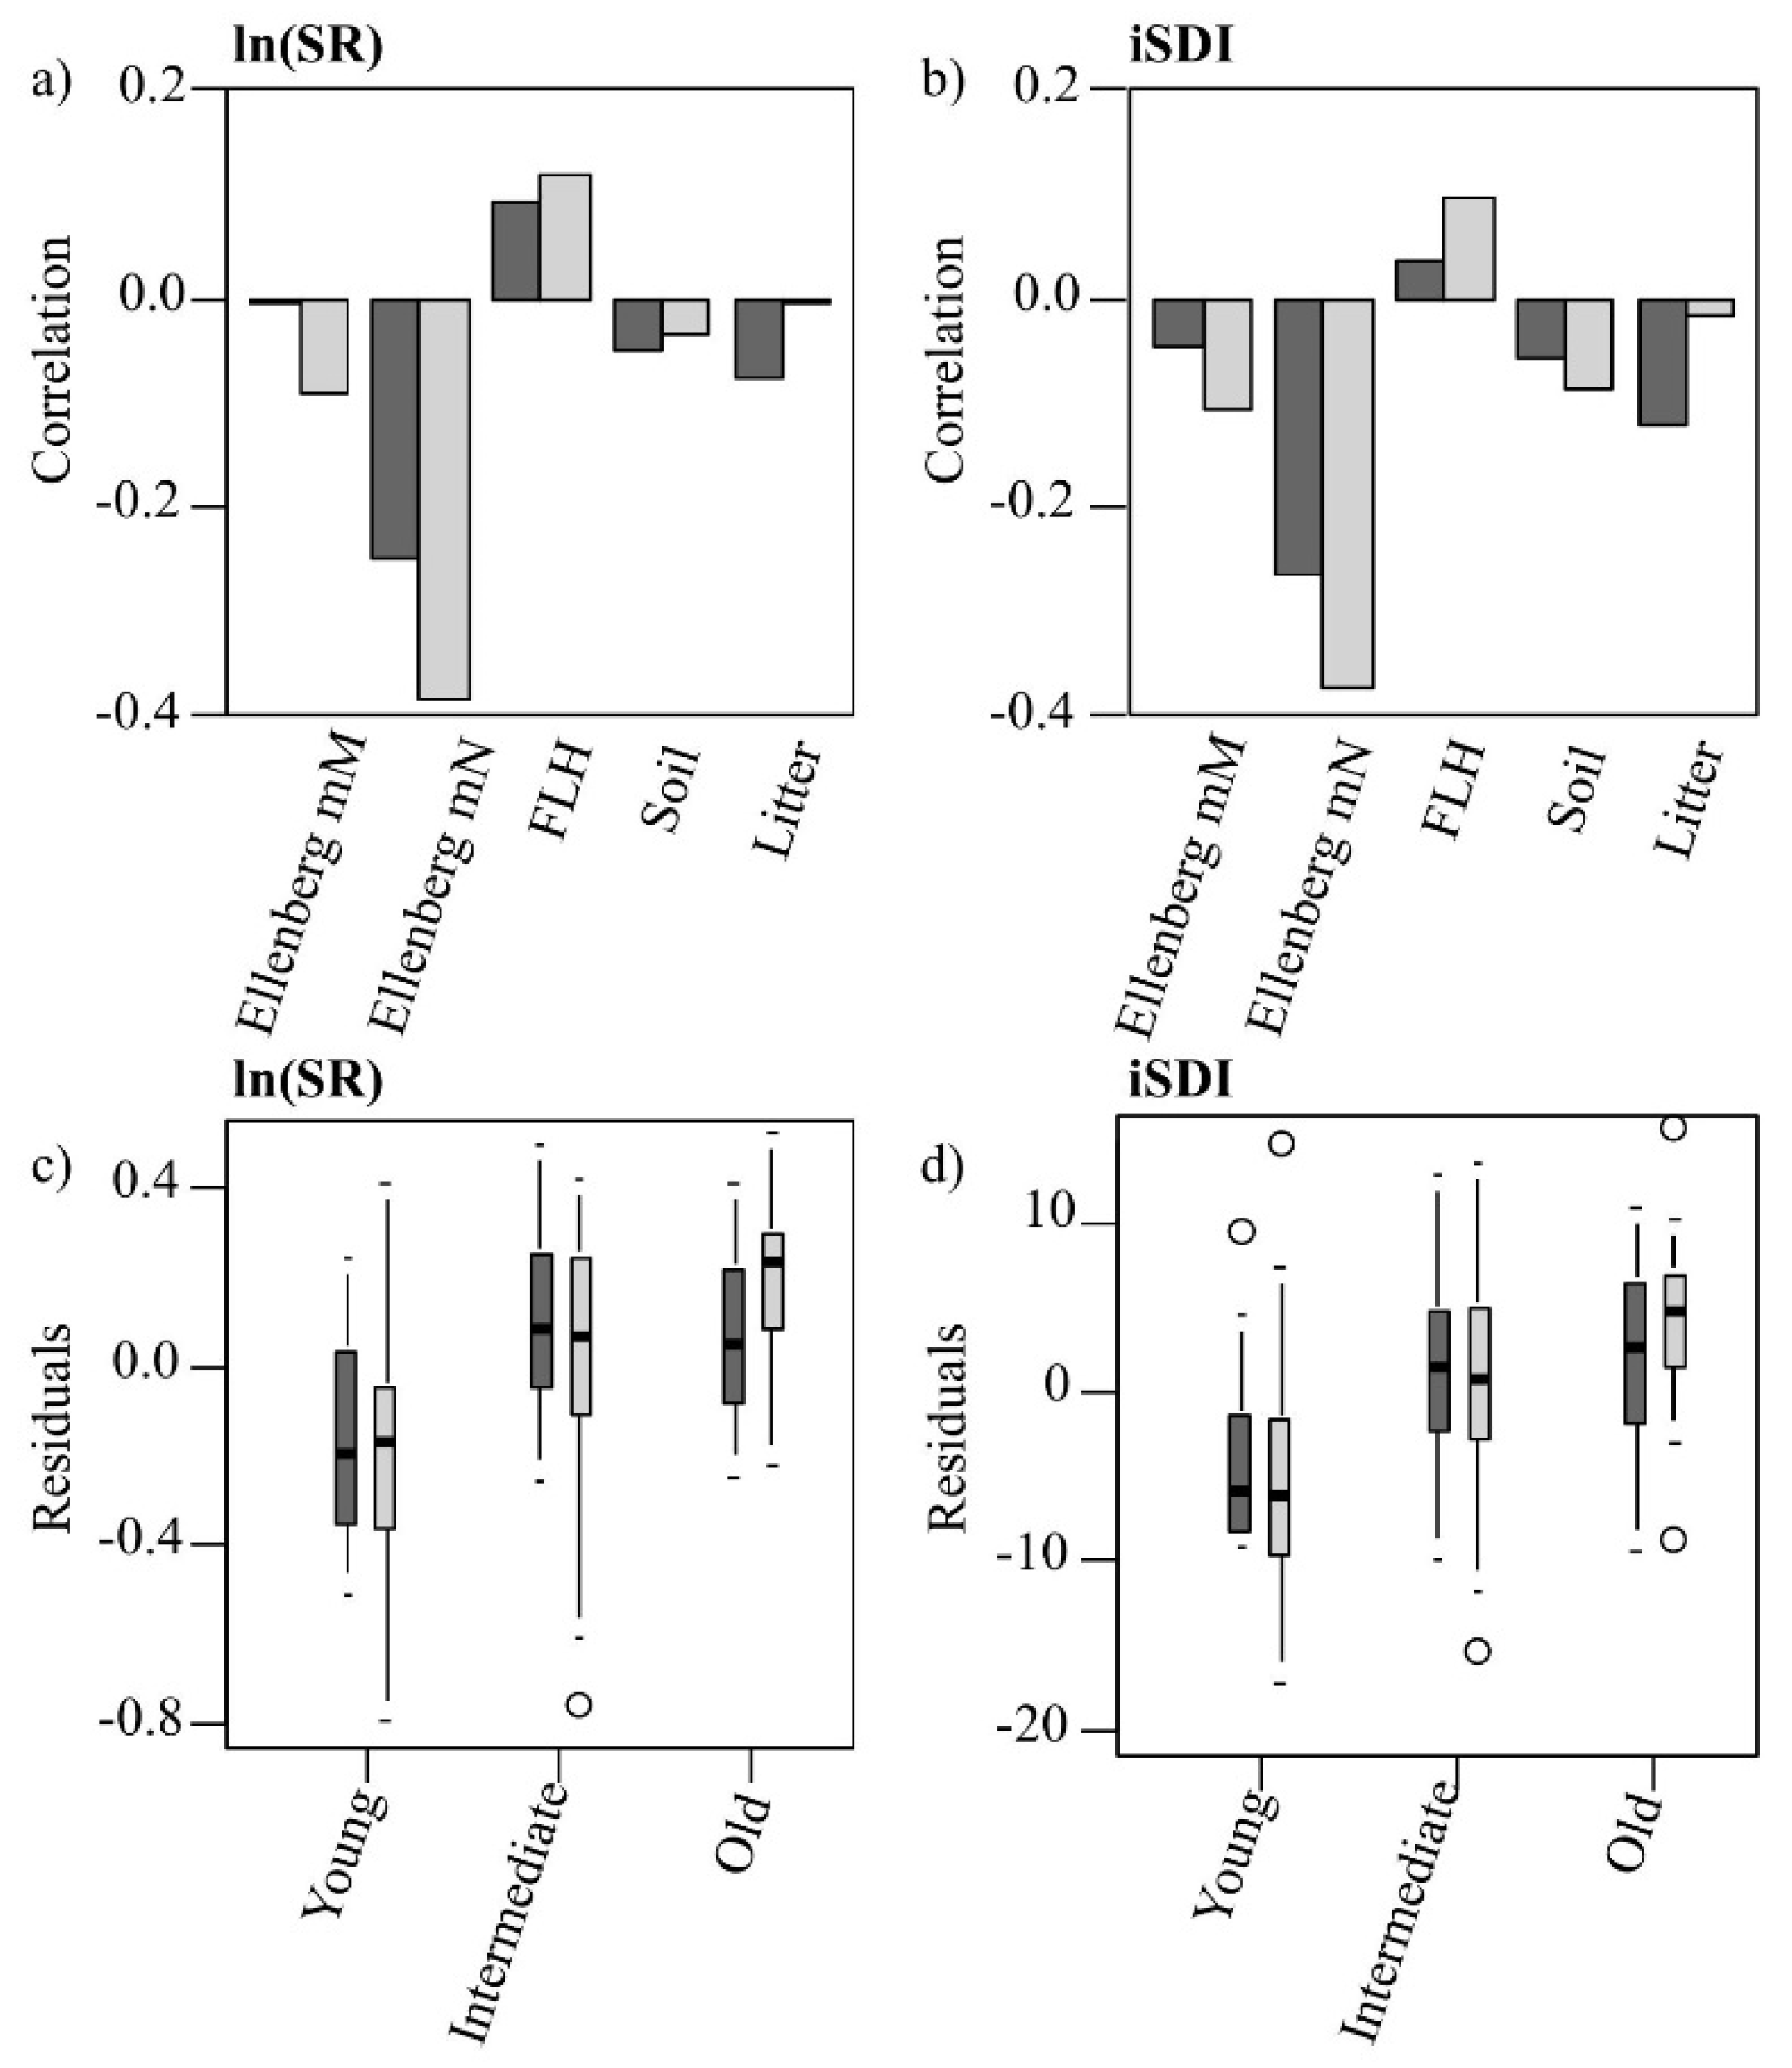
Table A4). The relationships between the residuals associated with the prediction of both dependent variables (using Model 1) and the values for individual environmental variables (Ellenberg mN and mM, field-layer height, and soil- and litter-cover fractions) were non-significant (
Figure 6a,b). There were significant (
p < 0.05), positive associations between the residuals (in the prediction of both the ln(SR) and the iSDI) and the grassland age: the shorter the grazing continuity of the grassland, the more the values for ln(SR) and iSDI were overestimated (negative residuals) (
Figure 6c,d).
Figure 4.
Correlations between field-observed and predicted (left column) species richness (ln(SR)) and (right column) inverse Simpson’s diversity (iSDI) for the validation subset (n = 51). (a,b) show the field-observed versus the predicted correlations for the PLSR model based on the full set of wavebands (Model 1) (n = 245); (c,d) show the field-observed versus the predicted correlations for the model based on a subset of wavebands (Model 2) (n = 25 (for ln(SR)) or 35 (for iSDI)). The normalized prediction error (nRMSEP, %) indicates the quality of the model in predicting the observed species diversity measure, and the squared correlation (R2P) indicates the fit between the predicted and observed diversity value. The age-class of the grassland plots is also displayed (key: ○ young, ∆ intermediate, and + old). Black lines indicate the relationship between the predicted and the measured values.
Figure 5.
Important wavebands (grey bars) selected with the help of an iterative variable deletion procedure, for estimating (a) the species richness (ln(SR)) and (b) the inverse Simpson’s diversity index (iSDI) in grassland plots using the calibration subset (n = 51). The black line represents the mean spectral reflectance curve for grassland plots in the whole data set (n = 102).
Figure 6.
(a,b) Pearson’s correlation coefficients of the residuals of the PLSR models’ (Model 1 = dark; Model 2 = light) predictions of (a) the species richness (ln(SR)) and (b) the inverse Simpson’s diversity index (iSDI) with different environmental variables (moisture availability, Ellenberg mM; nutrient availability, Ellenberg mN; field-layer height, FLH; cover of bare ground, Bare ground; and cover of litter, Litter); (c,d) Distribution of the residuals of (c) the species richness (ln(SR)) and (d) the inverse Simpson’s diversity index (iSDI), within the three grassland age-classes, predicted by Model 1 (dark) and Model 2 (light).
3.1.2. PLSR Using the Subset of HySpex Wavebands—Model 2
Using the subsets of HySpex wavebands (Model 2;
Figure 2), the inclusion of five LVs gave the first local minimum aRMSE
CV in the PLSR model for ln(SR) (aRMSE
CV = 0.37) (
Table 1). For the prediction of iSDI, the inclusion of four LVs gave the first minimum aRMSE
CV (aRMSE
CV = 9.29) (
Table 1). The correlations between the field-observed and predicted measures of plant diversity for the validation subset were significant for ln(SR) (
R2P = 0.19,
p < 0.001) and iSDI (
R2P = 0.40,
p < 0.001) (
Table 1,
Figure 4c,d). The nRMSE
P values were above 20% for ln(SR) (nRMSE
P = 22%) and iSDI (nRMSE
P = 21%) (
Table 1,
Figure 4c,d). In the Model 2 approach, there were significant negative correlations (
p < 0.05) between the residuals (associated with the prediction of ln(SR) and iSDI) and the Ellenberg mN: the higher the Ellenberg mN, the more the values for ln(SR) and iSDI were overestimated (negative residuals) (
Figure 6a,b). There were also significant (
p < 0.05) associations between the residuals (in the prediction of ln(SR) and iSDI) and the grassland age: the shorter the grazing continuity of the grassland, the more the values for ln(SR) and iSDI were overestimated (negative residuals) (
Figure 6c,d).
3.1.3. The Robustness of the Prediction Models (Models 1 and 2)
The bootstrapping procedure revealed that the mean
R2P were higher and the mean nRMSE
P were lower when using the PLSR-based models developed from the full set of bands (Model 1) than when using the models developed from the subset of bands (Model 2) to predict both the dependent variables (
Table 2).
Table 2.
Bootstrap results showing the ability of the PLSR models based on the spectral reflectance in the full set of wavebands (Model 1) and the subset of wavebands (Model 2) to predict the species richness (ln(SR)) and the inverse Simpson’s diversity index (iSDI). Mean R2P and mean nRMSEP (%) are the average squared correlation coefficients and normalized prediction errors for the validation subset, based on 1000 bootstraps. The 95% confidence limit indicates the upper and lower confidence intervals of the mean values.
| | | Mean R2P | 95% Confidence Limit | Mean nRMSEP | 95% Confidence Limit |
|---|
| ln(SR) | Model 1 | 0.39 | ±0.010 | 20% | ±0.1% |
| Model 2 | 0.17 | ±0.009 | 23% | ±0.1% |
| iSDI | Model 1 | 0.43 | ±0.008 | 21% | ±0.1% |
| Model 2 | 0.38 | ±0.007 | 22% | ±0.1% |
3.2. Linear Regression Based on Spectral Heterogeneity—Model 3 (Spectral Heterogeneity Approach)
When the regression models (Model 3;
Figure 2) developed from the calibration subset using the spectral heterogeneity approach were applied to the validation subsets, the results showed non-significant relationships between both the field-observed and predicted SR (
R2 = 0.06,
p > 0.05) and the field-observed and predicted iSDI (
R2 = 0.04,
p > 0.05). The nRMSE
P values were above 30% for both ln(SR) (nRMSE
P = 31%) and iSDI (nRMSE
P = 35%).
5. Conclusions
The monitoring of biodiversity is regarded as a central task for nature conservation, and hyperspectral remote sensing has recently been identified as a method that has the potential to make a substantial contribution to the mapping of habitat and species diversity at local to regional scales [
68]. The present study presents a novel methodology for the assessment of fine-scale (4 m × 4 m) vascular plant species diversity in dry grasslands based on hyperspectral data obtained with the help of airborne spectrometers covering 414 to 2501 nm. We used two different approaches to evaluate the ability of hyperspectral measurements to predict fine-scale grassland species diversity (characterized with the help of the species richness (SR) and the inverse Simpson’s diversity index (iSDI)). The spectral response approach included information on reflectance based on (i) all wavebands (Model 1), and (ii) a subset of wavebands (Model 2), input into a partial least squares regression (PLSR) model. The spectral heterogeneity approach was based on the spectral variation hypothesis, and included an analysis of spectral variation, based on the mean distance to the spectral centroid, in an ordinary least squares regression model (Model 3).
Our study demonstrates that a spectral response approach using airborne hyperspectral data can be used to predict fine-scale species diversity in dry grasslands. The relationships between the field-observed and predicted measures of plant species diversity were significant for both the SR and the iSDI with a normalized root mean square error of approximately 20% for the predicted values of both the diversity indices. The PLSR-based approach allows a large number of hyperspectral wavebands to be compressed into a few latent variables (LVs) while decreasing the risk of model overfitting. Although the average prediction quality for both SR and iSDI was poorer for the Model 2 procedure than for the Model 1 procedure, the lower number of LVs in the Model 2 analyses indicated that the Model 2 analyses were more parsimonious. The prediction quality of the PLSR algorithm is dependent on the optimal selection of LVs used in the final prediction model. Although there are different ways of selecting LVs, there has been no systematic comparison of the performance of the different approaches. We suggest, therefore, that alternatives to the first-local-minimum rule—such as the total minimum cross-validated error or an overall F-test of the loss function [
53]—should be evaluated further in future studies. There was a negative correlation between the reflectance in the NIR spectral region and species diversity, indicating that the species diversity increased as the above-ground biomass decreased. Although the prediction errors of the two PLSR models derived from the spectral response approach are low for both the species diversity indices, a certain amount of variation within the predicted diversity indices remained unexplained in our study. We suggest that the unexplained variance in the predicted species diversity may, at least in part, result from between-site variation in grazing intensity (particularly in the younger grasslands on recently abandoned arable fields) that results in between-site differences in the amount of biomass.
The spectral heterogeneity approach, using spectral variability as a proxy for habitat heterogeneity, was unable to predict species diversity. Our results, together with results from earlier ecological studies [
65], suggest that the relevant scale for the investigation of the relationships between environmental heterogeneity and fine-scale grassland species diversity in our study system may be smaller than the 1 m × 1 m pixels used in the study. We suggest that future studies should examine a wide range of pixel sizes to identify the scale, or scales, at which a relationship between environmental heterogeneity and species diversity can be identified.
In the present study, we used remotely sensed data acquired at a single time-point in July. If leaf senescence in response to summer drought is associated with lowered levels of spectral variation within and between the grassland plots, then a multi-temporal approach might improve the ability to predict grassland species diversity with the help of remotely sensed data. The use of unmanned aerial vehicles (UAVs), which can provide high levels of both spatial and temporal resolution, is attracting increasing attention within the field of fine-scale remote sensing (e.g., [
44,
68]). Future studies should examine the potential use of UAVs to deliver improved spectral data that can be used in the assessment of grassland species diversity.


 ,
, 


