Editorial

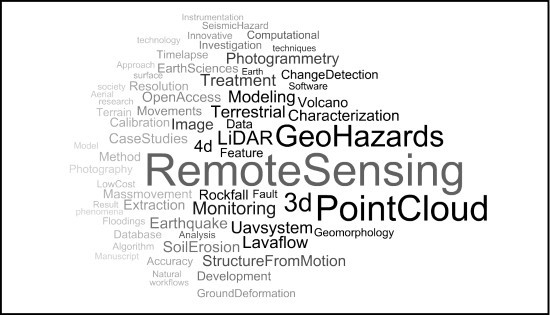
“Use of 3D Point Clouds in Geohazards” Special Issue: Current Challenges and Future Trends

Risk Analysis Group, Institute of Earth Sciences, University of Lausanne, CH-1015 Lausanne, Switzerland
*
Author to whom correspondence should be addressed.
Remote Sens. 2016, 8(2), 130; https://doi.org/10.3390/rs8020130
Submission received: 28 January 2016 / Accepted: 29 January 2016 / Published: 6 February 2016
(This article belongs to the Special Issue Use of LiDAR and 3D point clouds in Geohazards)

Graphical Abstract

1. Introduction

The fast proliferation of new satellite, aerial and terrestrial remote sensing techniques has undoubtedly provided new technological and scientific opportunities to society during the last few decades. Driven by this impressive technological progress together with the development of innovative data treatment techniques and the progressive adaptation of these workflows by geoscientists, the way we see, understand, and model the Earth’s surface processes has been greatly enhanced [1]. Three-dimensional survey techniques, such as LiDAR (or laser scanning) and photogrammetry, which can be mounted over fixed or mobile platforms, including Unmanned Aerial Vehicles (UAV), airborne, helicopter, vessel and others ways of transportation, are completely changing our perception of the surrounding environment [2]. Classical photogrammetric workflows are being progressively replaced by Structure-from-Motion (SfM) workflows imported from computer vision disciplines, allowing much higher versatility and usability by non-experts [3,4]. The output of these techniques—3D point clouds, i.e., high resolution three-dimensional sets of data points defined by X, Y and Z coordinates—are progressively being used in different branches of Earth sciences, including geomorphology, engineering geology, stratigraphy, tectonics, mining, etc. The use of more accurate and denser 3D information terrain surfaces is changing classical investigative approaches for natural phenomena at different spatial and temporal scales, including the mapping of geomorphic features [5], characterization of geological outcrop layers [6,7], investigation of topographic changes [8], identification of structural patterns, study of depositional forms [9], analysis of mass movements [10], and rock slope processes [11]. The investigation of a series of natural processes which may affect human activities and resulting in risk to society using three-dimensional techniques has also attracted special attention by researchers, technicians and policymakers. Several avenues of research have been opened with the development of new automatic or semi-automatic techniques for more advanced observation, monitoring, modelling and prediction of natural phenomena, considerably impacting our society.
This Special Issue contains a collection of articles discussing the use of three-dimensional remote sensing techniques for the investigation diverse geo-hazards. We received a total of 13 manuscripts for consideration, which were thoughtfully reviewed by external experts in their respective fields. In addition, the Guest Editors of this Special Issue carried out a complementary editorial review. As a result, five manuscripts were finally accepted. These five publications reflect a wide spectrum of different sensors covering topics of investigation techniques and analysis methods that can be used for characterizing and monitoring geo-hazards. Together with well-established LiDAR systems, fast evolving image processing techniques were also utilized in our Special Issue. Several submissions were related to the development of specific methods for data treatment, examples including the pre-processing of High Dynamic Range (HDR) imagery, the automatic extraction of rockfalls from multi-temporal LiDAR datasets and the treatment of massive amounts of geometrical data for carrying out efficient 4D monitoring. Several other contributions deal with the investigation of a given physical phenomena including slow-moving lava flows coming from recent volcanic eruptions [12], shear displacements due to historical earthquakes [13] and mass movements both on mountainous areas [14] and rocky cliffs [15,16]. A short review of each topic of investigation addressed in this Special Issue, including an overall context and main findings, is given below.

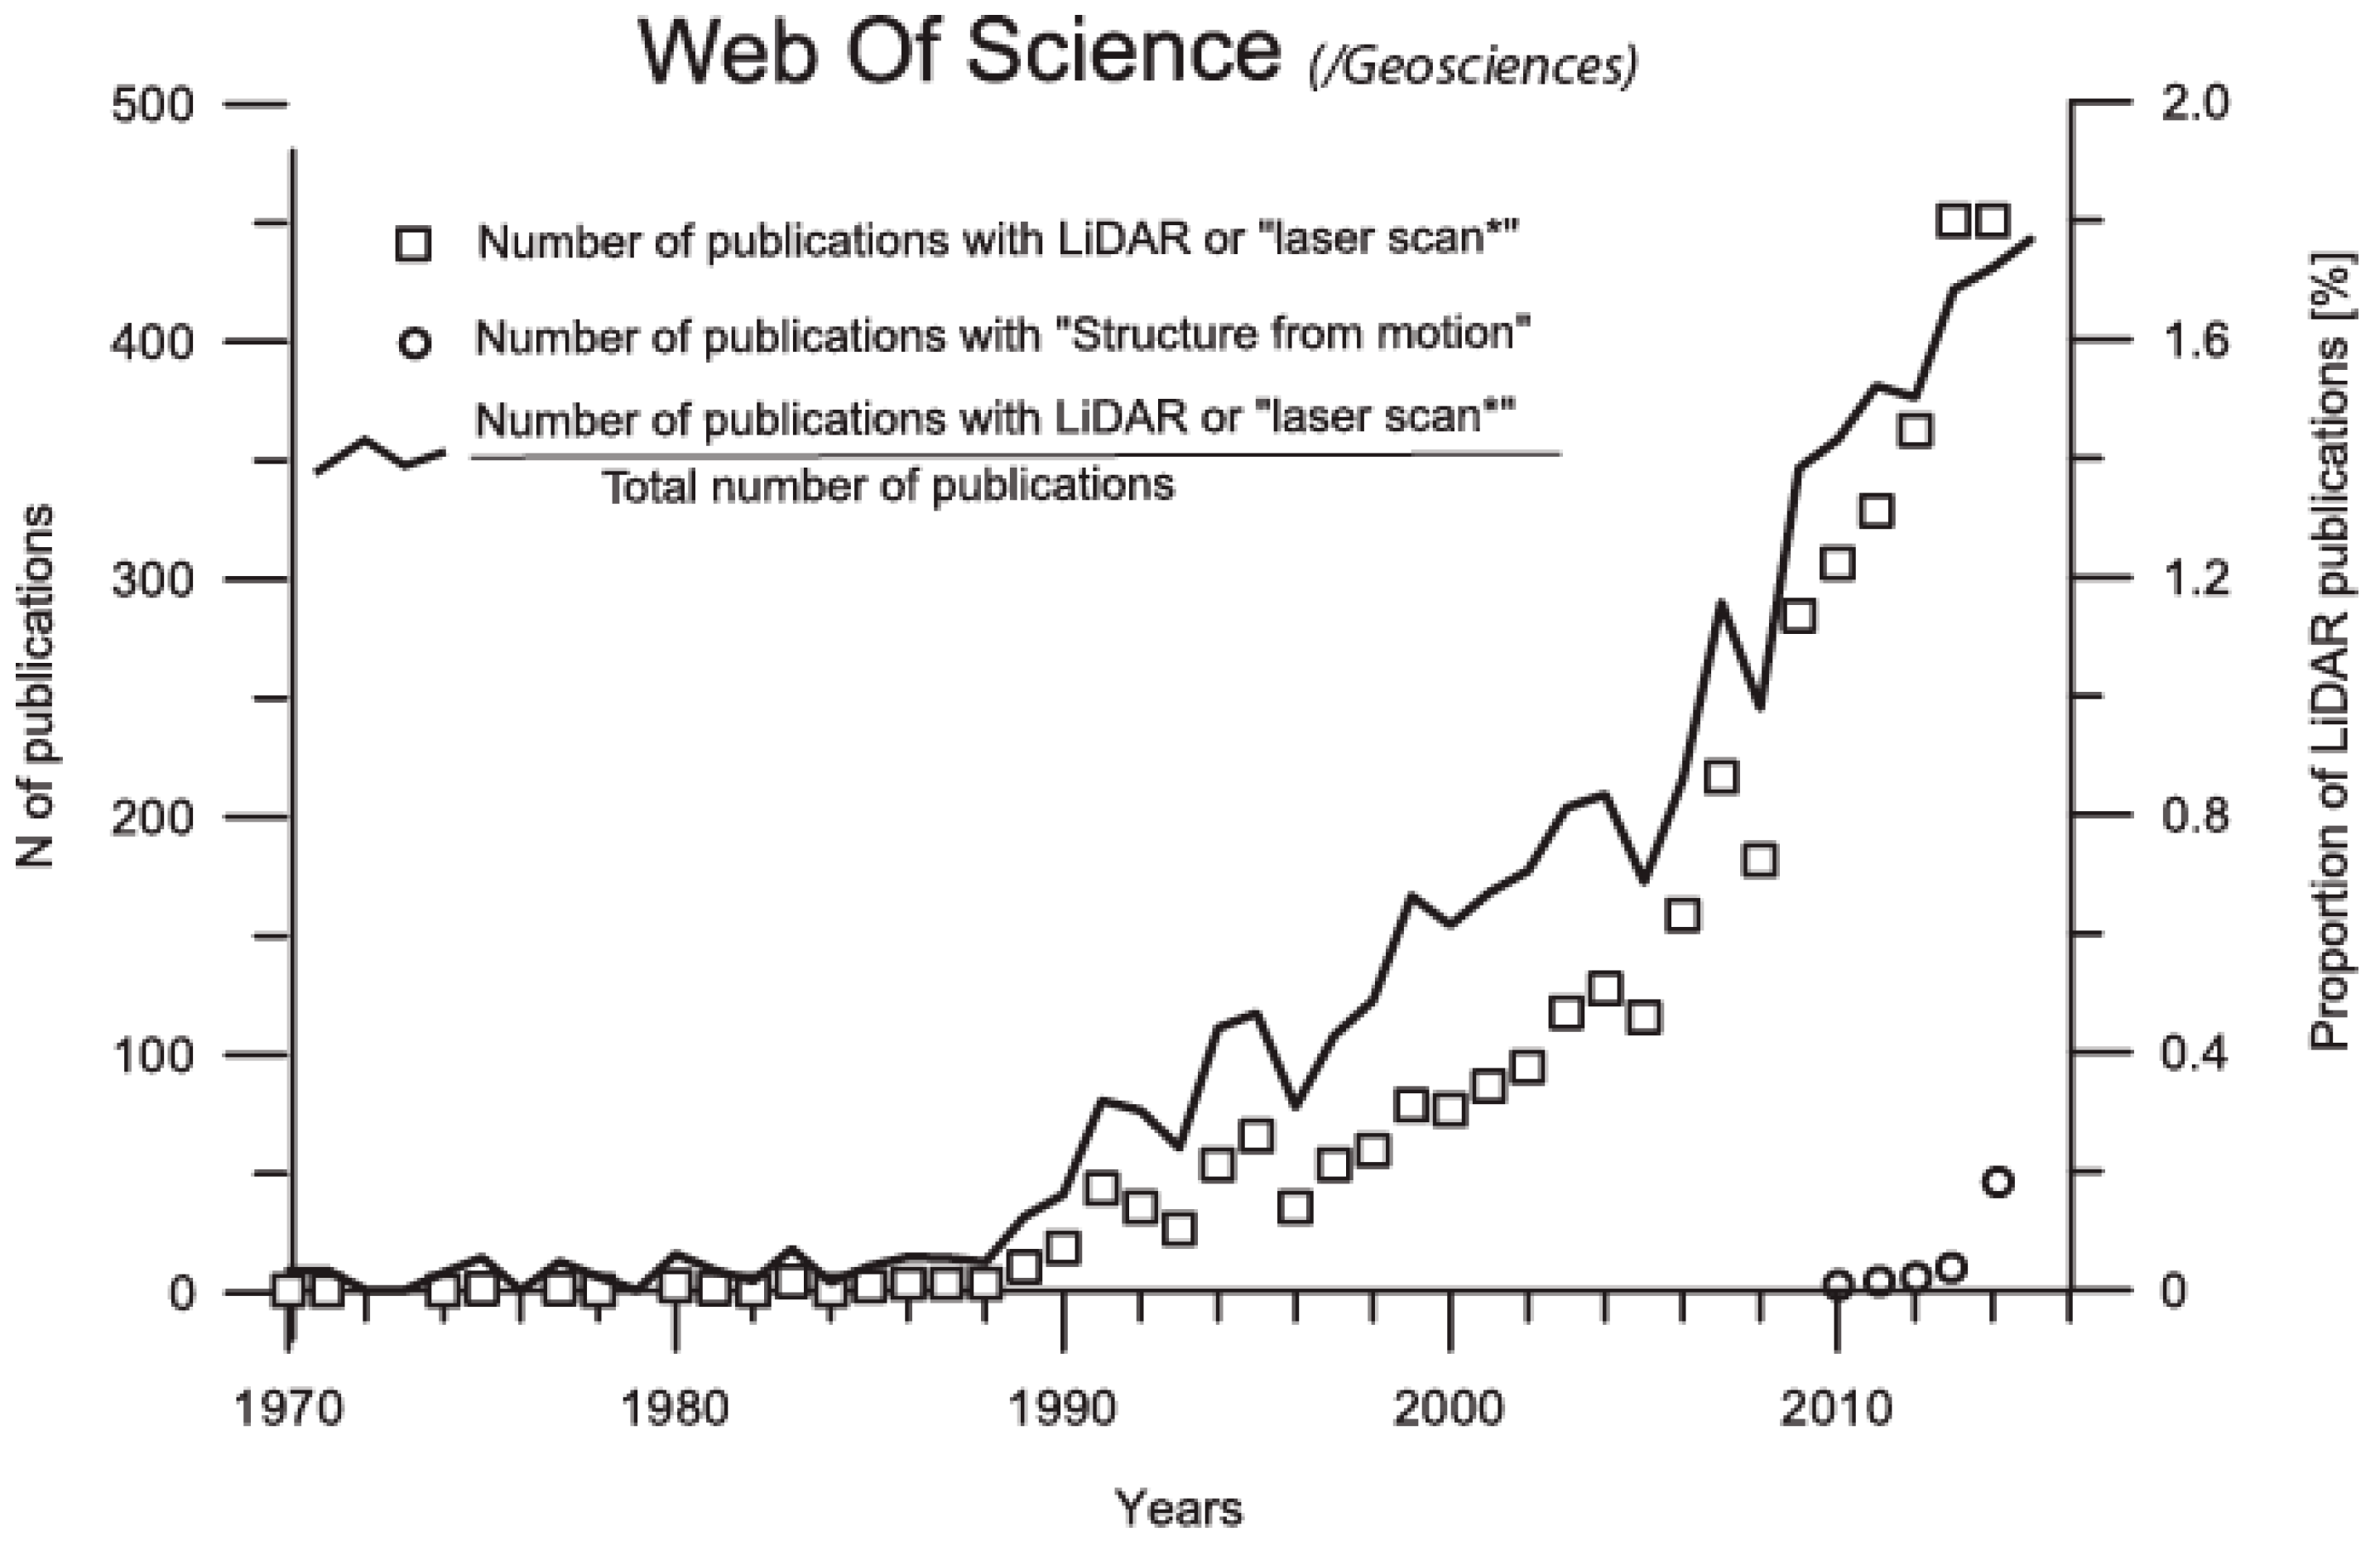
2. Use of 3D Remote Sensing Techniques by Geoscientists: A Bibliometric Analysis

The use of 3D point clouds for the investigation of Earth surface processes is now starting to be a well-established discipline. To show this, we carried out a bibliometric analysis on the occurrence of the terms “Structure from Motion” and “LiDAR” or “laser scan*” in Web of Sciences bibliographical database restricted to its Geosciences segment (Figure 1), in line with [17]. While it can be observed that the use of SfM term on geoscientific literature is very recent, the growth of the number of references related to laser scanning is exponential-like since the 90’s. However and according to [18], the global scientific output doubles every nine years, as observed in the Geosciences segment of the Web of Sciences database (12,540 records for 2000 and 21,445 records for 2010). That leads to the question whether the LiDAR literature is growing significantly faster than the rest of the geoscientific literature. To answer this question, the number of references related to laser scanning has been divided by the total number of references (both numbers restricted to the Geosciences segment of Web of Sciences). Figure 1 shows that the bibliographical impact of laser scanning studies is growing much faster the rest of geoscientific literature, and that very soon, if not already achieved, 2% of the geoscientific literature will be directly linked to LiDAR technologies.
Figure 1. Number of publications in the database Web of Sciences containing the terms “LiDAR” or “laser scan*” in the field TOPICS between 1970 and 2014. Analysis made on January 2016 and restricted to the “Geosciences-multidisciplinary” segment of Web of Science.
Remotesensing 08 00130 g001

3. Summary of the Special Issue Contributions

3.1. Studying Volcanic Features and Active Lava Flows

Using TLS for the investigation of volcanic processes is a challenging topic. Up to now, TLS has mainly been used for the investigation of dormant or quiescent volcanos, examples include the topographic modelling of volcanic cones [19], the 3D reconstruction of volcanic facies [20], the lithological discrimination based on backscattered intensity signals [21], the investigation of geomorphic changes [22] and other engineering geological applications [23]. The near real-time investigation of dynamic surface processes such as lava flows on active volcanoes constitute a great challenge nowadays. The article by Slatcher et al. [12] published in this Special Issue shows an impressive series of optical and laser measurements at Mount Etna during a volcanic eruption in summer 2012. TLS measurements were acquired at a high temporal frequency (1 scan every ten minutes), and were complemented by even more frequent time-lapse images acquired each 30 s. The thus-acquired point clouds were interpolated on a high resolution DEM, which were later analysed using conventional DEM subtraction techniques. In addition, instantaneous surface velocities were calculated through feature tracking using both user-supervised image analysis and automatic Particle Image Velocitymetry (PIV) technique [24]. Both volumetric fluxes and surface velocities were used for deriving lava rheology, discharge and average cone growth rate. Authors demonstrated how bi-dimensional methods for estimating discharge measurements from satellite images likely result in overestimates, supporting the great potential on the use of ground-based 3D remote sensing techniques in hazardous volcanic areas.

3.2. Monitoring Small Surface Changes Using Noise-Filtering Techniques

Up until very recently, the ability to detect terrain changes using TLS was mainly limited by the achievable accuracy (and resolution) of the input point clouds. While the comparison of multi-temporal datasets using standard point-to-point (or point-to-mesh) procedures does not allow the exploitation of the high data redundancy available on the input data, more elaborated approaches allow considerable reduction in the Level of Detection (LoD) [25,26,27]. For instance, authors in [25] showed that the characteristic noise locally follows a Gaussian population, allowing to correct the scattering of the TLS differences around the “correct” mean through filtering the point clouds differences in the spatial dimension. Few years later, authors in [26] developed the M3C2 algorithm based on the measurement of the mean surface change along the normal direction. This algorithm based on position averaging has gained a wide acceptance on the geomorphological community during the last years.
The article published in this Special Issue by Kromer et al. [15] goes one step further and takes advantage of point redundancy in space and time (4D) for denoising the point cloud by averaging the differences on several multi-temporal point clouds. These authors also utilise a slope-dependent vector of comparison in line with the M3C2 algorithm [26]. The proposed algorithm allow the significant reduction in the errors and a considerable improvement in the level of detection compared to other well-established monitoring techniques. When its application is possible, it yields feasible investigating sub-mm changes such as diffuse erosion or pre-failure deformation on complex rock-slopes. Due to the 4D nature of the algorithm, both spatial and temporal averaging is adaptable. This computationally efficient algorithm will undoubtedly change current approaches for continuous TLS scanning.

3.3. Rock Slope Monitoring and Automatic Rockfall Extraction

Extracting rockfall magnitudes, frequencies and locations from high resolution, multi-temporal 3D datasets has been a lively research subject during the last decade. Examples include the investigation of rocky cliffs shaped by sea erosion in the UK [28,29] and France [30], the investigation of fragmental rockfalls on mountainous areas [31,32,33,34] and the investigation of geohazards along transportation corridors throughout the world [35,36] etc. From a methodological point of view, most of the above mentioned work utilizes a 2.5D interpolative approach for DEM subtraction and for extracting the failure volumes by comparing multi-temporal data. Although most of the procedures recently developed for investigating landslides using 3D point clouds were based on TLS data, several procedures can also be used from photogrammetrically derived point clouds; nevertheless, the number of scientific articles using classical or modern photogrammetric workflows for investigating mass movements in rock slopes is still scarce.
The work presented in this Special Issue by Olsen et al. [16] utilized a 2.5D connected component algorithm for isolating individual failure clusters and for calculating the volume of each individual rockfall. Compared to other processing techniques using the original 3D point clouds (e.g., noise reduction and feature extraction, clustering of individual failures, automatic volume calculation have already been proposed [32,37]), Olsen and colleagues proposed an original technique for filling data gaps due to topographic obstructions on the interpolated mesh. Both the effects of hole filling and model resolution on their analysis were evaluated, authors observing that model resolution plays a key role in the capability to distinguish smaller rockfall events, which ultimately may have an important influence on the Magnitude-Frequency (MF) relationships. Using TLS to investigate rockslope hazards is starting to be a well-established discipline nowadays [10].

3.4. Detecting Earthquake Signals from Topographic Data

Quantifying the seismic hazard on a tectonically active area is not a difficult task always straightforward [38]; A well-stablished method for assessing the seismic hazard consists on the analysis of channel offsets and other morphotectonic features on the geomorphological record [39]. More recently, the use of high-resolution three-dimensional datasets is providing new perspectives for the quantification of these low amplitude features along both fast-moving and slow slip-rate faults [40,41,42]. Unfortunately, there was no standard methodologies to rate the quality of the lateral offsets up until very recently and a certain ambiguity could have affected these studies, as was pointed out by Ferrater et al. [13], in this Special Issue. These authors present a novel methodology for scoring lateral offsets: the Cumulative Offset Probability Density (COPD). They applied this novel method to a slow-moving, strike-slip fault located on the SE of the Iberian Peninsula: the Alhama de Murcia fault. The authors utilized a series of independent variables in an effort to evaluate the quality of their analyses. Their detailed observations can be consulted as kmz files in the supplementary material section of their paper. Interestingly, it appears that slip rates varied on different segments of the fault; as clearly stated by the authors, which may also be due to a lack of specific data affecting their results.

3.5. Structure-from-Motion and Image Pre-Processing Techniques

The emergence of SfM in recent years has revolutionized topographic surveys in geomorphological studies, making data collection and processing techniques available to non-specialists [4]. This trend is even more pronounced in challenging areas where the use of UAV systems is able to overtake several issues affecting conventional photogrammetric techniques, including difficult accessibility, variable distance-to-target and presence of occlusions due to topographic complexities. The article by Gómez-Gutierrez et al. [14] published in this Special Issue evaluated the quality of SfM point cloud in a high-mountain rock glacier in the Pyrenees. Authors assessed the quality on the point cloud generation using both point to point and M3C2 strategies of comparison using TLS point cloud as a benchmark. They tested point cloud generation with several SfM software packages, source imagery, dates of acquisition and presence/absence of snow cover. A LoD of about 30 cm was obtained on such a challenging environment, which is equivalent to some other recent examples of SfM in challenging situations [3,4,43]. Although the accuracy of point cloud reconstructions using different cameras and software packages was evaluated before [44,45], the authors of this publication also tested whether or not the use of High Dynamic Range (HDR) images might produce more accurate results than the use of conventional exposition. Finally, they showed that no significant improvements were obtained using the alternative HDR exposition, which is also a useful piece of experience.

4. Current Challenges in the Use of 3D Point Clouds in GeoHazards

The interest on the characterization and monitoring of geohazards both using LiDAR and photogrammetric techniques is continuously growing as discussed before (Figure 1). SfM workflows have evolved very rapidly during the past ten years, being the potential of SfM for geological studies explored by a growing number of Geoscientits nowadays [4,46]. It is very likely that these workflows will continue to evolve very rapidly during the forthcoming years, and that SfM techniques will turn into a conventional procedure during the next decade, which will certainly produce a series of exciting research findings and new applications for Natural Hazard assessment.
In spite of recent technological advances, a great challenge remains in the development of new 3D computational procedures for improving characterization, monitoring and modelling of geohazards. Further investigation in the development of new algorithms for process automatization including feature extraction, massive data acquisition, direct georeferencing and real-time monitoring is needed. Another aspect that will grow during the forthcoming years include an integration of very high quality 3D data with current physical models.
Most importantly, we noticed that although high quality measurements can be acquired nowadays with little effort, publishing relevant findings (e.g., presenting new workflows for data treatment, or showing original strategies or techniques for data acquisition, or discussing innovative results helping the understanding of a given physical phenomena) from high quality data is not always straightforward. Using well-established procedures to answer an exciting research question validates and reinforces previous innovations, but on the contrary, repeating the same procedures that have already been used elsewhere should not be further rewarded by editors or external reviewers. Scientific efforts should be placed on real innovation, including the development of new processing techniques or the extraction of some original information from these measurements that helps to a better process understanding.
Lastly, the scientific community has an increasing interest in open knowledge, including open-access publications and open-data. While open publishing seems to be more and more requested by funding agencies (and articles published in Remote Sensing can be openly accessed world-wide), other aspects of open knowledge are also very important for the scientific community, including the creation (or maintaining) of open databases containing freely available data and code (or pseudo-code) of already published algorithms. Interestingly, two publications in this Special Issue provide supplementary files: RAW 3D point clouds were provided by [15] and a series of digitized features from which lateral offsets were calculated was provided by [13]. Needless to say, releasing open data in public repositories such as OpenTopography and other public repositories [47,48,49] considerably helps for validating own results and for allowing geoscientists to advance further in several unexpected directions.

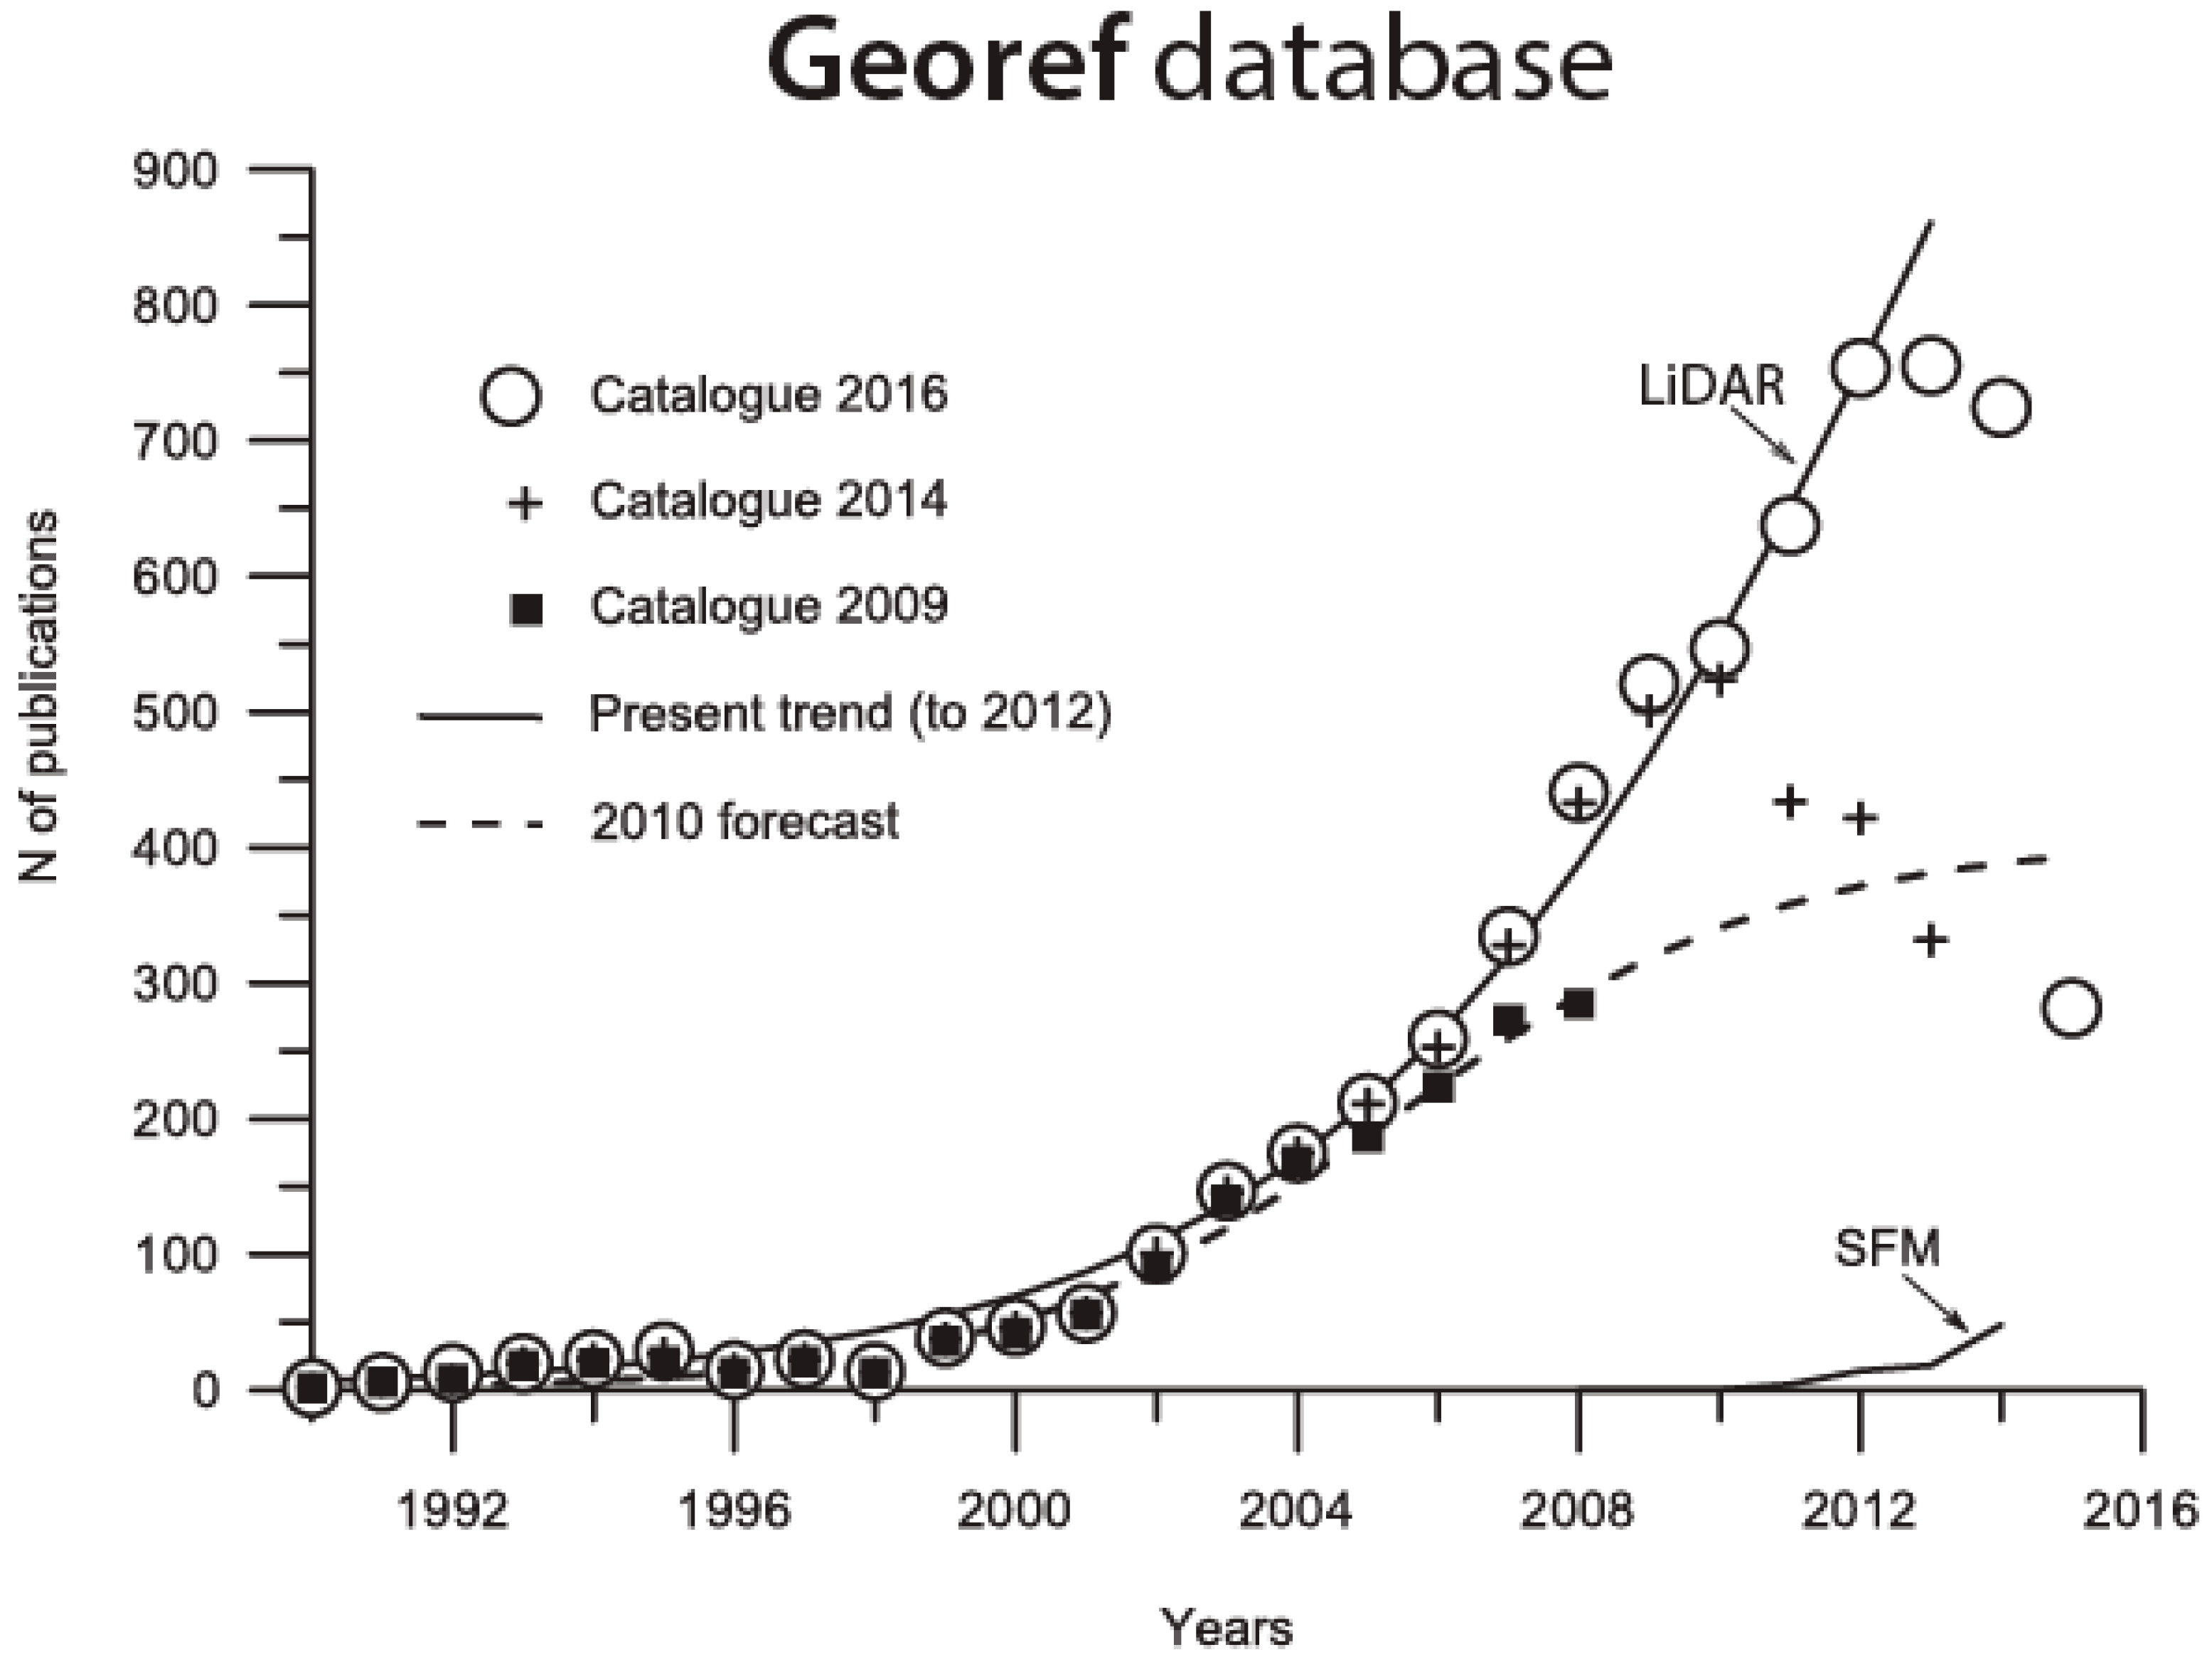
5. Forecasting Future Trends Analysing Bibliographic Data

After having examined the state-of-the-art on the use of 3D remote sensing techniques in the geosciences, one may ask how this situation will evolve during the forthcoming decades. In 2010, authors in [17] analyzed the increasing importance of laser scanning technologies in the geoscientific community, by measuring the number of occurrences of the terms “LiDAR” or “laser scan*” in the keywords of the Georef bibliographical database. They illustrated the fast growing impact of laser scanning in geosciences research based on the 2009 version of the database. They also forecasted future developments of this technique, stating that by 2016 laser scanning should become a routine method and that its popularity will reach a ceiling (Figure 2). This forecast was based on a gentle reduction of the increasing number of references observed in the catalogue for the years 2005–2008, which was fitted with a logistic function. The same analysis was performed in 2014 and again in 2016, showing that this forecast was wrong. Indeed, (Figure 2) shows that the number of references to laser scanning in the geoscientific literature has continued to increase almost exponentially. The apparent slowing down observed in previous analysis [17] was actually due to the fact that it requires three to four years to complete the catalogue of bibliographical references in the Georef database. Using the catalogue of January of 2016 of Georef, and considering that it is almost complete up until 2012, it appears that the importance of laser scanning technologies in geosciences is still rapidly growing, almost exponentially. We consider that an exponential function is a sensible way to model this growth as the total amount of potential LiDAR users or devices is not infinite and probably another technology will take over; however the initial stage of growth of a logistic function is approximately exponential, which reasonably fits the observed trend in the Georef database.
Figure 2. Number of publications in the Georef database using the term “LiDAR” or “laser scan*” in keywords between 1990 and 2015. These terms were consulted on the Georef database at different dates (see different symbols for 2009, 2014 and 2016). Dashed line: forecast of the number references by [17]. Continuous line: present evolution up to 2012 based on the available catalogue at January 2016 (logistic function fit).
Remotesensing 08 00130 g002
Concerning SFM, one can observe, in Figure 2, the emergence of this technique in the geosciences literature starting from 2011. Based on the January 2016 version of Georef database, the number of records for 2013 and 2014 are strongly underestimated (as for the term “LiDAR”) and will be corrected in the following years. Although SfM has been rapidly adapted by geoscientists, Figure 2 shows that it is at its early stages of development; our opinion is that this technique will become much more widely used in the next five years and that the number of publications using this technique will experience an exponential growth soon. Our approach to forecast has a clear drawback: it is clearly biased by our current knowledge on the previously published articles. Unfortunately, black swan events, i.e., extreme and often unexpected phenomena having the ability to profoundly disrupt the system functioning [50], may also take place during the next 5–10 years. For instance, black swans in the form of new technological developments, are expected to happen during the next decade or so, which may completely dislocate our forecasting attempt. Unfortunately, “prediction is very difficult, especially about the future” as might have said Niels Bohr unless Nostradamus did it [51].

Acknowledgments

Guest editors would like to acknowledge the external reviewers that assured reaching the quality standards of Remote Sensing journals through their much appreciated iterative review process. The authors, assistant editors and the academic editors are also gratefully acknowledged for their interest in contributing with this excellent Special Issue. We also thank Ryan Kromer for help improving the use of English in the manuscript.

Author Contributions

A.A. edited the manuscript, wrote Section 1, Section 3, Section 4, and revised the text. M.H.D. wrote Section 2 and Section 5 (including figures) and revised the text. M.J. revised the text. A.A., M.H.D. and M.J. were Guest Editors of this Special Issue and therefore reviewed all the submissions.

Conflicts of Interest

The authors declare no conflict of interest. The founding sponsors had no role in the design of the study; in the collection, analyses, or interpretation of data; in the writing of the manuscript, and in the decision to publish the results.

Abbreviations

The following abbreviations are used in this manuscript:
UAV
Unmanned Aerial Vehicles
SfM
Structure-from-Motion
TLS
Terrestrial Laser Scanner
PIV
Particle Image Velocity
HDR
High Dynamic Range Images
COPD
Cumulative Offset Probability Density
LoD
Level of Detection

References

  1. Prost, G.L. Remote Sensing for Geoscientists: Image Analysis and Integration, 3rd ed.; CRC Press: Boca Raton, FL, USA, 2013. [Google Scholar]
  2. McCaffrey, K.J.W.; Jones, R.R.; Holdsworth, R.E.; Wilson, R.W.; Clegg, P.; Imber, J.; Holliman, N.; Trinks, I. Unlocking the spatial dimension: Digital technologies and the future of geoscience fieldwork. J. Geol. Soc. 2005, 162, 927–938. [Google Scholar] [CrossRef]
  3. Westoby, M.J.; Brasington, J.; Glasser, N.F.; Hambrey, M.J.; Reynolds, J.M. “Structure-from-Motion” photogrammetry: A low-cost, effective tool for geoscience applications. Geomorphology 2012, 179, 300–314. [Google Scholar] [CrossRef] [Green Version]
  4. Smith, M.W.; Carrivick, J.L.; Quincey, D.J. Structure from motion photogrammetry in physical geography. Prog. Phys. Geogr. 2015. [Google Scholar] [CrossRef]
  5. Tarolli, P.; Sofia, G.; Dalla Fontana, G. Geomorphic features extraction from high-resolution topography: Landslide crowns and bank erosion. Nat. Hazards 2012, 61, 65–83. [Google Scholar] [CrossRef]
  6. Buckley, S.J.; Kurz, T.H.; Howell, J.A.; Schneider, D. Terrestrial lidar and hyperspectral data fusion products for geological outcrop analysis. Comput. Geosci. 2013, 54, 249–258. [Google Scholar] [CrossRef]
  7. Hodgetts, D. Laser scanning and digital outcrop geology in the petroleum industry: A review. Mar. Petrol. Geol. 2013, 46, 335–354. [Google Scholar] [CrossRef]
  8. Aryal, A.; Brooks, B.A.; Reid, M.E.; Bawden, G.W.; Pawlak, G.R. Displacement fields from point cloud data: Application of particle imaging velocimetry to landslide geodesy. J. Geophys. Res. Earth 2012, 117. [Google Scholar] [CrossRef]
  9. Tarolli, P. High-resolution topography for understanding Earth surface processes: Opportunities and challenges. Geomorphology 2014, 216, 295–312. [Google Scholar] [CrossRef]
  10. Jaboyedoff, M.; Oppikofer, T.; Abellán, A.; Derron, M.H.; Loye, A.; Metzger, R.; Pedrazzini, A. Use of LIDAR in landslide investigations: A review. Nat. hazards 2012, 61, 5–28. [Google Scholar] [CrossRef]
  11. Abellán, A.; Oppikofer, T.; Jaboyedoff, M.; Rosser, N.J.; Lim, M.; Lato, M.J. Terrestrial laser scanning of rock slope instabilities. Earth Surf. Process. Landf. 2014, 39, 80–97. [Google Scholar] [CrossRef]
  12. Slatcher, N.; James, M.R.; Calvari, S.; Ganci, G.; Browning, J. Quantifying effusion rates at active volcanoes through integrated time-lapse laser scanning and photography. Remote Sens. 2015, 7, 14967–14987. [Google Scholar] [CrossRef] [Green Version]
  13. Ferrater, M.; Arrowsmith, R.; Masana, E. Lateral Offset Quality Rating along Low Slip Rate Faults: Application to the Alhama de Murcia Fault (SE Iberian Peninsula). Remote Sens. 2015, 7, 14827–14852. [Google Scholar] [CrossRef] [Green Version]
  14. Gómez-Gutiérrez, Á.; de Sanjosé-Blasco, J.J.; Lozano-Parra, J.; Berenguer-Sempere, F.; de Matías-Bejarano, J. Does HDR Pre-Processing Improve the Accuracy of 3D Models Obtained by Means of two Conventional SfM-MVS Software Packages? The Case of the Corral del Veleta Rock Glacier. Remote Sens. 2015, 7, 10269–10294. [Google Scholar]
  15. Kromer, R.A.; Abellán, A.; Hutchinson, D.J.; Lato, M.; Edwards, T.; Jaboyedoff, M. A 4D Filtering and Calibration Technique for Small-Scale Point Cloud Change Detection with a Terrestrial Laser Scanner. Remote Sens. 2015, 7, 13029–13052. [Google Scholar] [CrossRef]
  16. Olsen, M.J.; Wartman, J.; McAlister, M.; Mahmoudabadi, H.; O’Banion, M.S.; Dunham, L.; Cunningham, K. To Fill or Not to Fill: Sensitivity Analysis of the Influence of Resolution and Hole Filling on Point Cloud Surface Modeling and Individual Rockfall Event Detection. Remote Sens. 2015, 7, 12103–12134. [Google Scholar] [CrossRef]
  17. Derron, M.H.; Jaboyedoff, M. Preface “LIDAR and DEM techniques for landslides monitoring and characterization”. Nat. Hazards Earth Syst. Sci. 2010, 10, 1877–1879. [Google Scholar] [CrossRef]
  18. Global Scientific Output Doubles Every Nine Years. Available online: http://blogs.nature.com/news/2014/05/global-scientific-output-doubles-every-nine-years.html (accessed on 12 January 2016).
  19. Pesci, A.; Fabris, M.; Conforti, D.; Loddo, F.; Baldi, P.; Anzidei, M. Integration of ground-based laser scanner and aerial digital photogrammetry for topographic modelling of Vesuvio volcano. J. Volcanol. Geotherm. Res. 2007, 162, 123–138. [Google Scholar] [CrossRef]
  20. Nelson, C.E.; Jerram, D.A.; Hobbs, R.W.; Terrington, R.; Kessler, H. Reconstructing flood basalt lava flows in three dimensions using terrestrial laser scanning. Geosphere 2011, 7, 87–96. [Google Scholar] [CrossRef]
  21. Pesci, A.; Teza, G.; Ventura, G. Remote sensing of volcanic terrains by terrestrial laser scanner: Preliminary reflectance and RGB implications for studying Vesuvius crater (Italy). Ann. Geophys. 2008, 51, 633–653. [Google Scholar]
  22. Jones, L.K.; Kyle, P.R.; Oppenheimer, C.; Frechette, J.D.; Okal, M.H. Terrestrial laser scanning observations of geomorphic changes and varying lava lake levels at Erebus volcano, Antarctica. J. Volcanol. Geotherm. Res. 2015, 295, 43–54. [Google Scholar] [CrossRef]
  23. Nguyen, H.T.; Fernandez-Steeger, T.M.; Wiatr, T.; Rodrigues, D.; Azzam, R. Use of terrestrial laser scanning for engineering geological applications on volcanic rock slopes-an example from Madeira Island (Portugal). Nat. Hazards Earth Syst. Sci. 2011, 11, 807–817. [Google Scholar] [CrossRef]
  24. Thielicke, W.; Stamhuis, E.J. PIVlab—Towards user-friendly, affordable and accurate digital particle image velocimetry in MATLAB. J. Open Res. Softw. 2014, 2. [Google Scholar] [CrossRef]
  25. Abellán, A.; Jaboyedoff, M.; Oppikofer, T.; Vilaplana, J.M. Detection of millimetric deformation using a terrestrial laser scanner: Experiment and application to a rockfall event. Nat. Hazards Earth Syst. Sci. 2009, 9, 365–372. [Google Scholar] [CrossRef]
  26. Lague, D.; Brodu, N.; Leroux, J. Accurate 3D comparison of complex topography with terrestrial laser scanner: Application to the Rangitikei canyon (NZ). ISPRS J. Photogramm. Remote Sens. 2013, 82, 10–26. [Google Scholar] [CrossRef]
  27. Monserrat, O.; Crosetto, M. Deformation measurement using terrestrial laser scanning data and least squares 3D surface matching. ISPRS J. Photogramm. Remote Sens. 2008, 63, 142–154. [Google Scholar] [CrossRef]
  28. Lim, M.; Petley, D.N.; Rosser, N.J.; Allison, R.J.; Long, A.J.; Pybus, D. Combined digital photogrammetry and time-of-flight laser scanning for monitoring cliff evolution. Photogramm. Rec. 2005, 20, 109–129. [Google Scholar] [CrossRef] [Green Version]
  29. Rosser, N.J.; Petley, D.N.; Lim, M.; Dunning, S.A.; Allison, R.J. Terrestrial laser scanning for monitoring the process of hard rock coastal cliff erosion. Q. J. Eng. Geol. Hydrogeol. 2005, 38, 363–375. [Google Scholar] [CrossRef]
  30. Dewez, T.J.; Rohmer, J.; Regard, V.; Cnudde, C. Probabilistic coastal cliff collapse hazard from repeated terrestrial laser surveys: Case study from Mesnil Val (Normandy, northern France). J. Coast. Res. 2013, 65, 702–707. [Google Scholar]
  31. Royán, M.J.; Abellán, A.; Jaboyedoff, M.; Vilaplana, J.M.; Calvet, J. Spatio-temporal analysis of rockfall pre-failure deformation using Terrestrial LiDAR. Landslides 2014, 11, 697–709. [Google Scholar] [CrossRef]
  32. Carrea, D.; Abellan, A.; Derron, M.H.; Jaboyedoff, M.; Loye, A.; Michoud, C. Automatic rockfalls volume estimation based on terrestrial laser scanning data. In Engineering Geology for Society and Territory; Springer International Publishing: Berlin, Germany; Heidelberg, Germany, 2015; Volume 2, pp. 425–428. [Google Scholar]
  33. Stock, G.M.; Martel, S.J.; Collins, B.D.; Harp, E.L. Progressive failure of sheeted rock slopes: The 2009–2010 Rhombus Wall rock falls in Yosemite Valley, California, USA. Earth Surf. Process. Landf. 2012, 37, 546–561. [Google Scholar] [CrossRef]
  34. Santana, D.; Corominas, J.; Mavrouli, O.; Garcia-Sellés, D. Magnitude-frequency relation for rockfall scars using a Terrestrial Laser Scanner. Eng. Geol. 2012, 145, 50–64. [Google Scholar] [CrossRef]
  35. Kemeny, J.; Henwood, J.; Turner, K. The use of ground-based LiDAR for geotechnical aspects of highway projects. In Proceedings of the 57th Annual Highway Geological Symposium, Breckenridge, CO, USA, 27–29 September 2006; pp. 27–29.
  36. Lato, M.J.; Gauthier, D.; Hutchinson, D.J. Rock Slopes Asset Management: Selecting the Optimal Three-Dimensional Remote Sensing Technology. Transp. Res. 2015, 2510, 7–14. [Google Scholar] [CrossRef]
  37. Tonini, M.; Abellan, A. Rockfall detection from terrestrial LiDAR point clouds: A clustering approach using R. JOSIS 2015, 8, 95–110. [Google Scholar] [CrossRef]
  38. Bommer, J.J. Uncertainty about the uncertainty in seismic hazard analysis. Eng. Geol. 2003, 70, 165–168. [Google Scholar] [CrossRef]
  39. Wallace, R.E. Notes on stream channels offset by the San Andreas fault, southern Coast Ranges, California. In Conference on Geologic Problems of the San Andreas Fault System; Stanford University Publication in Geological Sciences: Stanford, CA, USA, 1968; Volume 11, pp. 6–21. [Google Scholar]
  40. Salisbury, J.B.; Rockwell, T.K.; Middleton, T.J.; Hudnut, K.W. LiDAR and field observations of slip distribution for the most recent surface ruptures along the Central San Jacinto Fault. Bull. Seismol. Soc. Am. 2012, 102, 598–619. [Google Scholar] [CrossRef]
  41. Scharer, K.M.; Salisbury, J.B.; Arrowsmith, J.R.; Rockwell, T.K. Southern San Andreas fault evaluation field activity: Approaches to measuring small geomorphic offsets-challenges and recommendations for active fault studies. Seismol. Res. Lett. 2014, 85, 68–76. [Google Scholar] [CrossRef]
  42. Moulin, A.; Benedetti, L.; Gosar, A.; Rupnik, P.J.; Rizza, M.; Bourlès, D.; Ritz, J.F. Determining the present-day kinematics of the Idrija fault (Slovenia) from airborne LiDAR topography. Tectonophysics 2014, 628, 188–205. [Google Scholar] [CrossRef]
  43. James, M.R.; Robson, S. Straightforward reconstruction of 3D surfaces and topography with a camera: Accuracy and geoscience application. J. Geophys. Res. Earth 2012, 117. [Google Scholar] [CrossRef] [Green Version]
  44. Micheletti, N.; Chandler, J.H.; Lane, S.N. Investigating the geomorphological potential of freely available and accessible structure-from-motion photogrammetry using a smartphone. Earth Surf. Process. Landf. 2015, 40, 473–486. [Google Scholar] [CrossRef] [Green Version]
  45. Turner, D.; Lucieer, A.; Wallace, L. Direct georeferencing of ultrahigh-resolution UAV imagery. IEEE Trans. Geosci. Remote Sens. 2014, 52, 2738–2745. [Google Scholar] [CrossRef]
  46. Bemis, S.P.; Micklethwaite, S.; Turner, D.; James, M.R.; Akciz, S.; Thiele, S.; Bangash, H.A. Ground-based and UAV-based photogrammetry: A multi-scale, high-resolution mapping tool for structural geology and paleoseismology. J. Struct. Geol. 2014, 69, 163–178. [Google Scholar] [CrossRef]
  47. OpenTopograpy: High-Resolution Topography Data and Tools. Available online: http://www.opentopography.org/ (accesed on 12 January 2016).
  48. Point Cloud Library Data Repository. Available online: http://www.pointclouds.org/news/2013/01/07/point-cloud-data-sets/ (accesed on 12 January 2016).
  49. Lato, M.; Kemeny, J.; Harrap, R.M.; Bevan, G. Rock bench: Establishing a common repository and standards for assessing rockmass characteristics using LiDAR and photogrammetry. Comput. Geosci. 2013, 50, 106–114. [Google Scholar] [CrossRef]
  50. Taleb, N.N. The Black Swan: The Impact of the Highly Improbable Fragility; Random House: New York, NY, USA, 2010. [Google Scholar]
  51. Quoteinvestigator.com. Available online: http://quoteinvestigator.com/2013/10/20/no-predict/ (accessed on 12 January 2016).

