Article

Understanding the Spatial Temporal Vegetation Dynamics in Rwanda

1
State Key Laboratory of Desert and Oasis Ecology, Xinjiang Institute of Ecology and Geography, Chinese Academy of Sciences, Urumqi 830011, China
2
University of Chinese Academy of Sciences, Beijing 100049, China
3
University of Lay Adventists of Kigali (UNILAK), P.O 6392 Kigali, Rwanda
*
Author to whom correspondence should be addressed.
Remote Sens. 2016, 8(2), 129; https://doi.org/10.3390/rs8020129
Submission received: 20 November 2015 / Revised: 26 January 2016 / Accepted: 1 February 2016 / Published: 5 February 2016

Abstract

:
Knowledge of current vegetation dynamics and an ability to make accurate predictions of ecological changes are essential for minimizing food scarcity in developing countries. Vegetation trends are also closely related to sustainability issues, such as management of conservation areas and wildlife habitats. In this study, AVHRR and MODIS NDVI datasets have been used to assess the spatial temporal dynamics of vegetation greenness in Rwanda under the contrasting trends of precipitation, for the period starting from 1990 to 2014, and for the first growing season (season A). Based on regression analysis and the Hurst exponent index methods, we have investigated the spatial temporal characteristics and the interrelationships between vegetation greenness and precipitation in light of NDVI and gridded meteorological datasets. The findings revealed that the vegetation cover was characterized by an increasing trend of a maximum annual change rate of 0.043. The results also suggest that 81.3% of the country’s vegetation has improved throughout the study period, while 14.1% of the country’s vegetation degraded, from slight (7.5%) to substantial (6.6%) deterioration. Most pixels with severe degradation were found in Kigali city and the Eastern Province. The analysis of changes per vegetation type highlighted that five types of vegetation are seriously endangered: The “mosaic grassland/forest or shrubland” was severely degraded, followed by “sparse vegetation,” “grassland or woody vegetation regularly flooded on water logged soil,” “artificial surfaces” and “broadleaved forest regularly flooded.” The Hurst exponent results indicated that the vegetation trend was consistent, with a sustainable area percentage of 40.16%, unsustainable area of 1.67% and an unpredictable area of 58.17%. This study will provide government and local authorities with valuable information for improving efficiency in the recently targeted countrywide efforts of environmental protection and regeneration.

Graphical Abstract

1. Introduction

Rural populations are exposed to the impacts of climate variability on agricultural production, considered to be the most rainfall-dependent of all human economic activities. This vulnerability is enhanced in less economically developed, tropical countries that, in many cases, are exposed to high climate variability at different spatial-temporal scales [1]. Rainfall variability is a common phenomenon in Rwanda and this negatively affects agricultural production, food security and the general livelihood of the population. Changes in vegetation density and health are often associated with hydro-ecological changes, anthropogenic influences or even natural phenomena like the El Niño southern oscillation. Quantifying the magnitude of land-cover change is crucial for understanding the ecosystem dynamics. Satellite remote sensing has long been considered an ideal technology for this purpose because it permits analyses of large areas with a high temporal frequency. With new sensors like MODIS (Moderate Resolution Imaging Spectroradiometer), new data are available to extract key phenological parameters and monitor trends in vegetation dynamics [2]. The Normalized Difference Vegetation Index (NDVI) is an index that measures vegetation greenness and has been proven to be positively correlated with productivity [3]. NDVI found wide applications in vegetation studies and has been used to estimate crop yields, pasture performance, and rangeland carrying capacities among others [3]. Generally, healthy vegetation will absorb most of the visible light that falls on it, and reflects a large portion of the near-infrared light. Unhealthy or sparse vegetation reflects more visible light and less near-infrared light. Bare soils on the other hand reflect moderately in both the red and infrared portion of the electromagnetic spectrum [4].
The need to understand the Earth’s ecology and land cover is becoming increasingly important as the impacts of climate change start to affect animal and plant life, which ultimately affect human life. Knowledge of current vegetation trends and the ability to make accurate predictions of ecological changes is essential to minimize times of food scarcity in developing countries. Vegetation trends are also closely related to sustainability issues, such as management of conservation areas and wildlife habitats, precipitation and drought monitoring, improvement of land use for livestock, and finding optimum agriculture seeding and harvest dates for crops [5]. Rwanda in particular, has witnessed unprecedented changes in precipitation patterns over the last decades, leading to imbalances in rainfall distribution across the country. In the year 2000, a severe drought was observed in the Eastern Province of the country. The Bugesera district was the most affected by the drought, resulting in population displacement. Despite the United Nations urging more studies for monitoring precipitation and vegetation in this eastern Africa region which has experienced severe droughts, there have only been a handful of studies from the region [5,6,7]. Of these few studies, only minor attention was paid to assessing Rwanda's vegetation changes. Rwanda, in particular, is comparatively small in territory and generalized conclusions on East Africa may not apply to Rwanda [8,9]. Rulinda et al., 2011 studied vegetation health in Rwanda by taking chlorophyll and the percentage of vegetation cover as variables. However, this was only applied to the district of Bugesera, a very small area of the country. Rulinda et al.’s study was also applied to a very confined temporal scale and provided no insight into the variability of trends through different time scales [10]. The present paper aims to (1) examine the spatial temporal greenness variability and vegetation dynamics over Rwanda in relation to precipitation distribution patterns; (2) identify the trends and the sustainability of the observed trends; (3) highlight the most vulnerable regions and/or vegetation types, using NDVI as a reflective indicator. In the following sections, we elaborate on the methods and materials used (Section 2); the results obtained (Section 3); the discussion and analysis of results (Section 4) and, finally, the conclusion (Section 5).

2. Materials and Methods
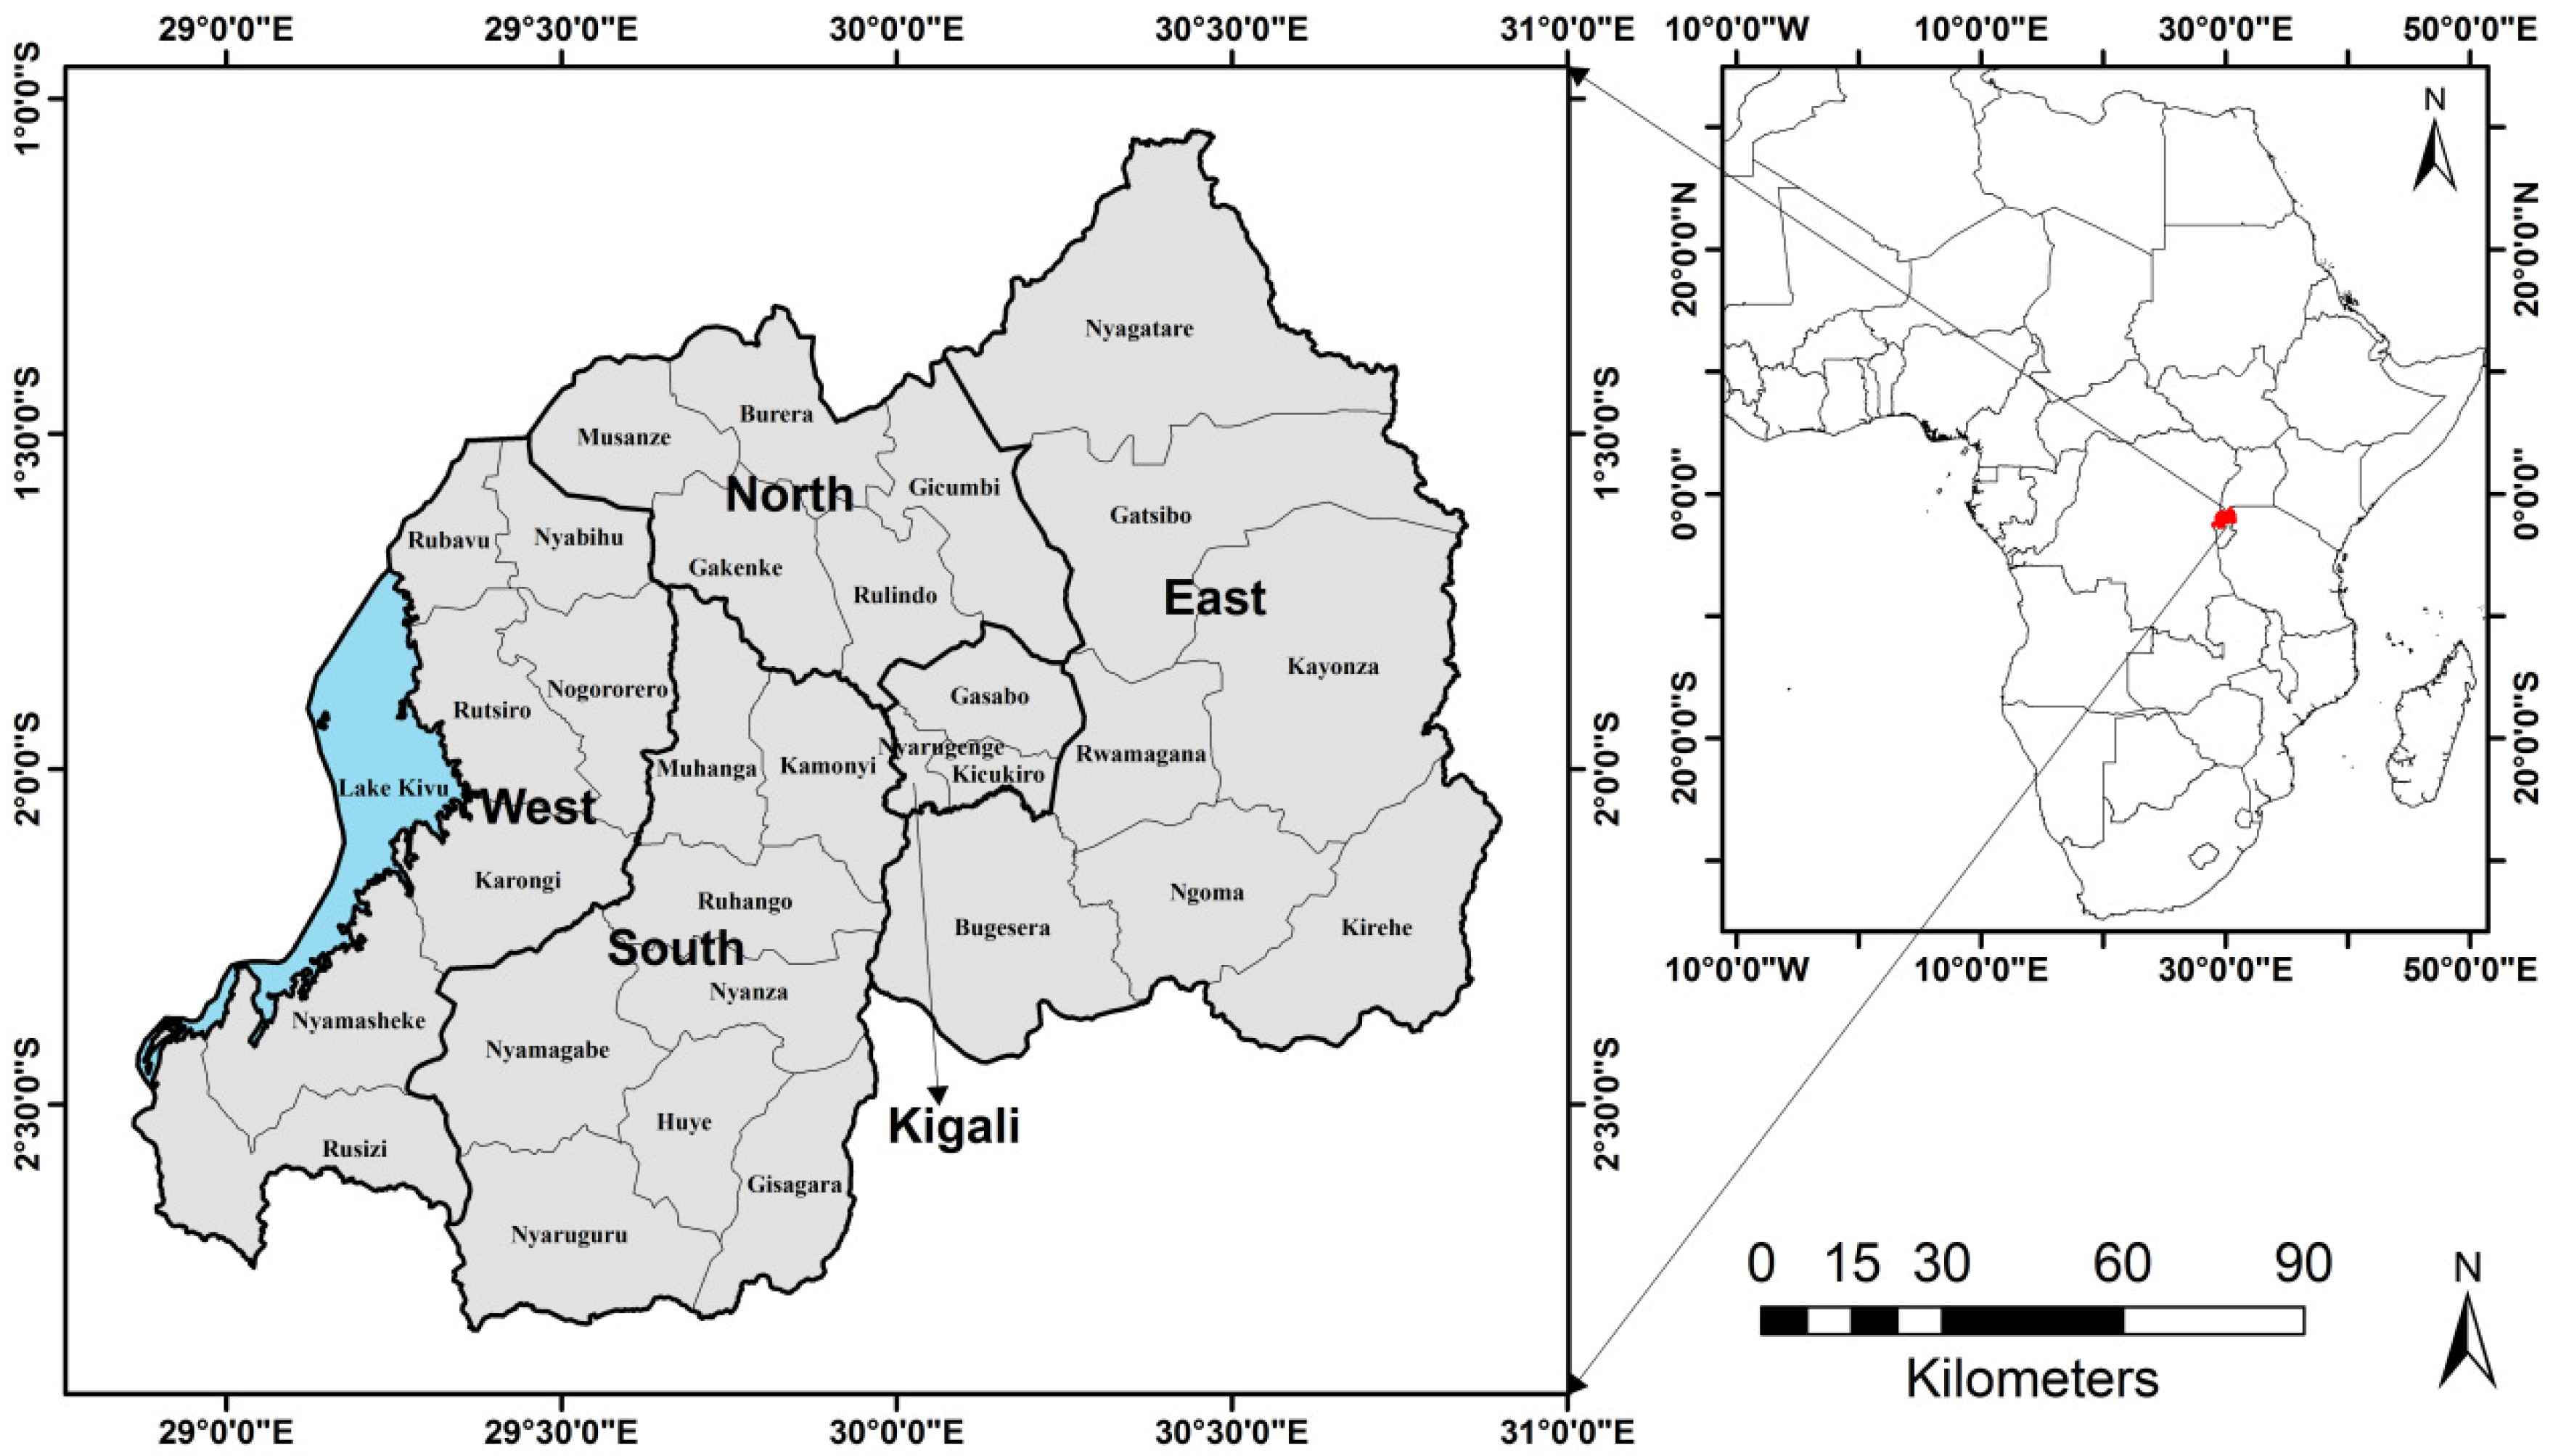
2.1. Study Area

This study was conducted over the entire territory of Rwanda, occupying a surface of 26,338 km2 on the eastern shoulder of the Kivu-Tanganyika rift in Africa. It lies between 1°4′ and 2°51′ south latitude and 28°53′ and 30°53′ east longitude. Despite its proximity to the equator, Rwanda enjoys a tropical climate moderated by hilly topography varying between 900 and 4507 m, stretching from east to west [11]. The country has four climatic seasons in which long rainy (late February-late May) and short rainy seasons (end September-early December) alternate with long dry (June–September) and short dry (mid-December–mid-February) seasons [11]. The two rainy seasons correspond to agricultural seasons, season B and season A, respectively, the latter marking the beginning of the agricultural year [12]. Under normal circumstances, much of the rainfall is expected during the long rainy season. Rwanda is made up of five administrative subdivisions locally known as provinces (Northern, Southern Eastern and Western Province and Kigali city, the capital); each province is further subdivided into five to eight districts as shown in Figure 1 below:
Figure 1. Map showing the administrative subdivisions of Rwanda and its location on the African continent.
Remotesensing 08 00129 g001

2.2. Datasets

NDVI is the most commonly used remote sensing dataset for vegetation and land degradation monitoring [13]. NDVI data at a spatial resolution of 1.1 km and 15-day interval were acquired from the Global Inventory Monitoring and Modeling Studies (GIMMS) group derived from the NOAA/AVHRR Land dataset for the period from September 1990 to December 2000. The dataset is known for its high quality, having been calibrated to eliminate noise from volcanic eruptions, solar angle and sensor errors, and has been widely used in studies on vegetation dynamics at regional and global scales [14]. Although significant improvements have been made with new global land vegetation-sensing instruments, the existing July 1981 to the present archive of data from the Advanced Very High Resolution Radiometer (AVHRR) instrument is an invaluable and irreplaceable archive of historical land surface information [15].
Nevertheless, for better accuracy and precision, NDVI datasets, ranging from 2000 to 2014, were acquired from the Moderate Resolution Imaging Spectroradiometer (MODIS) aboard NASA’s Terra satellite (http://ladsweb.nascom.nasa.gov/data/html). This dataset is believed to offer better performance due to onboard calibration and improved pixel geo-referencing. One of its shortcomings however, has been the lack of longitudinal data since it was launched in 2000.
Given the lack and/or incompleteness of the gauged meteorological data in Rwanda, as confirmed by the Diagram of Station data against time issued by the Rwanda Meteorological Agency (www.meteorwanda.gov.rw), we have been constrained to use the satellite-derived precipitation data. Previous researchers have echoed the absence of complete field datasets mainly because most of the meteorological infrastructure was destroyed during the 1994 war and genocide [11]. The Global Precipitation Climatology Centre data, available at 0.5° spatial resolution, were obtained from Earth System Research Laboratory (http://www.esrl.noaa.gov/) [16].
The other datasets used in this study include digital elevation data at 90 m resolution, which were provided by the NASA Shuttle Radar Topographic Mission (http://srtm.csi.cgiar.org/index.asap). The digital elevation data were utilized to distinguish mountains from plains. In order to ascertain the characteristics of different vegetation types, a vegetation land cover map (Figure 2) was downloaded online at http://blog.sina.com.cn/s/blog_670ee7720101c0ng.html.

2.3. Methodology

2.3.1. Data Processing

This study used NOAA AVHRR 1.1 km bimonthly Maximum Value Composite NDVI images for the first growing season in Rwanda, also locally known as season A (September–December) during 1990–2000 and MODIS NDVI datasets (MD13Q1, 16-day interval) from 2000–2014. These images were compiled by the United States Geological Survey (USGS) EROS Data Center from NOAA/AVHRR satellite images.
Figure 2. Spatial distribution of different vegetation types in Rwanda.
Remotesensing 08 00129 g002
Data processing involved five steps: (1) radiometric calibration to account for sensor degradation; (2) atmospheric correction to adjust for influences of water vapor, aerosols, ozone and Rayleigh scattering; (3) computation of NDVI for all pixels; (4) geometric registration to transform the sensor-based projection to an Earth surface-based projection; and (5) maximum NDVI composition [17,18]. Both the AVHRR composites and MODIS NDVI data were re-projected to Albers Conical Equal Area Projection and AVHRR data were downscaled to 250 m spatial resolution to match with NDVI composites derived from MODIS at a spatial resolution of 250 m. The data were then filtered using the Savitzky-Golay filtering method [19]. The analysis has been confined to the first growing season, which is defined as starting mid-September and lasting until December, according to the Ministry of Agriculture and Animal husbandry dispositions.

2.3.2. Linear Regression Analysis

In this study, the temporal and spatial variation of both the mean NDVI and the mean rainfall in the growing season was analyzed using the linear regression analysis method. Spatial patterns of directions and rates of change have been computed by fitting a least square regression through the time series of each pixel and calculating the slope [20].
The following equation has been used to determine the slope of the trend line:
S = n n i = 1 X i Y i n i = 1 X i n i = 1 Y 1 n n i = 1 X i 2 ( n i = 1 X i ) 2
where n is the cumulative number of years in the study period, Xi is the value of the independent variable and Yi is the value of the dependent variable in the ith year. In general, the variable shows an increasing trend if the slope is >0 and a decreasing trend if the slope is <0). The correlation coefficients between NDVI (dependent variable) and rainfall (independent variable) were calculated using the Pearson’s product moment correlation ρ < 0.05 .

2.3.3. Rescaled Range Analysis Method (Hurst Exponent Index)

The Hurst exponent index used in this study was pioneered by H. Edwin Hurst, a famous British hydrologist, while modeling the waters of the River Nile in 1951 [21]. The Hurst exponent index has found wide applications in science, especially for determining the long-term memory of time series, and has been successfully used in vegetation studies to determine the durability of trends [22,23]. A Hurst exponent value between 0 and 0.5 is indicative of anti-persistent behavior and the closer the value is to 0, the stronger the tendency of the time series to revert to its long-term means value. In a persistent time series, H varying between 0.5 and 1, an increase in values will most likely be followed by an increase in the short term, and a decrease in values will most likely be followed by another decrease in the short term.
The main calculations are as follows:
(a)
Divide the time series { N D V I ( τ ) }   ( τ = 1 , 2 , 3 , n ) into τ subseries X ( t ) , and for each series t = 1, … …, τ
(b)
Define the sequence of time series,
N D V I ( τ ) = 1 τ t τ N D V I ( t )   τ = 1 , 2 , , n
(c)
Calculate the accumulated deviation
X ( t , τ ) = t = 1 t ( N D V I ( t ) N D V I ( τ ) )   1 t τ
(d)
Create the range sequence
R ( τ ) = max X 1 t τ ( t , τ ) min 1 t τ X ( t , τ )     τ = 1 , 2 , , n
(e)
Create the standard deviation sequence
S ( τ ) = [ 1 τ t = 1 τ ( N D V I ( t ) ) N D V I ( τ ) 2 ] 1 2     τ = 1 , 2 , , n
(f)
Calculate the Hurst exponent,
R ( τ ) S ( τ ) = ( C   τ ) H
The value of H is obtained by fitting the equation:
log ( R / S ) n = a + H   × log ( n )
Using the least squares method, where H is the Hurst exponent [22,24].

3. Results

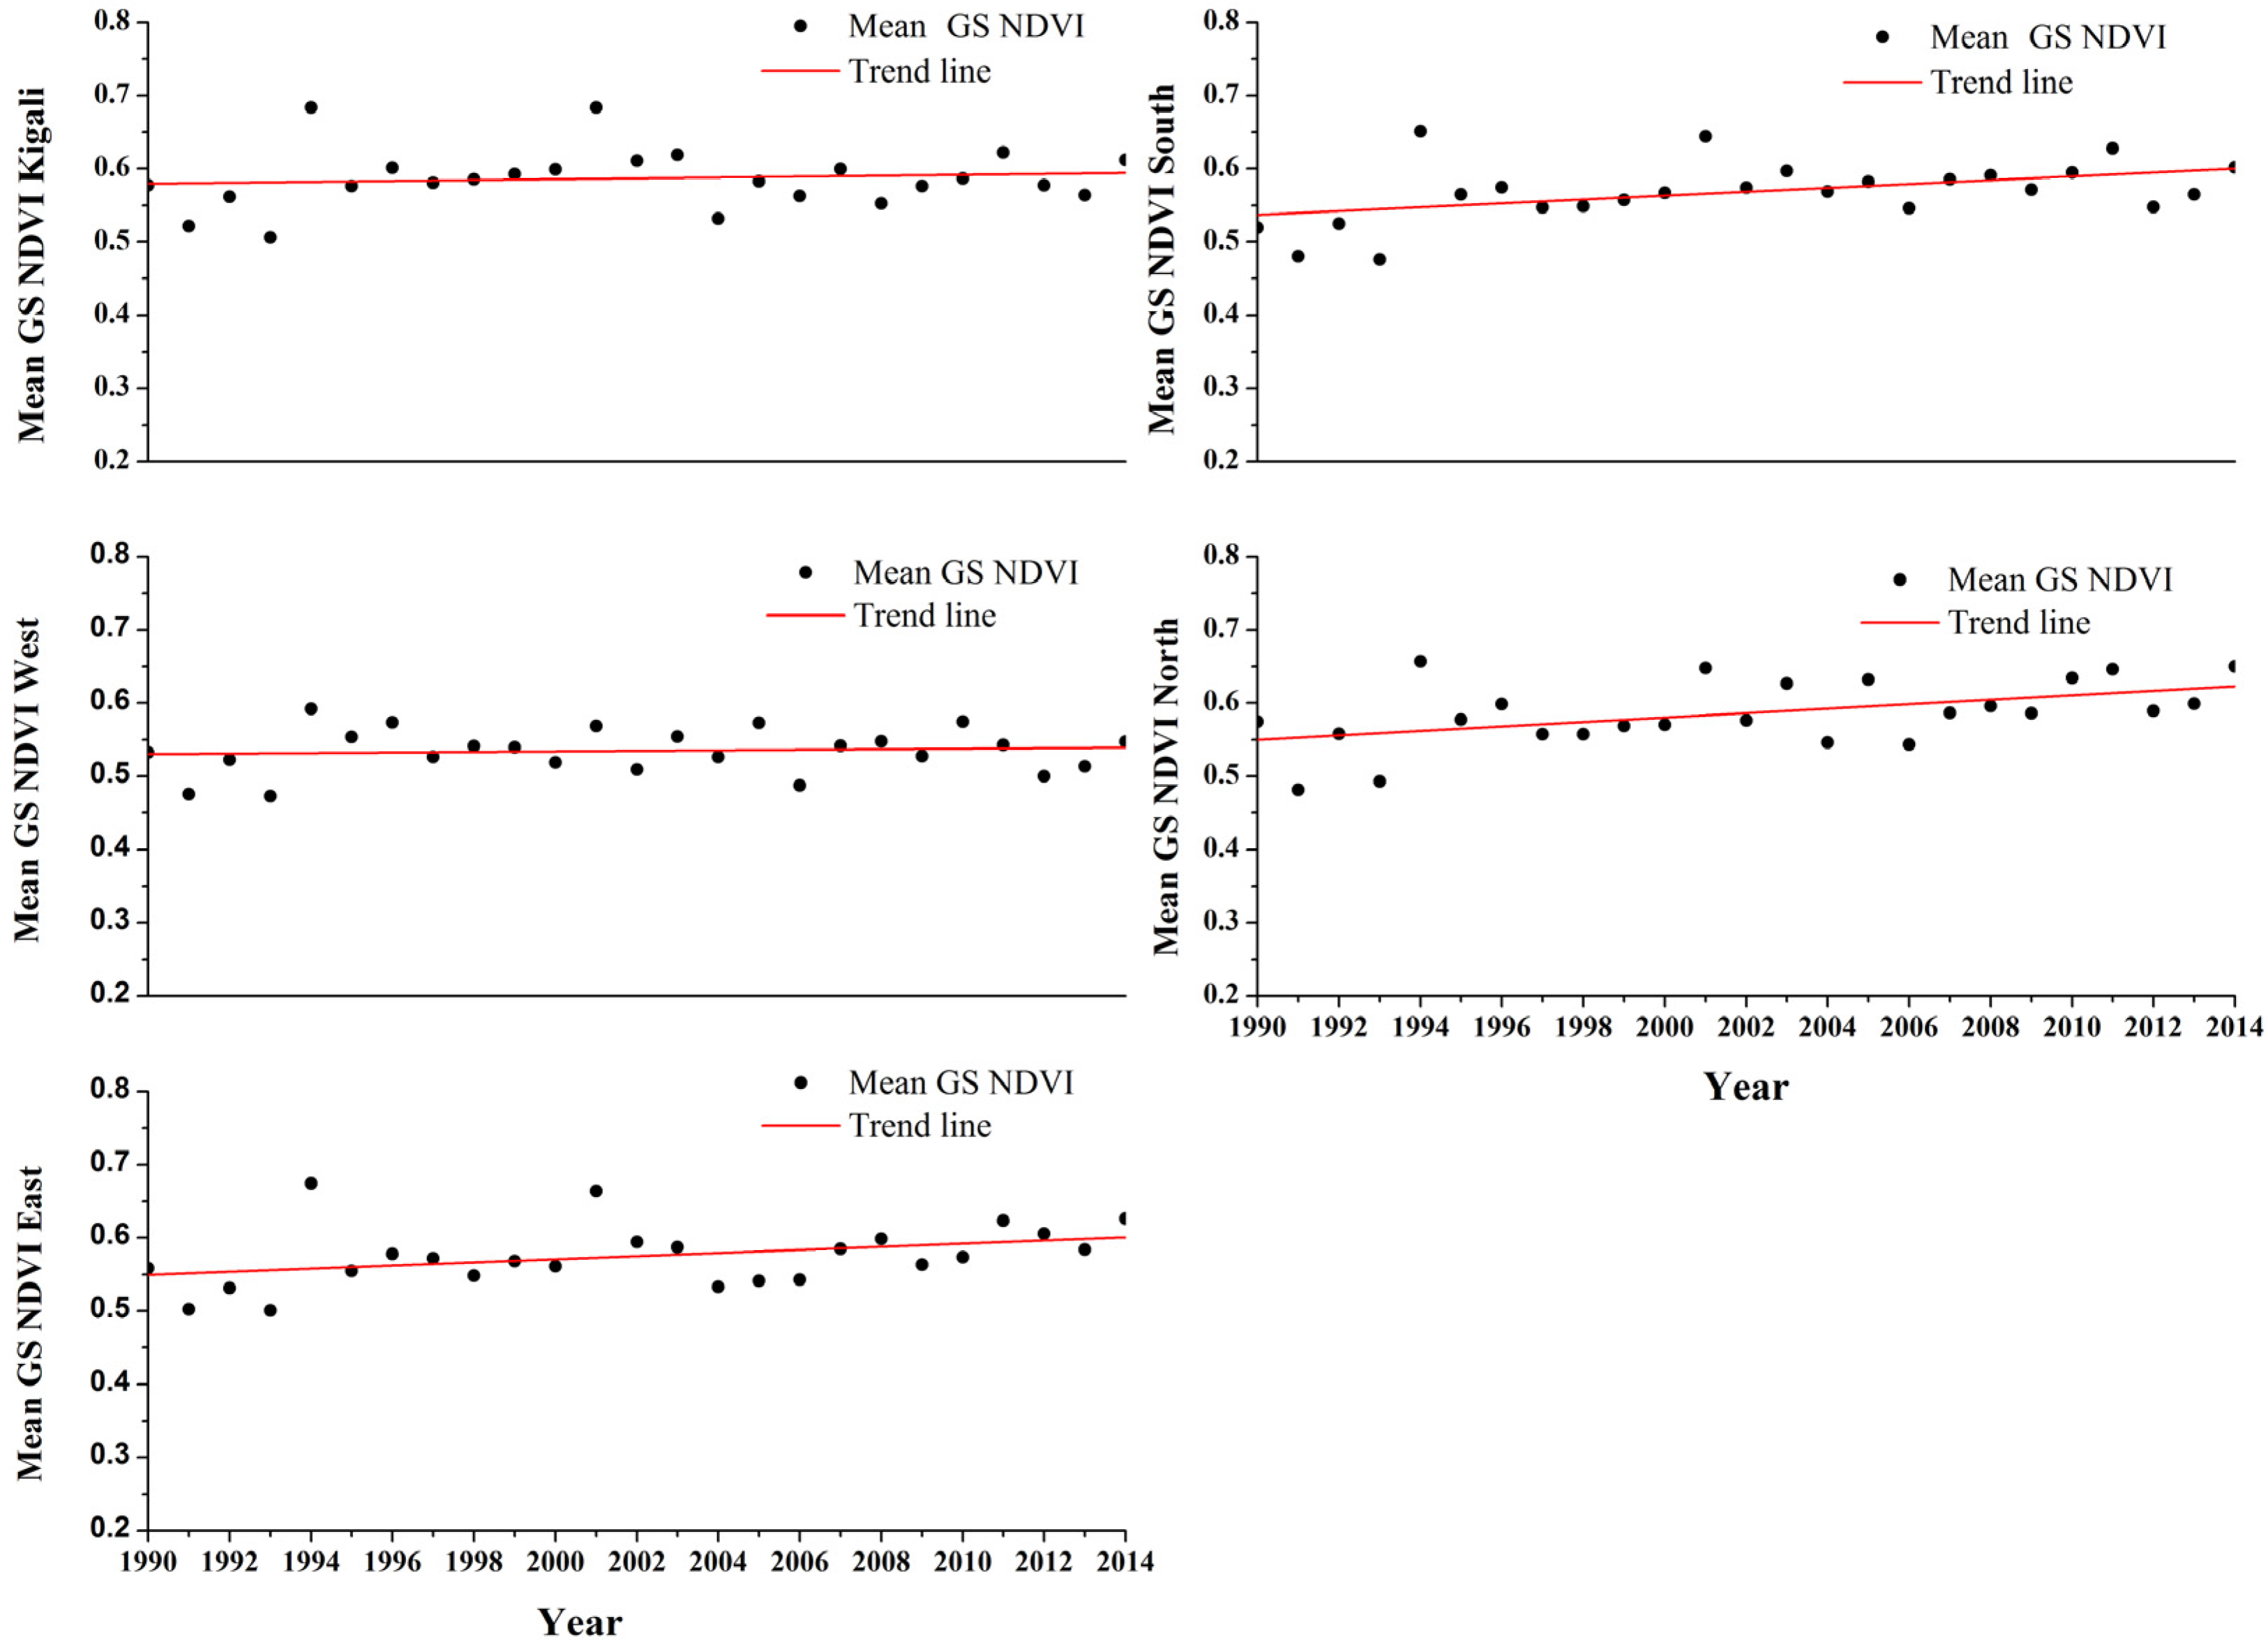
3.1. Statistical Analysis of Vegetation Normalized Difference Vegetation Index (NDVI) Evolution from 1990 to 2014

In order to estimate changes in vegetation activity over Rwanda, it is important to consider patterns of phenological indicators over time. The figure below (Figure 3) presents the statistical evolution of averaged NDVI values in Rwanda, each region studied separately. To avoid the influence of water bodies on statistical averages, the negative pixel values were excluded from the calculations.
Figure 3. Statistical analysis of NDVI values in all the provinces of the country.
Remotesensing 08 00129 g003
Generally, from the figure above, the statistical increase of vegetation greenness in the form of the mean GS NDVI in all provinces can be inferred. The increase was apparent in Southern, Northern, Kigali and Eastern Provinces where the average NDVI values rose from 0.513, 0.565, 0.566 and 0.55 in the year 1990 to 0.59; 0.642; 0.597 and 0.618 in the year 2014, respectively. There is an appealing scenario, however, concerning the year 1994 where the mean GS NDVI of all provinces attained its peak value in comparison with other years.

3.2. Statistical Analysis of the Monthly Mean NDVI throughout the Growing Season

The following table reflects the general observed pattern of vegetation cover increase throughout the growing season of every year. The suite of the monthly mean NDVI values computed for the years 1990 and 2014 has been presented to exemplify the pattern.
Table 1 displays various values of the mean GS NDVI throughout the first growing season in Rwanda. It can be observed that vegetation NDVI increases along the growing season time gradient. Low NDVI values are found in the commencement of the GS, and they increase as the season advances.
Table 1. Statistical Analysis of the Mean NDVI Values throughout the Growing Season.
KigaliSouthernWesternNorthernEastern
(a) Monthly Mean Growing Season NDVI in 1990
September0.45970.45140.47610.47460.4395
September0.50040.46960.48690.50170.4887
October0.56840.51980.55220.57540.5530
October0.50290.47250.49800.52050.4834
November0.64480.55930.56410.6476 0.6383
November0.60630.5258 0.54690.59600.5811
December0.67970.59790.57640.64390.6667
(b) Monthly Mean Growing Season NDVI in 2014
September0.51020.5310.50730.58340.5392
September0.55210.59210.51680.60560.5681
October0.60250.57400.51990.62640.5966
October0.65370.58320.50720.65360.6586
November0.64830.60490.55570.67170.6708
November0.61620.64220.60990.68960.6590
December0.59940.62710.58090.66870.6358

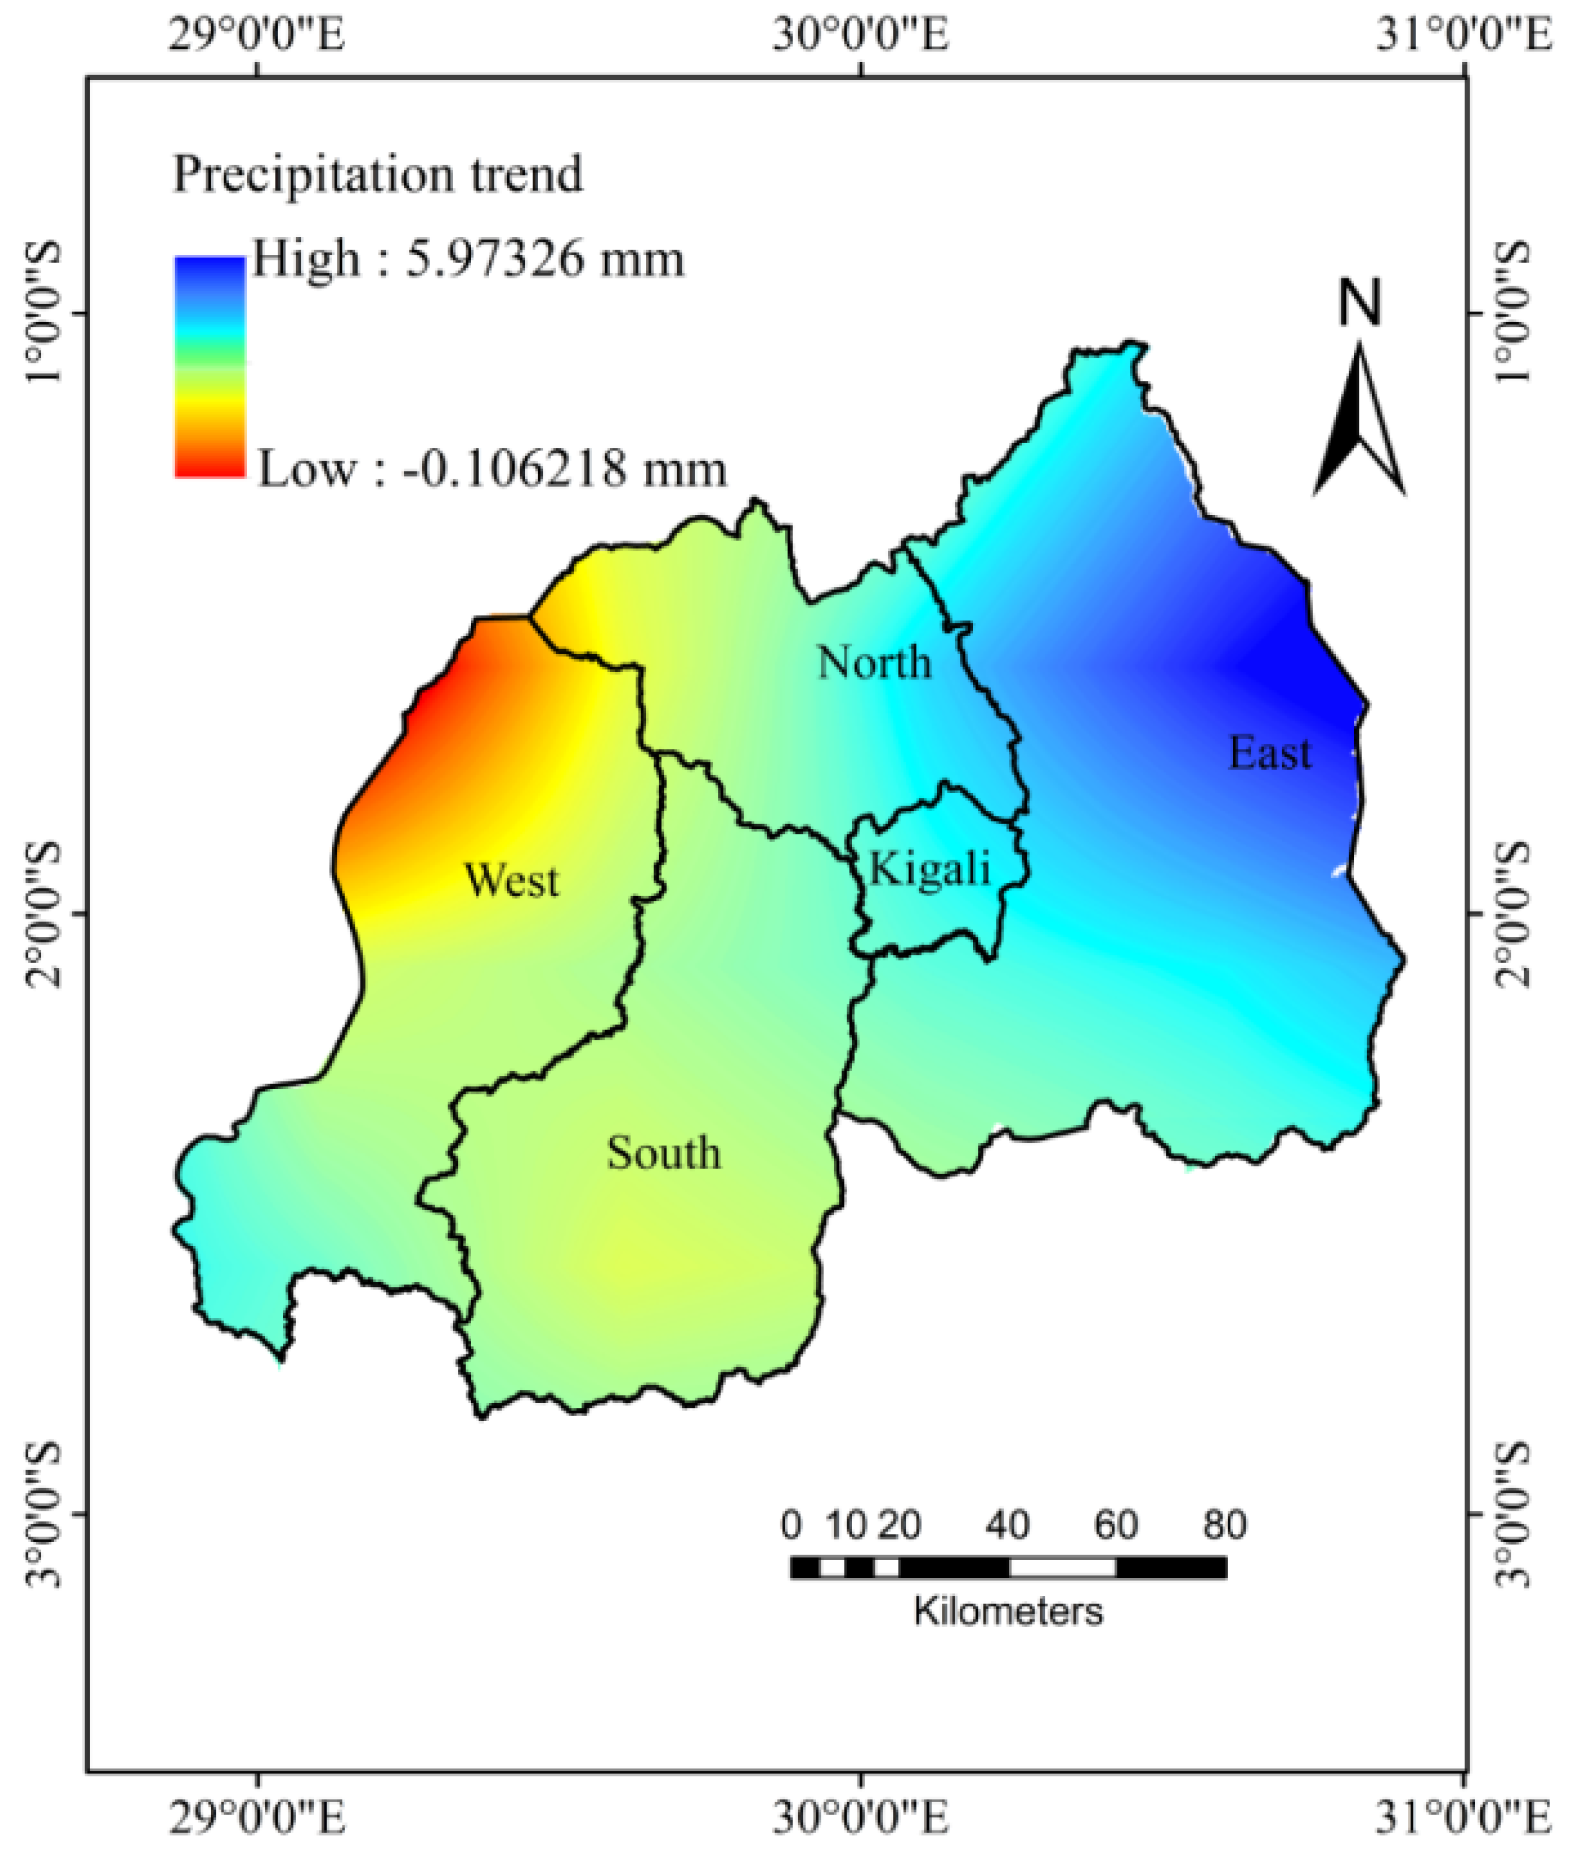
3.3. Investigating on the Rainfall Dynamics through Time Series

The analysis of rainfall distribution patterns over time (Figure 4) reveals that the rainfall trend has not been evenly dispatched over time. Regions marked in blue exhibit strong trends of precipitation increase as opposed to regions marked in red which signify continuous reduction in rainfall amounts over time.
Figure 4. Spatial distribution of the first growing season rainfall change trend in Rwanda, from 1990 to 2014.
Remotesensing 08 00129 g004
Hence, Eastern Province has had considerable positive increases, especially in the districts of Gatsibo and Kayonza, characterized by a seasonal increase which could go as high as 5.9 mm every year. Parts of Nyagatare, Kirehe, Rwamagana and Ngoma in Eastern Province have also manifested the trend of increase, reaching the maximum of 5.9 mm, whereas other parts of those districts experienced moderate increases tending towards the predetermined threshold of 2 mm. Conversely, the Western Province suffered from diminishing trends where precipitation decreased at a rate of −0.1 mm. The district of Rubavu was mostly affected by this reduction. However, the neighboring districts like Ngororero, and Rutsiro underwent similar phenomena. The Northern Province was split by obviously diverging patterns in a sense that districts close to the Western Province (upper Congo Nile ridge, high mountain range in Musanze district) incurred rainfall diminution while districts close to Eastern Province registered moderate rates of increase in rainfall. Although Western Province registered diminishing trends, however, it should be noted that it remains the first region with the highest annual rainfall amounts (about 1600 mm/a) in Rwanda. Also, the Eastern region has been believed to receive the lowest annual rainfalls for decades. The Plains of Bugesera and most part of the central plateau exhibited close to stable rainfall patterns. In Southern Province, the districts of Huye and Gisagara experienced gradually declining rainfall amounts during the first growing season. This pattern (gradual decrease in the west vs. gradual increase in east) may be congruent with the findings of Mxolisi E. Shongwe et al., (2010) who, using the general circulation models (GCMs) prepared for the Intergovernmental Panel on Climate Change (AR4), concluded that there is substantial evidence in support of a positive shift of the whole rainfall distribution in East Africa during the wet seasons, arguing that the models give indications for an increase in mean precipitation rates and intensity of high rainfall events but for less severe droughts [11,25].

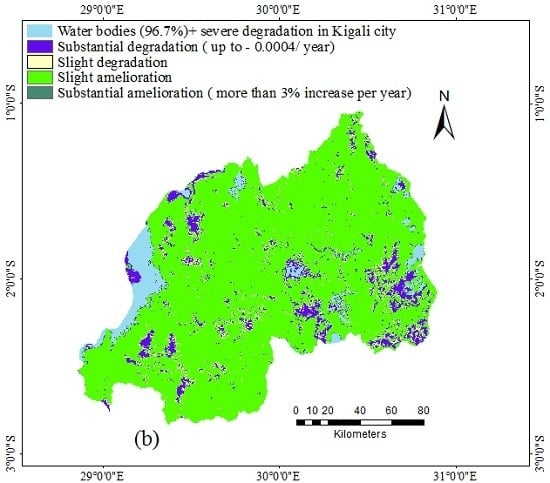
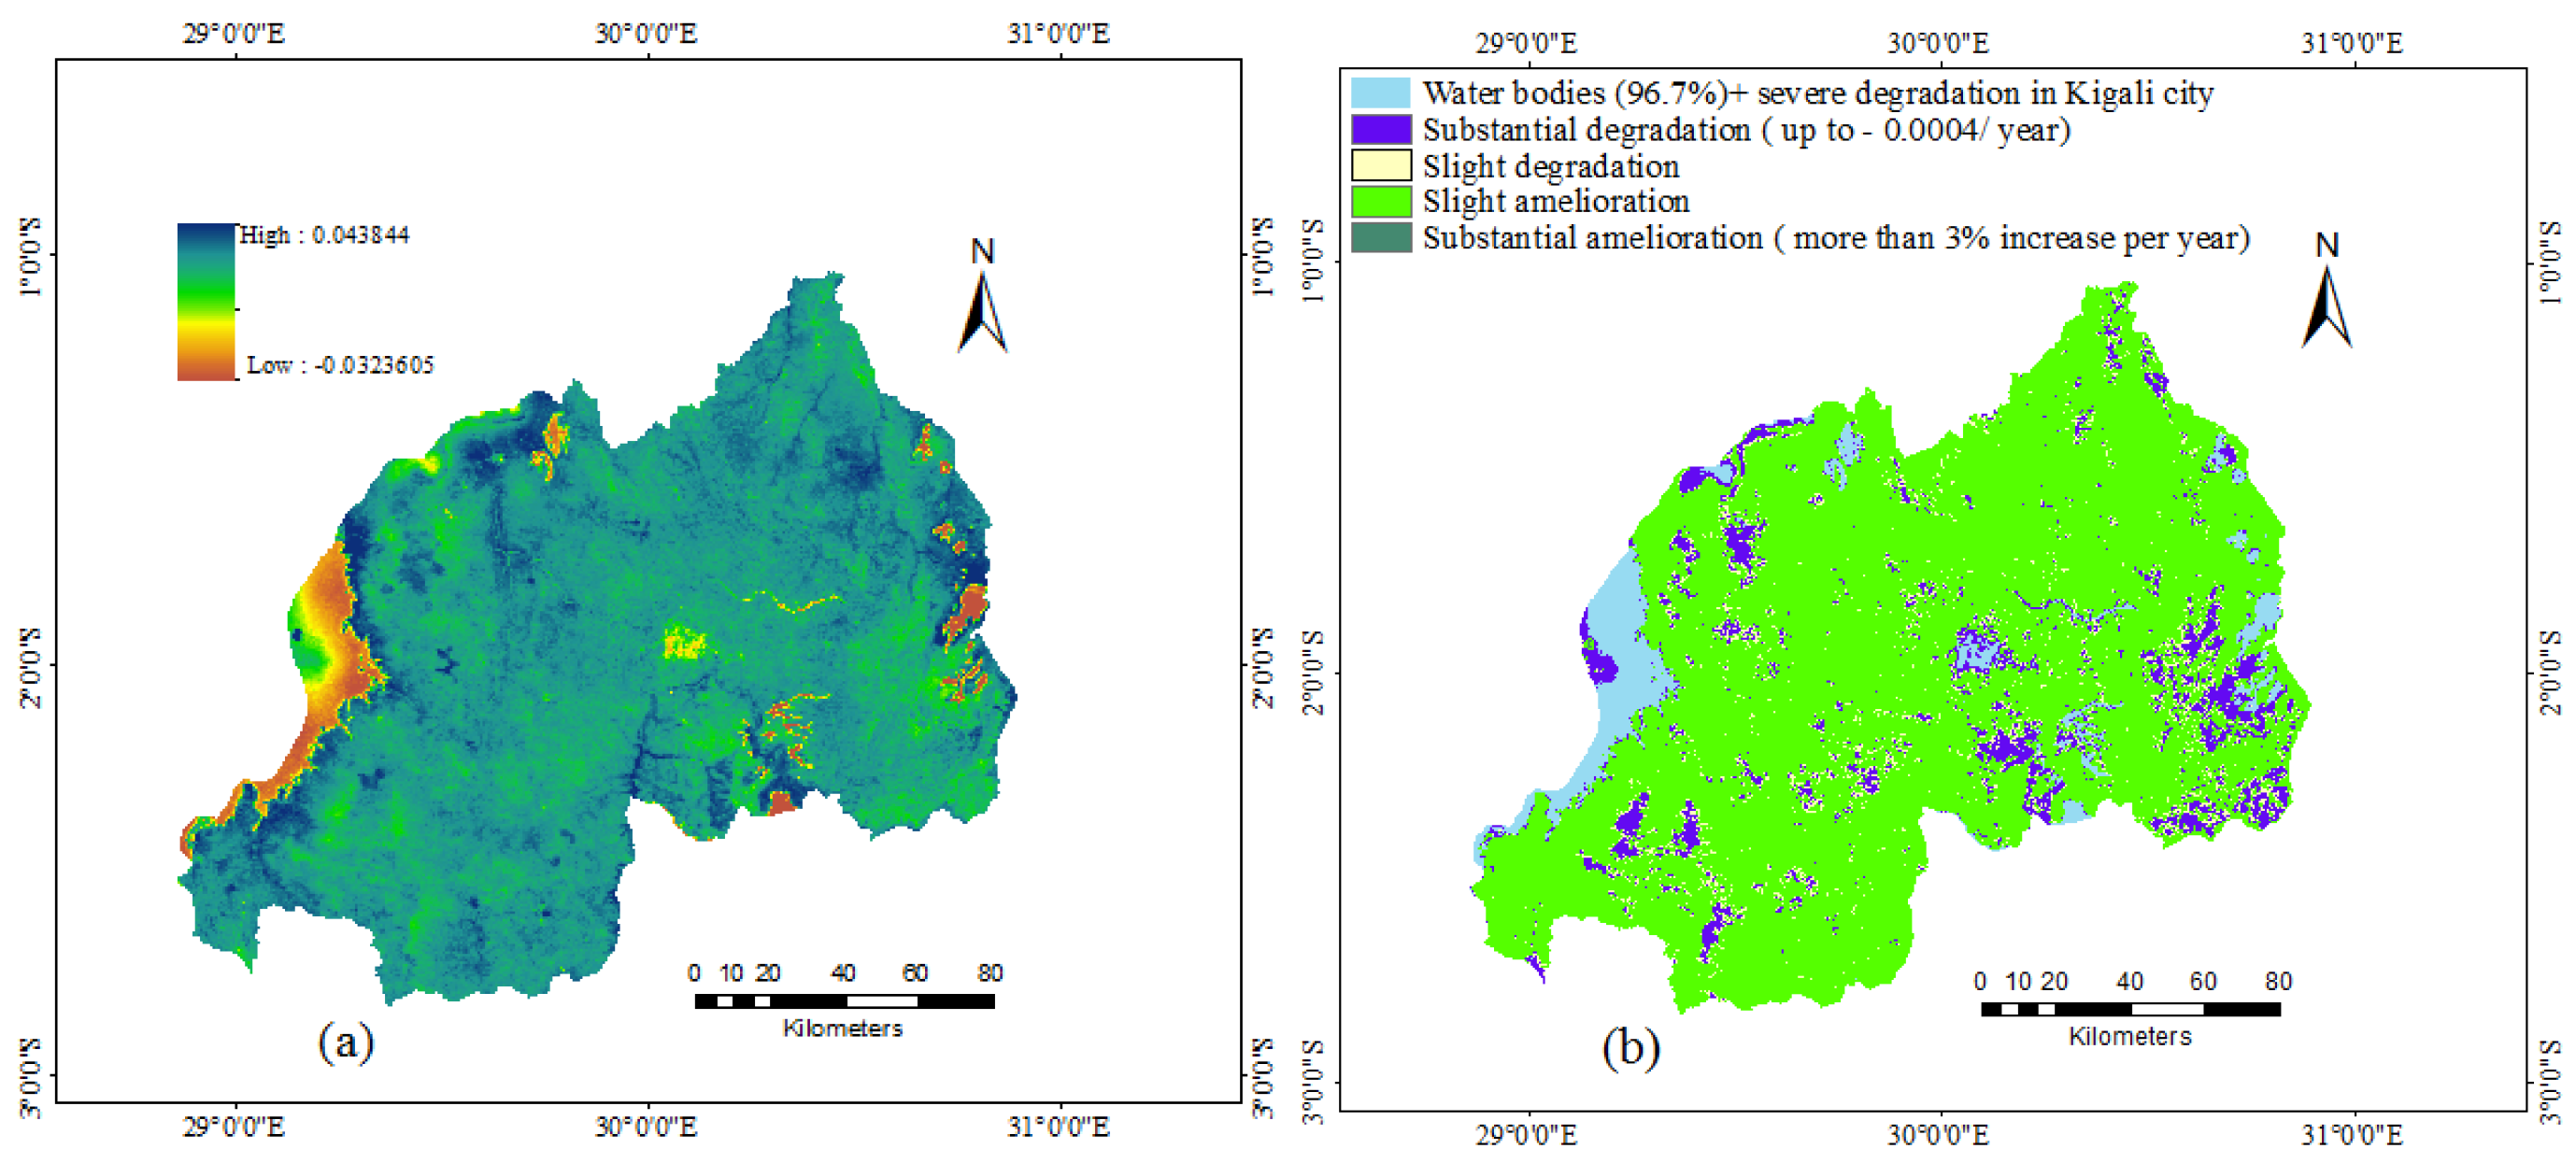
3.4. Analysis of Vegetation Trend Dynamics

The linear trends based on the mean growing season NDVI, represented in Figure 5, confirmed a substantially increasing vegetation growth with annual change rates of 0.043 along the shores of Lake Kivu, parts of Northern Province along the lakes Burera and Ruhondo, and along the shores of Lake Rweru and Ihema in Eastern Province.
Figure 5. Overall trends in growing season vegetation NDVI throughout the study period: In (a) the overall trends are correlated to the annual change rate; in (b), the overall trend has five implications: substantial amelioration, slight amelioration, severe degradation, substantial degradation, and slight degradation.
Remotesensing 08 00129 g005
The results show that since 1990, the vegetation greenness and vigor have been increasing over time in all parts of the country; however, a decreasing tendency observed in some regions is worthy of attention.
Table 2 summarizes the statistical analysis on the status of vegetation conditions in Rwanda, from substantial amelioration (more than 0.03 increase per year) to substantial degradation (up to minus 0.0004 every year). Calculated over the country’s land surface area, 81.3% of the country’s vegetation has improved throughout the study period, while 14.1% of the country’s vegetation degraded, from slight (7.5%) to substantial (6.6%) deterioration.
Table 2. Statistical results of mean growing season NDVI change trend, SNDVI is the change rate of the mean growing season NDVI from 1990 to 2014.
SNDVIVariation TypeArea Percentage (%)
≥0.03Substantial amelioration1.281.3
0.0004–0.03Slight amelioration80.1
−0.0004–0.0004Substantial degradation6.614.1
−0.006–(−0.0004)Slight degradation7.5
≤−0.006Lakes + severe degradation in Kigali4.64.6

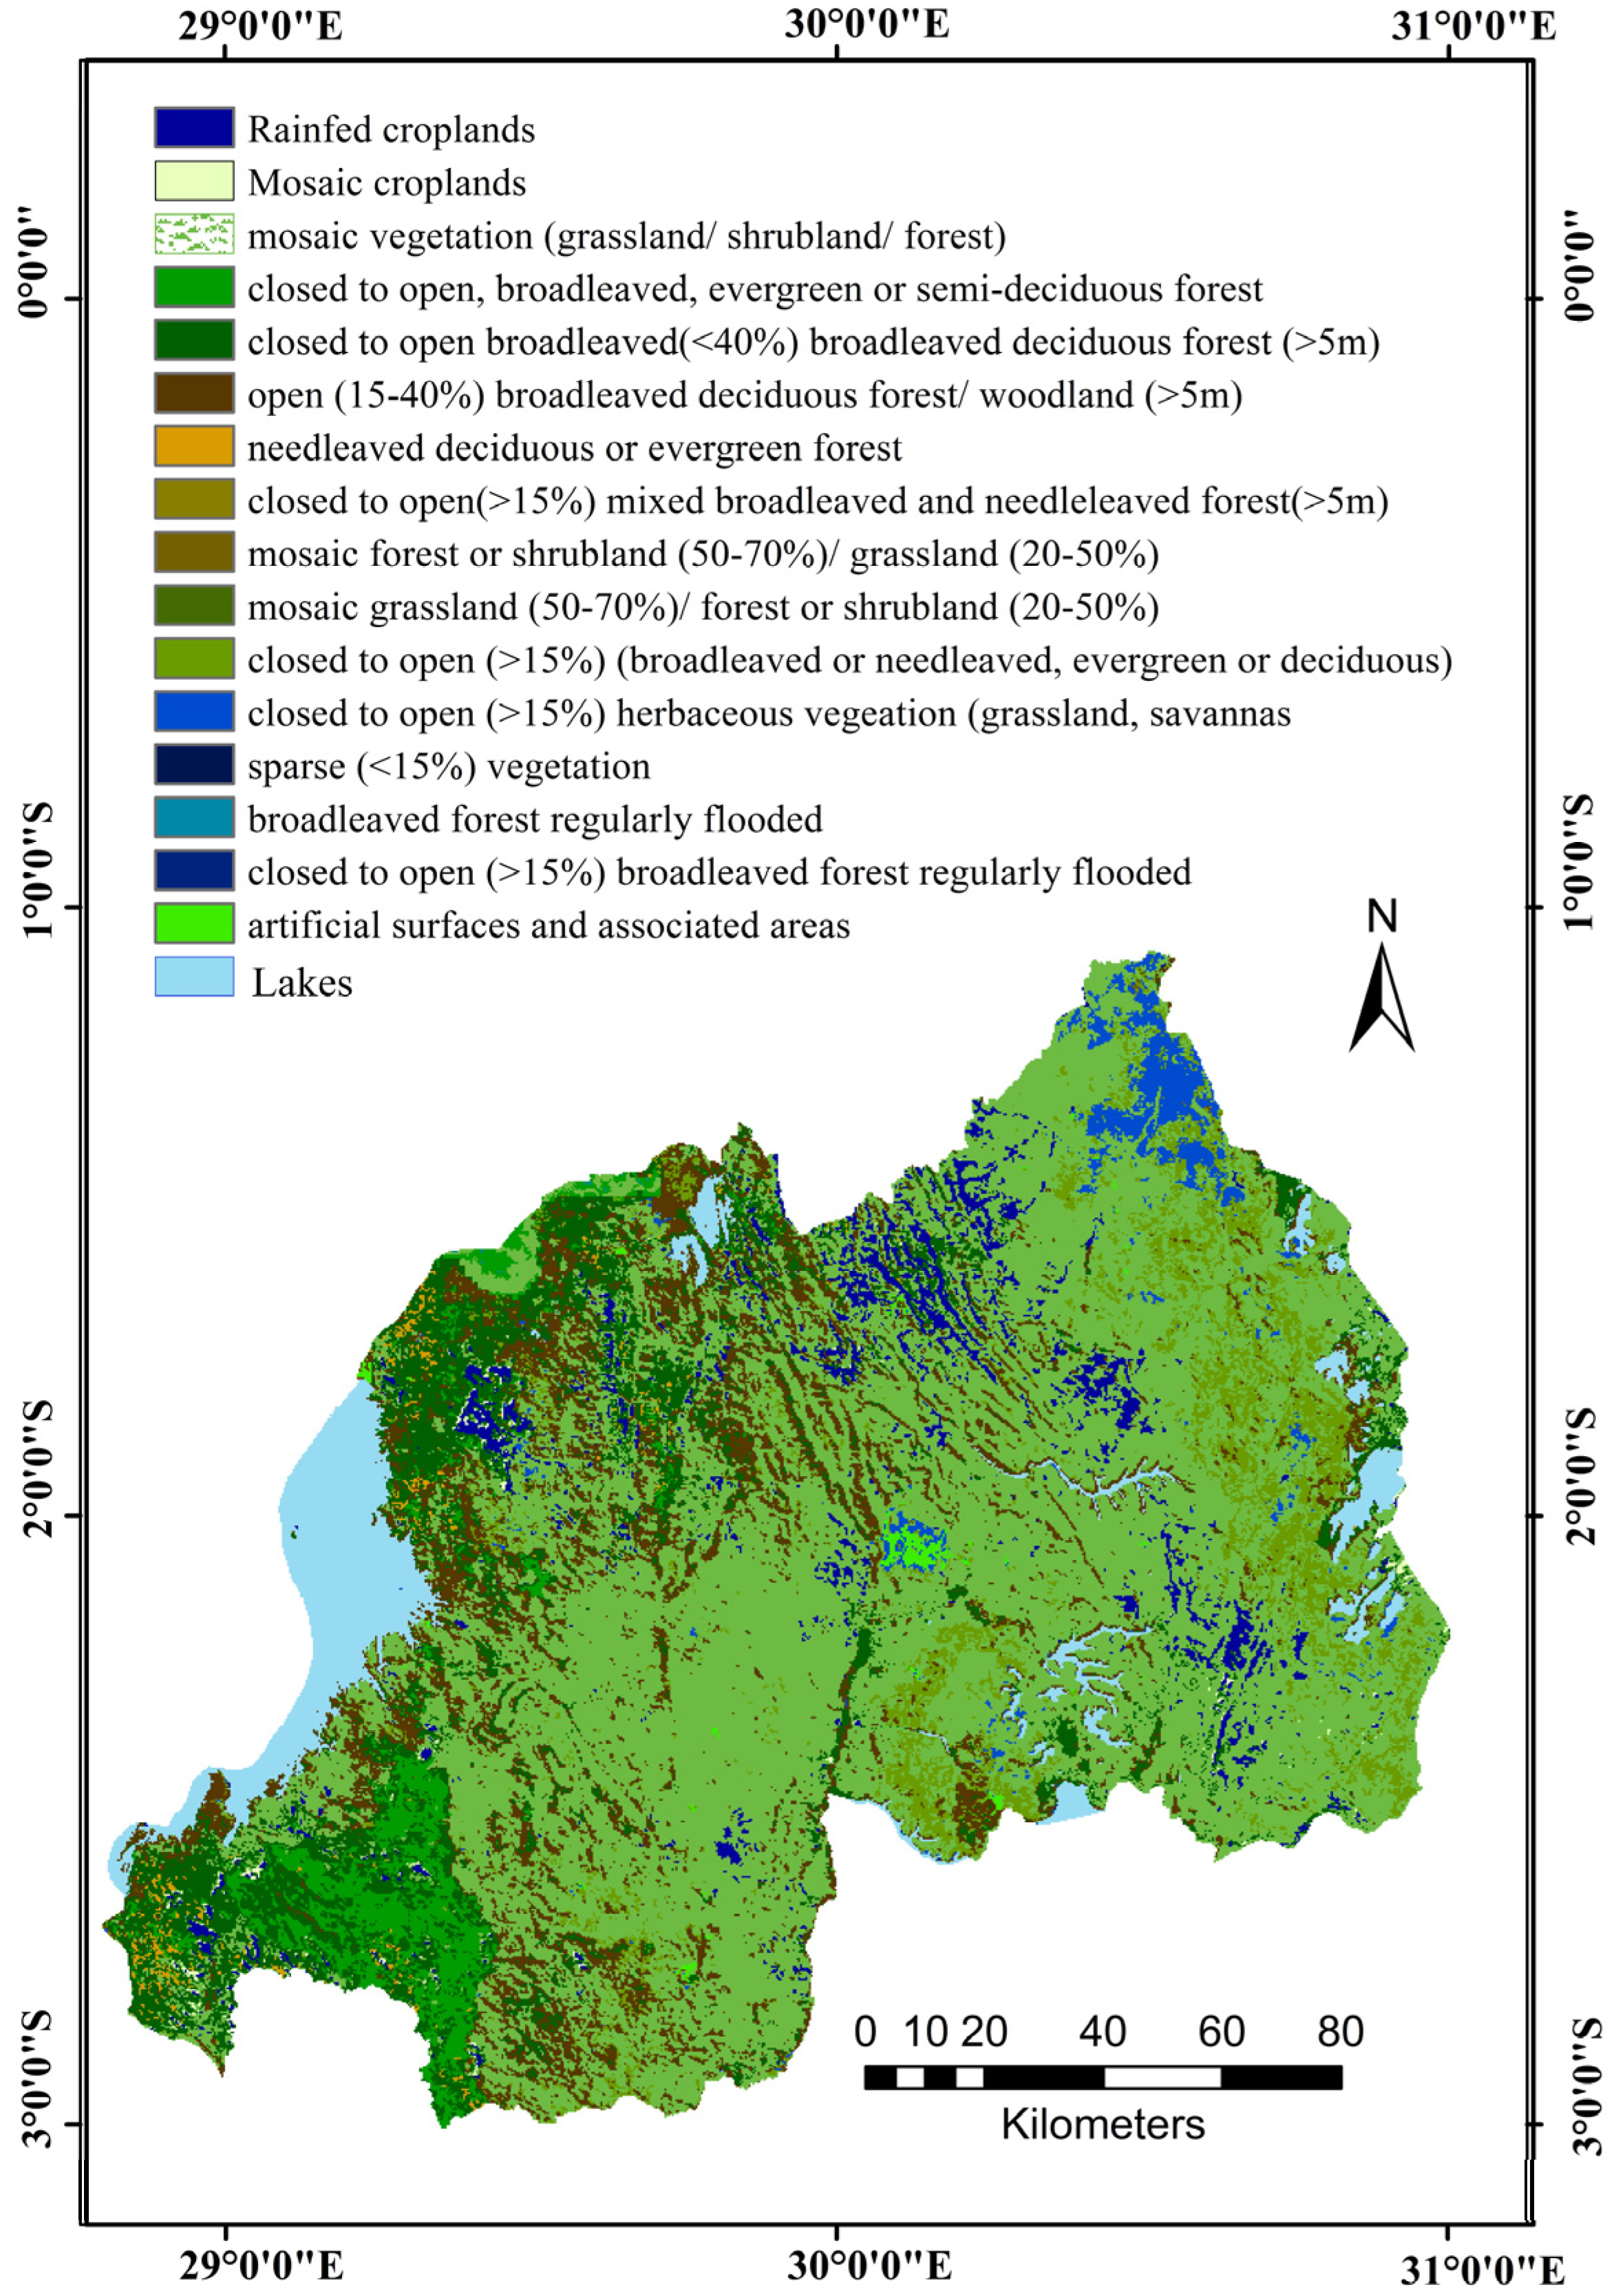
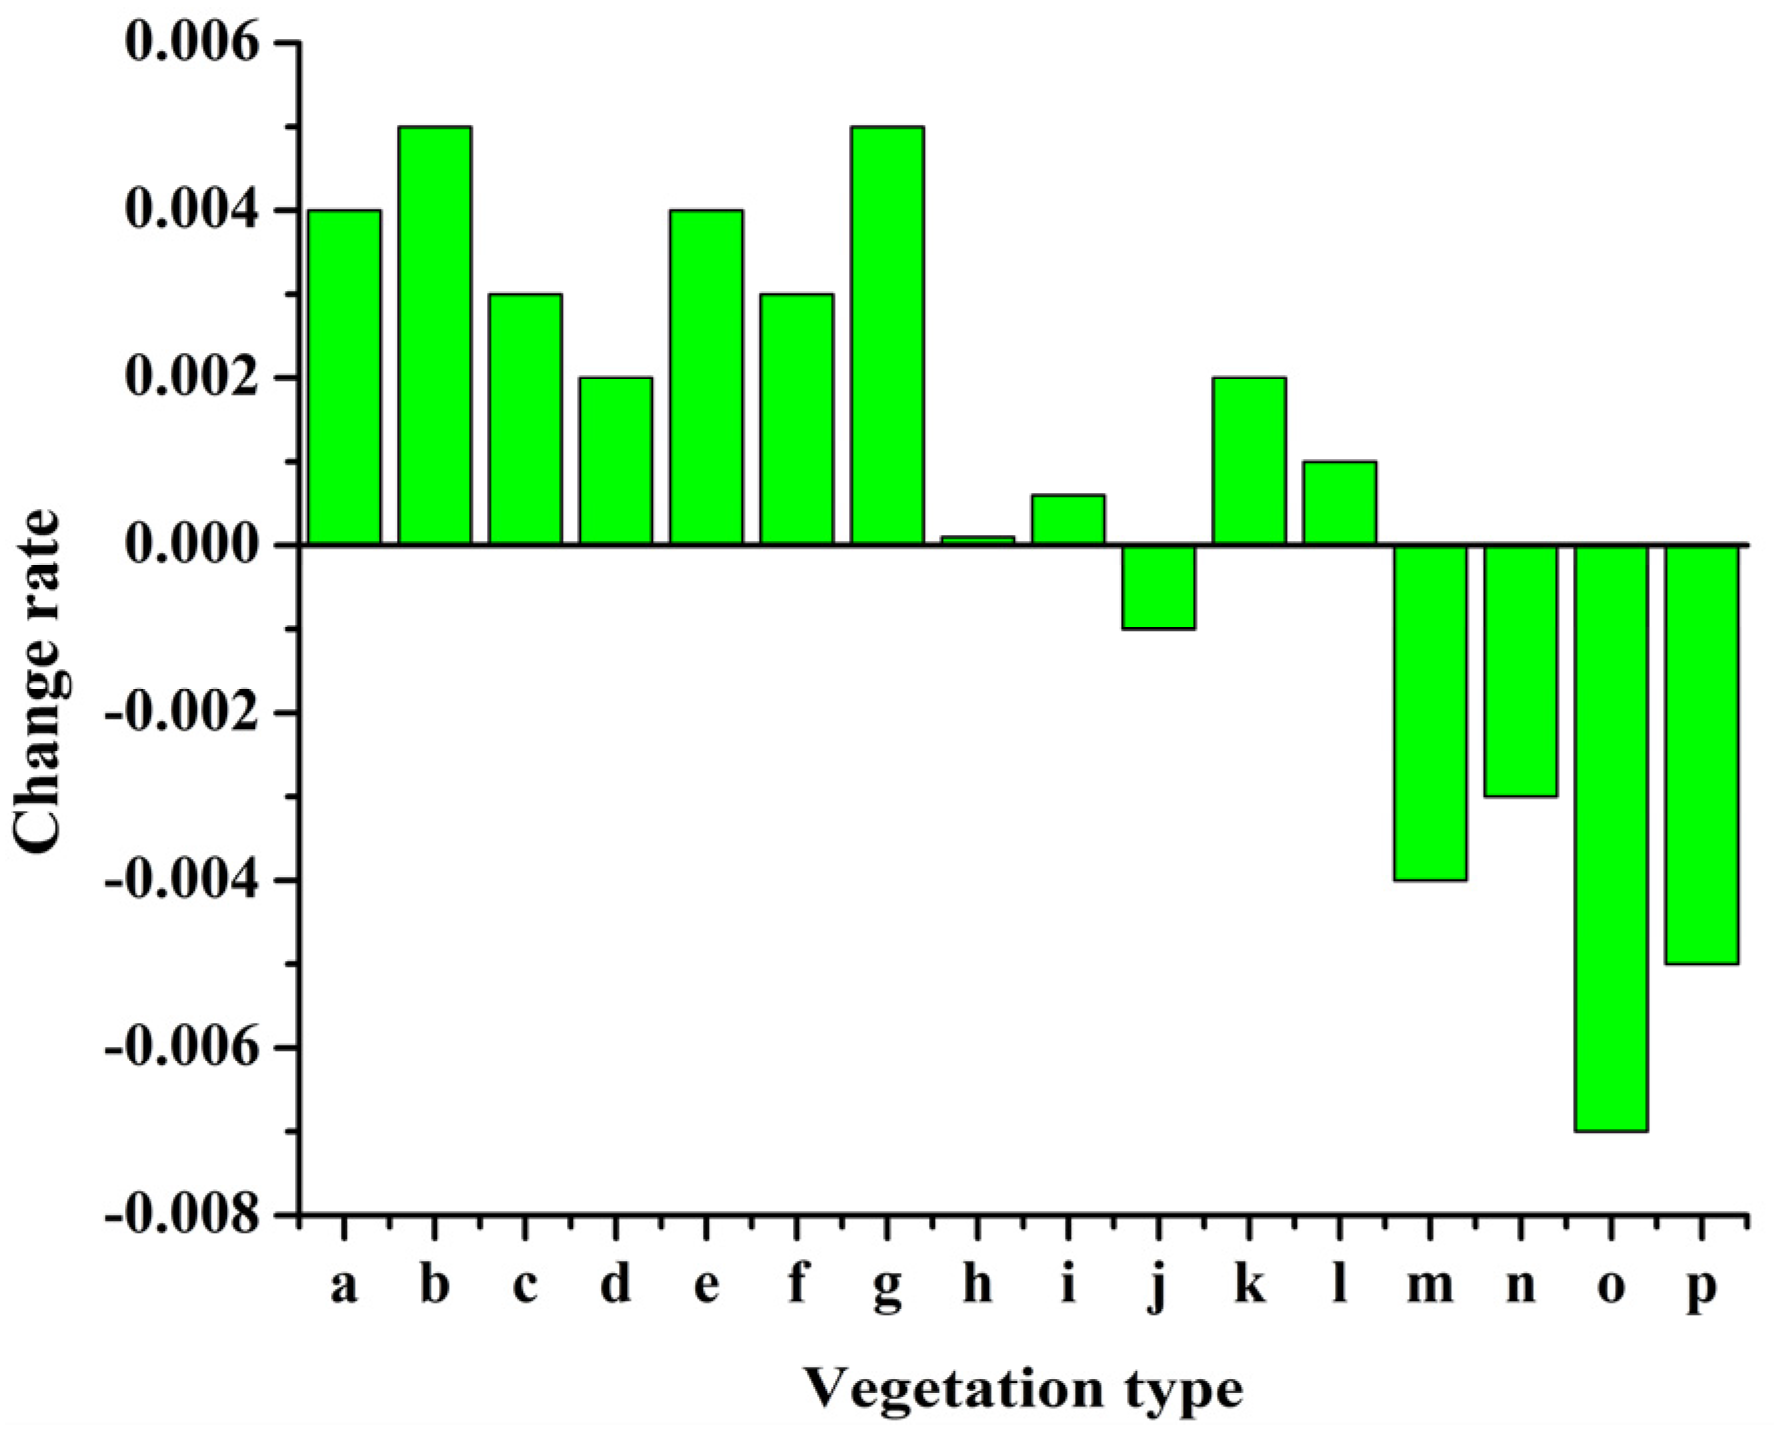
3.5. Change Status per Vegetation Type

The figure beneath (Figure 6) illustrates the annual average changes in vegetation NDVI per vegetation type. It can be concluded that five types of vegetation, with average slope values falling within the negative range, are seriously endangered in Rwanda: The mosaic grassland/forest or shrubland was severely degraded, followed by sparse vegetation, grassland or woody vegetation regularly flooded or waterlogged soil, artificial surfaces and broadleaved forest regularly flooded (semi-permanently or temporarily).
Figure 6. Average annual change rate (year−1) per type of vegetation since 1990 through 2014.
Remotesensing 08 00129 g006
where,
  • a: Rainfed croplands
  • b: Mosaic cropland (50%–70%)/vegetation (grassland/shrubland/forest) (20%–50%)
  • c: Mosaic vegetation (grassland/shrubland/forest) (50%–70%)/cropland (20%–50%)
  • d: Closed to open (>15%) broadleaved evergreen or semi-deciduous forest (>5 m)
  • e: Closed (>40%) broadleaved deciduous forest (>5 m)
  • f: Open (15%–40%) broadleaved deciduous forest/woodland (>5 m)
  • g: Open (15%–40%) needleleaved deciduous or evergreen forest (>5 m)
  • h: Closed to open (>15%) mixed broadleaved and needleleaved forest (>5 m)
  • i: Mosaic forest or shrubland (50%–70%)/grassland (20%–50%)
  • j: Mosaic grassland (50%–70%)/forest or shrubland (20%–50%)
  • k: Closed to open (>15%) (broadleaved or needleleaved, evergreen or deciduous) shrubland (<5 m)
  • l: Closed to open (>15%) herbaceous vegetation (grassland, savannas or lichens/mosses)
  • m: Sparse (<15%) vegetation
  • n: Closed to open (>15%) broadleaved forest regularly flooded (semi-permanently or temporarily)—Fresh or brackish water
  • o: Closed to open (>15%) grassland or woody vegetation on regularly flooded or waterlogged soil—Fresh, brackish or saline water
  • p: Artificial surfaces and associated areas (Urban areas >50%)

3.6. Consistency of Trends in Vegetation Dynamics
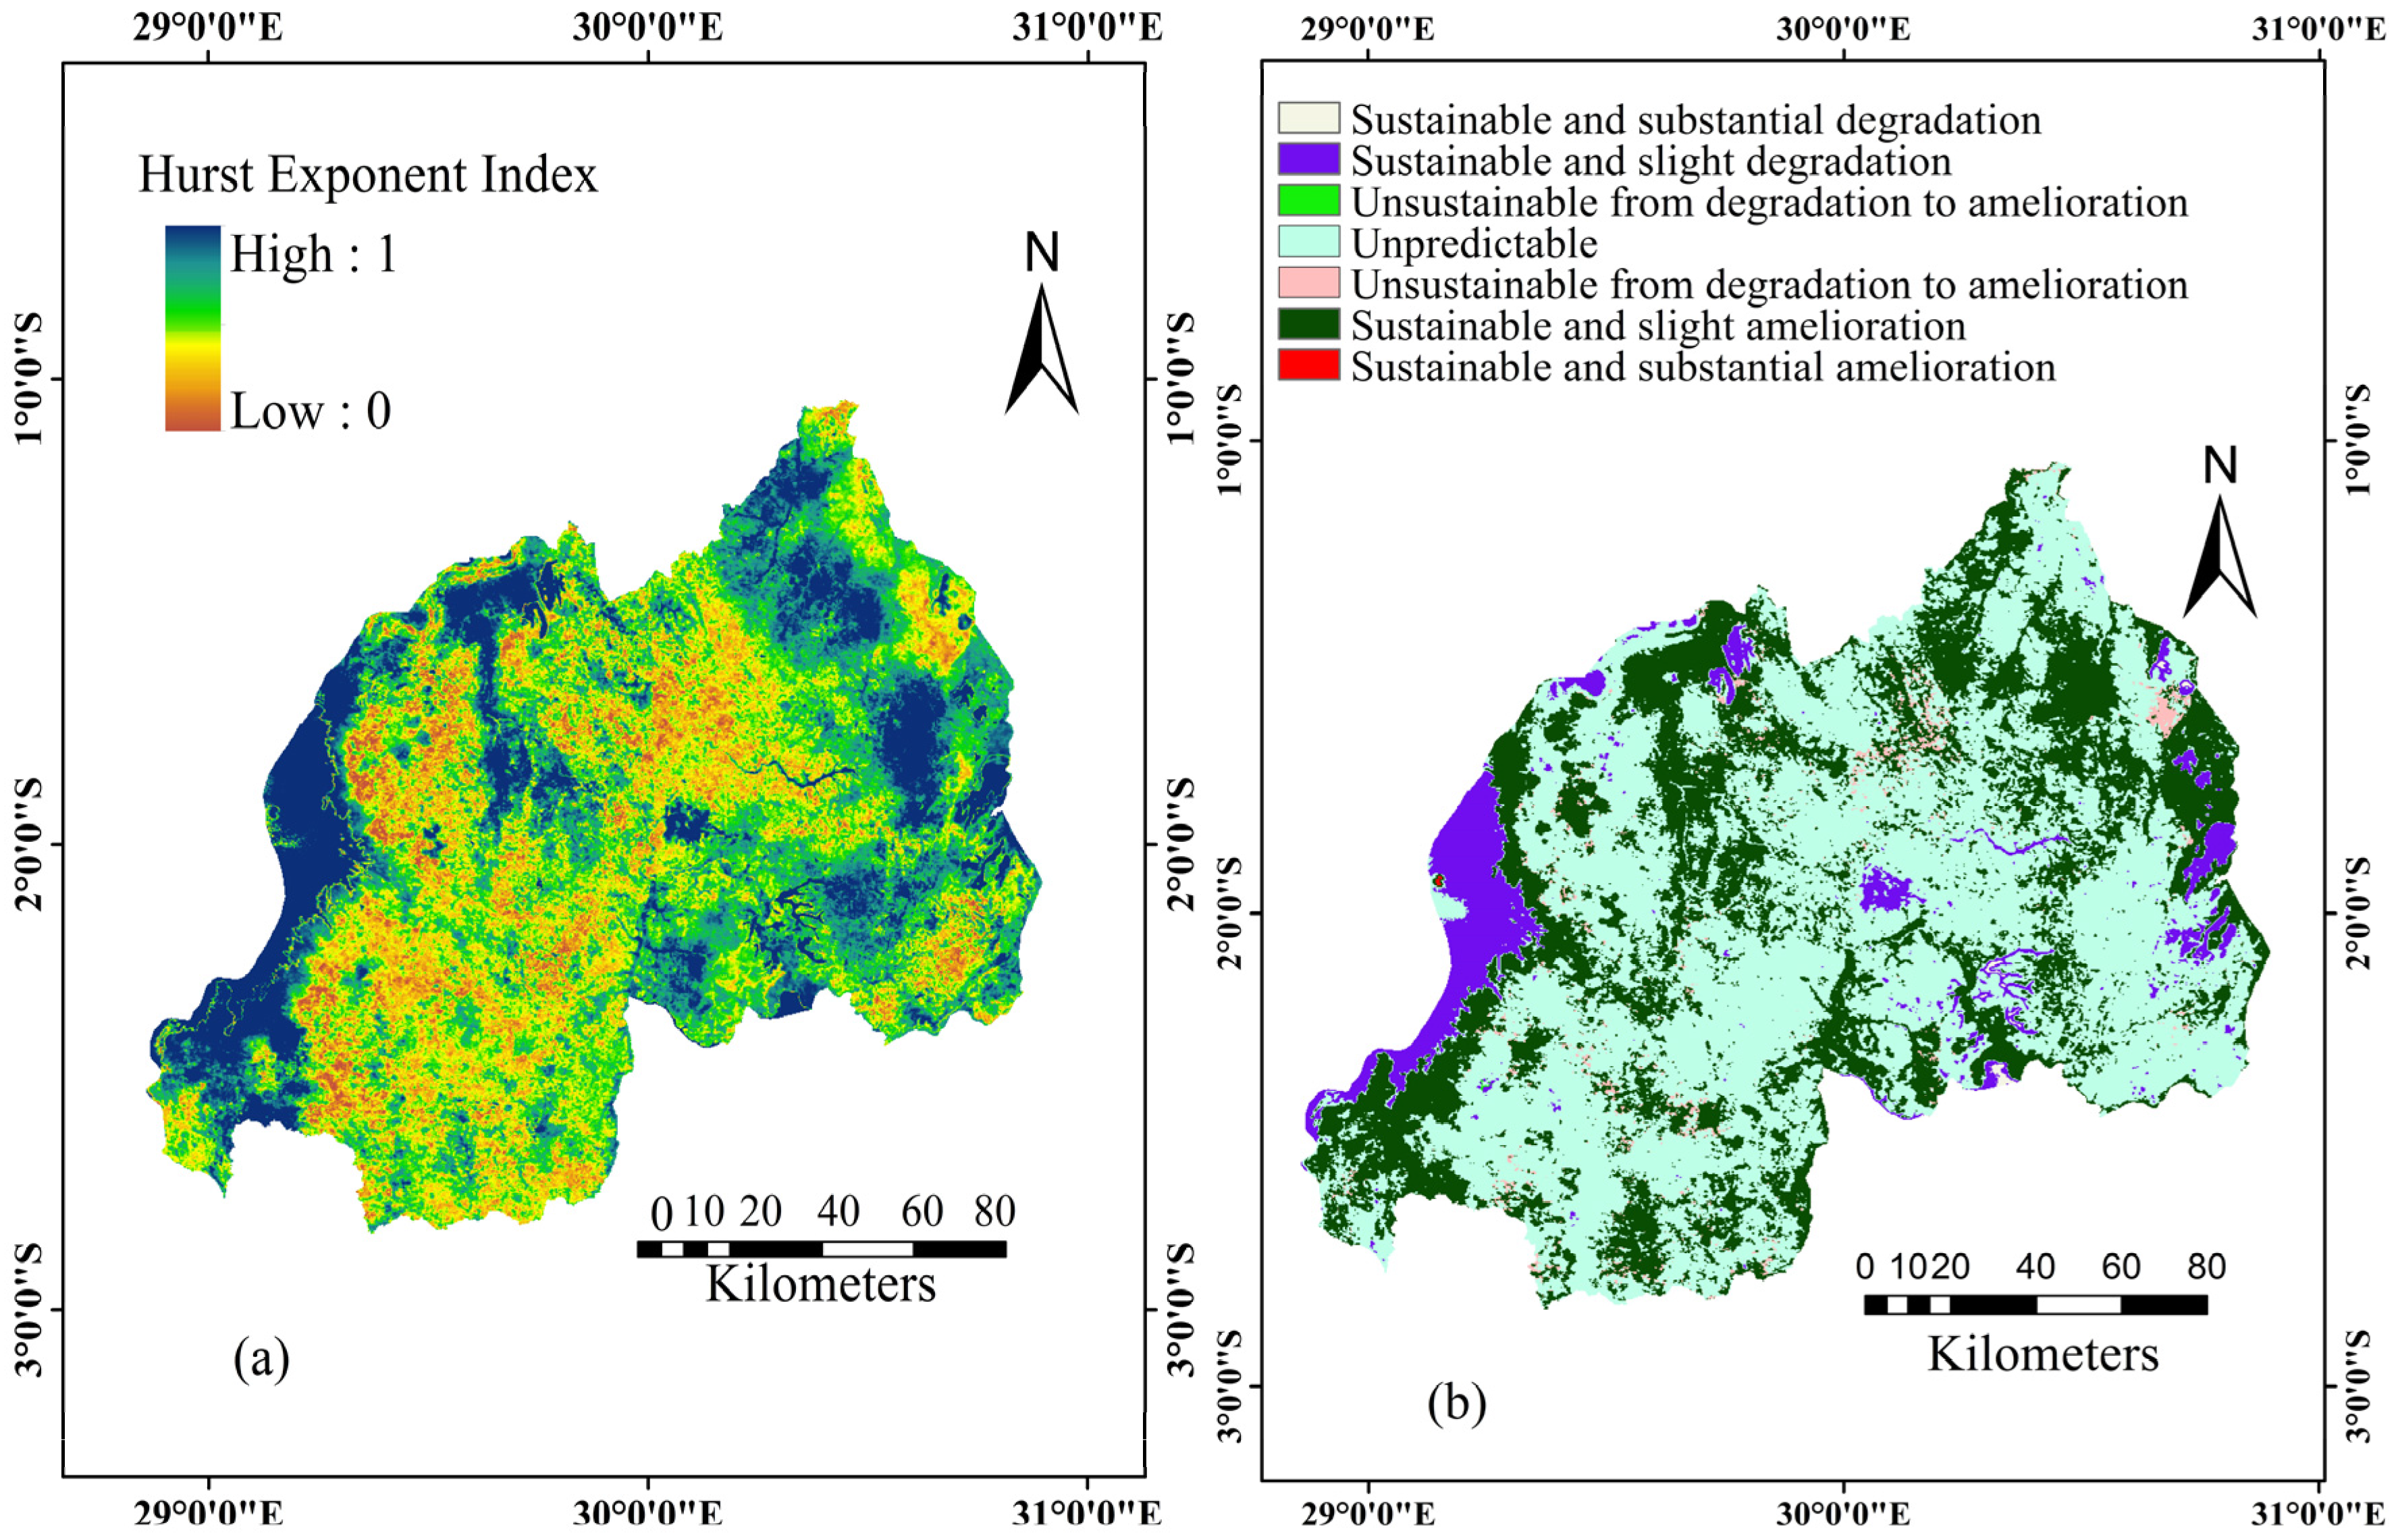
The figure below (Figure 7) displays visible information on the sustainability of the trends. The slope map and the Hurst exponent superimposed give a potential view of vegetation growth patterns in the future. Hence, we can predict that artificial surfaces and urban area vegetation may continue to degrade, as they present the same characteristics as water bodies which are generally stable, having no vegetation to account for.
Figure 7. (a) Spatial distribution of Hurst exponent and (b) sustainability of the mean NDVI in the first growing season in Rwanda from 1990 to 2014; In (b), the Hurst and the slope image results have been superimposed.
Remotesensing 08 00129 g007
The table below (Table 3) indicates the statistical analysis of change predictions as visually represented in Figure 7 above.
Table 3. Contrast between vegetation NDVI change trend and the Hurst exponent.
SNDVIHurstVariation TypePercentage (%)
≥0.03>0.5Sustainable and substantial amelioration0.01
0.0004–0.03>0.5Sustainable and slight amelioration28.027
>0.0004<0.5Unsustainable, from degradation to amelioration0.1
0.0004–0.03≈0.5Unpredictable (Brownian time series)58.18
<−0.0004<0.5Unsustainable, from amelioration to degradation1.57
−0.03–0.0004>0.5Sustainable and slight degradation6.17
<−0.03>0.5Sustainable and substantial degradation0.008
--Lakes, rivers, artificial surfaces5.935
The Hurst exponent index allows us to ascertain the consistency of observed trends. In this particular study, the results indicate that the large area falls within the unpredictable range (58%) as the Hurst exponent fails to distance itself from 0.5. This implies that the trend may positively sustain, reverse or randomly fluctuate in the future. Moreover, 6.17% of the area under investigation presented a sustainable trend of slight degradation as seen in the figure above (Figure 7b). A portion of 0.1% exhibited a positive trend from degradation to amelioration, although this trend has been found unsustainable. Additionally, 28.027% of the area under investigation has been found promising with sustainable slight amelioration. These pixels were mainly located along the shores of Lake Kivu, lowlands of the eastern savannah; and an overwhelming majority was widely dispersed across the country. Although 1.57% of the area under investigation was found to have improvement patterns, it is predicted to degrade unsustainably in the future.

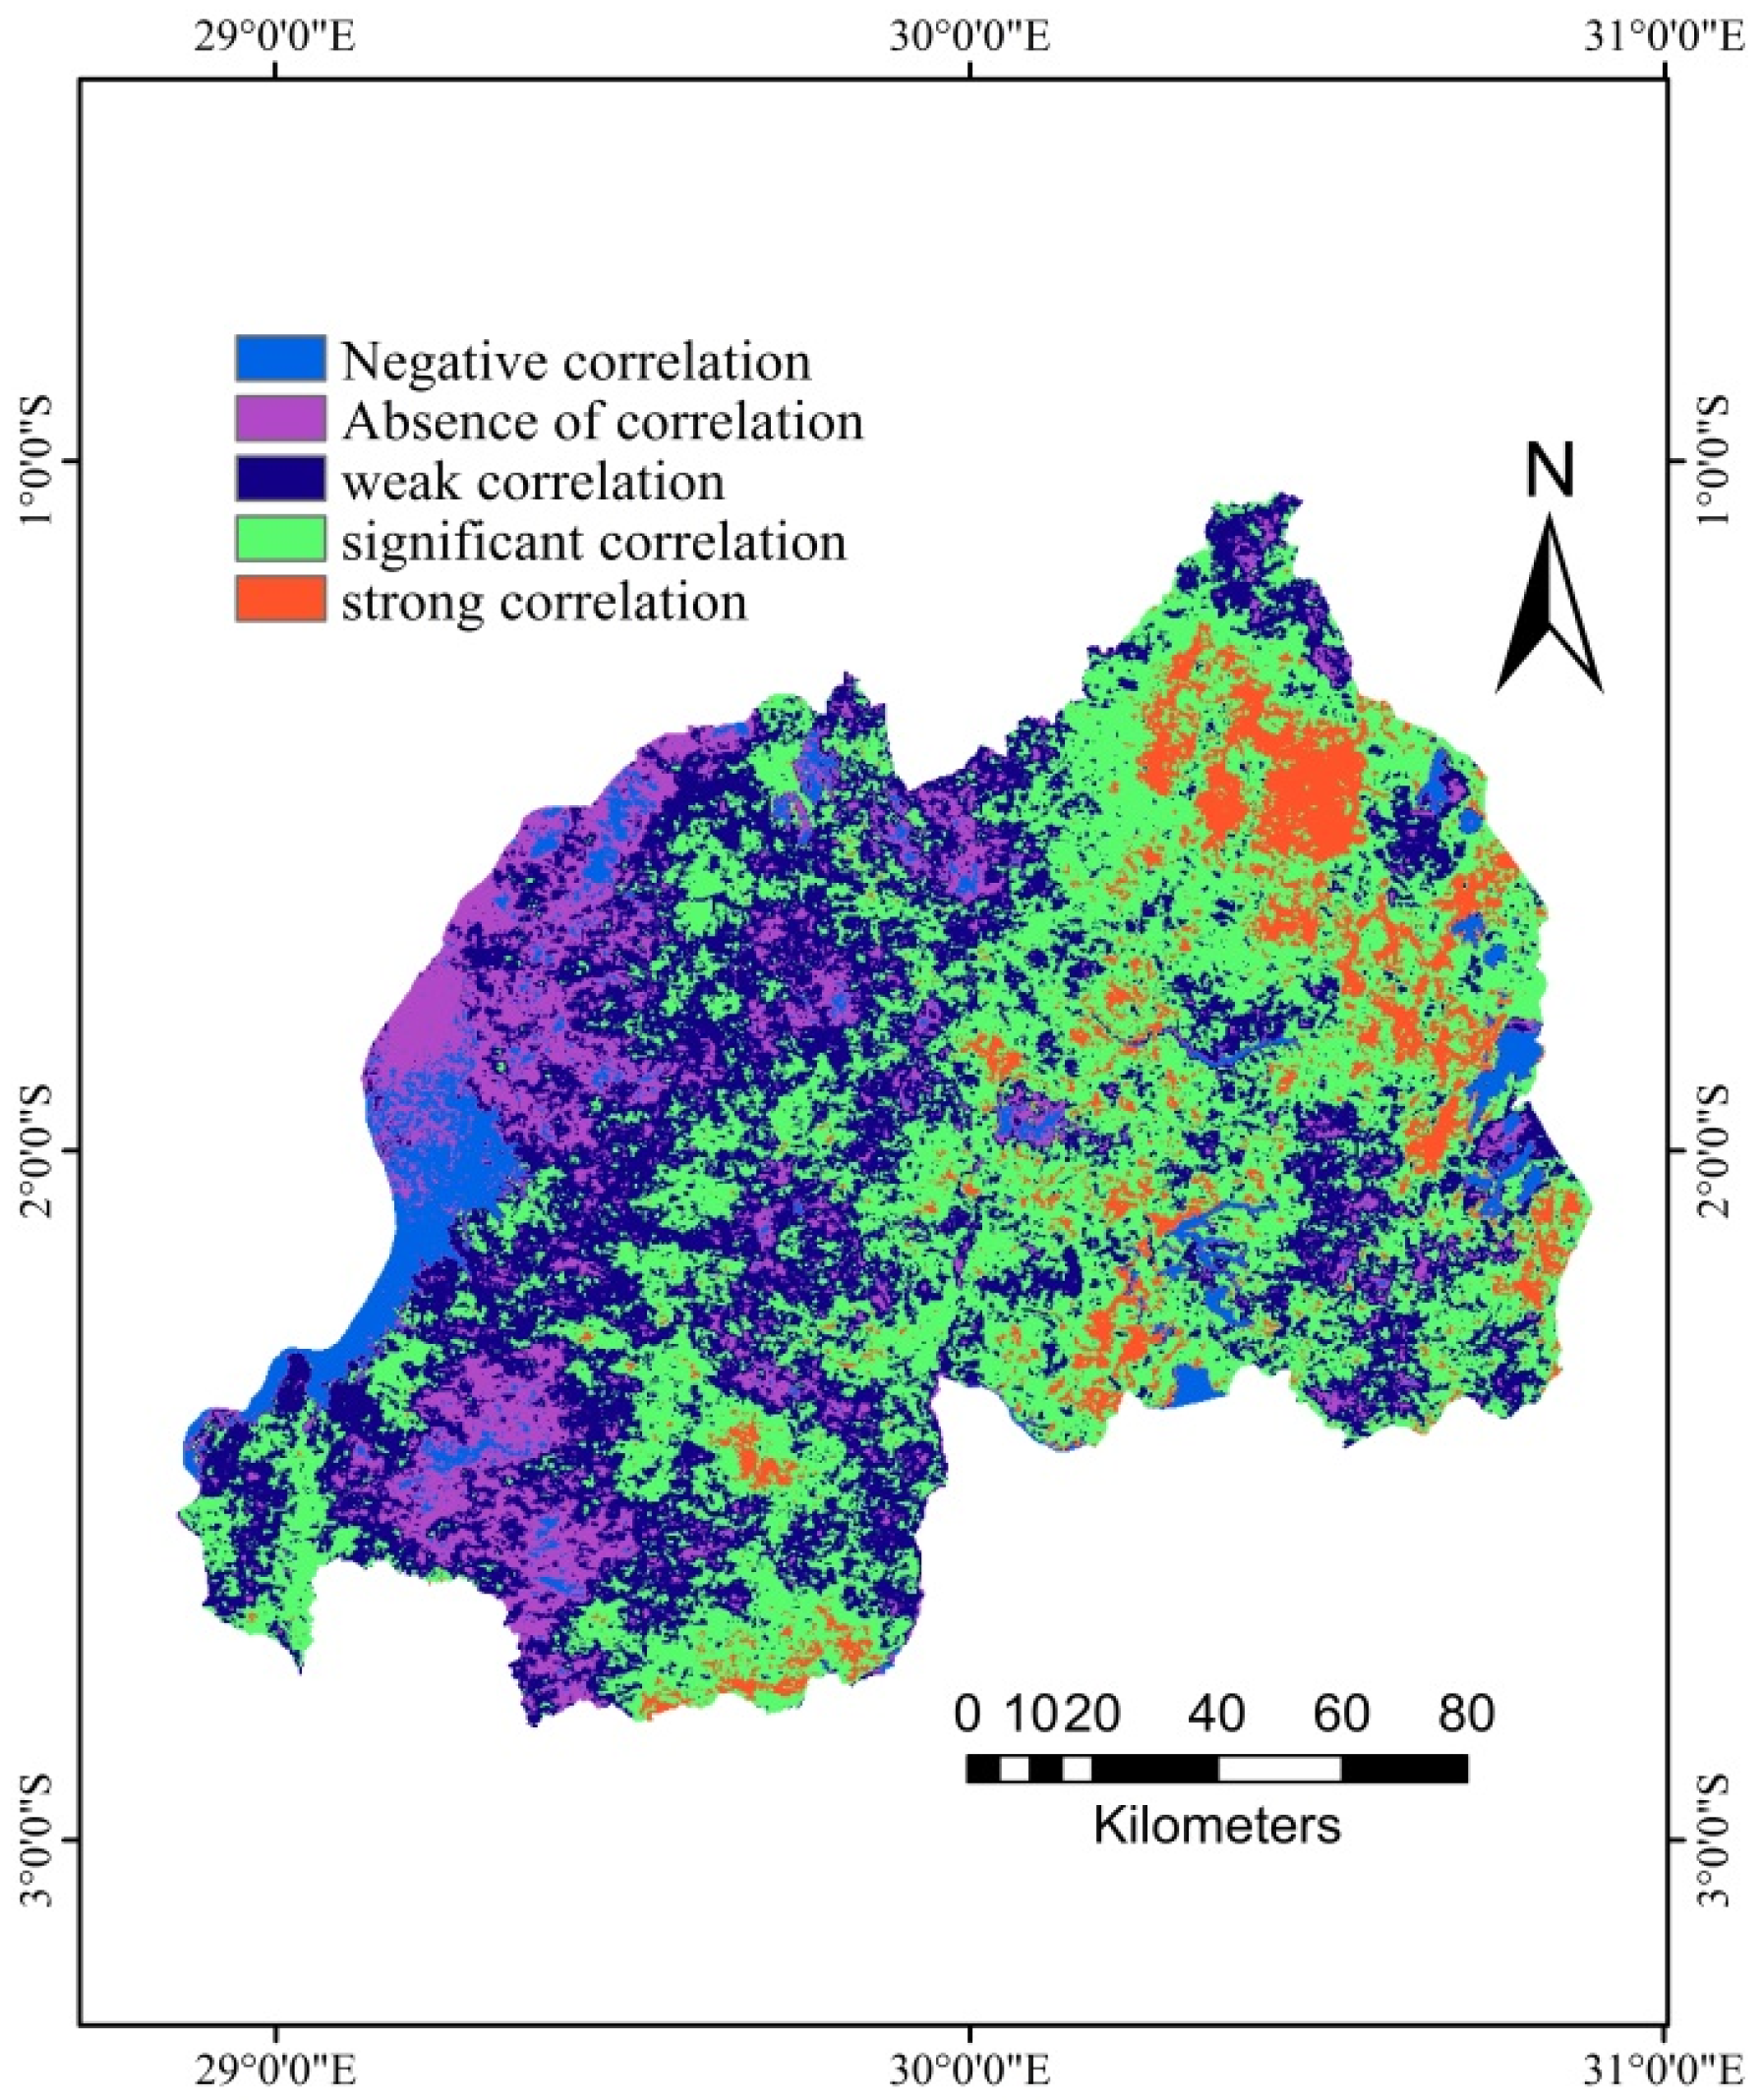
3.7. Spatial Analysis of the Correlation between Mean GS NDVI and Precipitation in Rwanda

The establishment of the relationship between NDVI and rainfall has several applications. For instance, models of crop and vegetation growth or primary productivity are often based on rainfall [26]. The relationship between both can also determine the sensitivity of various vegetation formations to climate variability [27]. Here, we present the spatial analysis of correlation between rainfall and different vegetation types in Rwanda.
The spatial analysis of correlation between the two variables (Figure 8) has highlighted that mean GS NDVI is better correlated with precipitation in low plains of Eastern Province than in high altitude regions of the Congo Nile ridge. The negative correlation was found over lakes and rivers, although significant portions of urban and artificial surfaces are still worthy of attention, especially in Kigali City. Additionally, the discrepancy between different vegetation types’ responses to precipitation has attracted our attention. It has been discovered that “closed to open (>15%) broadleaved or needleaved, evergreen or deciduous shrubland (<5 m)” was best correlated with precipitation, manifesting up to 80% degree of correlation, while “closed (>40%) broadleaved deciduous forest” and “closed to open, broadleaved evergreen or semi-deciduous forest” had no correlation with precipitation. A significant correlation has been observed for “sparse vegetation,” “rainfed croplands” and “mosaic croplands/vegetation,” whereby the degrees of correlation go up to 71%, 69% and 60%, respectively ( ρ < 0.05 ). A weak correlation has also been detected in areas occupied by “closed to open (>15%) mixed broadleaved and needleaved forest (>5 m), mosaic forest or shrubland.” As previously asserted, the analysis of correlation by vegetation types may lead to a conclusion that forest areas were not correlated with the first growing season precipitation amounts throughout the study period.
Figure 8. Spatial distribution of the correlation coefficient between NDVI and rainfall.
Remotesensing 08 00129 g008

4. Discussion

4.1. Statistical Analysis of Mean Growing Season NDVI Evolution Since 1990

An increase in average NDVI has been found in all provinces of the country, from 1990 until 2014. Attention has been drawn to the peculiarity of the year 1994, whereby the mean GS NDVI value catapulted to far exceed the previous and the following years’ values, even though precipitation amounts did not significantly increase in comparison with both intervening years. Historical events may assist in explaining the phenomenon. During this period, the country was barely getting back on track, wrestling with the aftermath of war and genocide against the Tutsis occurring from April through July, 1994. Vast areas were depopulated and farmlands abandoned, leading to the robustness of vegetation. This has been further reported by Maxime Rwaka in his work on the impacts of genocide against the Tutsis in the Rusizi district (959 km2) [28]. Although he reports a decrease in NDVI values, his explanation to the findings agrees with our analysis as he states that the decrease observed was mainly caused by the concentration of over 1,000,000 refugees fleeing to the neighboring country, DRC (Democratic Republic of the Congo) [28].

4.2. Investigating on the Correlation between Rainfall and Mean Growing Season NDVI

The results have revealed that both significant and strong correlations between trends in NDVI and trends in precipitation were largely situated in Eastern Province (Figure 8). However, the lack of correlation detected in large parts of the Kirehe and Kayonza districts deserves proper attention. The highlands of Bubereka had weak correlations since the observed decreasing patterns did not result in conforming vegetation dynamics. In cities like Kigali, a negative correlation has been largely observed. This suggests that urban areas containing more anthropogenic activities had had a negative effect on vegetation density [28]. This study has also shown that forests (broadleaved, evergreen, deciduous or semi-deciduous areas) had little to no correlation with the mean first GS rainfall in Rwanda, whereas the category “closed to open (>15%) broadleaved or needleaved, evergreen or deciduous shrubland (<5 m)” was strongly correlated with precipitation.

4.3. On the Variability of Mean GS NDVI throughout the Growing Season

From the results of this study, it has been found that vegetation NDVI increased along the growing season time gradient. Low NDVI values were found at the commencement of the GS, and they increased as the season advanced. This result is consistent with the findings of Mkhabela et al., 2005 who argued that NDVI values from healthy vegetation will typically increase as plant cover sprawls at the beginning of the growing season, reaching their peak at the middle of the growing season [3,29]. Moreover, La et al., in their work entitled “Analysis of the Relationship between MODIS NDVI, LAI, and Rainfall in Three Regions of Rwanda,” confirmed the decrease in mean NDVI values as the growing season ends [30]. Our results, however, suggest no decrease in NDVI values towards the end of the growing season. This may be due to the difference in time and scope of these previous studies. The study carried out by La et al., reported a decrease towards the end of the GS because their study was confined to the second growing season (mid-February through early June), a season followed by the long dry season (summer) in Rwanda, with little rainfall.

4.4. Analysis of Vegetation Trend Dynamics

By analyzing the year-to-year fluctuations of a time series, it is possible to reveal and quantify variations over the observation period. The direction of change is determined through the analysis of the slope value [31]. According to Jacquin et al., 2010, trends statistically different from a null trend are assumed to be a measure of degradation of the vegetation cover. Trends with non-significant (null) slope values represent stable areas, whereas trends with positive or negative slope values are respectively associated with progressive or regressive vegetation dynamics [32]. The results of this study have indicated that over 81% of the area under investigation presented good signs of amelioration. This is consistent with Jacquin’s findings when a similar study was conducted in Madagascar, asserting that areas not affected by vegetation cover degradation were dominant [32].
In Rwanda’s case, the observed amelioration may lead to a favorable evaluation of the recent governmental efforts to improve environmental sustainability and the establishment of the Rwanda Environment Management Authority (REMA), as a governmental body responsible for overseeing and protecting the environment. Most of the pixels with significant degradation have been detected in Eastern Province, especially the districts of Bugesera, Kirehe and Kayonza. The region is ravaged by recurrences of drought, particularly in Bugesera, an area once pressured by an unprecedented boom in population, especially after the war and genocide in 1994 as many returnees had to be reintegrated and provided with resources to sustain their lives. Due to land shortages, in 1997 the western boundary of the Akagera National Park was reassigned and much of the land allocated as farms to returning refugees. The park was reduced in size from over 2500 km2 to its current size (1200 km2). Human population size and growth rate are often considered important drivers of biodiversity loss [33]. While studying the land cover change-induced changes in wildlife in East Africa, Ndegua et al. reported rapid land use/cover conversions, where over 132,000 ha of grasslands were converted into cultivated farms between 1975 and 2007 [34].

4.5. Analysis of Trend Dynamics per Vegetation Type

The “mosaic grassland/forest or shrubland” was severely degraded, followed by “sparse vegetation,” “grassland or woody vegetation regularly flooded or waterlogged soil,” “artificial surfaces” and “broadleaved forest regularly flooded (semi-permanently or temporarily).” The results point out that floods constitute, among other factors, a major threat to environmental sustainability in Rwanda, since much of the ravaged vegetation cover types are located in regularly flooded areas. Previous researchers have claimed that floods severely contribute to the degradation of environment and ecosystems [35]. According to the Rwanda National Adaptation Program designed to combat climate change, severe floods caused by “El Niño” in 1997–1998 destroyed a large number of agricultural plantations and swamps of the Nyabarongo and Akanyaru river basins [35]. It is, therefore, advised that flood and landslide mitigation programs take precedence in ecosystem preservation endeavors at community and local government levels, especially in the Northern Province around volcanic mountains where flood-induced degradation was mostly found.

4.6. Analysis of the Hurst Exponent and the Trends’ Sustainability

The results highlight that 58% of the area under investigation was unpredictable in terms of future characteristics, while over 28% was consistent with slight amelioration characteristics set to recur in the near future. The non-negligible portion of pixels (6.1%) consistently showing patterns of slight degradation was observed, while about 0.1% was unsustainably moving from degradation to amelioration. The observed unpredictability can be confirmed by factual information on the ground. On one hand, there is a rapidly growing population pressure on natural resources such as forests and farmlands. Rwanda is ranked the most densely populated nation on continental Africa according the United Nations Department of Economic and Social Affairs, and the trend is far from being reversed. This reflects the increasing demand for food, energy and forest fuel combustion, coupled with disorganized settlements, land fragmentation, high encroachment on wetlands, soil degradation, etc. [36]. On the other hand, there is an evident government commitment to sustain and protect the environment. This commitment is marked by the government call for Umuganda, the traditional practice re-institutionalized every last Saturday of the month, in which millions of new trees are planted every year. Both scenarios may exert a determining force on vegetation dynamics in the long run.

4.7. Uncertainties, Errors and Accuracies

As Santos et al. noted in their previous work [37], it is important to mention that these results are not infallible as they depend to a certain degree on data processing. AVHRR imagery, used in this study, suffers from certain limitations in calibration, geometry, orbital drift, limited spectral coverage and variations in spectral coverage, especially in the early period of applications [2]. Previous studies have called for the need to improve the NDVI dataset. This can be accomplished by developing better cloud screening and compositing techniques, by reducing the noise level in the dataset, and by improved treatment of atmospheric and viewing effects. Nevertheless, many projects (including GLCC) aiming at mapping vegetation covers from continental to global scales have been carried out using AVHRR for years simply because of its low cost and easy access. In this study, we chose this dataset because of its long time series imagery. Given the complexity of the vegetation cover classification in the area, the likely interference of different vegetation types’ effect remains unsolved. In order to cope with the aforementioned shortcomings, the AVHRR dataset has been further smoothed using the Savitzky-Golay filtering method to eliminate the effect of cloud contamination and the residual atmospheric and bidirectional effects [14,19,26]. The MODIS dataset, which is considered to be an improvement to the AVHHR dataset, was used for the years after 1999. The MODIS NDVI is retrieved from daily, atmosphere-corrected, bidirectional surface reflectance and is generated at 16-day intervals using a MODIS-specific compositing method based on product quality assurance to remove low quality pixels [8]; MODIS vegetation indices have been found to have enough spatial temporal resolution to capture differences in vegetation [28]. This study was carried out over a period of 25 years, which increases the likelihood of accurate observations. According to Peng et al., the longer the NDVI time series is, the lower the uncertainties [7].

5. Conclusions

This study has used MODIS and AVHRR datasets to assess the spatial temporal dynamics of vegetation in Rwanda through time series analysis of vegetation NDVI. In an attempt to relate these dynamics to natural forces, precipitation data derived from the Global Precipitation Climatology Centre (GPCC) were utilized. By analyzing the evolution of NDVI over time, the findings point out an increase in the mean GS NDVI over time and in all provinces of the country. Linear regression analysis has helped to statistically evaluate the rate of increase and it has been found that vegetation NDVI changes occurred at a maximum annual rate of 0.043. This study has found that five types of vegetation were characterized by a diminishing NDVI trend. The “mosaic grassland/forest or shrubland” was severely degraded, followed by “sparse vegetation,” “grassland or woody vegetation regularly flooded on water logged soil,” and “artificial surfaces and broadleaved forest regularly flooded.” The spatial analysis of trends has revealed that most areas under degradation were located in Kigali and the Eastern Province and represented 14.1% of the entire area under investigation. In order to meet all the objectives of the study, the application of the Hurst exponent has helped identify the likelihood of patterns in the future. This study placed emphasis on floods as fierce degraders for most severely threatened types of vegetation. Hence, it is suggested that flood mitigation and control mechanisms take precedence over other environmental regeneration initiatives undertaken by government authorities in flood-prone areas. However, given the complexity of vegetation distribution across the country, further studies designed to clarify the vegetation dynamics, thus improving predictions and preparedness for agricultural and ecological benefits, are necessary. For example, since population growth has reportedly been among the strongest environmental degraders, studies on residual trends analysis (RESTREND) would provide further understanding on anthropogenic influences on land degradation [13,38]. Furthermore, this study has only focused on observing precipitation trends in the first growing season, without taking into account the frequency, intensity and inter-annual variability of precipitation in the country. Future studies integrating those factors are paramount to gaining an in-depth understanding of the driving forces of vegetation activity in Rwanda.

Acknowledgments

The authors would like to express sincere gratitude to the United States Geological Survey and the NASA team for the provision of data. We are also indebted to Kathleen Malu and Cathy Reynolds for proofreading the manuscript. Moreover, the authors would like to thank the three anonymous reviewers whose contributions improved the paper. This research has been funded by the China-Africa Joint Research Centre Project of the Chinese Academy of Sciences, “Integration and Demonstration of Desertification Prevention and Control Technologies in a Typical Area of East Africa,” grant number: 2010DFB34020.

Author Contributions

Anming Bao designed the research; Hao Guo, Hui Guo and Felix Ndayisaba processed the data, analyzed the results and wrote the manuscript; Fidele Karamage and Alphonse Kayiranga provided the analysis tools and technical assistance. All authors contributed to the final version of the manuscript by proofreading and bringing in constructive ideas.

Conflicts of Interest

The authors declare no conflicts of interest.

References

  1. Shisanya, C.; Recha, C.; Anyamba, A. Rainfall variability and its impact on Normalized Difference Vegetation Index in arid and semi-arid lands of Kenya. Int. J. Geosci. 2011, 2, 36–47. [Google Scholar] [CrossRef]
  2. Xie, Y.C.; Sha, Z.Y.; Yu, M. Remote sensing imagery in vegetation mapping: A review. J. Plant Ecol. 2008, 1, 9–23. [Google Scholar] [CrossRef]
  3. Turvey, C.G.; Mclaurin, M.K. Applicability of the Normalized Difference Vegetation Index (NDVI) in index-based crop insurance design. Weather Clim. Soc. 2012, 4, 271–284. [Google Scholar] [CrossRef]
  4. Jackson, R.D.; Huete, A.R. Interpreting vegetation indexes. Prev. Vet. Med. 1991, 11, 185–200. [Google Scholar] [CrossRef]
  5. Clements, N.; Sarkar, S.K.; Zhao, Z.G.; Kim, D.Y. Applying multiple testing procedures to detect change in East African vegetation. Ann. Appl. Stat. 2014, 8, 286–308. [Google Scholar] [CrossRef]
  6. Rulinda, C.M.; Dilo, A.; Bijker, W.; Stein, A. Characterising and quantifying vegetative drought in East Africa using fuzzy modelling and NDVI data. J. Arid Environ. 2012, 78, 169–178. [Google Scholar] [CrossRef]
  7. Pfeifer, M.; Lefebvre, V.; Gonsamo, A.; Pellikka, P.K.E.; Marchant, R.; Denu, D.; Platts, P.J. Validating and linking the GIMMS Leaf Area Index (LAI3g) with environmental controls in tropical Africa. Remote Sens. 2014, 6, 1973–1990. [Google Scholar] [CrossRef]
  8. Davenport, M.L.; Nicholson, S.E. On the relation between rainfall and the Normalized Difference Vegetation Index for diverse vegetation types in East-Africa. Int. J. Remote Sens. 1993, 14, 2369–2389. [Google Scholar] [CrossRef]
  9. Carreiras, J.M.B.; Melo, J.B.; Vasconcelos, M.J. Estimating the above-ground biomass in miombo savanna woodlands (Mozambique, East Africa) using l-band synthetic aperture radar data. Remote Sens. 2013, 5, 1524–1548. [Google Scholar] [CrossRef]
  10. Rulinda, C.M.; Bijker, W.; Stein, A. The chlorophyll variability in meteosat derived NDVI in a context of drought monitoring. Procedia Environ. Sci. 2011, 3, 32–37. [Google Scholar] [CrossRef]
  11. Muhire, I.; Ahmed, F.; Abd Elbasit,, M.M.M. Spatio-temporal variations of rainfall erosivity in Rwanda. J. Soil Sci. Environ. Manag. 2015, 6, 72–83. [Google Scholar]
  12. Mukashema, A. Mapping and Modelling Landscape-Based Soil Fertility Change in Relation to Human Induction. Case Study: Gishwati Watershed of the Rwandan Highlands. Master’s Thesis, Faculty of Geo-Information Science and Earth Observation, Enschede, The Netherlands, 2007. [Google Scholar]
  13. Ibrahim, Y.Z.; Balzter, H.; Kaduk, J.; Tucker, C.J. Land degradation assessment using residual trend analysis of GIMMS NDVI3g, soil moisture and rainfall in Sub-Saharan West Africa from 1982 to 2012. Remote Sens. 2015, 7, 5471–5494. [Google Scholar] [CrossRef]
  14. Piao, S.L.; Mohammat, A.; Fang, J.Y.; Cai, Q.; Feng, J.M. NDVI-based increase in growth of temperate grasslands and its responses to climate changes in China. Glob. Environ. Chang. 2006, 16, 340–348. [Google Scholar] [CrossRef]
  15. Tucker, C.J.; Pinzon, J.E.; Brown, M.E.; Slayback, D.A.; Pak, E.W.; Mahoney, R.; Vermote, E.F.; El Saleous, N. An extended avhrr 8-km NDVI dataset compatible with MODIS and SPOT vegetation NDVI data. Int. J. Remote Sens. 2005, 26, 4485–4498. [Google Scholar] [CrossRef]
  16. Yuan, X.; Li, L.; Chen, X. Increased grass NDVI under contrasting trends of precipitation change over north China during 1982–2011. Remote Sens. Lett. 2015, 6, 69–77. [Google Scholar] [CrossRef]
  17. Wang, J.; Rich, P.M.; Price, K.P. Temporal responses of NDVI to precipitation and temperature in the central great plains, USA. Int. J. Remote Sens. 2003, 24, 2345–2364. [Google Scholar] [CrossRef]
  18. Peng, S.S.; Chen, A.P.; Xu, L.; Cao, C.X.; Fang, J.Y.; Myneni, R.B.; Pinzon, J.E.; Tucker, C.J.; Piao, S.L. Recent change of vegetation growth trend in China. Environ. Res. Lett. 2011, 6, 044027. [Google Scholar] [CrossRef]
  19. Geng, L.Y.; Ma, M.G.; Wang, X.F.; Yu, W.P.; Jia, S.Z.; Wang, H.B. Comparison of eight techniques for reconstructing multi-satellite sensor time-series NDVI data sets in the Heihe river basin, China. Remote Sens. 2014, 6, 2024–2049. [Google Scholar] [CrossRef]
  20. Duan, H.C.; Yan, C.Z.; Tsunekawa, A.; Song, X.; Li, S.; Xie, J.L. Assessing vegetation dynamics in the three-north shelter forest region of China using AVHRR NDVI data. Environ. Earth Sci. 2011, 64, 1011–1020. [Google Scholar] [CrossRef]
  21. Hurst, H.E. Long-term storage capacity of reservoirs. Trans. Am. Soc. Civ. Eng. 1951, 116, 770–808. [Google Scholar]
  22. Peng, J.; Liu, Z.; Liu, Y.; Wu, J.; Han, Y. Trend analysis of vegetation dynamics in Qinghai–Tibet plateau using hurst exponent. Ecol. Indic. 2012, 14, 28–39. [Google Scholar] [CrossRef]
  23. Jiang, W.G.; Yuan, L.H.; Wang, W.J.; Cao, R.; Zhang, Y.F.; Shen, W.M. Spatio-temporal analysis of vegetation variation in the Yellow river basin. Ecol. Indic. 2015, 51, 117–126. [Google Scholar] [CrossRef]
  24. Jiapaer, G.; Liang, S.L.; Yi, Q.X.; Liu, J.P. Vegetation dynamics and responses to recent climate change in Xinjiang using Leaf Area Index as an indicator. Ecol. Indic. 2015, 58, 64–76. [Google Scholar]
  25. Shongwe, M.E.; van Oldenborgh, G.J.; van den Hurk, B.; van Aalst, M. Projected changes in mean and extreme precipitation in Africa under global warming. Part II: East Africa. J. Clim. 2011, 24, 3718–3733. [Google Scholar]
  26. Justice, C.O.; Townshend, J.R.G.; Holben, B.N.; Tucker, C.J. Analysis of the phenology of global vegetation using meteorological satellite data. Int. J. Remote Sens. 1985, 6, 1271–1318. [Google Scholar] [CrossRef]
  27. Nicholson, S.E.; Davenport, M.L.; Malo, A.R. A comparison of the vegetation response to rainfall in the Sahel and East-Africa, using Normalized Difference Vegetation Index from NOAA AVHRR. Clim. Chang. 1990, 17, 209–241. [Google Scholar] [CrossRef]
  28. Rwaka, M. An Attempt to Investigate the Impact of 1994 Tutsi Genocide in Rwanda on Landscape Using Remote Sensing and GIS Analysis; Student thesis series INES; Lund University Libraries: Lund, Sweden, 2014. [Google Scholar]
  29. Mkhabela, M.S.; Mkhabela, M.S.; Mashinini, N.N. Early maize yield forecasting in the four agro-ecological regions of Swaziland using NDVI data derived from NOAA’s-AVHRR. Agr. For. Meteorol. 2005, 129, 1–9. [Google Scholar] [CrossRef]
  30. La, H.P.; Patrick, T.R.; Park, B.W.; Eo, Y.D. Analysis of the relationship between MODIS NDVI, Lai and rainfall in the forest region of Rwanda. Int. J. Digit. Content Technol. Appl. 2013, 7, 559. [Google Scholar]
  31. Reed, B.C. Trend analysis of time-series phenology of North America derived from satellite data. GIScience Remote Sens. 2006, 43, 24–38. [Google Scholar] [CrossRef]
  32. Jacquin, A.; Sheeren, D.; Lacombe, J.P. Vegetation cover degradation assessment in Madagascar savanna based on trend analysis of MODIS NDVI time series. Int. J. Appl. Earth Obs. 2010, 12, S3–S10. [Google Scholar] [CrossRef]
  33. Liu, J.G.; Daily, G.C.; Ehrlich, P.R.; Luck, G.W. Effects of household dynamics on resource consumption and biodiversity. Nature 2003, 421, 530–533. [Google Scholar] [CrossRef] [PubMed]
  34. Ndegwa Mundia, C.; Murayama, Y. Analysis of land use/cover changes and animal population dynamics in a wildlife sanctuary in East Africa. Remote Sens. 2009, 1, 952–970. [Google Scholar] [CrossRef]
  35. Munyaneza, O.; Ndayisaba, C.; Wali, U.; Mulungu, M.; Dulo, O. Integrated flood and drought management for sustainable development in the Kagera river basin. Nile Water Sci. Eng. J. 2011, 4, 60–70. [Google Scholar]
  36. Blackwell, J.M.; Goodwillie, R.N.; Webb, R. Environment and Development in Africa. Selected Case Studies; Economic Development Institute, World Bank: Washington, DC, USA, 1991. [Google Scholar]
  37. Santos, P.; Negri, A.J. A comparison of the Normalized Difference Vegetation Index and Rainfall for the Amazon and Northeastern Brazil. J. Appl. Meteorol. 1997, 36, 958–965. [Google Scholar] [CrossRef]
  38. Evans, J.; Geerken, R. Discrimination between climate and human-induced dryland degradation. J. Arid Environ. 2004, 57, 535–554. [Google Scholar] [CrossRef]

