
Preface: Remote Sensing of Water Resources


1
Department of Geography, University of Georgia, 210 Field Street, Room 204, Athens, GA 30602, USA
2
Department of Oceanography and Coastal Sciences, Louisiana State University, 306 Howe-Russell Geosciences Bldg., Baton Rouge, LA 70803, USA
3
Dow AgroSciences LLC, 9330 Zionsville Rd, Indianapolis, IN 46268, USA
*
Author to whom correspondence should be addressed.
Remote Sens. 2016, 8(2), 115; https://doi.org/10.3390/rs8020115
Submission received: 1 February 2016
/
Accepted: 2 February 2016
/
Published: 4 February 2016
(This article belongs to the Special Issue Remote Sensing of Water Resources)
Abstract
:The Special Issue (SI) on “Remote Sensing of Water Resources” presents a diverse range of papers studying remote sensing tools, methods, and models to better monitor water resources which include inland, coastal, and open ocean waters. The SI is comprised of fifteen articles on widely ranging research topics related to water bodies. This preface summarizes each article published in the SI.
Keywords:
oil spill; super algal bloom; suspended sediment concentration; river network detection; satellite rainfall products; chlorophyll-a; inherent optical properties; urban surface waters; colored dissolved organic matter; decision support system; phytoplankton; optically complex waters; primary productivity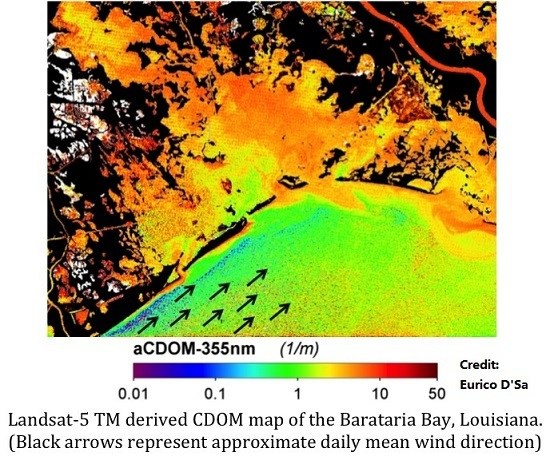
1. Overview and Scope
Water resources remain the most abundant natural resource and the major driving force on our planet which supports numerous ecosystems, commercial, and cultural services—from maintaining biodiversity, nutrient cycling, and primary productivity, to recreation, fisheries, ecotourism, transport, and religious uses. The pressure on water resources has been on the rise and will continue to increase in the coming years because of increased frequency of drought, urbanization, urban population growth, deforestation, increased use of fertilizers and pesticides, and spread of invasive species. It is expected that the quality of surface water both inland and coastal will deteriorate with continued warming due to global climate change. Rising temperatures along with excessive nutrient, sediment, and pesticide pollution will exacerbate water quality degradation in many ways including triggering super algal blooms and ultimately making the water body toxic, hypoxic, and stratified. Therefore, accurate, inexpensive, and rapid monitoring tools and models using remote sensing are needed for timely implementation of conservation and restoration measures in problematic areas.
The main goal of this Special Issue on “remote sensing of water resources” was to highlight some of the remote sensing-driven applied research currently being performed to solve some of the aforementioned problems in water resources. Manuscripts were invited covering a broad range of application of remote sensing in monitoring water resources, including model and algorithm development, analysis of data from new satellite sensors, long-term time series and phenological analysis of water quality and productivity parameters, and novel concepts for effective water resource management. The response to the Special Issue call was overwhelming and, at the end of the process, fifteen papers were incorporated in the issue covering a wide range of interesting topics. The section below provides a brief overview of each paper published in the Special Issue on “Water Resources”.
2. Highlights of Research Articles
In their study, Pisano, Bignami, and Santoleri [1] presented a methodology for the detection of marine oil spills using Moderate-Resolution Imaging Spectroradiometer (MODIS) 250 m near-infrared band. They specifically selected seven glint contaminated images to calibrate their model and validated the results on four separate images. They used a ratio of MODIS-retrieved normalized sun glint radiance and the sun glint radiance from Cox and Monk isotropic sun glint model. Oil spill-affected MODIS pixels were isolated and mapped because of their anomalous ratio values. Their method could easily be automated for spill detection using other optical satellite data.
Kamerosky, Cho, and Morris [2] used MEdium Resolution Imaging Spectrometer (MERIS) based chlorophyll-a algorithms, specifically the normalized difference chlorophyll index (NDCI) and two-band model, to map the phenology of the 2011 super bloom in Indian River Lagoon (IRL), Florida. Based on NDCI results they concluded that the 2011 super algal bloom in IRL began between March and April in the Banana River. Heavy rainfall induced nutrient runoff triggered the bloom which peaked in October 2011. The bloom collapse also coincided with heavy rainfall and decreased temperature.
Kong et al. [3] developed a semi-analytical model based on quasi analytical algorithm (QAA) to retrieve suspended sediment concentrations (SSC) for the Gulf of Bohai, China. Model comparisons revealed a higher accuracy and universality for the developed model. SSC was mapped using Landsat TM data which revealed the Yellow River to be the main source of sediment in the Gulf of Bohai.
In their study, Yang et al. [4] successfully characterized and mapped a river network from the noisy image background using their Gaussian-like cross-section and longitudinal continuity. Their proposed methods were able to accurately classify images to a binary river map using automatically determined threshold. Their method could be a useful tool to map surface water features, a practical application for water resources research.
Gebere et al. [5] evaluated the performance of TRMM, PERSIANN, and GSMaP rainfall products on a daily, monthly, and seasonal basis over eastern highlands of Ethiopia. Comparison of satellite data with rain gauge data revealed that TRMM 3B42 had better performance over the other sensors. However, they also concluded that TRMM products cannot be used without modifications, such as compensating for local orographic effects.
In their study, Bao et al. [6] developed a normalized mutual information (NMI) weighted algorithm to estimate chlorophyll-a from the Geostationary Ocean Color Imager (GOCI) data based on a similarity measure/clustering method using in situ normalized spectral data that was also applied to the GOCI data. The NMI weighted algorithm was shown to have higher accuracy and reduced discontinuous effect in comparison to non-classification and hard-classification algorithms with the method applicable to different remote sensing images and chlorophyll-a retrieval algorithms.
Delgado et al. [7] conducted seasonal and inter-annual analysis of chlorophyll-a and inherent optical properties (IOPs) from MODIS derived ocean color products between 2002 and 2010 for the inner and mid shelf waters of the Southwestern Buenos Aires Province, Argentina. The inter-annual and seasonal variability of the ocean color parameters of the regions identified based on the coefficient of variation and the Census X-11 method revealed remarkable linkage between the climate variability and the IOPs which could be considered as proxies of the biological and physical parameters of the region.
In their study, Yao et al. [8] assessed high-resolution monitoring of urban water bodies using an automated urban water extraction method (UWEM) that combined a new water index and a building shadow detection method for the ZY-3 multi-spectral imagery. Comparison with the normalized difference water index (NDWI) indicated significantly better and more stable performance of the UWEM that generally minimized over- and under-estimation issues when mapping urban surface water under complex environmental conditions.
Joshi and D’Sa, [9] studied the effects of meteorological and hydrological factors, such as wind speed, freshwater diversions, and river discharge, on the spatial and seasonal variability of colored dissolved organic matter (CDOM) in Barataria Bay, LA, USA using field and Landsat-5 TM imagery. Landsat-derived CDOM maps using a new empirical band-ratio algorithm generally captured the major details of CDOM distribution and seasonal influences suggesting the potential use of Landsat imagery to monitor biogeochemistry in coastal water environments.
In their study, Song et al. [10] describe the use of machine learning methods that should enhance a decision support system for predicting the distribution of coastal ocean algal blooms based on remote sensing data (MODIS and MERIS) in Monterey Bay, CA, USA. In addition to chlorophyll-a and fluorescence line height (FLH), sea surface temperature (SST), cloud cover and diffuse Attenuation coefficient at 490 nm (Kd(490)) satellite products were also used to increase the bloom event prediction performance which were validated using in situ field experiment data. Overall, the random forest model performed better than previous trials based on a support vector machine (SVM) for satellite data obtained between October 2010 and April 2012 that should aid scientists to formulate strategies for deploying robots in the coastal ocean for more detailed in situ exploration.
Zheng et al. [11] developed a model using Landsat images to monitor total suspended matter (TSM) concentration during wet seasons from 1978 to 2013 in Dongting Lake, China. Near Infrared (NIR) band data and in situ measurements were used to train and test an empirical model through rigorous calibration and validation analyses. It was found that the water level and precipitation were the primary factors behind TSM spatio-temporal variation in Dongting Lake during the study period. Anthropogenic activities, such as sand mining and construction of dams, altered the TSM variation since 2000.
In the study by Zeng et al. [12], a natural rule based connection (NRBC) method was developed to automate the extraction of river networks from high resolution Worldview-2 imagery. After creating an initial water mask through unsupervised classification, their method innovatively uses NRBC approach to connect a group of potential connected water patches based on width of the gap, consistency of river direction, consistency of river width, minimum segment length, and consistency of image intensity. Finally their method generates a refined river centerline map for its potential application in flood extent mapping, validating hydraulic models, and management of water quality and quantity.
Xue et al. [13] developed a remote sensing approach to estimate phytoplankton vertical profile classes in a shallow eutrophic lake in China from MODIS Rayleigh-corrected reflectance (Rrc) data. Their classification and regression tree (CART) approach used combined information from normalized algal bloom index (NDBI) and local wind speed data in order to retrieve four vertical profile classes: (1) vertically uniform; (2) Gaussian distribution; (3) exponential distribution; and (4) negative power function in Lake Chaohu. Results from this research look promising although extensive validation of this approach is required to prove its transferability to other geographic regions.
Shen et al. [14] presented a fuzzy c-mean (FCM) based clustering method to classify several optically complex waters in China using in situ remote sensing reflectance (Rrs(λ)) data. Initially the proposed classification scheme clusters the remote sensing reflectance spectra into four classes and then it establishes the relationship between Rrs(λ) and bio-optical/environmental parameters in each class. Finally, for practical application purposes, the authors present a classification tree to classify the Rrs(λ) data into four water types, i.e.,: (1) highly mixed eutrophic waters with inorganic particulate matter dominance; (2) colored dissolved organic matter dominated relatively clear waters; (3) inorganic particulate matter-dominated waters; and (4) cyanobacteria-composed scum. Using simulated data, they also documented the applicability of this classification tree method on simulated data from seven sensors including POLarization and Directionality of the Earth's Reflectance (POLDER), Sentinel-2A, and MERIS.
Joo et al. [15] presented recent decadal trend of primary productivity in the East Sea using monthly MODIS chlorophyll-a and Kd(490) data. A regional primary productivity model based on the vertically generalized productivity model (VGPM) was used to estimate the primary productivity. Their study reported that the average annual primary production in the East Sea was 246.8 gCm−2·y−1 from 2003–2012, which is higher than the previously reported values in deep oceans. They also reported that annual primary production in the East Sea decreased 13% within the study period from 2003 to 2012. The decrease in annual primary productivity could be potentially due to shallower mixed layers caused by increased temperature, or is a part of the Pacific Decadal Oscillation (PDO). Observations from this study could potentially help towards better fishery management in the East Sea.
Acknowledgments
We would like to thank the authors for their excellent contributions to this Special Issue. Heartfelt thanks to all the reviewers for their valuable and timely reviews. It has been a pleasure working with the ever-courteous and prompt editorial staff. Thank you for this opportunity to edit the Special Issue.
Conflicts of Interest
The author declares no conflict of interest.
References
- Pisano, A.; Bignami, F.; Santoleri, R. Oil Spill Detection in Glint-Contaminated Near-Infrared MODIS Imagery. Remote Sens. 2015, 7, 1112–1134. [Google Scholar] [CrossRef]
- Kamerosky, A.; Cho, H.; Morris, L. Monitoring of the 2011 Super Algal Bloom in Indian River Lagoon, FL, USA, Using MERIS. Remote Sens. 2015, 7, 1441–1460. [Google Scholar] [CrossRef]
- Kong, J.; Sun, X.; Wong, D.; Chen, Y.; Yang, J.; Yan, Y.; Wang, L. A Semi-Analytical Model for Remote Sensing Retrieval of Suspended Sediment Concentration in the Gulf of Bohai, China. Remote Sens. 2015, 7, 5373–5397. [Google Scholar] [CrossRef] [Green Version]
- Yang, K.; Li, M.; Liu, Y.; Cheng, L.; Huang, Q.; Chen, Y. River Detection in Remotely Sensed Imagery Using Gabor Filtering and Path Opening. Remote Sens. 2015, 7, 8779–8802. [Google Scholar] [CrossRef]
- Gebere, S.; Alamirew, T.; Merkel, B.; Melesse, A. Performance of High Resolution Satellite Rainfall Products over Data Scarce Parts of Eastern Ethiopia. Remote Sens. 2015, 7, 11639–11663. [Google Scholar] [CrossRef]
- Bao, Y.; Tian, Q.; Chen, M. A Weighted Algorithm Based on Normalized Mutual Information for Estimating the Chlorophyll-a Concentration in Inland Waters Using Geostationary Ocean Color Imager (GOCI) Data. Remote Sens. 2015, 7, 11731–11752. [Google Scholar] [CrossRef]
- Delgado, A.; Loisel, H.; Jamet, C.; Vantrepotte, V.; Perillo, G.; Piccolo, M. Seasonal and Inter-Annual Analysis of Chlorophyll-a and Inherent Optical Properties from Satellite Observations in the Inner and Mid-Shelves of the South of Buenos Aires Province (Argentina). Remote Sens. 2015, 7, 11821–11847. [Google Scholar] [CrossRef]
- Yao, F.; Wang, C.; Dong, D.; Luo, J.; Shen, Z.; Yang, K. High-Resolution Mapping of Urban Surface Water Using ZY-3 Multi-Spectral Imagery. Remote Sens. 2015, 7, 12336–12355. [Google Scholar] [CrossRef]
- Joshi, I.; D’Sa, E. Seasonal Variation of Colored Dissolved Organic Matter in Barataria Bay, Louisiana, Using Combined Landsat and Field Data. Remote Sens. 2015, 7, 12478–12502. [Google Scholar] [CrossRef]
- Song, W.; Dolan, J.; Cline, D.; Xiong, G. Learning-Based Algal Bloom Event Recognition for Oceanographic Decision Support System Using Remote Sensing Data. Remote Sens. 2015, 7, 13564–13585. [Google Scholar] [CrossRef]
- Zheng, Z.; Li, Y.; Guo, Y.; Xu, Y.; Liu, G.; Du, C. Landsat-Based Long-Term Monitoring of Total Suspended Matter Concentration Pattern Change in the Wet Season for Dongting Lake, China. Remote Sens. 2015, 7, 13975–13999. [Google Scholar] [CrossRef]
- Zeng, C.; Bird, S.; Luce, J.; Wang, J. A Natural-Rule-Based-Connection (NRBC) Method for River Network Extraction from High-Resolution Imagery. Remote Sens. 2015, 7, 14055–14078. [Google Scholar] [CrossRef]
- Xue, K.; Zhang, Y.; Duan, H.; Ma, R.; Loiselle, S.; Zhang, M. A Remote Sensing Approach to Estimate Vertical Profile Classes of Phytoplankton in a Eutrophic Lake. Remote Sens. 2015, 7, 14403–14427. [Google Scholar] [CrossRef]
- Shen, Q.; Li, J.; Zhang, F.; Sun, X.; Li, J.; Li, W.; Zhang, B. Classification of Several Optically Complex Waters in China Using in Situ Remote Sensing Reflectance. Remote Sens. 2015, 7, 14731–14756. [Google Scholar] [CrossRef]
- Joo, H.; Son, S.; Park, J.; Kang, J.; Jeong, J.; Lee, C.; Kang, C.; Lee, S. Long-Term Pattern of Primary Productivity in the East/Japan Sea Based on Ocean Color Data Derived from MODIS-Aqua. Remote Sens. 2016, 8, 25. [Google Scholar] [CrossRef]
© 2016 by the authors; licensee MDPI, Basel, Switzerland. This article is an open access article distributed under the terms and conditions of the Creative Commons by Attribution (CC-BY) license (http://creativecommons.org/licenses/by/4.0/).
Share and Cite
MDPI and ACS Style
Mishra, D.R.; D’Sa, E.J.; Mishra, S. Preface: Remote Sensing of Water Resources. Remote Sens. 2016, 8, 115. https://doi.org/10.3390/rs8020115
AMA Style
Mishra DR, D’Sa EJ, Mishra S. Preface: Remote Sensing of Water Resources. Remote Sensing. 2016; 8(2):115. https://doi.org/10.3390/rs8020115
Chicago/Turabian StyleMishra, Deepak R., Eurico J. D’Sa, and Sachidananda Mishra. 2016. "Preface: Remote Sensing of Water Resources" Remote Sensing 8, no. 2: 115. https://doi.org/10.3390/rs8020115
Note that from the first issue of 2016, this journal uses article numbers instead of page numbers. See further details here.