1. Introduction
The ability to monitor and map pasture biomass in extensive grazing systems provides graziers with vital information for making timely livestock management decisions such as set stocking rates or rotation intervals [
1,
2]. Management decisions such as daily pasture allocation, conservation and supplementary feeding are an essential pathway to increasing the efficiency of pasture grazing systems [
3,
4,
5,
6]. Methods of biomass measurement have evolved in the recent past, with measurements moving from purely destructive (e.g., taking pasture cuts and weighing the sample) and subjective measurement techniques (e.g., visual estimations) to optical, non-destructive sensing techniques that can be used to estimate pasture biomass levels by using a proxy such as spectral reflectance indices or plant height.
Pasture biomass, in kg green dry matter per hectare (kg GDM/ha), is usually measured by destructive sampling, e.g., [
7,
8]. This technique has several disadvantages such as being time consuming, labour intensive, increasingly destructive with multiple measurements and it requires a significant amount of sample treatment (dissecting, drying, weighing). Additionally, extrapolating point measurements to a paddock scale, or interpolating between point measures to examine sub-paddock variability is prone to errors. To address this problem, a variety of other spatially-enabled, “on-the-go” pasture biomass measuring techniques have been developed. Trotter
et al. [
9] provides a review of these techniques which include visual assessment, pasture height recording devices, weighted plate meters, combinations of height and weighted plate meters, electrical capacitance probes, pendulum sensors as well as active optical sensors (AOS). Each of these techniques have their own advantages and disadvantages, however common issues included limited accuracy when dealing with spatially-variable phenology, morphology, species composition and green
vs. dry fraction, e.g., [
10,
11,
12,
13].
Spectral reflectance indices that are calculated by measuring the reflectance of vegetation at certain wavelengths, (such as the normalised difference vegetation index (NDVI), simple ratio (SR), soil adjusted vegetation index (SAVI) to name a few) have been used to successfully estimate the biomass content of vegetation, e.g., [
9,
14,
15,
16,
17,
18]. In recent times, a certain class of sensors that have been used for estimating biomass in pastures are AOS [
15,
16,
19]. These AOS are specialized instruments that irradiate a target with radiation and measure that which is scattered back to the sensor’s integral photo-detector. One of the key advantages of using AOS is that measurements can be performed under any ambient illumination condition, including at night as opposed to passive optical reflectance sensors that require illumination from a separate light source, usually sunlight [
20].
The spectral reflectance characteristics of a plant canopy are influenced not only by the surface reflectivity of the top leaves. Owing to the inherent transmittance and absorption characteristics of leaves, multiple scattering of incident radiation through the leaf layers within the canopy, and the return to the canopy surface of some of that radiation is the basis for relating the reflectance characteristics, or derived reflectance indices, to plant biomass. The parameter central to this is the dimensionless leaf area index (LAI), specifying the leaf area per unit ground area (sometimes given units of m
2/m
2) or, from the perspective incident radiation, the number of leaf layers through which it will travel [
21]. The sensitivity of spectral reflectance indices to increasing LAI decreases with increasing LAI because of the progressive attenuation of propagating radiation deeper into the canopy. This has been demonstrated by Lamb
et al. [
21] in a simple experiment involving stacking of ryegrass (
Lolium spp.) leaves, where it was observed that the surface reflectance index (in this case the chlorophyll red edge) saturates at LAI values exceeding 4–6 (e.g., Figure 13 in Lamb
et al., [
21]). In terms of biomass, Trotter
et al. [
9] observed this to occur at around 4000–5000 kg GDM/ha for their tall fescue (
Festuca arundinacea var. Fletcher) pasture. It is noteworthy that the LAI, and concomitant biomass value, at which saturation occurs is critically dependent on the species; morphology and chlorophyll concentration in the leaves being key determinants. Ultimately, and irrespective of species or environmental conditions, the use of optical reflectance measurements alone to infer pasture biomass is challenging in pasture of high LAI. It should not be lost on the reader that the plethora of spectral reflectance indices (SRI) used to infer biomass seek to address the non-linearity in the optical response of sensors, especially the impending saturation at high LAI. While these indices may be capable of retaining a response gradient in the calibration curve in this “saturation zone”, it still does not mitigate the simple fact that the returning optical radiation to the sensor itself plateaus with increasing LAI. This places a restriction on the top-end range of biomass levels at which optical reflectance sensors can be used for evaluating the biomass of a pasture. There is a further complication to relying on SRIs that depend on the pigment bands within the spectral reflectance profile of canopies. Fertiliser status of pasture plants, in particular nitrogen significantly affects the chlorophyll concentration in leaves, and this, in turn affects the leaf transmittance and reflectance characteristics [
21], over and above any concomitant differences in LAI that may result in the canopy.
The problem of saturation in SRIs at top-end biomass levels, and the potentially confounding effect of changing leaf pigment concentration resulting from fertiliser status can plausibly be addressed by measuring other physical attributes of the plant itself. The height of the vegetation canopy has been used to measure plant volume and to infer biomass with success in the past [
11,
12,
22,
23,
24,
25,
26]. Of particular interest is the work by King
et al. [
22], who reported that the sward height was linearly related to both the LAI and biomass over a range of 2 cm to 8 cm in two ryegrass dominant swards. Consistent with the earlier discussion, it was also noted that reflectance measurements (
i.e., the use of SRI) could not be used to estimate biomass above a LAI of 3–4 as the change in reflectance above this LAI was very small. Meanwhile plant height maintained a linear relationship with biomass even at these higher LAI levels. The consequence of this observation is the potential, albeit unexplored in pastures to date, that a combination of SRI and height may be worth investigating as a means of estimating pasture biomass across a larger range of LAI values.
Scotford and Miller [
27] have used an ultrasonic sensor in combination with a two channel (660 nm and 730 nm wavelength) radiometer system to measure both the height and NDVI of three varieties of winter wheat. It was found that the NDVI was useful to monitor the senescence of the wheat and canopy expansion up to growth stage (GS) 31 (the stage after tillering where the stems of the plant begin to elongate, e.g., [
28]), but beyond that the NDVI saturates and is less useful. This is not surprising given that there may be in excess of 9 tillers per plant. The ultrasonic measurements provided crop height measurements ranging in accuracy from ±0.046 m to ±0.072 m and proved to be reliable for height measurements up to and beyond GS 31, again unsurprising given the progressive elongation of the stem from this stage onwards. This evidence suggests that, by using these two measurements (height and NDVI) in combination, the crop can be monitored throughout the growing season, even after the NDVI saturates at later stages of the growing cycle, including the subsequent onset of senescence.
Freeman
et al. [
29] combined measurements of NDVI derived from an active optical sensor with physical height measurements to estimate, amongst other things, the biomass of corn. The product of NDVI × height proved the best predictor of the dry biomass yield (
R2 = 0.62), compared to plant height (
R2 = 0.59) and NDVI (
R2 = 0.52) respectively. The result of this study is consistent with a hypothesis that combining spectral reflectance measurements with a physical parameter such as plant height may increase the range over which biomass can be obtained.
The primary aim of this paper is to evaluate the ability to estimate pasture biomass by combining a measure of pasture canopy height using light detection and ranging (LiDAR) and pasture canopy reflectance measurements using AOS. By way of demonstration, we evaluate the ability of individual and combined optical sensors to estimate pasture biomass of a common Australian monoculture pasture, tall fescue (Festuca arundinacea var. Fletcher), with a green dry matter mass range up to 4000 kg/ha.
2. Materials and Methods
The study site was at the University of New England’s “SMART Farm” (30°28′51″S, 151°38′46″E), located 5 km north-west of Armidale, NSW, Australia. The topography of the site consists of a gentle hillslope (<5%) with an easterly aspect and elevation 1051 m above mean sea level. The soil in the study area is predominantly heavy clay (Vertosol; Isbell 2002). The average annual rainfall in this area is 779.4 mm (1997–2013), of which ~68% falls between October and March [
30]. The mean maximum annual temperature is 20.1 °C and minimum is 6.1 °C. The mean daily global radiation is (18.6 MJ/m
2) with a maximum in January (25.2 MJ/m
2) and minimum in June (10.4 MJ/m
2) (BoM 2013).
The experiment was conducted in a 0.02 ha field of tall fescue (
Festuca arundinacea var. Fletcher) pasture over a two day period in January 2014. The trial consisted of 20 plots and 6 “control plots” measuring 2 m by 2 m, located on a slope of ~4 degrees (
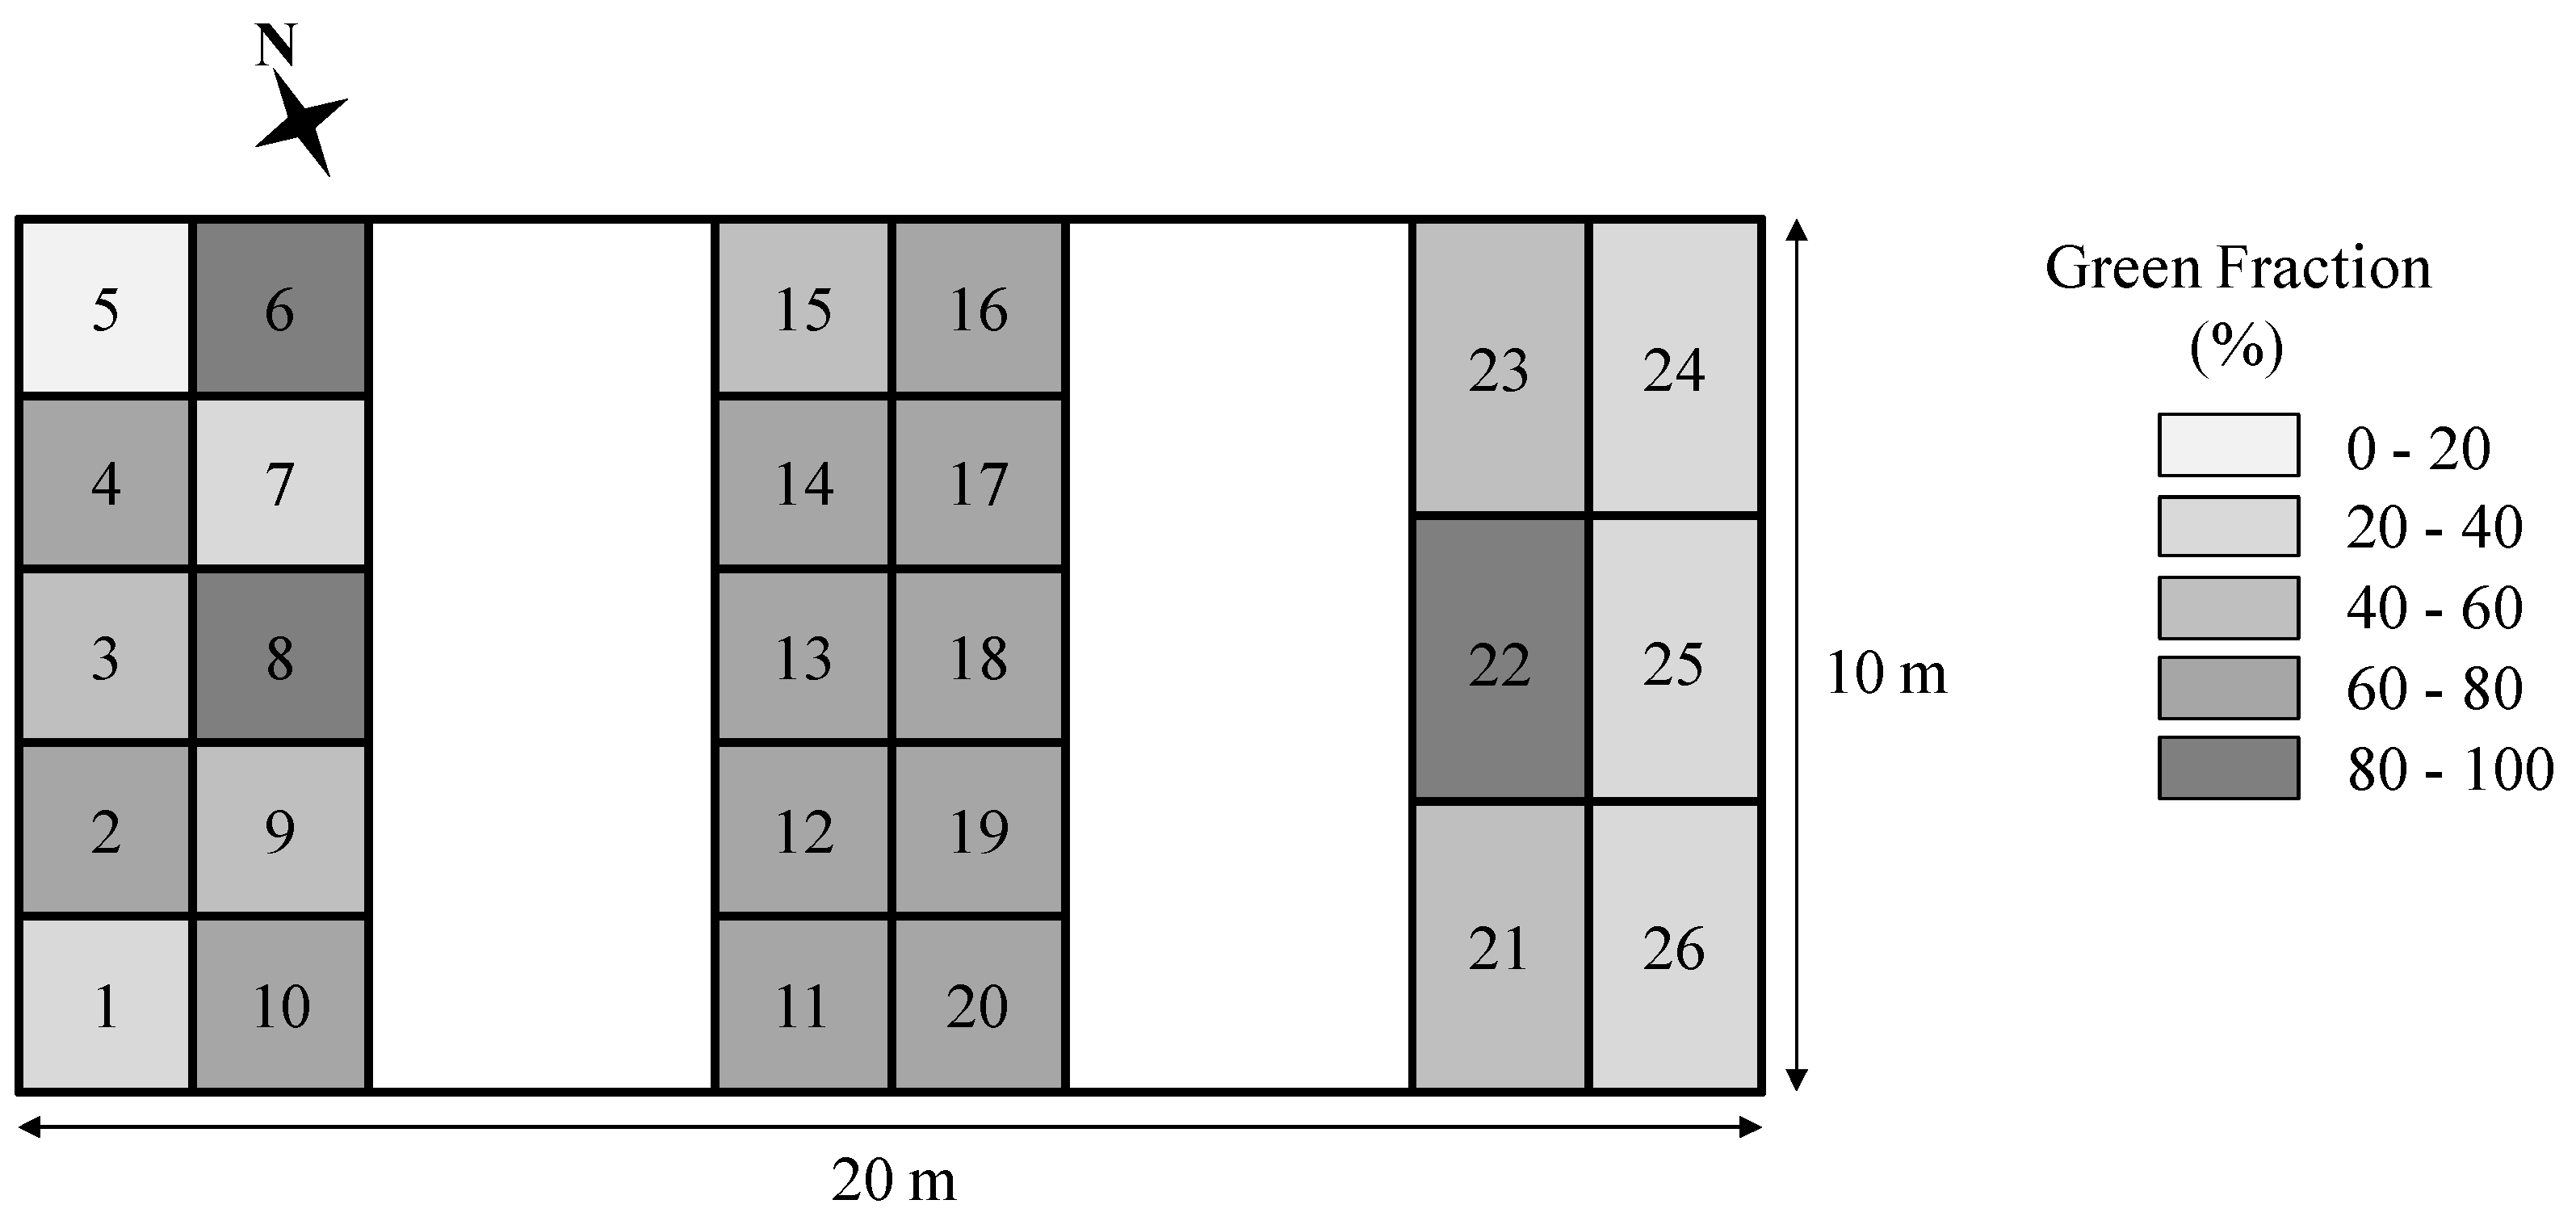
Figure 1). The plots were irrigated using a single overhead sprinkler and fertilised using different application rates. Urea and single super phosphate (SSP) were applied twice at 2-week intervals in each plot at a rate of 100 kg N/ha and 200 kg SSP/ha before the experiment commenced, to ensure strong, non-nutrient-limited pasture growth, that was regulated only by soil moisture. Two weeks prior to measurements, alternate plots were sprayed with herbicide and mowed to different heights to provide a range of pasture biomass levels, leaf chlorophyll concentration, as well as green-dry fraction ratios.
Figure 1.
Schematic diagram of the experimental plot layout located on the University of New England Sustainable Manageable Accessible Rural Technologies (UNE SMART) Farm. Each of the 26 sampling locations consisted of a 50 cm × 50 cm quadrat centred within a 2 m × 2 m pasture plot. Plots 1–20 were treated with urea and superphosphate, plots 1–10 were also sprayed with herbicide to introduce varying degrees of senescence, while plots 21–26 were control treated only with irrigation.
There were two optical sensors used during this trial. The Raptor™ ACS 225LR (Holland Scientific, Holland Scientific Inc., Lincoln, NE, USA) is an AOS that illuminates the vegetation canopy with dual wavelength light (red (660 nm) and NIR (830 nm)) and measures, via synchronous detection, the reflectance of the vegetation canopy to calculate the NDVI [
18] at a sampling frequency of 20 Hz. The Sick LMS 151 LiDAR (SICK AG, Waldkirch, Germany) is a portable time-of-flight LiDAR that has a maximum scannable range of 50 m at an object remission >75%. The LiDAR has an operating laser wavelength of 905 nm, real time data streaming via an ethernet output and can be programmed to scan at 25 Hz or 50 Hz. During this trial the laser was set to scan at 50 Hz, providing approximately 100 scan lines of laser data per plot. It has a vertical resolution ±30 mm.
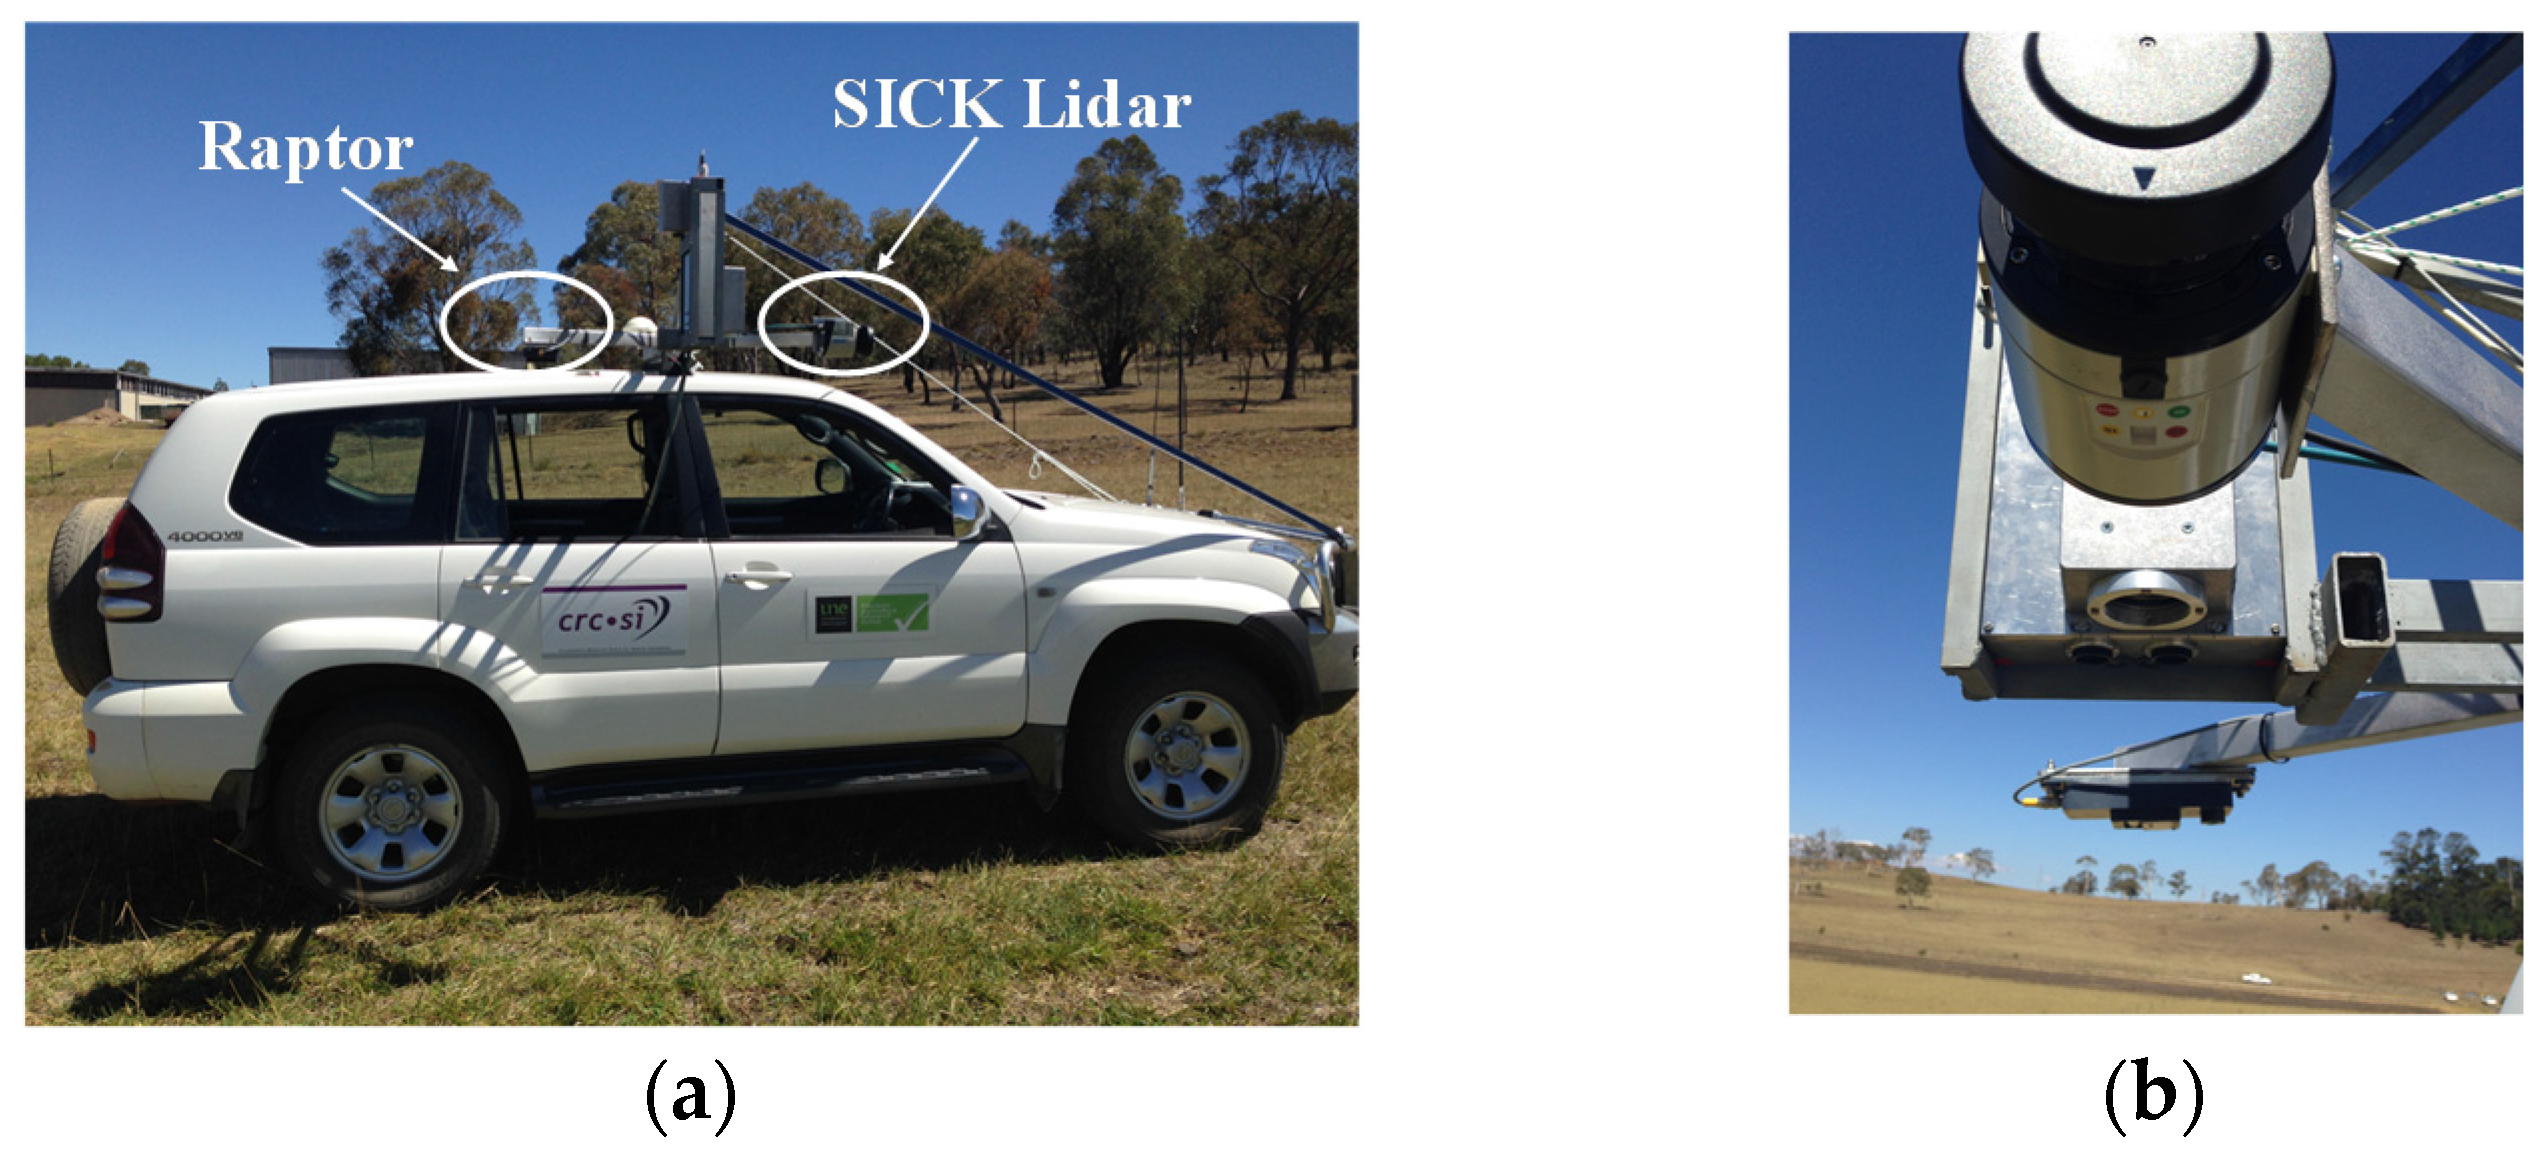
In order to acquire measurements, the two sensors were attached to a custom built steel arm that extended horizontally from the roof-rack of a four wheel drive vehicle (
Figure 2), ensuring that the two sensors were axially aligned with the direction of movement of the vehicle and positioned at a height of 1.85 m above the ground surface. Measurements were collected concurrently as the vehicle was driven at low speed (~1 m/s) along transects spanning the width of the plots. Care was taken to ensure that both of the sensor fields of view were coincident and sampling the same section of pasture. To create a physical sampling buffer between each of the plots, a wooden board was placed on the ground to mark the upstream and downstream plot boundaries, ensuring that the plot boundaries were clearly visible in the acquired data streams.
Figure 2.
(a) Photograph of the physical sensor configuration mounted on a bracket attached to the vehicle roof racks; and (b) close-up view of the sensor configuration with the light detection and ranging (LiDAR) unit in the foreground and the Raptor™ active optical reflectance sensor in the background.
Immediately following the Raptor-LiDAR sampling, 10 physical measurements of the pasture height for each of the plots were taken using a simple ruler [
13]. The pasture canopy height for each plot was measured as an average of ten canopy measurements.
After data acquisition, a 50 cm × 50 cm quadrat of pasture was harvested from each plot to within 10 mm of ground using a set of electric grass shears. The samples were bagged and a subsample of each bag was sorted into green and dead herbage mass fractions to provide an estimate of percentage green herbage mass for the entire transect sample. The bag samples were oven-dried at 40 °C for 48 h, weighed and the values converted to provide herbage mass in kg of GDM per hectare for each plot. Additionally, the average NDVI for each plot (from approximately 40 individual readings) was calculated in ArcGIS from the Raptor™ sensor readings.
The approximately 3500 individual LiDAR records from each pasture plots were divided into 10 cm × 10 cm segments using Quick Terrain Modeler v8.0. For each of these segments the average canopy height was calculated from the difference between the top of canopy height and the height of the sensor (1.85 m) above the ground level.
Half of the sensor and physical measured plot data was randomly selected for model generation (n = 13) and the remaining half retained for validation (n = 13). Models were created by plotting the measured variable (e.g., LiDAR canopy height) against the measured GDM biomass. Regression analysis is carried out by fitting a curve through the data which is ultimately used to determine the GDM prediction models. The performance of each model was assessed using the coefficient of determination (R2) and root mean square error deviation between the measured and predicted values of pasture GDM biomass. All statistical analyses were undertaken in MS Excel 2007.
3. Results and Discussion
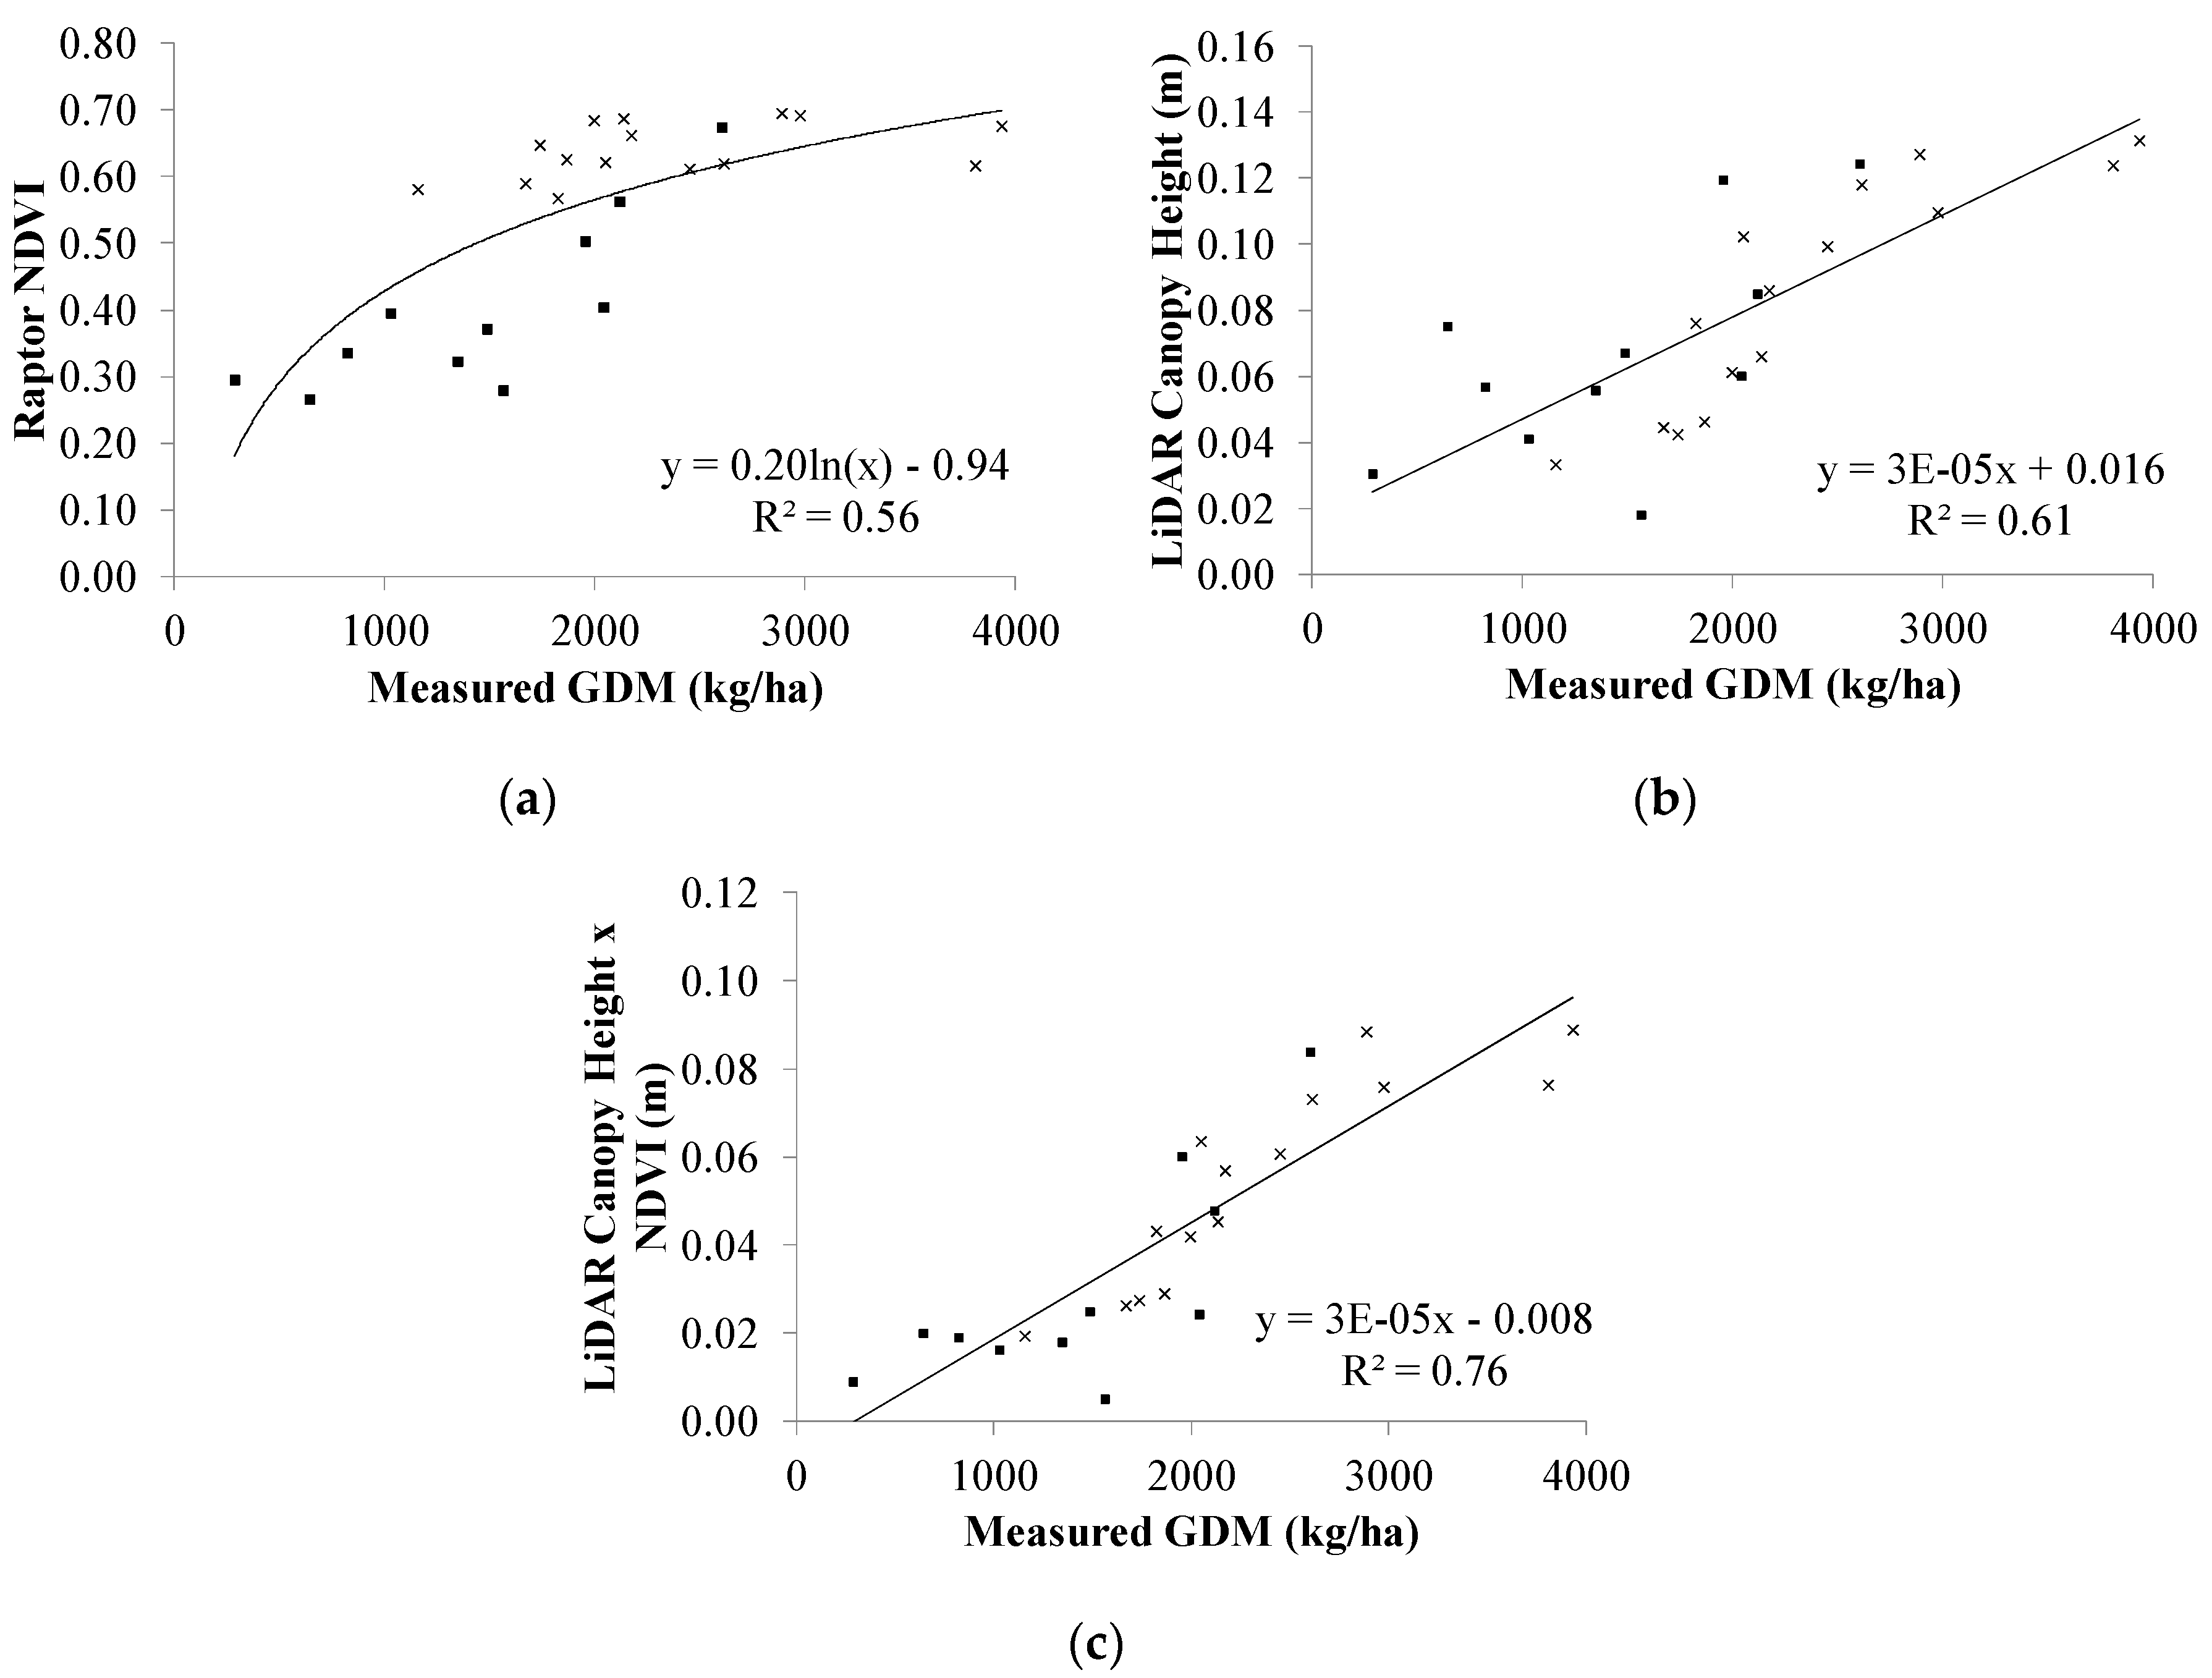
There was a non-linear relationship between the Raptor™ sensed NDVI and the measured GDM, where the NDVI accounted for 56% of the variation in the measured GDM (
Figure 3a). This was smaller than expected, as previous studies have shown that the NDVI more commonly explains approximately 60%–70% of the variance in GDM for pastures [
9,
18,
31].
The NDVI
vs. GDM plot of
Figure 3a follows the characteristic logarithmic trend with appreciable saturation occurring at approximately 2000 kg/ha. This is the same level of biomass beyond which the various reflectance-based predictor equations of Trotter
et al. [
9] deviated significantly from their 1:1 prediction lines. Of particular note in
Figure 3a is the fact that saturation appears to occur at much lower biomass levels for the senescence-dominant subsample of pastures (black squares). A similar observation was reported by Spackman
et al. [
32] when comparing green rice canopy NDVI
vs. biomass with those of other plants in varying stages of senescence. It could be argued on this basis that there is in fact two separate response curves embedded in
Figure 3a. In
Figure 3b, both the senescent-dominant and green pasture subsamples are mixed although there are more of the senescent-dominant groupings with lower heights. Examining the photographs in
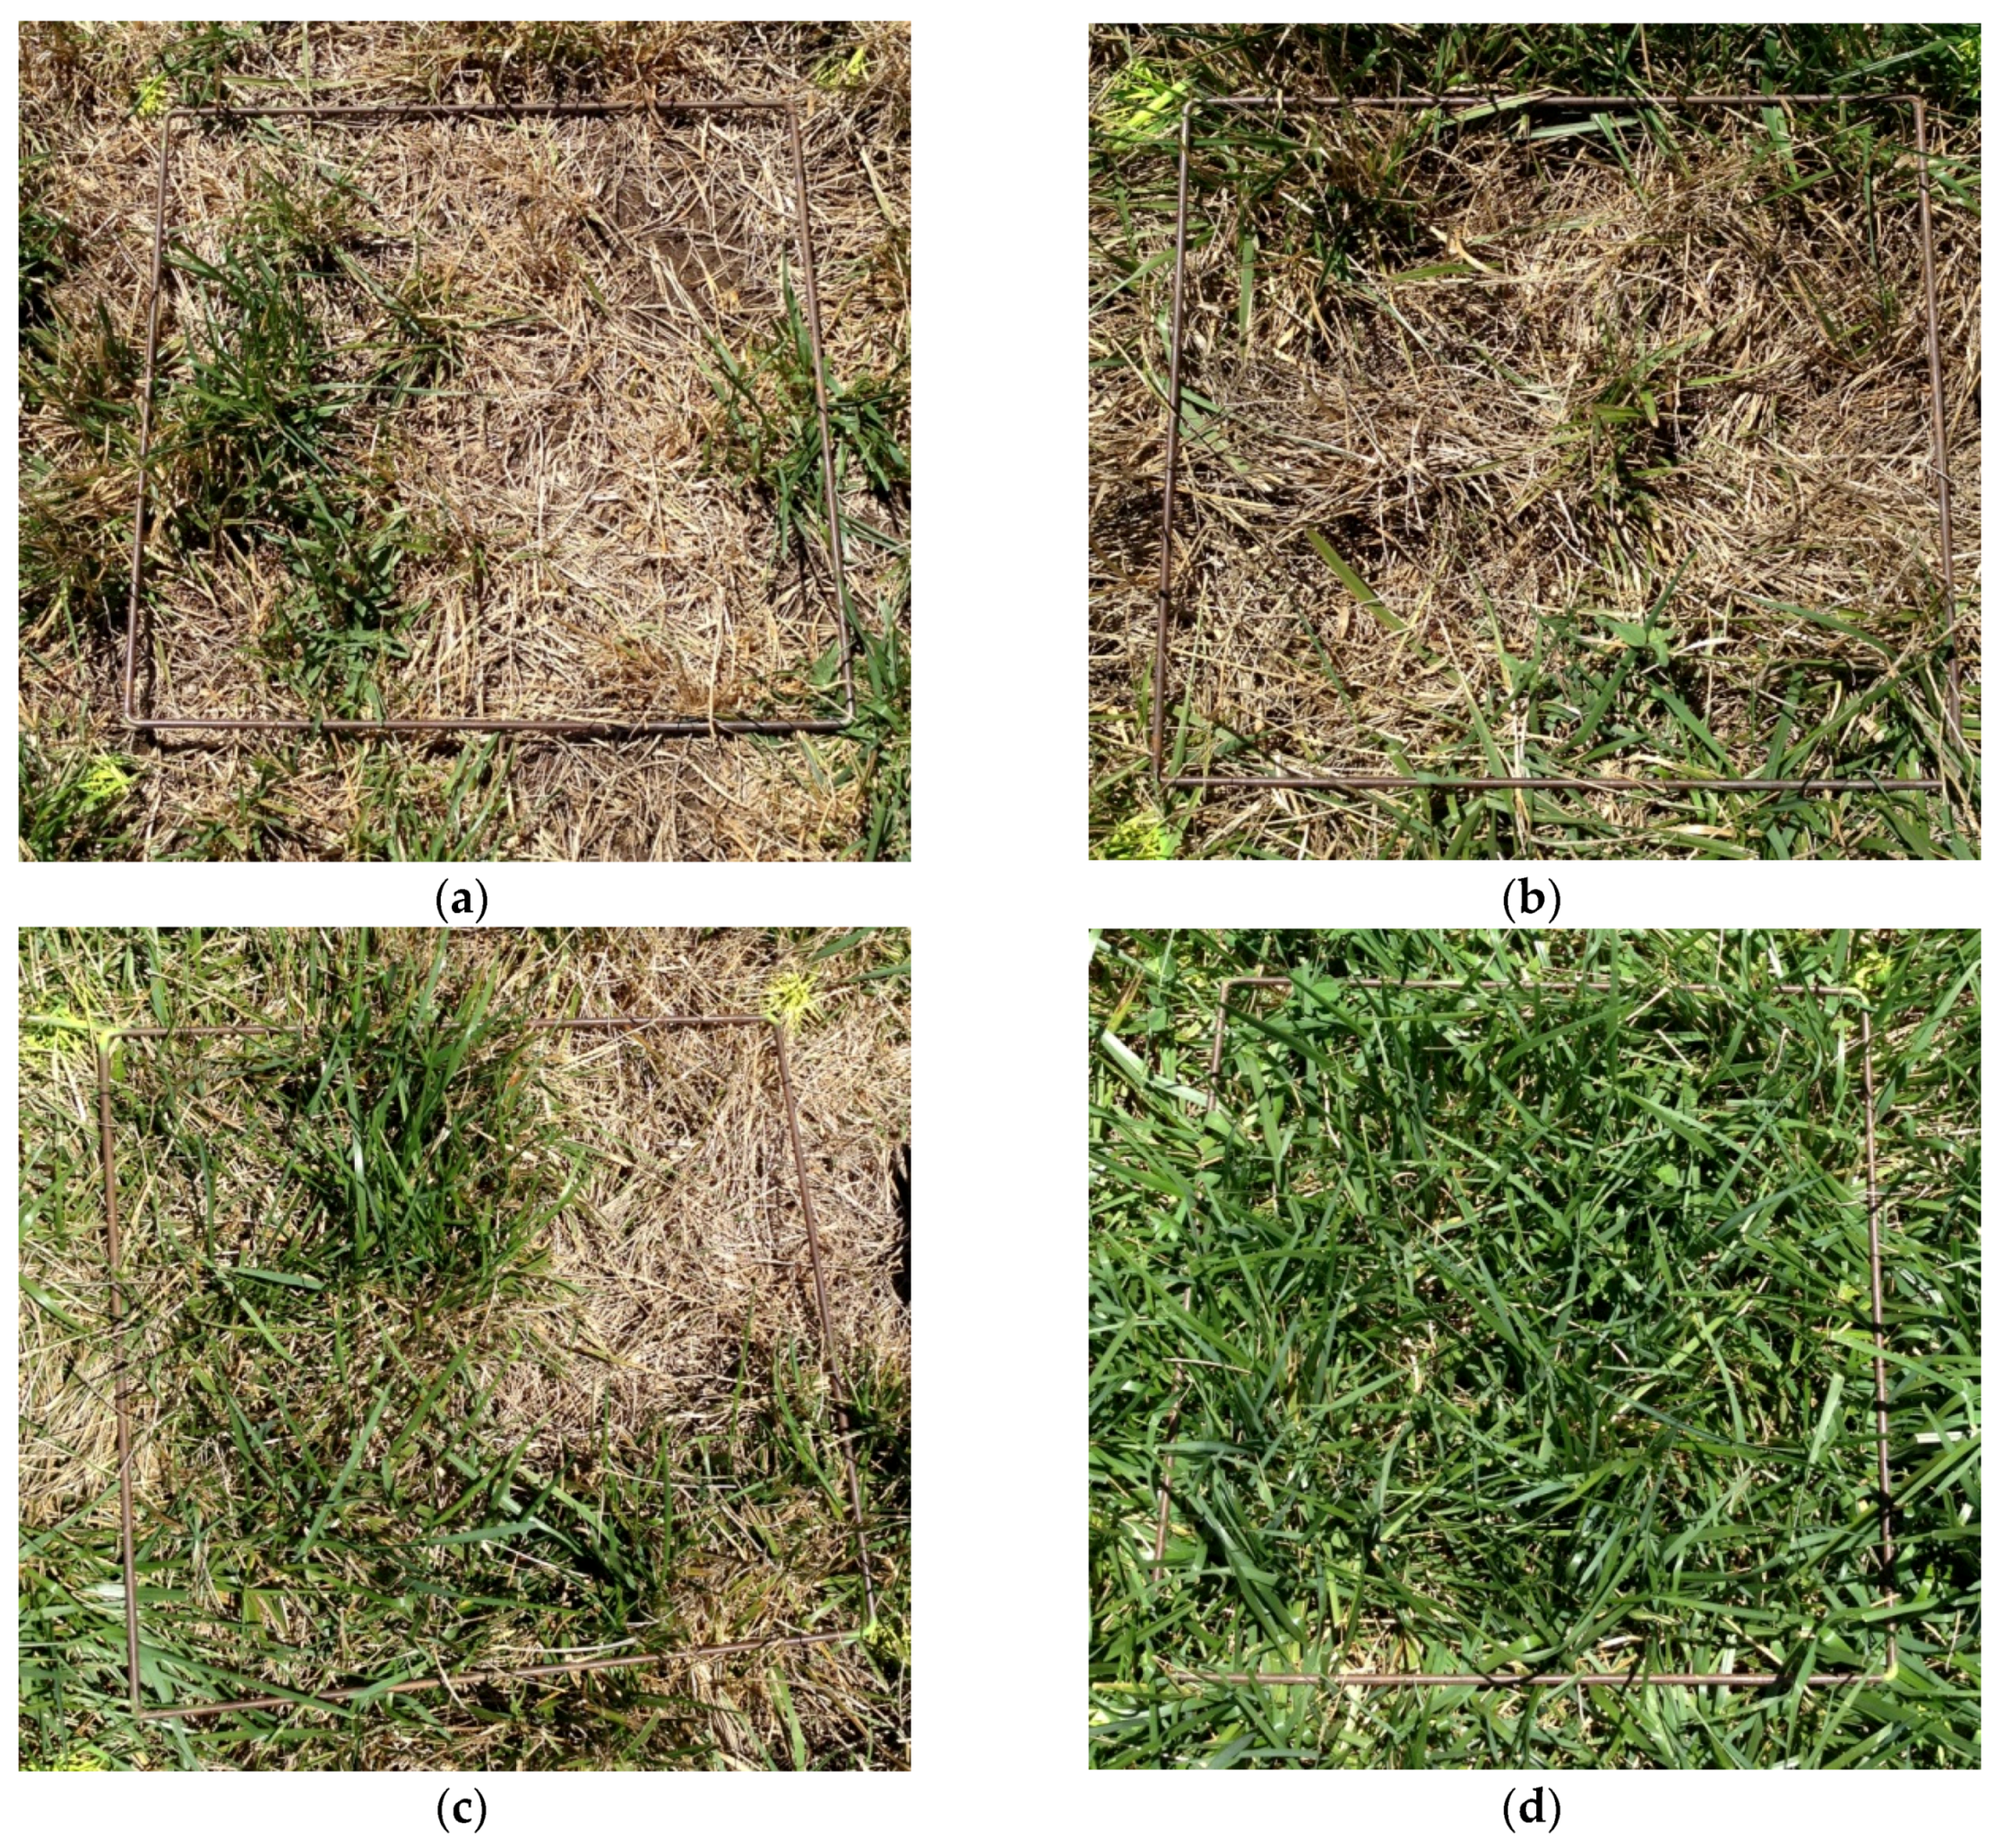
Figure 4a–c explains this as the senescent material is largely prostrate. What is most likely happening here is that the plots with lower green biomass, have more senescent material (or bare ground). In the case of this pasture species where the senescent material is prostrate (and not-unlike the bare soil), this creates a lower average height as measured by the LiDAR unit. In some pasture plots where the senescent material is standing and intermingled with the green fraction, it is unlikely the LiDAR unit would be able to discern different levels of green fraction and this is probably why there remains some scatter in the plot of
Figure 3b. The time of flight return signal of the LiDAR is unrelated to intensity (
i.e., local absorption) as influenced by, for example, the chlorophyll content or LAI of the plant canopy.
Figure 3.
Correlation of (a) Raptor normalized difference vegetation index (NDVI); (b) LiDAR canopy height; (c) LiDAR canopy height x NDVI (kg/ha), with measured green dry matter (GDM) (kg/ha) in an experimental plot of tall fescue (Festuca arundinacea var. Fletcher). Solid lines represent a natural log or linear curve of best fit, the “cross” data points indicate a green fraction of >60% by mass, while the “square” data points indicate a green fraction of <60%.
A linear model combining the parameters of height and NDVI into a single multiplicative index (height × NDVI) in
Figure 3c, displays a linear relationship with GDM (
R2 = 0.76), consistent with past work by Freeman
et al. [
29]. A combination of height and NDVI provides a more robust means of estimating GDM in light of the limitations of the NDVI-only or height-only approaches for divining green fraction biomass of the sward when there is a mixture of green and senesced vegetation. Moreover, if the green fraction of the pasture appears in clumps (e.g., as in
Figure 4a,b), then a high GDM (high LAI) pasture segment may be confined to a relatively small proportion of the reflectance sensor field of view, which means the proportional allocation of green
vs. non-green optical signal (hence traditional linear-mixing model approach) to the overall green fraction biomass determination in the complete field of view may break down. While determining the average height for a quadrat for clumpy pastures may also suffer a similar fate, it is expected that the height values combined with the optical reflectance index may be less sensitive to this confounding error. This is certainly consistent with the data in
Figure 3c.
Using the split datasets, the results of comparing the three regression equations derived from
Figure 3a–c, with the validation dataset are collated in
Table 1. The NDVI-only regression model provided a root mean square error of prediction (RMSEP) of 846.51 kg/ha, while the height only equation performed marginally better RMSEP of 708.13 kg/ha. The combination height × NDVI estimated the green fraction biomass with a RMSEP of 455.28 kg/ha.
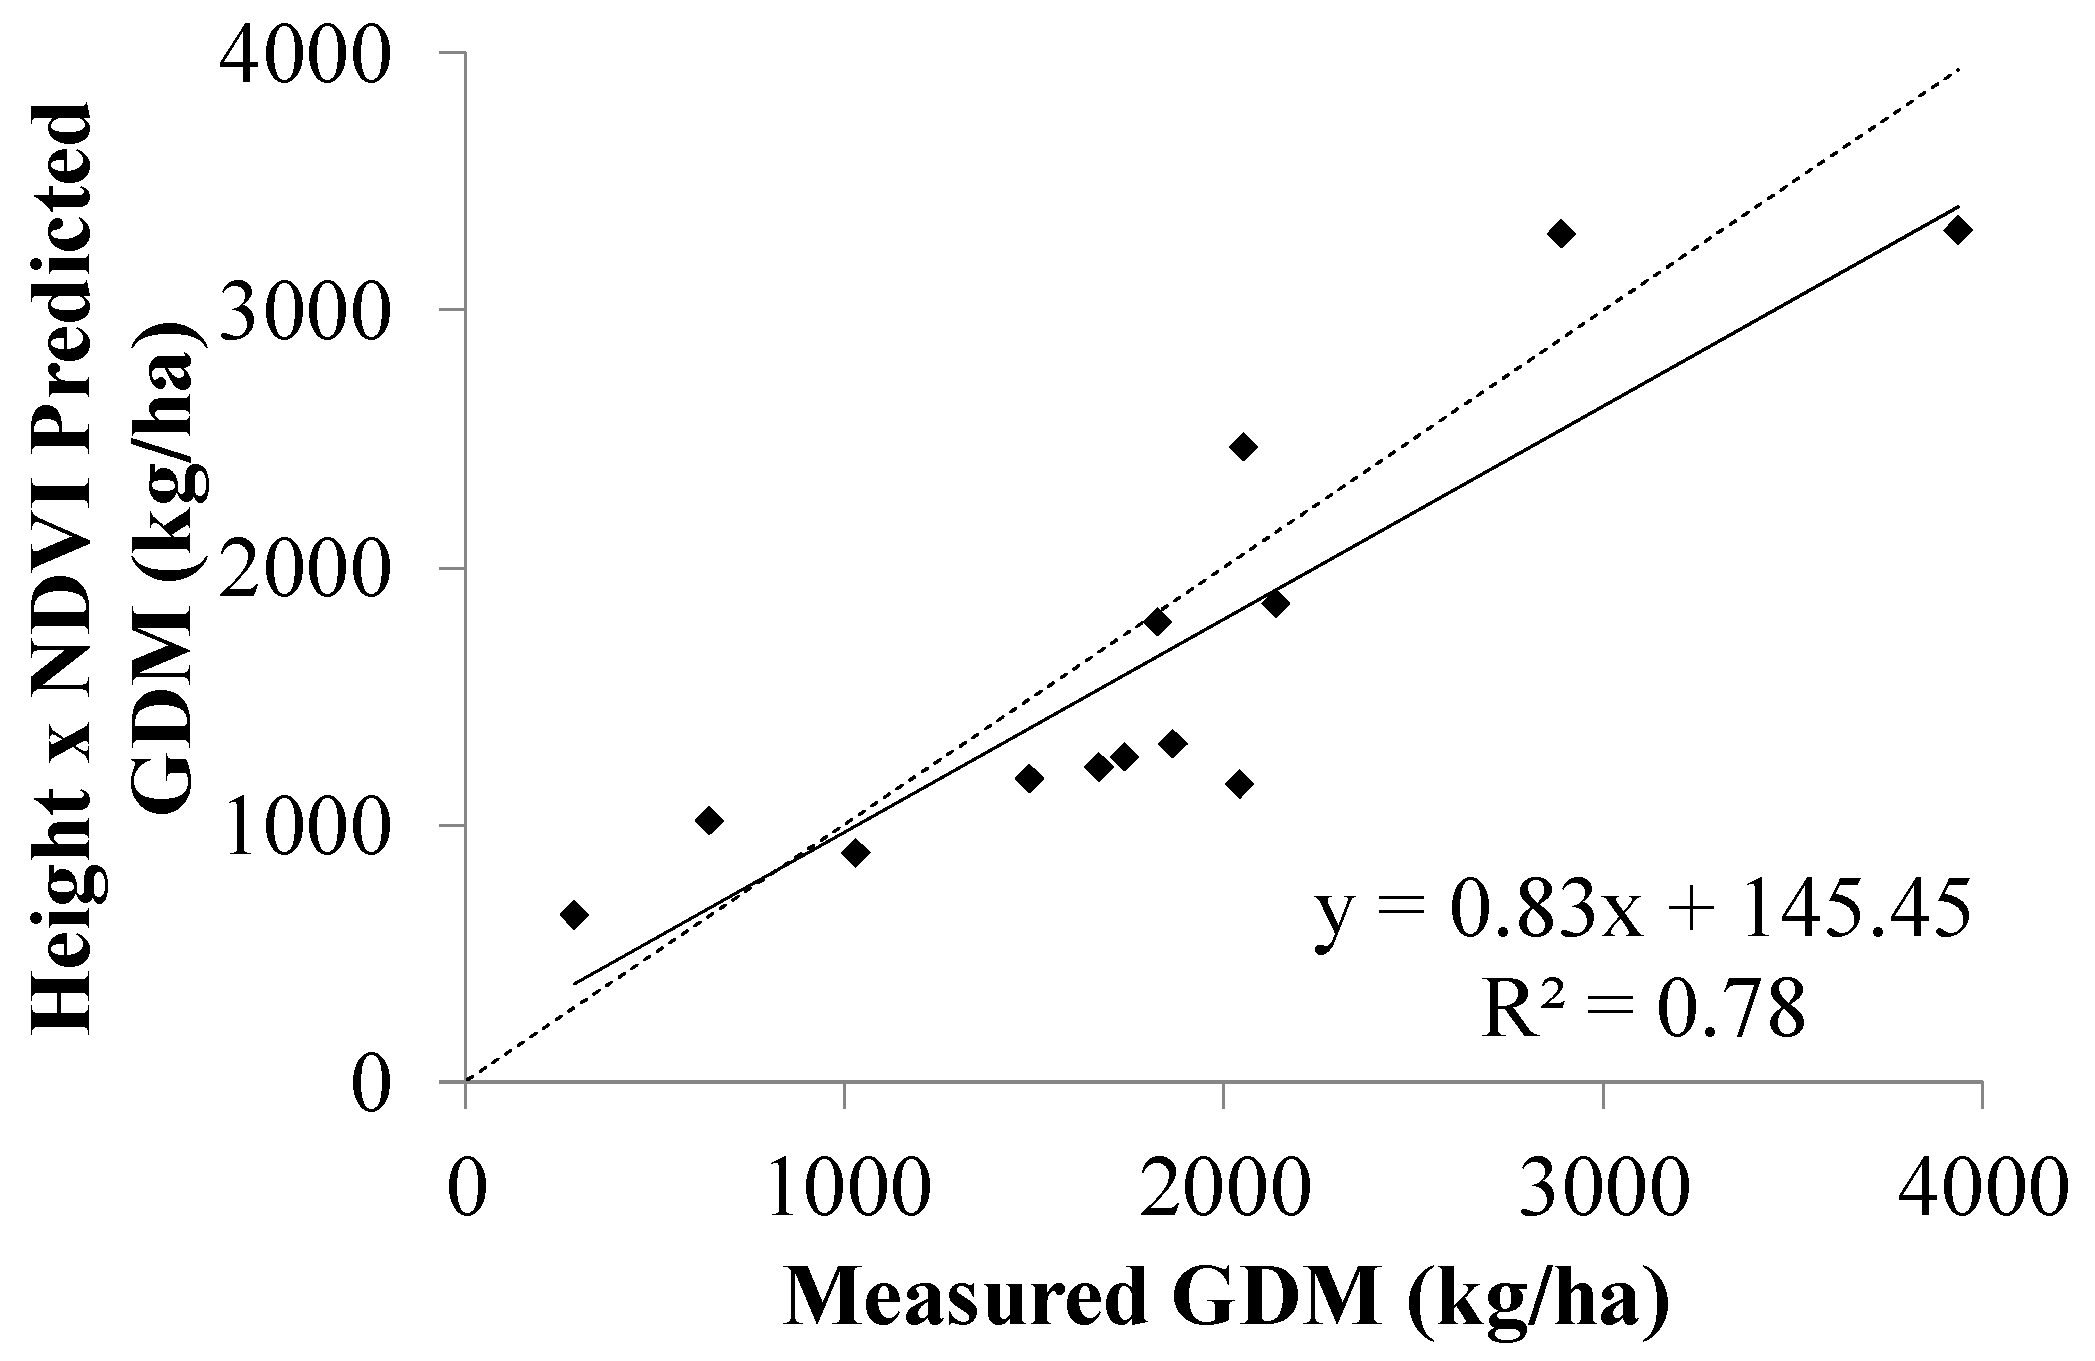
A graph of predicted
vs. actual GDM using the height × NDVI parameter is given in
Figure 5. The solid line of best fit (in relation to the 1:1 line) suggests that the combined sensor index tended to underestimate the actual GDM and this is consistent with the observations of other workers. It has been reported that the morphology of the vegetation canopy greatly influences the accuracy of some laser rangefinders [
33]. In particular, vegetation with an erectophile morphology (typical in grasslands and pastures) produce higher uncertainties in height measurements and tends to underestimate the mean reflection height [
33,
34], due to the outgoing laser beam typically glancing off the erectophile vegetation rather than reflecting back towards the sensor.
Table 1.
Performance of herbage mass (green dry matter, GDM) prediction models using the experimental tall fescue (Festuca arundinacea var. Fletcher) plot data set. RMSEP = root mean square error of prediction.
Table 1.
Performance of herbage mass (green dry matter, GDM) prediction models using the experimental tall fescue (Festuca arundinacea var. Fletcher) plot data set. RMSEP = root mean square error of prediction.
| Index Model Type | Predictive Equation Derived from Calibration Samples | RMSEP (n = 13), kg/ha |
|---|
| NDVI | | 846.51 |
| LiDAR canopy height | | 708.13 |
| NDVI × LiDAR canopy height | | 455.28 |
Figure 4.
Photographs of the pasture plots that highlight the variability within and between each of the plots, (a) senesced with low Nitrogen and biomass; (b) senesced with low Nitrogen and high biomass; (c) a mix of senesced and green vegetation with mid-range biomass; (d) green with high Nitrogen and biomass.
Figure 5.
(Height × NDVI) predicted GDM with measured GDM (kg/ha) in an experimental plot of tall fescue (Festuca arundinacea var. Fletcher). Solid lines represent linear line of best fit, while a dotted line indicates 1:1 line.
Figure 5.
(Height × NDVI) predicted GDM with measured GDM (kg/ha) in an experimental plot of tall fescue (Festuca arundinacea var. Fletcher). Solid lines represent linear line of best fit, while a dotted line indicates 1:1 line.
For this study, the NDVI was the only SRI that was examined as a predictor of biomass, the reason for this being that is it a commonly used index as well as the fact that NDVI is one of the standard outputs from the Raptor™ sensor. Additionally, NDVI was chosen in an attempt to “correct” the saturation that commonly occurs at higher biomass levels (
Figure 3a), which was achieved by adding LiDAR canopy height information (
Figure 3c). For future studies, in terms of vegetation indices that could be used to predict GDM when combined with LiDAR measurements, there are many different variations that would incorporate the red and NIR reflectance bands of the Raptor™ sensor. According to Trotter
et al. [
9], several candidates such as variations of the SAVI would be ideal to examine to verify if the prediction of GDM could be further improved.
Further investigation using this technology is required to refine the technique and further develop seamless on-the-go measurements using combined LiDAR/reflectance sensors. This study only covered a small area of around 0.02 ha, therefore in future studies it would be prudent to increase the size of the study area which would aid in scaling-up measurements from plot level to hectare level. Additionally, it would allow for measurements to be more accurately compared with aerial or satellite based measurements.


