1. Introduction
Up to this point in time, our civilization has developed three digital elevation models (DEM) covering nearly all the land masses of the world. These unprecedented achievements were completed over the last 12 years. Although maps and globes of the world showing the topography of the lands existed well before the turn of the last millennium, none of these topographic products were available at a spatial resolution and accuracy that would satisfy the numerous demands of the sustainable development of our civilization.
The WorldDEM™ digital elevation model is another global DEM, after GOTOPO30, the Shuttle Radar Topography Mission (SRTM) elevation data product [
1], the Advanced Spaceborne Thermal Emission and Reflection Radiometer (ASTER) [
1,
2], and the ALOS World 3D-30 m, known also as AW3D30, which is currently available to a broad range of users for various applications. However, the spatial resolution and, as we demonstrate in this paper, the accuracy of the WorldDEM™ is at least two times better than any other global DEM.
The accuracy of the SRTM and ASTER DEMs was studied by their creators and a number of other researchers using various reference datasets with an identical method, e.g., by studying the magnitude of differences between the reference dataset and the investigated DEM (see Reference [
3]). Typically, as a reference dataset, DEMs with a higher spatial resolution and higher accuracy, leveling benchmarks (point-type of data) and transects (linear-type of data) were used, e.g., Reference [
4]. There are a few disadvantages of using these datasets including their limited spatial extent and acquisition costs.
A novel method of the accuracy assessment of DEMs was proposed in [
1]. As reference data, profiles along the centerline of a certain number of runways were used. The advantage of using the runways as reference data include the fact that the runways’ data are in the public domain (as a part of air transportation safety requirements), and as these are freely available online, their accuracy is at the centimeter level, reliability is guaranteed by the respective government authorities and runways are distributed around the world. The latter fact is important when a global DEM is to be tested.
The method is novel because of the way the error of the DEM is mathematically modeled. A traditional model of the DEM error assumes that the error is a single signal. In the new method, the error model is composed of three statistically and physically independent terms, namely the instrument-, target- and environment-induced errors. The runway method (RM) has been used to assess the SRTM [
1], and the SRTM and ASTER models [
2] using the runways’ profile data. The runway data are available from an online repository of information for some 8000 runways located on six continents. This repository has been compiled and maintained by one of the authors of this paper [
5].
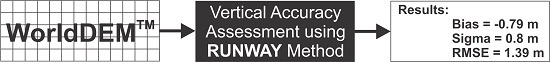
The aim of this contribution is to assess the vertical accuracy of the WorldDEM™ using the RM method. We achieved this aim by studying the discrepancies between the WorldDEM™ profiles and the runway profiles of 47 airports according to RM method procedures. Our tests support a statement that the WorldDEM™ appears to be superior to any other currently available global DEM.
2. Materials and Methods
2.1. The Runway Method (RM)
The runway method was introduced in [
1,
2]. Therefore, here we only outline the fundamentals and the basic features of the RM method. The elevation error of a DEM is traditionally expressed as a variance (
σ2) of differences between the DEM elevations and corresponding elevations of a reference dataset. It is usually assumed that the differences are caused by normally distributed random processes. In that case, the positive term of the root squared of the variance is simply the standard deviation (
σ), also known as the root mean square error (RMSE). Attempting to identify the sources of the DEM error, one may note that three such error sources are obvious. They are [
1]:
Instrument-induced error (I),
Environment-induced error (E),
Target-induced error (T).
The instrument-induced error is a result of an imperfection in the instrument used to measure elevations. In our case, this is the total error of the acquisition and processing of the Synthetic Aperture Radar SAR data acquired by the TanDEM-X mission.
The environment-induced error is due to the impact of the environment. This error is external or independent of the instrument. For example, atmospheric refraction impacts measurements performed using electromagnetic waves. The magnitude of the refraction depends on the properties of the atmosphere and not on the instrument.
The target-induced error is caused by the discretization process of the surface of the terrain. The commonly accept fact is that the target-induced error depends on the size of pixel and the slope of terrain. As it was shown [
1], that can be expressed using Equation (1) as follows:
where
d is the pixel size and
slope is the average terrain slope in the pixel.
The target-induced error is zero for horizontal pixels (
slope = 0). This fact implies that over flat terrain, the accuracy of DEM is influenced by instrument- and environment-induced errors only, and is independent on the pixel size. Further, once these flat terrain errors are determined, the total DEM error can be calculated as a sum of variances of the error components. This is possible because these error sources are physically and statistically independent of each other. Therefore, the variance of the total DEM error is given by Equation (2) [
1]:
where indices
I,
E and
T refer to the instrument-, environment- and target-induced error sources, respectively.
Note that the variance of the total DEM error changes from pixel to pixel, following changes to the slope of a given pixel.
The flat terrain errors can be estimated using the elevation data of runways by comparing these elevations with the corresponding elevations extracted from the investigated DEM. The elevation data were extracted from the WorldDEM™ raster along centerlines of the runways using the ArcMap software package. The centerline of the runways used in this study were projected on the GoogleEarth® images which may be viewed using the kmz file found in the online material. In some cases, there are small discrepancies between the centerline and the image which are due to residual inaccuracies in georeferencing of the GoogleEarth® imagery; as such, they do not impact the results of this study.
2.2. TanDEM-X Mission
The primary goal of the mission is the generation of a worldwide, consistent, homogenous, and high precision digital surface model (DSM), covering the Earth’s surface as seen with an X-band radar sensor including vegetation and man-made objects.
The concept of the mission is to complete the global homogeneous DEM in the shortest possible time frame. To achieve this ambitious goal, the acquisition plan is optimized for time-efficient coverage of the Earth’s entire landmass. As a result, the acquisitions are not recorded region by region but rather in the style of a jigsaw. Seemingly random acquisitions are made in different locations across the globe and piece by piece the jigsaw is completed with the overall picture becoming visible once all pieces are assembled.
For data collection, the two satellites operate in the bi-static interferometric StripMap mode. In this mode one satellite transmits the radar signal to illuminate the Earth’s surface, while both satellites record the signals backscattering. This simultaneous data collection avoids possible interferometric data errors due to temporal decorrelation and temporal atmospheric disturbances.
Within four years data over each spot on Earth was collected at least twice. To ensure a reliable homogeneous quality of the global coverage areas with steep terrain and complex land cover like tropical rainforest were covered even three or four times. Latter areas are identified from the previously collected data. For the third and fourth coverage, an even more complex satellite operation adjustment was performed. At the start of the TanDEM-X mission the TanDEM-X satellite circled around the TerraSAR-X satellite anti-clockwise. After the satellites swapped the direction is now clockwise. This change effects that mountainous terrain is viewed from a different viewing angle to eliminate missing information due to radar effects [
6].
The ground segment processing at the German Aerospace Center (DLR) is adapted to the phases of the data acquisition schedule. In a systematic data-driven processing step, all SAR raw data are processed to so-called raw DEMs performed by one single processing system, the Integrated TanDEM-X Processor. Key elements of the interferometric processing chain are the timing and phase synchronization as well as instrument corrections, approximation of the bi-static acquisition geometry, high resolution image co-registration, spectral matching of time variant azimuth spectra, unwrapping of steep phase gradients on small scales, and finally consistent geocoding of all product layers. These raw DEMs are input for the Mosaicking and Calibration Processor, which produces the seamless mosaicked and balanced global DEM [
7,
8].
Output is the so-called TanDEM-X DEM, a pole-to-pole elevation dataset. No additional post-processing is applied. SAR-specific artifacts due to the terrain or processing artifacts stay untouched.
2.3. WorldDEM™ Products
WorldDEM™ is the commercial product line product produced by Airbus DS. Based on the TanDEM-X DEM, different standardized elevation products are developed and launched to the market. The WorldDEM™ product line consists of a DSM representing the Earth’s surface including heights of buildings and other man-made objects, trees, forests and other vegetation and a Digital Terrain Model (DTM) representing bare Earth: vegetation and man-made objects are removed.
The DSM product, called “WorldDEM”, is an edited surface model. Post-processing of the TanDEM-X DEM data is necessary to reduce impacts of SAR-specific data features and artefacts in the elevation model. The WorldDEM™ editing process can be described in two major steps. The terrain editing step comprises the correction of terrain artefacts caused by SAR specific characteristics (e.g., layover and shadow) or the DSM processing.
The DTM, called “WorldDEM™ DTM” is processed based on WorldDEM™. The dataset represents elevation information without obstruction features above ground; however, terrain characteristics are preserved.
Each editing process is followed by a Quality Control (QC). This QC check consists of a combination of automatic tools and visual inspection of the data by an independent operator. This check is a thematic validation and is performed according to ISO 2859.
Table 1 provides some basics metadata on the WorldDEM™ products.
2.4. The Global Elevation Data Testing Facility (GEDTF)
Flat terrain errors can be estimated using elevations of the centerline of runways. These structures are almost flat (slope is usually less than 1°), are covered with the same material (usually asphalt or concrete), and data on their geometry is available in the public domain. The Global Elevation Data Testing Facility (GEDTF) [
5] contains some 8000+ runway centerlines of airports world-wide. The vertical accuracy of the elevation is estimated at approximately 0.1 m (one standard deviation).
The runway data were extracted from the portal of the European AIS (Aeronautical Information Services) Database (EAD). EAD is a database of quality-assured aeronautical information for airspace users and an integrated AIS solution for service providers. The data are provided by the EUROCONTROL (European Organization for the Safety of Air Navigation) [
9].
The average length of the runways was 3149 m. Each profile was represented using 500 samples. These samples were interpolated from the “as constructed” profiles of runways. The runway profile data are provided in the Universal Transverse Mercator (UTM) horizontal reference system on WGS 84 ellipsoid, and elevations are orthometric one (approx. equivalent to the mean sea level elevations).
Table 2 shows some basic data on the 47 runways used in this study.
2.5. The WorldDEM™ Profiles
The WorldDEM™ profile data were extracted along the centerline of the runways using the ArcMap GIS software. Each profile is represented by 500 samples that were interpolated using the bilinear interpolation method. The average distance between samples is approx. a half a pixel size, e.g., 6.3 m. Each sample is coincidental with the sample of the reference runway profiles.
2.6. Data Processing
The references extracted from the WorldDEM™ data were subsequently processed according to the following steps:
For each of the 47 runways, and for each of 500 samples within each profile, the difference di = hDEM − hR; i = 1,…500, were calculated;
The mean difference Dj; j = 1,…,47, between the WorldDEM™ profile and runway profile was calculated for each runway;
The standard deviation σj; j = 1,…47, of the differences for each runway was calculated; and
The
RMSEj;
j = 1,…47 of the differences was calculated for each runway using the following well-known formula:
Overall mean and median difference, mean standard deviation and mean RMSE were also calculated;
A histogram of all differences was calculated; and
The Laplace probability density function (pdf) was calculated according to Equation (4):
The parameter
m is the location parameter, and
a is the scale or diversity parameter. The maximum likelihood estimator of
m is the median, and the maximum likelihood estimator of
a is given by Equation (5) [
10]:
where
n is the number of samples (47 × 500 = 23,500 samples) and
m is the median of the differences.
3. Results
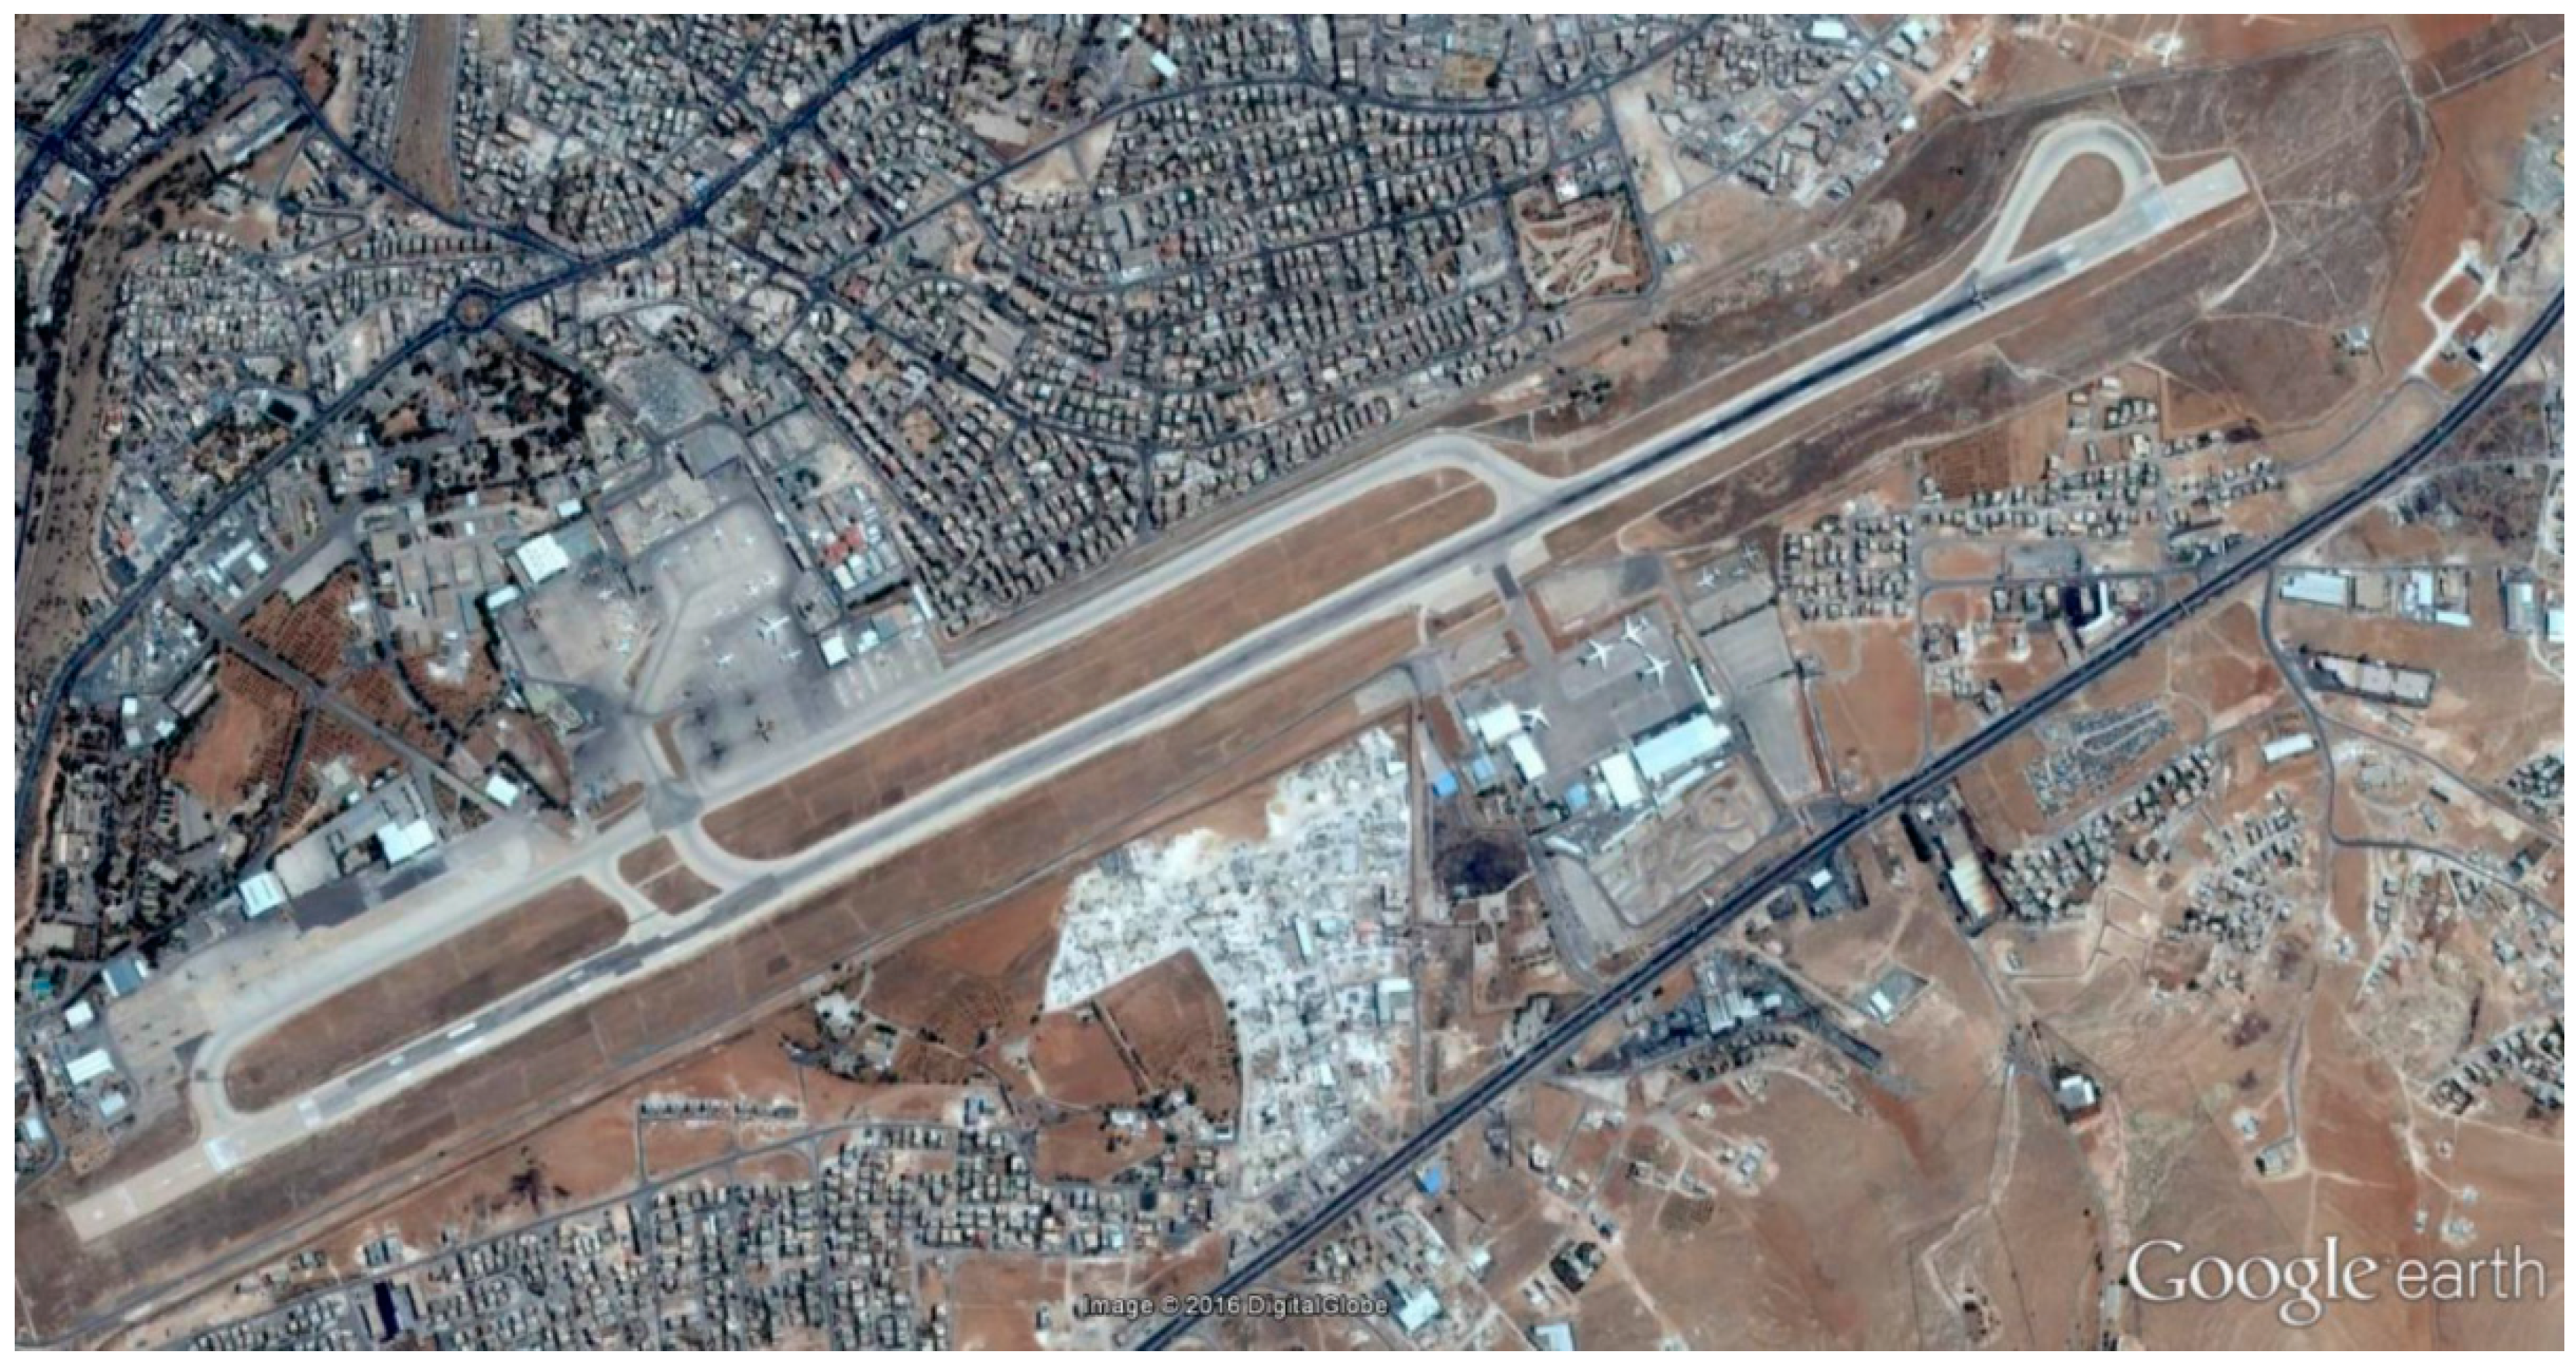
Figure 1 shows a Google Earth
® image of the Amman Civil Airport (OJAM) in Jordan. The length/width of the runway is 3275 m and 45 m, respectively.
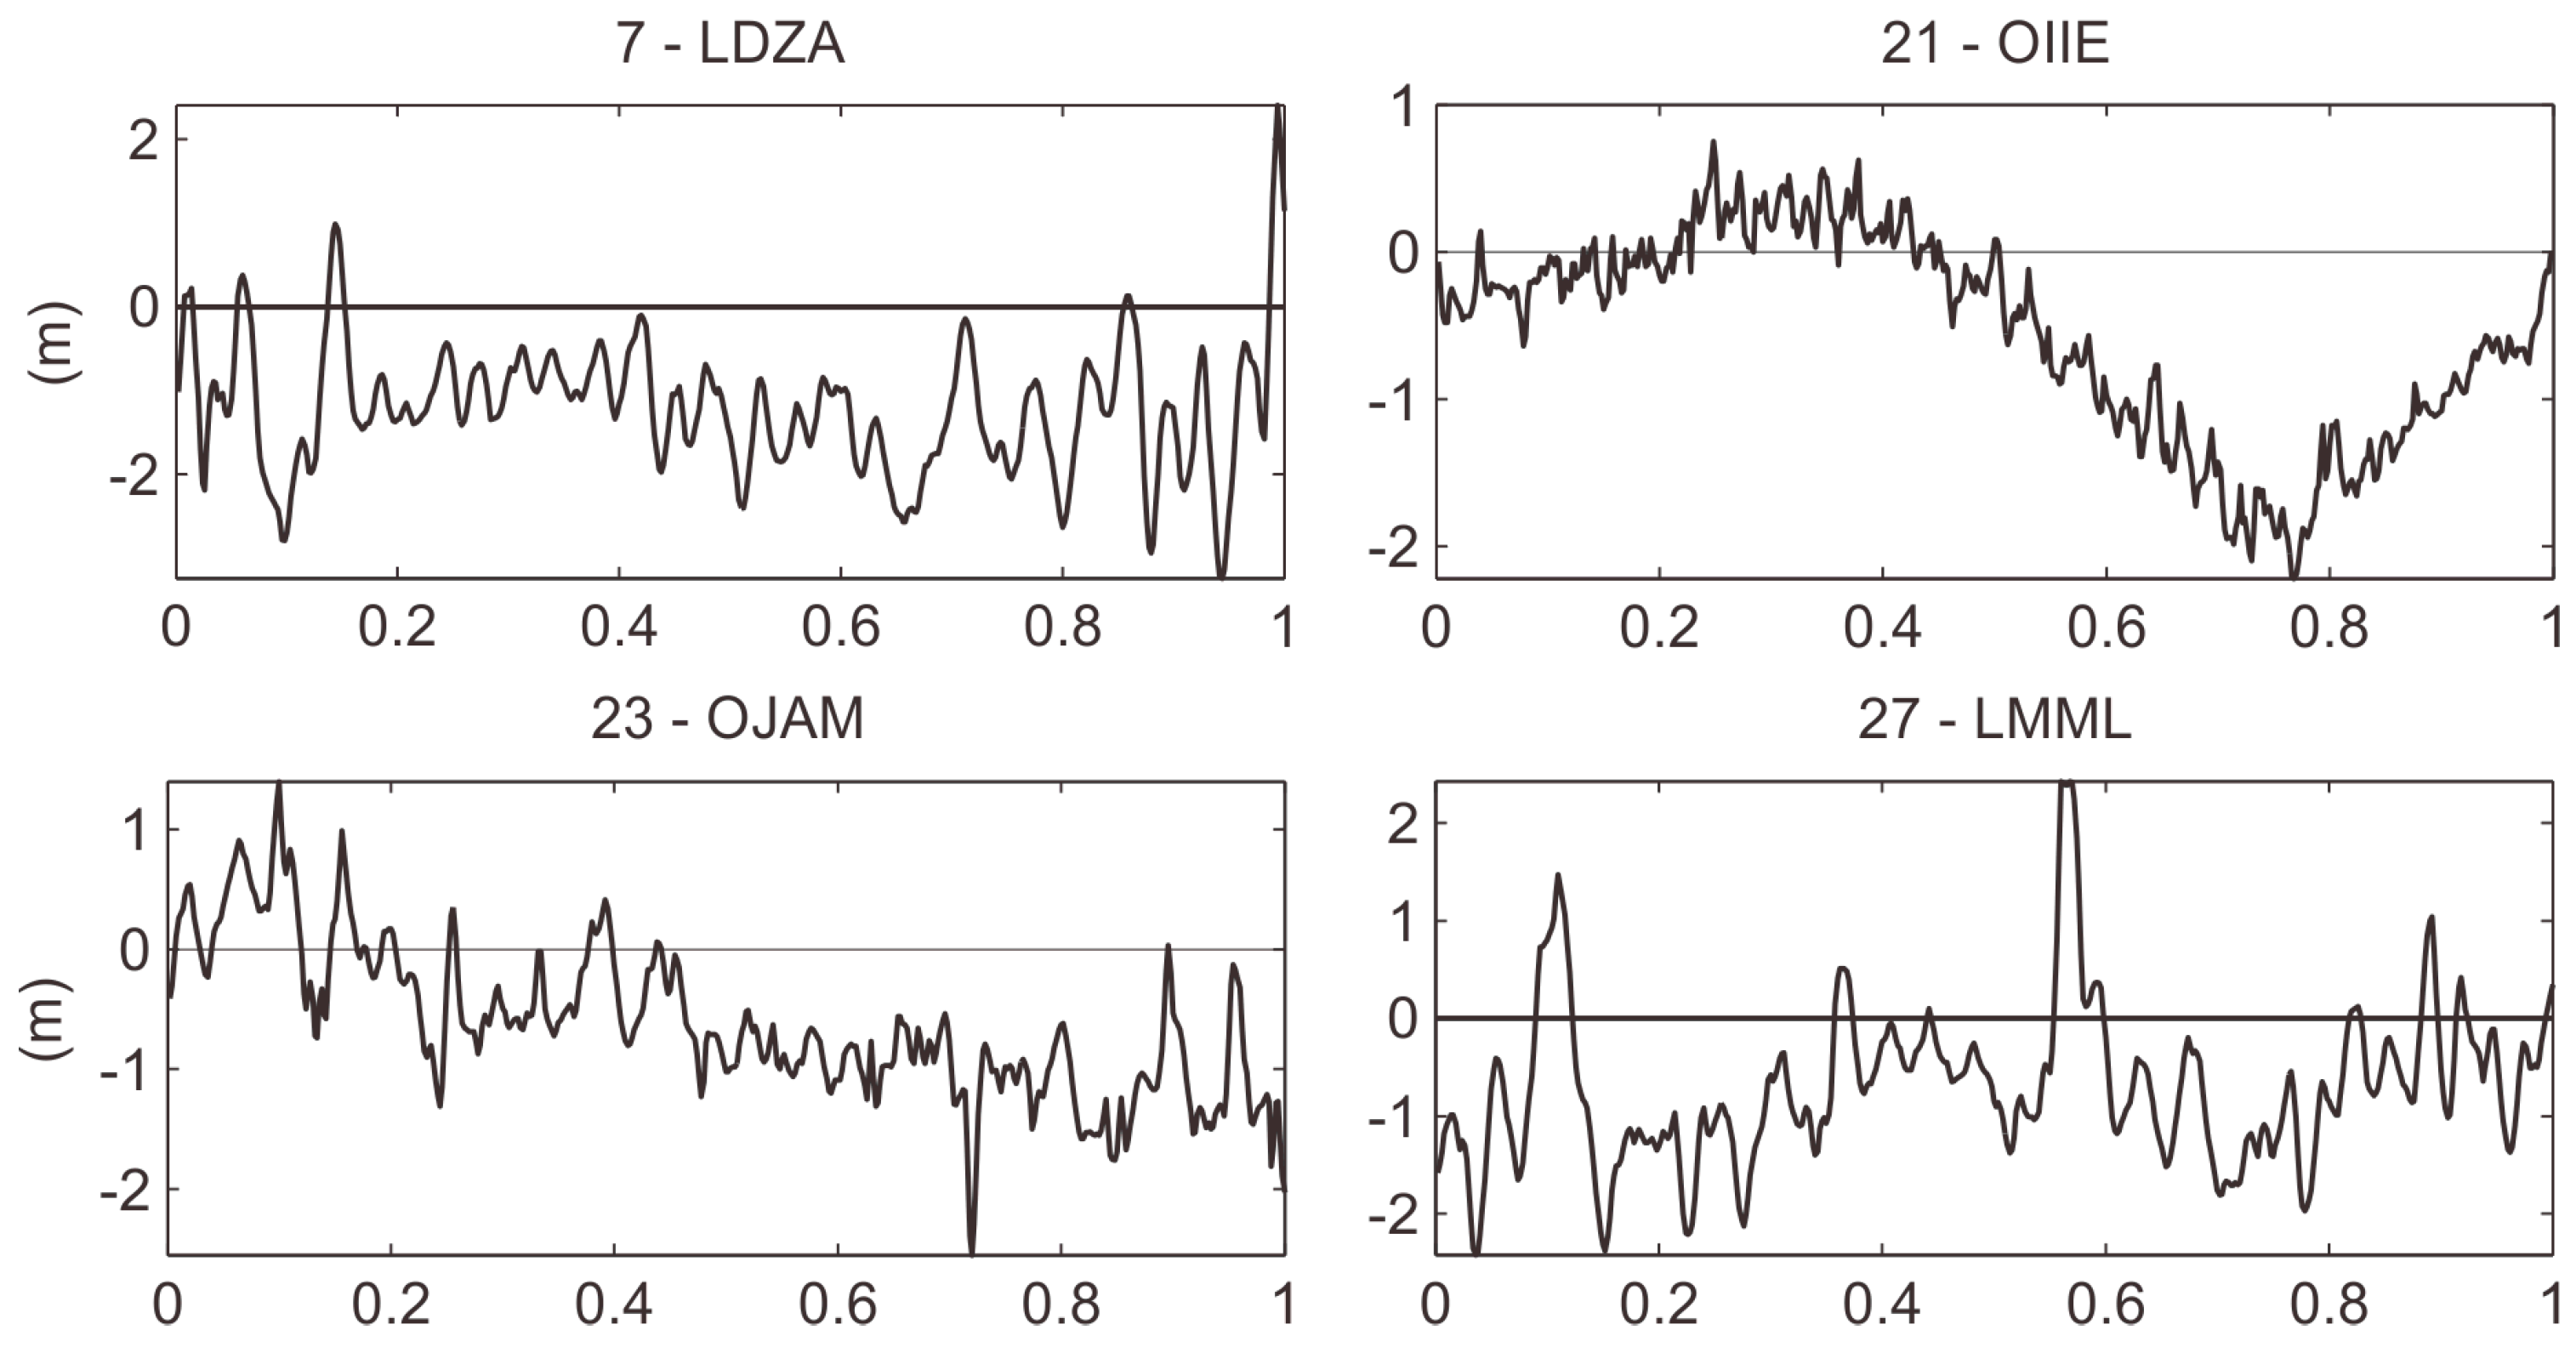
Figure 2 shows plots of differences of WorldDEM™ minus the ‘as constructed’ profile of the centerline for four runways. Similar graphs of all tested runways appear in Appendix A. The length of the profiles on the graph is normalized.
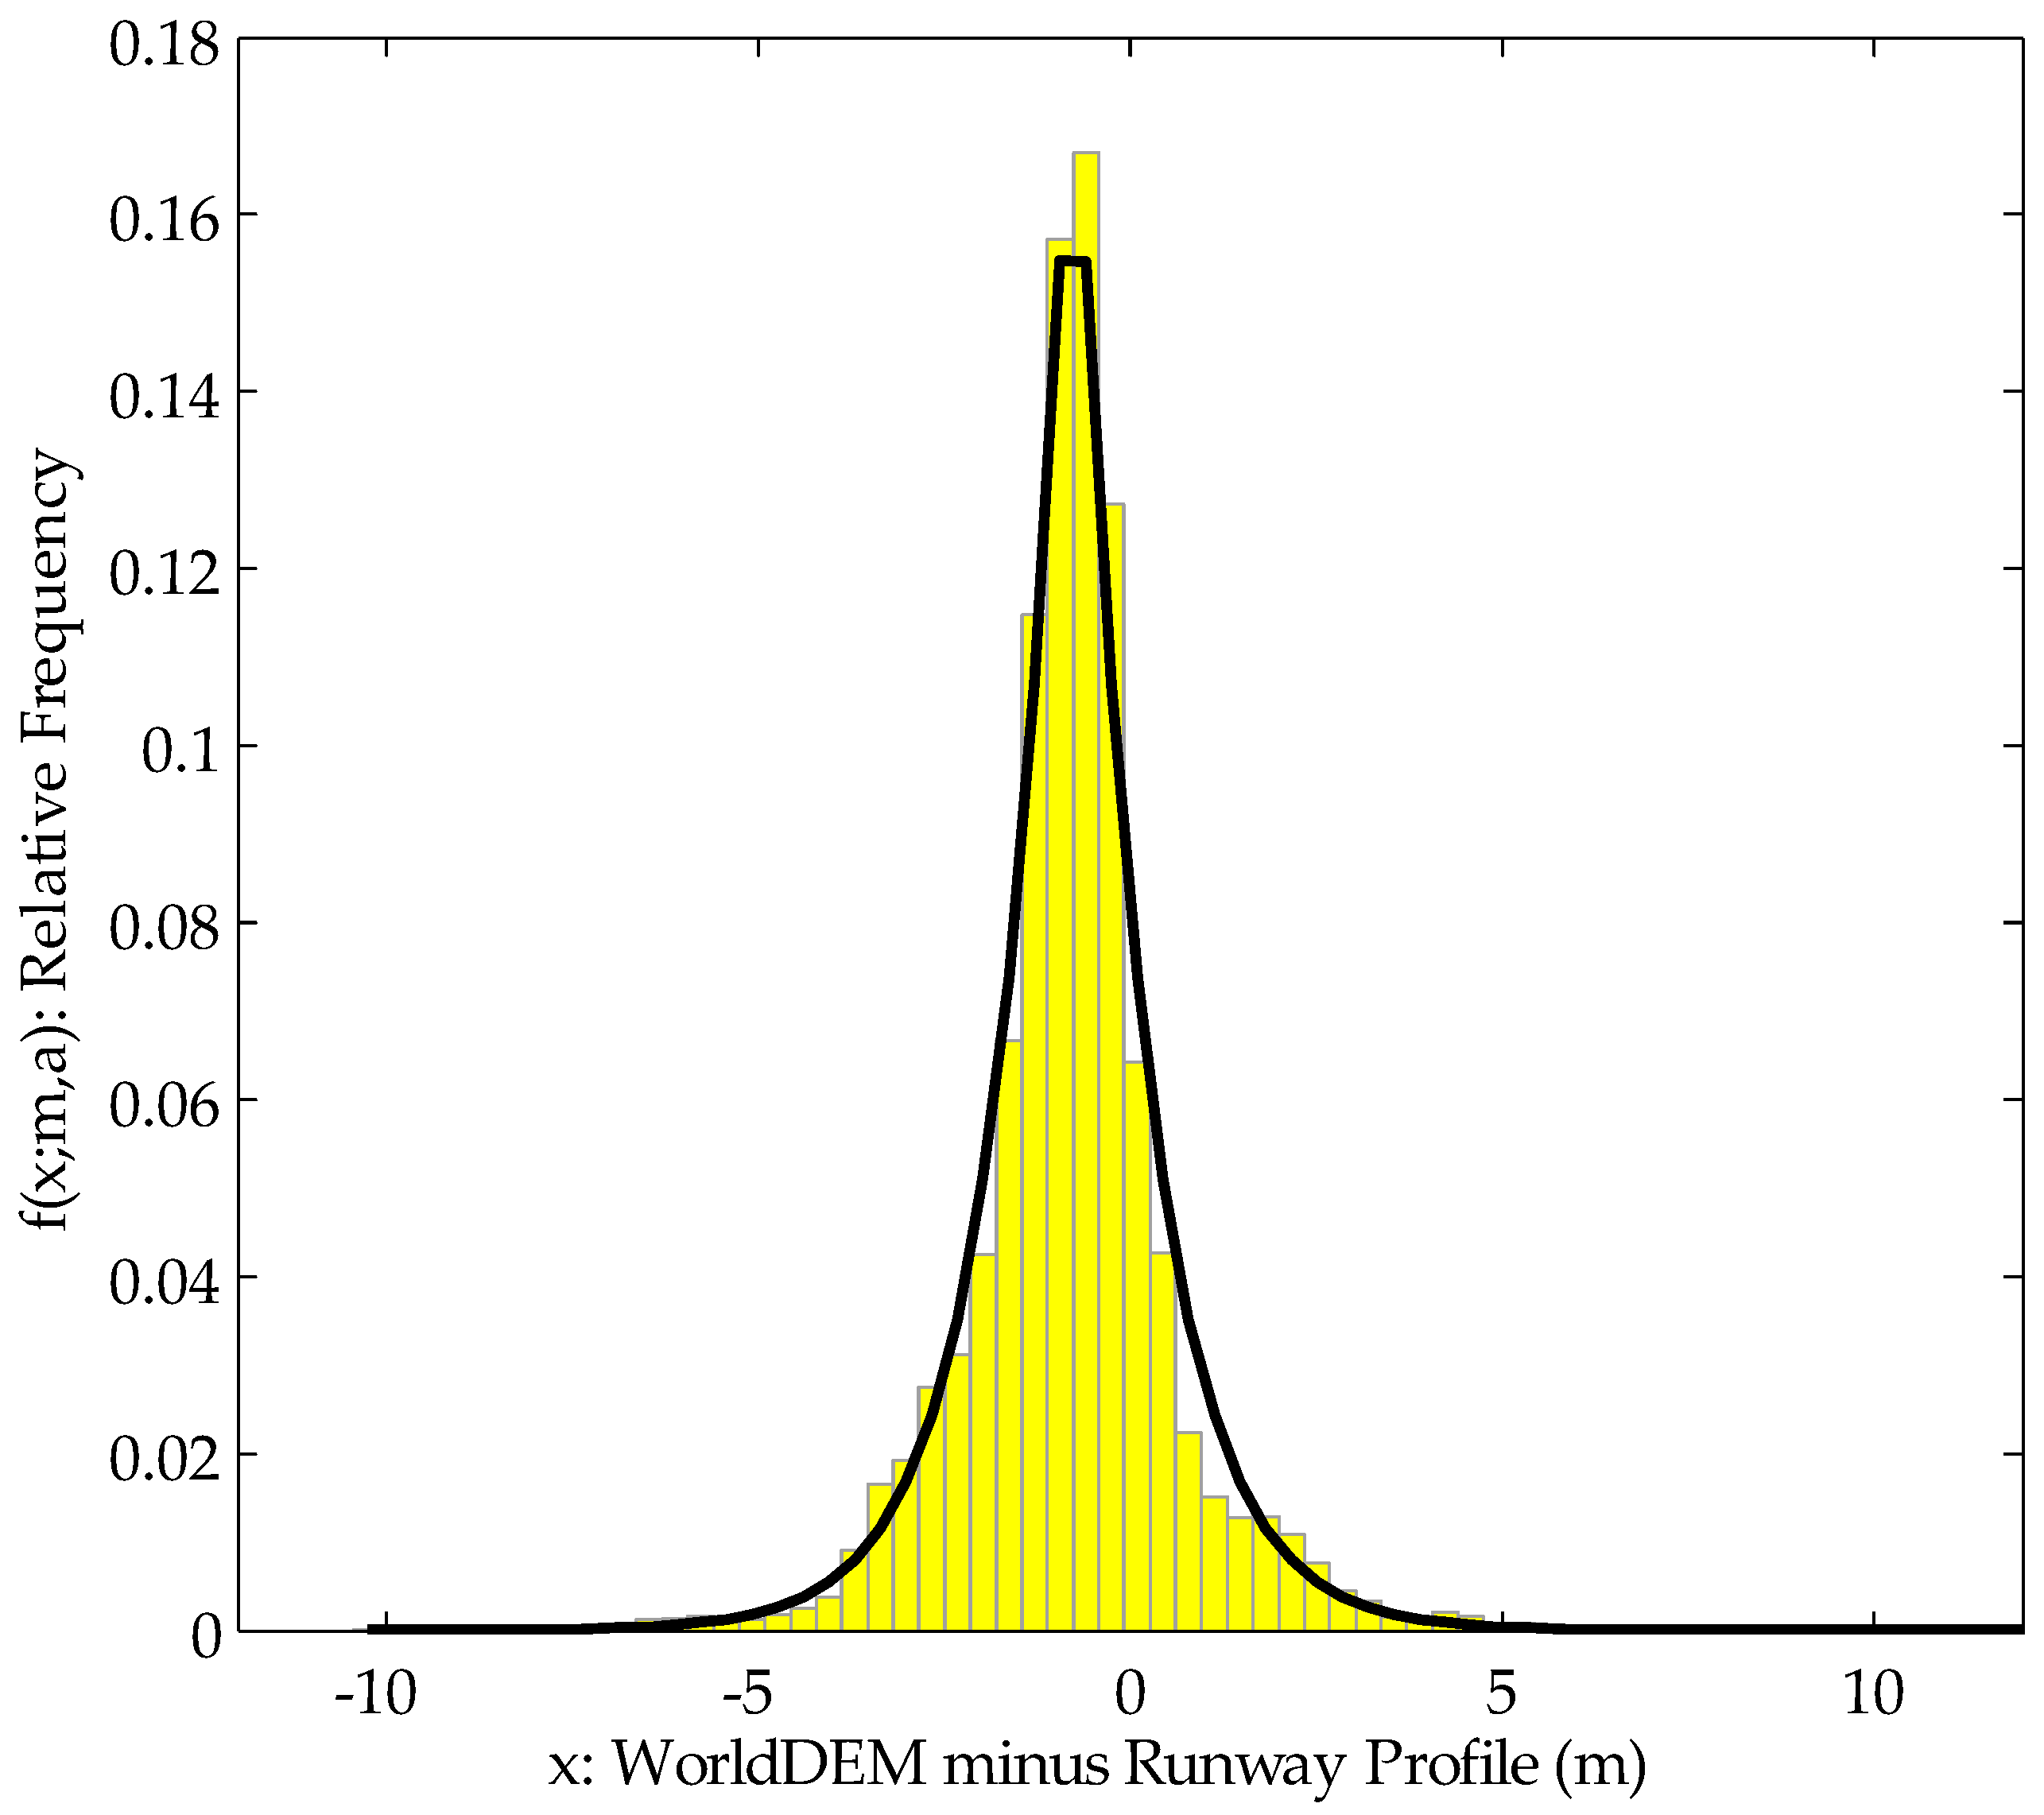
Figure 3 shows a histogram of the differences of the WorldDEM™ minus the corresponding ‘as constructed’ runway profiles for 47 airports. In addition, the Laplace probability density function is shown. It appears that there is a close match between the histogram and the Laplace probability density function (pdf). The parameters of the pdf, i.e.,
m = −0.79 m and
a = 0.93 m, were estimated using the 23,500 height differences.
Table 3 lists statistical indices of the accuracy of the WorldDEM™ data over the tested runways and the averaged indices over all the tested runways.
The mean difference of WorldDEM™ minus the ‘as constructed’ profile heights is −0.79 m, which indicates that there is a systematic error of that magnitude in the WorldDEM™ data. The mean standard deviation is 0.80 m, and the mean RMSE is 1.39 m. The extreme differences are −10.44 m and 17.19 m for Ninoy Aquino International Airport (RPLL), Manila, Philippines, and Stuttgart Airport, Germany (EDDS), respectively. In the RPLL runway case, almost all elevations are too low with an unexplained extreme low reading of −10.44 m. An isolated ‘jump’ in elevation in the EDDS profile was probably caused by an airplane taking off/landing at the time of the TanDEM-X data acquisition.
4. Discussion
The results of the vertical accuracy assessment of the latest global digital elevation dataset, the WorldDEM™, have proved the supremacy of this model over other currently available global elevation datasets, e.g., SRTM and ASTER-2 [
2].
Table 4 lists the vertical accuracy statistics of the SRTM and ASTER-2 global elevation datasets. These statistics are comparable with our results, because they were developed using the same method and approximately 50% of the runways used in the SRTM and ASTER-2 tests [
2]. Clearly, the WorldDEM™ outperforms the SRTM dataset by two times, and the ASTER-2 even more times. Also, at least a two-times-smaller standard deviation (σ) for the WorldDEM™ than the SRTM (0.8 m vs. 2.2 m) suggests that the WorldDEM™ exhibits lower levels of the high frequency noise; hence, it looks smoother. The WorldDEM™ data, likewise the SRTM and ASTER-2 data, suffers from a systematic vertical error or bias. However, the magnitude of this bias in WorldDEM™ is significantly smaller than in SRTM.
It must be noted that the unique feature of this study, which used the runway method, is that the estimated RMSE concerns the instrumental-induced component of the DEM error only. The instrument-induced error is a function of a few factors including the internal accuracy of the instrument used to collect the data, the properties of the method used (SAR Interferometry), the number of data takes and the subsequent processing of the collected data. Note, however, that to calculate the total vertical error at a given pixel of a DEM, one must also estimate the target-induced error (Equation (1)), and finally aggregate the error components using Equation (2).
The significantly smaller RMSE for WorldDEM™ is most likely a result of a few factors including the larger number of data takes acquired during the TanDEM-X mission, the sophisticated two-satellite solution (the bi-static mode). In this context, one should remember that the SRTM mission acquired all data within 11 days of the space shuttle mission, while the TanDEM-X mission has been collecting data for a few years.
The specification of the WorldDEM™ (
Table 1) requires the absolute vertical accuracy to be <4 m and <10 m for slopes <0% and >20%, respectively. Having these figures, it is possible to estimate if the WorldDEM™ fulfills the specified error level.
The target-induced error (Equation (1)) for slopes <20%, and a pixel size of 12 m (0.4 in), is <0.69 m. Hence, the total error (Equation (2)) is 1.39 m, which is well below the specified 4 m.
To check the error level for slopes >20%, we calculate the maximal slope for which the error is <10 m. A simple calculation yields that the WorldDEM™ error is <10 m for slopes of up to 288% (<70°).
All DEMs produced using SAR interferometry are too high over vegetated areas due to the vegetation bias [
1,
11]. The magnitude of this shift depends on the vegetation height, tree crown shape and vegetation density. It has been demonstrated that the vegetation bias or forest impenetrability is approximately 60% of the tree height [
12]. A vegetation-free version of the WorldDEM™ (WorldDEM™ DTM) is available. To date, there are no reports on the accuracy of the WorldDEM™ DTM.
5. Conclusions
This study of the vertical accuracy of the latest global elevation dataset, the WorldDEM™, which was carried out using the RM method, indicates that the instrument-induced vertical error is smaller than that of AW3D30 (1.39 m vs. 1.69 m RMSE (based on preliminary results of the accuracy assessment using RM by the authors)), and significantly smaller (1.39 m vs. 2.78 m RMSE) than that of the SRTM. A visual inspection of the residuals on all runways worldwide seems to suggest that the vertical accuracy of the WorldDEM™ is spatially independent.
The results of this study are consistent with the results of other studies [
7,
13,
14,
15,
16,
17] which were carried out using a traditional method on completely different reference data sets than the runways.
Table 5 shows a comparison of the accuracy assessment of the WorldDEM
TM performed using various reference data [
17] and the results obtained in this study.
Both the vertical accuracy and spatial resolution of the WorldDEM™ (pixel 0.4 in or approximately 12 m at the Equator) make this dataset suitable for topographic mapping at scales of 1:10,000 and smaller with contour lines at 5 m intervals. The TanDEM-X—derived DEMs were already used in a few branches of science, including forestry [
18,
19,
20], glaciology [
21], and volcanology [
22].
The RM method and its theoretical foundation is a convenient, cheap and above all theoretically sound way to assess the accuracy of any DEM model, not necessarily a global one. Note also that reference data elevation of any flat surface can be used.
Further works are planned to investigate the magnitude of the environment-induced error. These works will focus on the possible impact of the type of surface on the accuracy of the SAR Interferometry–derived (InSAR) DEMs. However, it is expected, based on preliminary investigations using optical stereoscopy DEM (AW3D30), that this impact is negligible.
Acknowledgments
K.B. acknowledges that this study was partially funded by the Scientific and Technological Research Council of Turkey (TUBITAK) within grant scheme No. 2221. The open-access publication fee was covered by Airbus Defense and Space.
Author Contributions
K.B. conceived and designed the experiments; W.K. provided the necessary WorldDEM™ test data. K.B. performed the experiments; Ş.H.K. facilitated the administrative conditions to carry out the project at Bülent Ecevit University, Zonguldak, Turkey, and offered helpful suggestions; K.B. and W.K. wrote the paper.
Conflicts of Interest
The authors declare no conflict of interest.
Abbreviations
The following abbreviations are used in this manuscript:
| SRTM | Shuttle Radar Topography Mission |
| GEDTF | Global Elevation Data Testing Facility |
| DEM | Digital Elevation Model |
| AIS | Aeronautical Information Services |
| TanDEM-X | TerraSAR-X add-on for Digital Elevation Measurement |
| RM | The Runway Method |
References
- Becek, K. Investigating error structure of shuttle radar topography mission elevation data product. Geophys. Res. Lett. 2008. [Google Scholar] [CrossRef]
- Becek, K. Assessing global digital elevation models using the runway method: The advanced spaceborne thermal emission and reflection radiometer versus the shuttle radar topography mission case. IEEE Trans. Geosci. Remote Sens. 2014, 52, 4823–4831. [Google Scholar] [CrossRef]
- Hirano, A.; Welch, R.; Lang, H. Mapping from ASTER stereo image data: DEM validation and accuracy assessment. ISPRS J. Photogramm. Remote Sens. 2003, 57, 356–370. [Google Scholar] [CrossRef]
- Berry, P.A.M.; Garlick, J.D.; Smith, R.G. Near-global validation of the SRTM DEM using satellite radar altimetry. Remote Sens. Environ. 2007, 106, 17–27. [Google Scholar] [CrossRef]
- Global Elevation Data Testing Facility. Available online: http://gedtf.org/ (accessed on 23 May 2016).
- Krieger, G.; Moreira, A.; Fiedler, H.; Hajnsek, I.; Werner, M.; Younis, M.; Zink, M. TanDEM-X: A satellite formation for high-resolution SAR interferometry. IEEE Trans. Geosci. Remote Sens. 2007, 45, 3317–3341. [Google Scholar] [CrossRef]
- Kosmann, D.; Wessel, B.; Schwieger, V. Global digital elevation model from TanDEM-X and the Calibration/Validation with worldwide kinematic GPS-Tracks. In Proceedings of the XXIV FIG International Congress 2010, Sydney, Australia, 11–16 April 2010.
- Wessel, B.; Marschalk, U.; Gruber, A.; Huber, M.; Hahmann, T.; Roth, A.; Habermeyer, M. Design of the DEM mosaicking and calibration processor for TanDEM-X. In Proceedings of the 7th European Conference on Synthetic Aperture Radar, Friedrichshafen, Germany, 2–5 June 2008.
- EUROCONTROL. The European Organisation for the Safety of Air Navigation. Available online: https://www.ead.eurocontrol.int/eadcms/eadsite/index.php.html (accessed on 23 May 2016).
- Norton, R.M. The double exponential distribution: Using calculus to find a maximum likelihood estimator. Am. Stat. 1984, 38, 135–136. [Google Scholar]
- Pinel, S.; Bonnet, M.-P.; Da Silva, J.S.; Moreira, D.; Calmant, S.; Satgé, F.; Seyler, F. Correction of interferometric and vegetation biases in the SRTMGL1 spaceborne DEM with hydrological conditioning towards improved hydrodynamics modeling in the Amazon Basin. Remote Sens. 2015, 7, 16108–16130. [Google Scholar] [CrossRef]
- Becek, K. Biomass Representation in Synthetic Aperture Datasets, 1st ed.; LAP LAMBERT Academic Publishing: Saarbrücken, Germany, 2011. [Google Scholar]
- Huber, M.; Wessel, B.; Kosmann, D.; Felbier, A.; Schwieger, V.; Habermeyer, M.; Wendleder, A.; Roth, A. Ensuring globally the TanDEM-X height accuracy: Analysis of the reference data sets ICESat, SRTM and KGPS-tracks. In Proceedings of the 2009 IEEE International Geoscience and Remote Sensing Symposium, Cape Town, South Africa, 12–17 July 2009.
- Rossi, C.; Eineder, M.; Fritz, T.; D’Angelo, P.; Reinartz, P. Quality assessment of TanDEM-X raw DEMs oriented to a fusion with CartoSAT-1 DEMs. In Proceedings of the 33th EARSeL Symposium. Towards Horizon 2020: Earth Observation and Social Perspectives, Matera, Italy, 3–6 June 2013.
- Rizzoli, P.; Bräutigam, B.; Kraus, T.; Martone, M.; Krieger, G. Relative height error analysis of TanDEM-X elevation data. ISPRS J. Photogramm. Remote Sens. 2012, 73, 30–38. [Google Scholar] [CrossRef]
- Wessel, B.; Breunig, M.; Bachmann, M.; Huber, M.; Martone, M.; Lachaise, M.; Fritz, T.; Zink, M. Concept and first example of TanDEM-X High-resolution DEM. In Proceedings of the EUSAR 2016: 11th European Conference on Synthetic Aperture Radar, Hamburg, Germany, 6–9 June 2016.
- Koppe, W.; Henrichs, L.; Hummel, P. Assessment of WorldDEMTM global elevation model using different references. In Proceedings of the 2015 IEEE International Geoscience and Remote Sensing Symposium, Milan, Italy, 26–31 July 2015.
- Caicoya, A.T.; Kugler, F.; Hajnsek, I.; Papathanassiou, K. Boreal forest biomass classification with TanDEM-X. In Proceedings of the 2012 IEEE International Geoscience and Remote Sensing Symposium, Munich, Germany, 22–27 July 2012.
- Kattenborn, T.; Maacka, J.; Faßnacht, F.; Enßle, F.; Ermert, J.; Koch, B. Mapping forest biomass from space-fusion of Hyperspectral EO1-Hyperion data and TanDEM-X and WorldView-2 canopy height models. Int. J. Appl. Earth Obs. Geoinf. 2015, 35, 359–367. [Google Scholar] [CrossRef]
- Solberg, S.; Astrup, R.; Breidenbach, J.; Nilsen, B.; Weydahl, D.J. Monitoring spruce volume and biomass with InSAR data from TanDEM-X. Remote Sens. Environ. 2013, 139, 60–67. [Google Scholar] [CrossRef]
- Rott, H.; Floricioiu, D.; Wuite1, J.; Scheiblauer, S.; Nagler, T.; Kern, M. Mass changes of outlet glaciers along the Nordensjköld Coast, Northern Antarctic Peninsula, based on TanDEM-X satellite measurements. Geophys. Res. Lett. 2008, 41, 8123–8129. [Google Scholar] [CrossRef]
- Albino, F.; Smets, B.; d’Oreye, N.; Kervyn, F. High-resolution TanDEM-X DEM: An accurate method to estimate lava flow volumes at Nyamulagira Volcano (D. R. Congo). J. Geophys. Res. Solid Earth 2015, 120, 4189–4207. [Google Scholar] [CrossRef]
© 2016 by the authors; licensee MDPI, Basel, Switzerland. This article is an open access article distributed under the terms and conditions of the Creative Commons Attribution (CC-BY) license (http://creativecommons.org/licenses/by/4.0/).


